City of London Air Quality Strategy - Delivering healthy air in the City of London - the City of London Corporation
←
→
Page content transcription
If your browser does not render page correctly, please read the page content below
City of London
     Air Quality Strategy

Delivering healthy air in the City of London

           Draft for Consultation
                March 2019
For further information contact:

The Air Quality Team

Dept of Markets and Consumer Protection

City of London Corporation

PO Box 270

Guildhall

London, EC2P 2EJ

Tel: 020 7332 3030

cityair@cityoflondon.gov.uk

www.cityoflondon.gov.uk/air

This report will be available on the City of London web site http://www.cityoflondon.gov.uk/air

                                                                                             1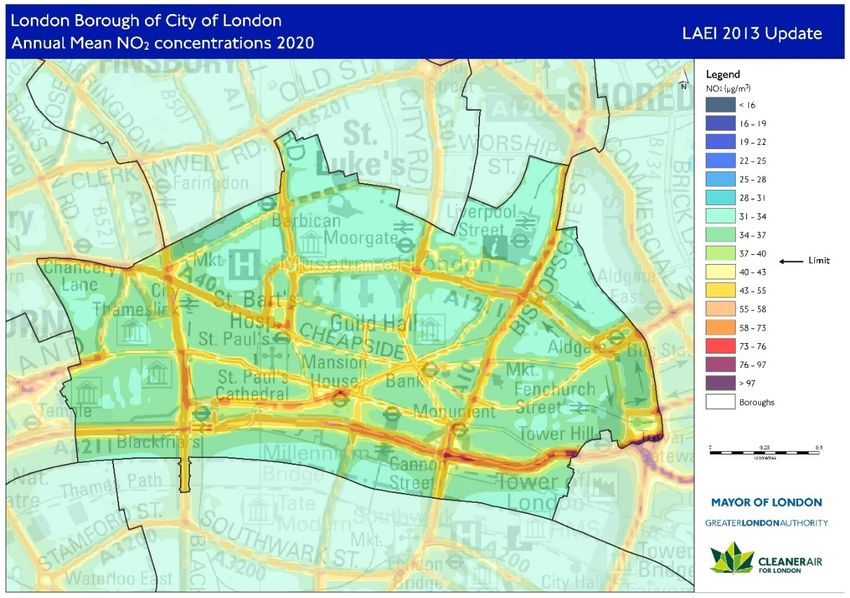
Foreword
Current levels of air pollution in London, particularly central London, have an impact
on all of us. Improving air quality is an important issue for the City of London
Corporation and I have pleasure in presenting this draft Air Quality Strategy for
consultation. This is our third Air Quality Strategy and it contains actions that we will
be taking over the next few years to achieve better air quality in the Square Mile.

Our aim is for over 90% of the Square Mile to meet the health-based limits for
nitrogen dioxide by the beginning of 2025. We will also support the Mayor of London
to meet World Health Organisation Guidelines for particulate matter by 2030.

Our extensive network of air quality monitors show that air quality has been
improving and these improvements are set to continue with the actions proposed in
this strategy. We will also benefit from the Mayor of London’s Ultra-Low Emission
Zone from April 2019, together with a wider package of measures being
implemented by the Greater London Authority.

Since the publication of the last Air Quality Strategy, improving air quality has been
firmly embedded into our Corporate Plan, new Transport Strategy, Responsible
Business Strategy and draft City Plan.

The draft strategy outlines how we will improve the way we provide information to the
public and make sure that robust air quality data is made available. It also details
how we will work with a range of partners to deliver better air quality. We will
continue to lead by example and have been moving our own fleet over to electric
where possible. We will pilot new technology and require low and zero emission
vehicles through our contracts. We will work with our partners to create improved
powers for London local authorities to reduce the impact of boilers, generators and
combined heat and power plant on local air quality.

Following the success of our award-winning achievements at Sir John Cass’s
Foundation Primary School we propose to develop specific action plans for City
schools. We will build on our close relationships with City businesses through our
CityAir engagement programme to encourage cleaner vehicles on our streets.

I hope you will take part in this consultation and help us to develop an Air Quality
Strategy that reflects the needs and aspirations
of everyone who lives, works in or visits the City
of London.

Jeremy Simons CC
Chair, Port Health and Environmental
Services Committee

                                                                                            2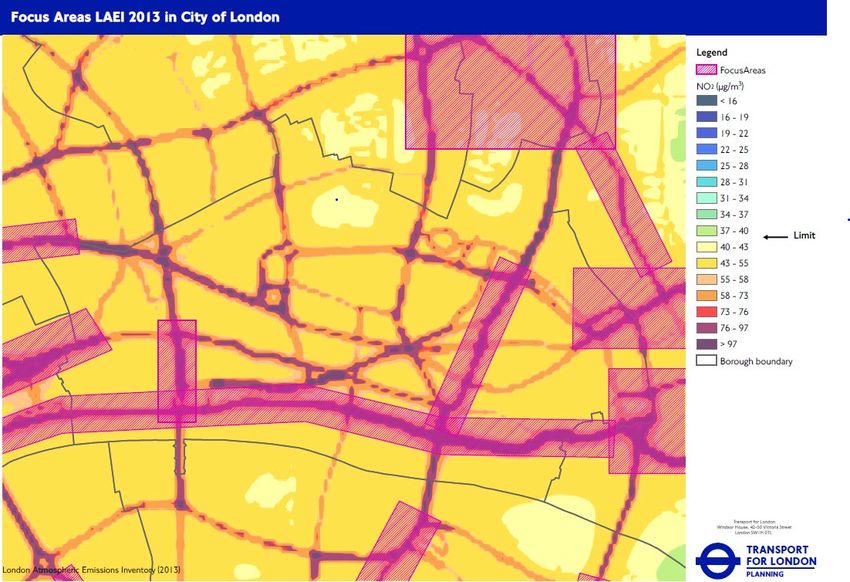
Air Quality Strategy 2019 – 24: Delivering healthy air in the City of London
Our definition of healthy air:
Concentrations of nitrogen dioxide (NO2), small and fine particles (PM10 and PM2.5) that meet health-based Limit Values and World Health Organisation
(WHO) Guidelines.
Why us:
The City of London Corporation has a statutory obligation to take a wide range of action to improve air quality and protect public health. Improving air quality
and ensuring good health and wellbeing is a key organisational priority outlined in our Corporate Plan (CP) for 2018-23, through which we aim to contribute to a
flourishing society, support a thriving economy and shape outstanding environments.
Who we will work with:
Residents, workers, schools, businesses, Barts Health NHS, Greater London Authority, Transport for London, London Councils, London Boroughs,
Government, Environment Agency, London’s Universities, Third Sector, Port of London Authority, Cross River Partnership
                                                                          Our Vision

                              The Square Mile has air that is healthy The Square Mile has air that is healthy to breathe.
                                                                             Our Aim
For nitrogen dioxide to meet health-based Limit Values and WHO GuidelinFor nitrogen dioxide to meet health-based Limit Values and WHO Guidelines in
                                                    meet WHO Guidelines for PM10 and PM2.5 by 2030
over 90% of the Square Mile by 2025 and support the Mayor of London to meet WHO    Guidelines for PM10 and PM2.5 by 2030
                                                                  Our Outcomes

            The Square Mile has clean air             People enjoy good health through reduced exposure       We are a leader for air quality policy and action
                                                                      to poor air quality                       and inspire collaboration across London

              Links to CP Outcome 11                                Links to CP Outcome 2                                   Links to CP Outcome 11
                                                                          Our Activities
 •     Reduce emissions of air pollutants from our   •   Provide robust and reliable information and data     •   Develop a Private Members Bill to improve
       fleet, buildings and through our contracts    •   Make use of public health networks to                    air quality
 •     Ensure new developments, transport and            disseminate information                              •   Work closely with a wide range of
       public realm schemes and proposals have       •   Develop tailored action plans for City of London         stakeholders on air quality policy
       a positive impact on local air quality            schools                                              •   Facilitate collaboration across London’s air
 •     Pilot innovative measures                     •   Further develop the free smartphone App CityAir          quality community
                                                                    Demonstrating success
     A measure of success for the strategy will be consistent compliance with health-based air quality limits and guidelines measured using a network of robust
     air quality monitoring equipment. Over the next five years, we will also continue to be recognised as a leading and highly regarded authority in the field of
     air quality.
Contents

1. Introduction .......................................................................................................... 2
   1.1      Source of air pollution in the City of London.................................................. 5
   1.2      Health impacts of air pollution ....................................................................... 5
2. Air Quality Monitoring .......................................................................................... 7
   2.1      Nitrogen dioxide ............................................................................................ 8
   2.2      Small particles (PM10) ................................................................................. 14
   2.3      Fine particles (PM2.5)................................................................................... 16
3. Leading by Example .......................................................................................... 19
4. Collaborating with Others .................................................................................. 23
5. Reducing Emissions from Road Transport ........................................................ 28
6. Reducing Emissions from Non-Transport Sources ............................................ 38
7. Public Health and Raising Awareness ............................................................... 44

Appendix 1: Further details on the delivery of actions .............................................. 49
Appendix 2: Legal Position ....................................................................................... 66
Appendix: 3 Sources of Air Pollution ........................................................................ 68
Appendix 4: Health Effects of Air Pollution ............................................................... 72
Appendix: 5 Further analysis of monitoring data ...................................................... 73
Appendix 6: Mayor of London Policies ..................................................................... 74
Appendix 7: Air Quality Policies in the Draft City Plan .............................................. 78

Glossary ................................................................................................................... 80
References ............................................................................................................... 82
1. Introduction

The City of London, also known as the Square Mile, is the historic heart of London.
It is home to approximately 7,500 permanent residents and 24,000 businesses.
There is a working population of over 510,000 people. This is projected to increase
to 640,000 by 2036. In addition to workers and residents, each year the City of
London welcomes over 10 million tourists, along-side people who visit for business.
The City of London Corporation (City Corporation) is the governing body of the
Square Mile. It manages a wide range of functions including 11,000 acres of open
space which provide green lungs for the Capital.

Like much of central London, the City of London can experience high levels of air
pollution. The pollutants of current concern are nitrogen dioxide (NO2), a colourless
and odourless gas that is a product of fuel combustion, and small particles, of which
there are a wide range of sources, including combustion. These particles are
referred to as PM10 (small particles) and PM2.5 (fine particles). These are particles
below 10 and 2.5 micrometres in diameter respectively.

The City Corporation is required by statute to measure air pollution and develop and
implement an improvement plan if health-based air quality limits are not met.
Following detailed air quality monitoring, the whole of the Square Mile was declared
an Air Quality Management Area (AQMA) in January 2001 for nitrogen dioxide and
small particles (PM10). This was due to levels of these pollutants being higher than
the required limits. These limits were set in European Directives and transposed into
domestic legislation.

The framework for air quality policy and action by London local authorities is called
London Local Air Quality Management (LLAQM). It is overseen by the Mayor of
London who provides templates and tools to assist with action planning and
monitoring.

The City Corporation has had an air quality action plan in place since 2002. In 2011,
the action plan was incorporated into an Air Quality Strategy outlining steps that
would be taken to both improve local air quality and reduce the impact of air pollution
on public health. The strategy was updated in 2015, detailing further measures that
would be taken through to 2020 1. This strategy builds upon previous action and
details measures that will be taken to 2024. A complete table of actions, with
expected outcome, is reported in Appendix 1. The current legal framework for
improving air quality is in Appendix 2.

Despite the implementation of a wide range of action by the City Corporation to
improve air quality, the health-based limits for nitrogen dioxide are still not met
everywhere in the Square Mile. Extensive monitoring, however, demonstrates that

1
    City of London Air Quality Strategy 2015 – 2020

                                                                                        2
levels of nitrogen dioxide are reducing year on year, particularly away from busy
roads.

The limits set in European Directives for small particles (PM10 and PM2.5) are
generally met everywhere in the City of London. The only exception is adjacent to
the busiest roadsides in unfavourable weather conditions. The World Health
Organisation (WHO) has set its own Guidelines 2 for concentrations of PM10 and
PM2.5. These are tighter than the limits set in European Directives. Fine particulate
pollution has health impacts even at very low concentrations. No threshold has been
identified below which no damage to health is observed. Therefore, the WHO
Guidelines aim to achieve the lowest concentrations of particulate matter possible.
Reducing levels of air pollution to meet the tighter WHO Guidelines will therefore
continue to improve health outcomes.

The aims of this Strategy are to ensure that:

       •   the City Corporation fulfils its statutory obligations for London Local Air
           Quality Management and improving public health
       •   air quality in over 90% of the Square Mile meets the health-based Limit
           Values and World Health Organisation Guidelines for nitrogen dioxide
           by the beginning of 2025
       •   the City Corporation supports the Mayor of London to meet World
           Health Organisation Guidelines for particulate matter (PM10 and PM2.5) by
           2030

These aims will deliver three main outcomes:

       •   the Square Mile has clean air
       •   people enjoy good health through reduced exposure to poor air quality
       •   the City Corporation is a leader for air quality policy and action and inspires
           collaboration across London

The outcomes will be met by a range of action across six areas:

2
    Air Quality Guidelines - Global Update 2005 Particulate matter, ozone, nitrogen dioxide and sulfur dioxide

                                                                                                                 3
Public Health
                       and Raising            Air Quality
                        Awareness             Monitoring

             Reducing
                non                                     Leading by
             Transport                                   Example
             Emissions

                         Reducing
                         Emissions          Collaborating
                           from              with Others
                         Transport

City Corporation Corporate Plan 2018 – 23

This draft strategy supports the delivery of the City Corporation Corporate Plan 2018
-2023. The Corporate Plan sets out the over-arching strategic direction for the
organisation. It has been shaped around three areas of public value - economy,
environment and society. This Air Quality Strategy supports two Corporate Plan
outcomes:

   •   Outcome 2: People enjoy good health and wellbeing
   •   Outcome 11: We have clean air, land and water and a thriving and
       sustainable natural environment

Other Corporate strategies that support the aims of this draft Air Quality Strategy are:

   •   Health and Wellbeing Strategy and Joint Strategic Needs Assessment
   •   Responsible Business Strategy
   •   Transport Strategy (draft)
   •   Local Plan and City Plan (draft)
   •   City Tree Strategy
   •   Open Spaces Strategy
   •   Procurement Strategy (in development)
   •   Climate Action Strategy (in development)

                                                                                      4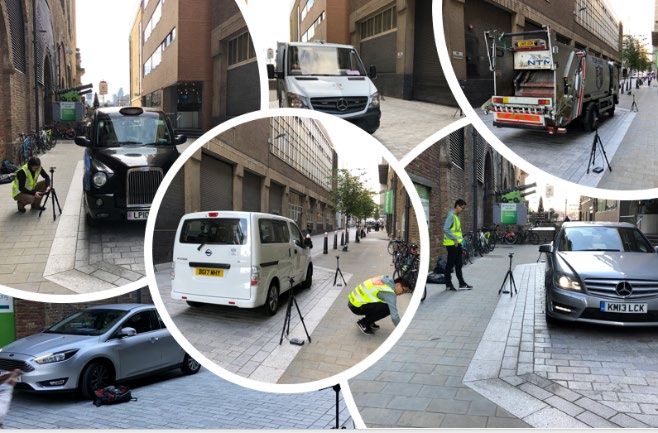
1.1 Source of air pollution in the City of London

The quality of the air in the City of London is influenced by a range of factors. Being
at the heart of London, it is heavily influenced by emissions generated across
Greater London and further afield. Over 75% of PM10 and PM2.5 particle pollution
measured in the City of London originates from outside the City of London boundary.
This is because particles can travel very long distances. This highlights the
importance of London-wide and national action to support the local action being
taken by the City Corporation. Under certain weather conditions small particles can
be brought to London from the European continent, and even from as far as Africa.

Latest estimates of the amount of nitrogen dioxide in the City that originates from
outside the Square Mile is about 40%. This estimate was made so time ago, so the
final version of this strategy will include an updated figure based on current levels of
pollution. For sources of pollution generated within the Square Mile itself, the main
contributors are stationary and mobile combustion, largely associated with buildings
and road traffic.

The Greater London Authority produces an Atmospheric Emissions Inventory for
London. It is known as the LAEI. It is a large database of emission sources that
contribute to air pollution in the capital. Information on the sources of emissions of
oxides of nitrogen (NOx) and fine particles are detailed in Appendix 3. The latest
version, issued in 2016, is referred to as the LAEI 2013. It contains emissions across
London with 2013 presented as a baseline. The database forecasts that in 2020,
NOx emissions from buildings in the City of London will be over twice that from road
transport. This is a significant change from the emissions estimated for 2013, where
traffic pollution was the dominant source. This change is due to the wide range of
action being taken to reduce emissions from vehicles. Whilst the absolute values
should be treated with caution, it demonstrates that action increasingly needs to
focus on emissions from non-road sources of pollution as well as road transport.

Diesel vehicles, particularly taxis, buses, vans and lorries, are the dominant source
of emissions from road transport in the City of London. Many of these vehicles are
servicing business needs. Pollution from demolition and construction sites also
impact on local air quality. Further detail can be found in Appendix 3.

       1.2    Health impacts of air pollution

Exposure to air pollution has a range of impacts on health. Short term exposure
mainly affects people who are already classed as ‘vulnerable’, which means they
have an existing condition which is aggravated by high levels of air pollution. Air
pollution can exacerbate asthma and affect lung and heart function. There is

                                                                                           5
evidence that both PM2.5 and PM10 cause additional hospital admissions on high
pollution days for those suffering from respiratory or cardiovascular disease.

Long-term exposure to high levels of pollution affects the whole population, not just
the vulnerable. This is particularly the case for long-term exposure to fine particles,
PM10 and PM2.5. 3 Nitrogen dioxide has also been associated with adverse effects on
hospital admissions, a decrease in lung function and growth, increase in respiratory
disease, and incidences of asthma and cancer. Further information, including the
estimated impact on life expectancy, is outlined in Appendix 4.

3
    Fine Particulate Matter (PM2.5) in the United Kingdom 2012 Air Quality Expert Group for Defra

                                                                                                    6
2. Air Quality Monitoring
Commitment: The City Corporation will monitor air pollutants to assess
compliance with Air Quality Limit Values and World Health Organisation
Guidelines. Data will also be used to support research, evaluate the
effectiveness of policies to improve air quality and to provide alerts when
pollution levels are high.
The City Corporation has been monitoring air quality for many years at a range of
locations across the Square Mile. Monitoring is a vital component of air quality
management and fulfils the following functions:
• to check compliance against air quality objectives, Guidelines and Limit
Values, and consequently the impact on health
• to assess long term trends and the effectiveness of policies and interventions
to improve air quality
• to raise awareness and provide alerts to the public when air pollution levels
are high
The focus of monitoring in the City of London is to obtain reliable and accurate data
for nitrogen dioxide, PM10 and PM2.5 as these are the pollutants of concern. Data
collected shows that levels of air pollution across the City of London, particularly
levels of nitrogen dioxide, are decreasing. Given the substantial interest in air
pollution, and the importance placed on it by the City Corporation, the amount of
monitoring has increased significantly in recent years.
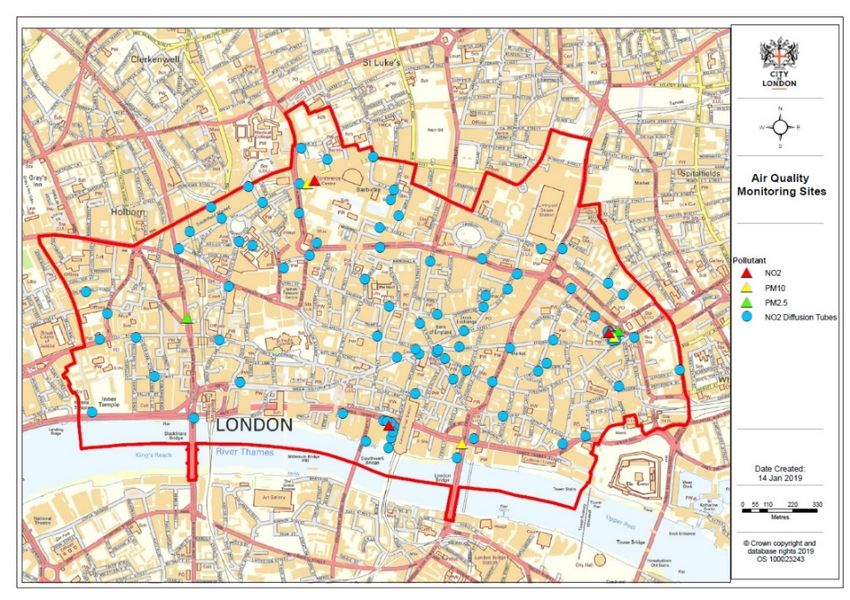
The air quality monitoring requirements in the City of London are under constant
review. Figure 2.1 shows locations where air quality was monitored during 2018.
The triangles represent the continuous monitoring sites and the circles are where
diffusion tube monitoring was carried out. In addition, to the locations shown on the
map, diffusion tube monitoring was carried out by the Cheapside Businesses
Alliance in the Cheapside area.
7Figure 2.1: Continuous and diffusion tube monitoring sites in 2018
.
2.1 Nitrogen dioxide
Measuring nitrogen dioxide
Continuous monitoring
Air quality monitoring is undertaken using different types of equipment depending on
the purpose. One method of measuring nitrogen dioxide is with a continuous
analyser. They are called continuous analysers as they take a measurement every
minute and provide 15-minute average data. These are the most accurate
instruments available and provide hourly average readings. The instruments are
calibrated regularly and audited twice a year. They are measuring nitrogen dioxide in
Beech Street, Upper Thames Street and at Sir John Cass’s Foundation Primary
School. The data is subject to very detailed checks by Kings College London and
made available to the public on the web site www.londonair.org.uk.
Figure 2.2 details the data collected at these three sites from 2007 to 2017. At the
time of writing this draft Strategy ratified nitrogen dioxide data for 2018 is not
available. It will be included in the final version of the Strategy. The high
concentrations seen at Upper Thames Street and Beech Street are associated with
the monitoring taking place at busy roadsides. Upper Thames Street is a 3-lane
8narrow road with tall buildings either side and Beech Street is a covered road. At Sir
John Cass’s Foundation Primary School, nitrogen dioxide is measured in the rear
playground and the site is relatively open, so concentrations are lower. This site is
classed as an ‘urban background’ site. The reduction in concentrations at all sites in
2011 was due to the weather conditions that year. The reduction in concentrations at
Upper Thames Street from 2015 followed the installation of the cycle super highway
when the lanes of traffic reduced from 4 to 3.
Figure 2.2 Annual Average NO2, 2007 to 2017
Annual Average NO2 concentrations at
continuous monitoring sites
140
120
NO2 concentration (µgm-3)
100
80
60
40
John Cass School Beech Street
20
Upper Thames Street EU Limit Value
0
2007 2008 2009 2010 2011 2012 2013 2014 2015 2016 2017
Data collected at Sir John Cass’s Foundation Primary School reveals that
background concentrations of nitrogen dioxide have been reducing year on year. For
the first time in 2017 concentrations were below the annual average EU Limit Value
of 40µg/m3. Figure 2.3 shows the monthly average data for Sir John Cass’s
Foundation Primary from 2003 to 2018 and revels a continuous improvement over
this period.
9Figure 2.3: Monthly Average NO2, Sir John Cass’s Foundation Primary School, 2003 - 2018
Concentrations of nitrogen dioxide at roadside are also reducing, although they
remain high. Figures 2.4 shows the monthly average nitrogen dioxide in Upper
Thames Street from 2007 to 2018.
The ongoing high levels of nitrogen dioxide at roadside are due to a range of factors,
most significantly the failure of vehicle Euro Standards to meet the required
reduction in emissions of oxides of nitrogen (NOx) in diesel vehicles. There has also
been an increase in the use of use of diesel in the fleet, partly due to national policy
to encourage lower carbon fuels.
Further charts showing the variation of pollution over different days of the week and
months of the year are presented in Appendix 5.
Figure 2.4: Monthly Average NO2 in Upper Thames Street, 2007- 2018.
10The profile of air quality and interest in data has increased in recent years. As a
result, there are many air quality sensors on the market that vary in terms of
accuracy and reliability. Good quality data is essential to support air quality
management and for people to be able to make sound choices if they want to avoid
high levels of air pollution. The City Corporation will therefore support trials of new
sensors to establish their accuracy.
Non-continuous monitoring
Data collected from continuous analysers is supplemented by data collected using
diffusion tubes. Diffusion tubes are low cost, low maintenance sensors that are less
accurate that continuous analysers. Their use is limited as they provide data
averaged over a month. The data is very useful however for comparing levels to the
annual mean Limit Value, revealing long term trends, and detecting hot spots. Due to
the increased interest and concern about air pollution, diffusion tubes are currently in
place at approximately 100 locations across the Square Mile to monitor both long
term trends and the impact of interventions.
Figure 2.5 details concentrations of nitrogen dioxide measured over 10 years at five
sites using diffusion tubes. A similar pattern to that in Figure 2.2 is observed with
roadside sites having the highest concentrations with the overall trend being
downwards. A significant increase in concentrations was measured at St.
Bartholomew’s Hospital in 2016 due to an energy centre being introduced down wind
of the equipment.
Figure 2.5: Annual Average NO2 Measured with Diffusion Tubes, 2007 to 2017
Annual Average NO2 concentrations at
long term diffusion tube sites
120
100
NO2 concentration (µgm-3)
80
60
40
20
St. Bartholomew's Queen Victoria Street Fleet Street
0 Barbican Mansell Street EU Limit Value
2007 2008 2009 2010 2011 2012 2013 2014 2015 2016 2017
Hourly average concentrations of nitrogen dioxide
In addition to an annual average limit for nitrogen dioxide, there is also an hourly
average that should not be breached. This hourly limit is 200 µg/m3. Eighteen
11breaches of this limit are acceptable in a year to allow for unusual weather
conditions. This can only be evaluated using continuous analysers although it is
assumed that if the annual average nitrogen dioxide is above 60µg/m3 the hourly
average may be breached. This 18-hour limit is breached every year at Upper
Thames Street and Beech Street. It is also likely to be breached in Fleet Street given
the very high annual average concentration. The number of hours above 200 µg/m3
has dropped significantly since 2015 at the Upper Thames Street monitoring site,
see Figure 2.6.
Figure 2.6: Breaches of the hourly average NO2, 2007 to 2017
Number of hours above the hourly mean NO2 objective level
1000
(200 µg/m3 not to be exceeded more than 18 times a year)
800
Number of hours
600
400
200
0 0 2 3 0 0 0 0 0 0 0
0
2007 2008 2009 2010 2011 2012 2013 2014 2015 2016 2017
John Cass School Beech Street Upper Thames Street
Note: the number of hours above 200µg/m3 at Sir John Cass’s Foundation Primary School are shown
numerically.
Computer modelling
Air quality monitoring provides data for specific locations. This data is supplemented
by computer modelling. Modelling is also used to predict future concentrations of air
pollution. Computer model maps, particularly forecast maps, should not be viewed
as an accurate representation of concentrations. Instead they are used as a tool to
establish where air pollution may be a problem or may continue to be a problem in
the future.
Figure 2.7 shows computer modelled concentrations of annual average nitrogen
dioxide for 2020 using data from the 2013 London Atmospheric Emissions Inventory.
The computer model predicts that the Limit Value for annual average nitrogen
dioxide, 40µg/m3, will continue to be breached along all main roads. Monitoring data
supports this assumption. An updated LAEI should be published during 2019 and if
available, the data will be included in the final version of this Strategy.
12Figure 2.7: Modelled concentrations of annual average nitrogen dioxide forecast for 2020
132.2 Small particles (PM10)
Small particles (PM10) are measured using continuous analysers in Upper Thames
Street, Beech Street and at Sir John Cass’s Foundation Primary School. The data is
available on the web site londonair.org.uk
Annual average concentrations of PM10 meet the Limit Value of 40 µg/m3 at all
monitoring sites. Since 2007, the Limit Value has only been breached once in Upper
Thames Street. This is thought to be associated with the construction of the cycle
superhighway. Although the Limit Value is met, the World Health Organisation
Guideline for PM10 level of 20 µg/m3 as an annual average is breached at all sites.
Figure 2.8: Annual Average PM10, 2007 to 2017
Annual Average PM10 concentrations at
continuous monitoring sites
45
40
35
NO2 concentration (µgm-3)
30
25
20
15
10 John Cass School Beech Street Upper Thames Street
5 EU Limit Value WHO Guideline
0
2007 2008 2009 2010 2011 2012 2013 2014 2015 2016 2017
The Limit Value for daily average PM10 is 50µg/m3. PM10 is made up of a range of
materials including metals, carbon, minerals, sulphates and nitrates. Concentrations
are highly influenced by the weather and sources outside the Square Mile. Little can
be done locally and in isolation that will have a measurable impact on this pollutant.
The regulations allow the daily Limit Value to be breached up to 35 days in any given
year. This tends to happen in Upper Thames Street. Beech Street has met the daily
Limit Value since 2013. Daily average PM10 at Sir John Cass’s Foundation primary
has never breached the Limit Value.
14Figure 2.9: Breaches of the Daily Average PM10, 2007 to 2017
PM10 daily mean concentrations above 50µg/m3 at
continuous monitoring sites
80
70
60
Number of days
50
40
30
20
10
0
2007 2008 2009 2010 2011 2012 2013 2014 2015 2016 2017
John Cass School Beech Street Upper Thames Street EU Limit Value
There is less variation in modelled annual mean concentrations of small particles as
there are a greater range of sources that contribute to the problem, not just road
traffic.
Figure 2.10 shows the modelled concentrations of annual average PM10 for 2020.
The limit is set at 40 µg/m3. The map suggests that this could be breached in just a
small area along Byward Street and Tower Hill.
Figure 2.10: Modelled concentrations of annual average PM10, forecast for 2020
15Figure 2.11 shows the number of days the daily average PM10 level is likely to be
breached in 2020. The map suggests this may occur adjacent to the busiest roads.
Figure 2.11: Number of days above the daily average PM10, forecast for 2020
2.3 Fine particles (PM2.5)
PM2.5 is measured in Farringdon Street and at Sir John Cass’s Foundation Primary
School. Figure 2.12 shows the annual average PM2.5 concentrations since 2016.
The results indicate that PM2.5 meets the Limit Value of 25 µg/m3 at these two
locations. However, concentrations are above the WHO Guideline, which is set at 10
µg/m3.
16Figure 2.12: Annual Average PM2.5, 2016 to 2018
Note: Data for 2018 is unratified
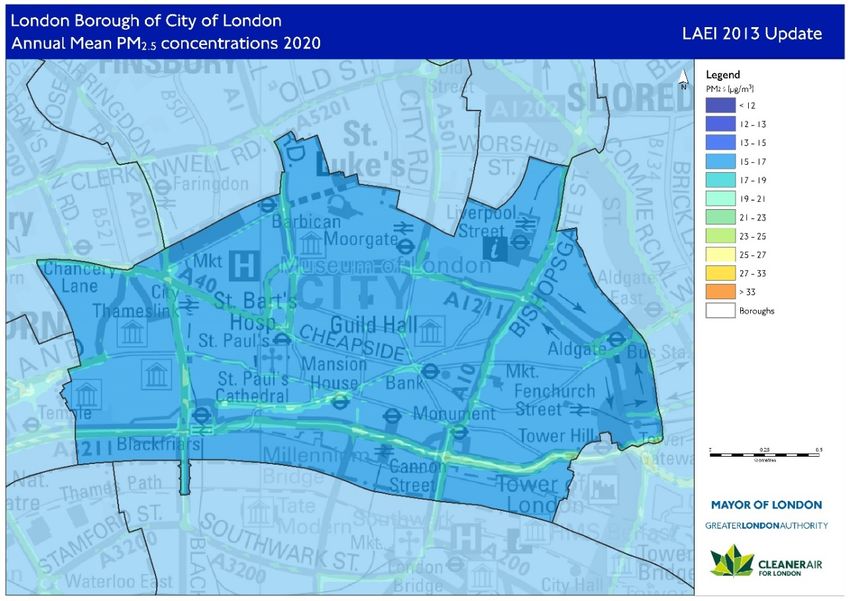
Modelled concentrations of annual average PM2.5 reveal that levels at all locations
across the City of London in 2020 will be below the annual average Limit Value of
25µg/m3. The whole of the City of London is likely to breach the WHO Guideline of
10µg/m3. There is very little that can be done by the City Corporation in isolation that
will have a significant impact on concentrations of this pollutant.
Figure 2.13 Modelled concentrations of annual average PM2.5, forecast for 2020
17One of the aims of this strategy is to ensure that air quality in over 90% of the
Square Mile meets the health-based Limit Values and World Health Organisation
Guidelines for nitrogen dioxide by the start of 2025. The remaining areas are likely to
be at very busy road junctions and in some heavily trafficked streets with narrow
carriage ways and tall buildings that act to trap air pollutants. An assessment of air
quality policies and interventions will be undertaken annually to ensure that this will
be met.
An additional strategy aim is to take coordinated action to achieve the WHO
Guidelines for PM10 and PM2.5 in the shortest possible time. This recognises that the
City Corporation cannot achieve this in isolation. Once the 2019 LAEI has been
published, an assessment will be undertaken to determine when this is likely to be.
Air Quality Monitoring
We will:
Ensure that adequate and appropriate monitoring is undertaken across the
City of London to fulfil statutory obligations and make good quality data
available to the public.
Use air quality data to generate pollution alerts and messages using a range of
media such as the free CityAir Smart Phone App.
Publish an annual report of air quality data on the City Corporation web site.
Continue to make live data from continuous air quality monitors available to
the public on the London Air Quality Network web site.
Support the testing of new air quality sensors to establish their degree of
accuracy.
Undertake an annual assessment of air quality to ensure levels of nitrogen
dioxide in 90% of the Square Mile meet health-based Limit Values and WHO
Guidelines by 2025.
183. Leading by Example
Commitment: The City Corporation will seek opportunities to influence air
quality policy across London and lead by example to improve local air quality
and reduce exposure to air pollution
Improving air quality is a political priority for the City Corporation, for which there is
very strong Member interest and support. The Port Heath and Environmental
Services Committee oversees the development and implementation of air quality
policy, and the Chairman and Deputy Chairman have a keen interest in the issue.
Public Health responsibilities were returned to local authorities in April 2013. This led
to the creation of Health and Wellbeing Boards (HWB). The City Corporation HWB
supports measures for improving local air quality. The City’s Joint Strategic Needs
Assessment recognises the significance of air quality. Air quality has been identified
by the City Corporation as a Corporate Risk. Management of this risk is overseen by
the Audit and Risk Management Committee. Reports are presented to this
Committee detailing how the risk is being mitigated.
City Corporation Responsible Business Strategy
The City Corporation’s Responsible Business Strategy 2018 is set within the
framework of the Corporate Plan. It details how responsible business practices will
be put in place across the organisation. One of the main policy areas in the plan is to
improve air quality. Box 1 details the specific air quality actions. Many of these
actions are referenced elsewhere in this document.
• Improve local air quality in the Square Mile and reduce exposure to air pollution by
continuing to develop and deliver the City of London Air Quality Strategy.
• Significantly increase the number of clean vehicles in our fleet and continue to trial
new technology.
• Encourage and facilitate the uptake of clean alternative vehicles throughout our supply
chain.
• Increase the number of electric-vehicle charging points across our sites.
• Reduce emissions of air pollutants from our building stock.
• Provide leadership for air quality policy and action across London.
• Encourage businesses to become air quality champions and support our work for
cleaner air.
• Support research and development into measures to improve air quality with London
Universities.
• Act as a facilitator for collaborative action on air pollution in London.
Box 1
19City Corporation Fleet
The City Corporation has been reducing emissions from its own fleet for several
years. This has been achieved by improved management, a reduction in size of the
fleet and the purchase of newer, cleaner vehicles. Since January 2016, a policy has
been in place that diesel vehicles cannot be purchased or leased if there are low or
zero emission options available. The City Corporation owns or leases 133 vehicles
and is in the process of reducing this to 118. These comprise of cars, vans, minibus,
tippers, sweepers, pick-up trucks, gully tankers and a range of vehicles associated
with open spaces. Most of these vehicles do not operate in the Square Mile.
The City Corporation regularly trials new electric vehicle technology such as an all-
electric refuse collection vehicle. Eight new electric vehicles were trialled in 2018.
The City Corporation is working towards replacing its vehicles used in the Square
Mile with electric or hybrid to comply with the Mayor of London’s ultra-low emission
zone. A fuel hierarchy is in place for new vehicles:
a) Full electric
b) Plug-in hybrid
c) Petrol hybrid (regenerative braking)
d) Petrol
e) (Euro 6/ VI) Diesel
100% of the electricity used by the City Corporation is from renewable sources so
electricity used to charge Corporate vehicles isn’t contributing to air pollution outside
the City of London boundary.
City Corporation Responsible Procurement Strategy
The City Corporation Responsible Procurement Strategy requires that, for large
contracts over £250k, at least 10% of the qualitative contract evaluation criteria must
address responsible procurement. Large contracts include a ‘no vehicle engine
idling’ policy. Contracts that require the use of vehicles are required to put additional
measures in place to help reduce air pollution.
There is a flexible approach with the following menu of options:
a) Targets for the reduction of NOx and PM10 over the life of the contract
b) Develop a plan for reducing the air quality impact on days of ‘high’ and ‘very high’ air
pollution
c) Develop a logistics approach that avoids deliveries during peak congestion and
pedestrian footfall times
d) Regular green driver training
e) Retrofit and trial a new technology
f) Trial a zero-emission vehicle with the support of the City of London Corporation
20g) Another innovative action to support the Air Quality Strategy that would reasonably
deem to be an equivalent level of ambition
In April 2019, the City Corporation will start a new waste collection, street cleansing
and ancillary services contract. This new contract will deliver the first low and zero
emission fleet in the UK which also consists of the UK’s first fully electric fleet of
dustcarts.
City Bridge Trust
The City Bridge Trust is the funding arm of Bridge House Estates. It was established
to make use of funds surplus to bridge requirements and provides grants towards
charitable activity benefitting Greater London. The City of London Corporation is the
sole trustee of the Bridge House Estates.
The City Bridge Trust has awarded a grant to Client Earth, a non-profit
environmental law organisation, to engage with businesses to tackle the effects of air
pollution & encourage a behavioural change towards greener ways of doing
business. The Trust also funds a programme of Eco-Audits for voluntary sector
organisations. This reviews their energy use, waste and travel patterns, with the aim
of making them more sustainable, lower their carbon footprint, and save money by
reducing energy bills.
Proposal for New Regulatory Powers
Whilst there is a great deal of action underway to reduce emissions from road traffic
there is a lack of effective controls to deal with emissions from combustion plant
(boilers, generators, non-road mobile machinery and combined heat and power
plant). Close monitoring has revealed significant local impact on levels of air pollution
from some combustion plant. The City Corporation has identified a need for a
practical, local authority focused piece of legislation to deal with emissions from
combustion plant and is working with London Councils to develop a Private Members
Bill to tackle this source of pollution.
21Leading by Example
We will:
Continue to place air quality as an important political priority and support the
outcomes of the City Corporate Plan and local and London-wide action
Provide information on reducing emissions from buildings for City
Corporation facilities managers and investment property managers
Reduce emissions of air pollutants from buildings owned by the City
Corporation
Review the provision of electric vehicle charging across City Corporation sites
including residential estates
Ensure that, subject to operational requirements, 100% of vehicles owned or
leased by the City Corporation are electric or hybrid by 2025
Continue to trial low and zero emission technology
Continue to encourage zero emission vehicles through the supply chain
Require electric or hybrid vehicles as a default for the Corporate taxi contract,
together with annual emission reduction targets
Require zero emission and electric or hybrid vehicles as a default for courier
contracts, together with annual emission reduction targets
Continue to ensure that all relevant Corporate strategies and policies reflect
the importance of improving local air quality and reducing exposure
Work with London Councils and other stakeholders to develop proposals for
legislation to help improve air quality across London
224. Collaborating with Others
Commitment: The City Corporation will work with a wide range of external
organisations on air quality policy and action in order to improve air quality in
the Square Mile and across London.
As a significant amount of air pollution in the Square Mile is not generated within its
boundary, the City Corporation works with a wide range of organisations on actions
to improve air quality and raise awareness. This collaborative work is an essential
component of air quality management in the City of London.
Mayor of London
The Mayor of London has a duty to develop an Air Quality Strategy in support of the
National Air Quality Strategy and to achieve legal limits for air quality across London.
The City Corporation, along with other London Boroughs, must have regard to the
Mayors Air Quality Strategy when exercising its own responsibilities for London Local
Air Quality Management (LLAQM) 4. The key requirements of LLLAQM are:
• Monitor and assess air pollution
• Ensure an Air Quality Management Area is in place for any areas that exceed
the air quality objectives and Limit Values
• Ensure that a current and relevant Action Plan is in place. This should be
updated at least every five years
• Publish annual monitoring and action plan update reports
Low Emission Neighbourhood
The City Corporation works very closely with the
Greater London Authority and Transport for London.
The Mayor of London awarded the City Corporation
£1 million over 3 years, from 2016 - 2019 to pilot a
range of measures as part of a Low Emission
Neighbourhood programme. A range of activities
and projects took place over three years, ending in
March 2019. These are detailed overleaf.
4
https://www.london.gov.uk/what-we-do/environment/pollution-and-air-quality/working-london-boroughs
23• The installation of 30 electric vehicle charging points
in Barbican Estate car parks.
• Cargo bike delivery service pilot
• Provision of cargo bikes for use by City Corporation
Gardeners
• Engagement with schools, businesses and residents
• Development of business best practice
• Delivery and service case studies
• Best practice document for construction activity
• Idling engine training with St Barts Ambulance
Services
• Greening projects such as Moor Lane and support for
the Clean and Green for Seventeen City in Bloom
competition
• Air quality grants for businesses
• Air quality monitoring
• Barbican art installation
Funding has also been received from the Mayors Air Quality Fund for a range of
projects. This includes rolling out the City Corporation’s successful anti vehicle
engine idling programme and for research into the impact of using diesel generators
for electricity generation at times of peak demand.
The Mayor of London is delivering a wide range of policies across London to improve
air quality. Air quality in the City of London will benefit from all policies but those
anticipated to have the greatest impact are cleaning the London bus fleet, cleaning
London taxis and the implementation of the ultra-low emission zone (ULEZ). The
City of London will be completely within the ULEZ from April 2019. Further details on
policies and programmes being implemented by the Mayor of London are in
Appendix 6.
London Boroughs and London Councils
The City Corporation works closely with London Boroughs and London Councils.
The City Corporation and seven neighbouring authorities form the Central London
Air Quality Cluster Group. This group meets regularly at the City Corporation offices
to discuss best practice. The City Corporation also provides the chairman for the
London Air Quality Steering group which also meets regularly at the City Corporation
offices. This group was established to direct and influence strategic air quality policy
across London. Members include London Boroughs, the Environment Agency,
Greater London Authority, Transport for London and London Councils.
24London Universities
The City Corporation has worked very
closely with Kings College London (KCL)
for many years. The City Corporation
commissions KCL to independently check
air quality data and make it available to
the public on the KCL web site
www.londonair.org.uk. The City
Corporation has also commissioned KCL
to deliver a range of projects including:
• the development of the free smartphone App CityAir;
• undertake real world vehicle emission testing on streets in the City of London;
• assess the impact of washing Beech Street on levels of particle pollution
• independent tests to assess the effectiveness of dealing with idling vehicle
engines.
In 2018, City Corporation drivers took part in a study called DEMiST – The Driver
Diesel Exposure Mitigation Study. The aim of the study is to quantify the exposure of
drivers to diesel exhaust in order to develop cost-effective risk reduction strategies.
The City Corporation supports dissertations and research projects. The latest was a
study of the impact of messages provided by smartphones during air pollution
episodes. This research was published in Environment International, Volume 124,
March 2019, and used the City Corporation’s CityAir App.
The City Corporation provides the co-chair for the APRIL Committee (Air Pollution
Research in London). The City Corporation has also commissioned research to look
at the impact of urban form on air pollution in the Square Mile.
Third Sector
The Third Sector is comprised of non-government and non-profit-making
organisations. This includes charities, voluntary and community groups. The City
Corporation works with a range of third sector organisations on air quality projects
including Environmental Protection UK, Global Action Plan, London Sustainability
Exchange and Friends of City Gardens. An event to celebrate 120 years of
Environmental Protection UK was hosted by the City Corporation in September
2018.
Port of London Authority
The Port of London Authority (PLA) is the governing body for the Port of London. Its
responsibility extends over the Tideway of the River Thames. It maintains and
25supervises navigation and protects the river's environment. The PLA published an
Air Quality Strategy in 2018. The Strategy will be delivered through an Action Plan,
covering 2018 to 2022. The 18 proposals for action in the document include carrying
out further studies, establishing standards, investigating means to develop and
implement green technology, encouraging best practice and further monitoring of
river emissions. The City Corporation supported the development of the Strategy and
is assisting the PLA in monitoring emissions from the river, detailed as Action 15 of
the PLA Air Quality Strategy.
Cross River Partnership
Cross River Partnership (CRP) is a public-private partnership that has been
delivering regeneration projects in London since 1994. Its membership includes local
authorities, business organisations and other strategic agencies relevant to London.
The City Corporation provides the Public Sector Co-chair for CRP and works with the
organisation on cross London Borough projects.
Environment Agency
The Environment Agency is public body with responsibilities for the protection and
enhancement of the environment. The City Corporation has been working with the
Environment Agency to support the implementation of the Medium Combustion Plant
Directive (MCPD). The MCPD is a regulatory mechanism for controlling emissions
of pollutants from combustion plant between 1 megawatt thermal (MWth) and 50
MWth in size. The emission limits set in the MCP Directive are applied in the United
Kingdom from 20 December 2018 for new plant, and from 2025 or 2030 for existing
plant, depending on size. It is anticipated that there are many plant in the City of
London that meet this criterion. They can be a significant source of emissions of
nitrogen oxides (NOx) and small particles, particularly plant fuelled by diesel.
Businesses in the City of London
The City Corporation has been engaging
with the City of London business
community for over eight years to get
their support for improving local air
quality and raising staff awareness
through the CityAir programme. Regular
lunchtime workshops for business
representatives are hosted by the City
Corporation. Best Practice Guides have
been produced with input from City of
London businesses and industry representatives. This includes a Building Engineer
Toolkit which provides advice for Facilities Managers on reducing emissions of air
26pollutants from buildings. A Low Emission Supply Chain Guide, originally developed
in 2012, was improved and updated to incorporate latest best practice in 2018. It
provides guidance on reducing the impact on freight transport emissions. There are
several Business Air Quality Champions who provide invaluable support and lead
the way in action to reduce their impact on local air pollution.
The CityAir model has been extended across London and further businesses are
engaged in the Square Mile as the opportunity arises.
Collaborating with Others
We will:
Continue to work closely with the Greater London Authority and Transport for
London on policies to improve air quality and ensure that all actions support
the aims and objectives of the Mayor’s Environment Strategy
Continue to collaborate with London Boroughs and London Councils on action
to improve air quality
Support Universities with research into the health impacts of air pollution, to
increase understanding of the sources of pollution and the effectiveness of
interventions to reduce pollution
Continue to support the Third Sector to deliver air quality improvement
projects and raise awareness amongst London’s communities
Support the Port of London Air Quality Strategy through air quality monitoring
and in taking wider action to reduce emissions from vessels on the river
Thames
Continue to support the Cross-River Partnership in its delivery of air quality
projects in central London.
Continue to support the Environment Agency with action to improve air
quality, including the implementation of the Medium Combustion Plant
Directive
Continue to engage with and support the City of London Business Community
to become Air Quality Champions and reduce their impact on local air
pollution
275. Reducing Emissions from Road Transport
Commitment: The City Corporation will implement a range of measures to
reduce emissions of air pollutants associated with road traffic in the Square
Mile
How people and goods travel to and around the City of London has a significant
impact on air quality. The road network in the City of London is used intensively;
particularly during the working week as vehicles support the needs of businesses.
The Square Mile is located within the Congestion Charge Zone and Ultra-Low
Emission Zone. The City of London is very well served by public transport and has
54 bus routes, six mainline railway stations and 12 underground and District Light
Railway stations. The number of people who commute into the Square Mile by
private car is low.
The London Atmospheric Emissions Inventory suggests that in 2013 road transport
accounted for 57% of NOx; 56% of PM10, and 69% of PM2.5 emissions from within the
Square Mile. Estimates have been made for 2020 but these were made some time
ago and are uncertain, see Appendix 3. Diesel vehicles account for approximately
96% of these emissions, the majority of being buses, taxis and lorries. Figure 5.1
shows the proportion of NOx emissions for different vehicle types in 2013 together
with forecasts for 2020. The main contributor to air pollution from traffic in 2013 was
the bus fleet. By 2020 this is expected to change to taxis as the bus fleet becomes
progressively cleaner.
Figure 5.1: Proportion of NOx emissions from vehicles in the City of London in 2013 and 2020
Source GLA LAEI 2013
28Figure 5.2 compares the total amount of NOx emitted in tonnes per vehicle type in
the City of London in 2013 and compares this to 2020. It clearly shows large
reductions in emissions for all vehicles, particularly TfL buses.
Figure 5.2: Change in emissions of NOx from different vehicle types in 2013 and 2020
100
Estimated Transport Emissions- NOx
90
2013 2020
80
70
Tonnes per year
60
50
40
30
20
10
0
Motorcycle Taxi Petrol Car Diesel Car Van and TfL Bus Non-TfL Rigid HGV Artic HGV
mini bus Bus and
Coach
Figures 5.3 shows the relative proportion of PM10 emissions for different vehicle
types in 2013 with forecasts for 2020. The most noticeable difference between 2013
and 2020 is anticipated to be a reduction in emissions from taxis as they start to
move over to electric. The PM10 attributed to electric vehicles is from tyre and brake
wear.
29Figure 5.3: Proportion of PM10 emissions from vehicles in the City of London in 2013 and
2020
Source GLA LAEI 2013
Figure 5.4 compares the total amount of PM10 associated with different vehicle types
in 2013 and 2020. The difference isn’t as great as for NOx with the notable exception
of taxis.
Figure 5.4: Change in emissions of PM10 from different vehicle types in 2013 and 2020
Estimated Transport Emissions- PM10
5
4.5
2013 2020
4
3.5
Tonnes per year
3
2.5
2
1.5
1
0.5
0
30Mayor of London Transport Policies
The Mayor of London is delivering a wide range of policies to reduce air pollution
from road transport.
Ultra-Low Emission Zone
The Ultra-Low Emission Zone will be introduced in central London in April 2019. The
Square Mile will be completely within the zone. The ULEZ requires diesel vehicles to
meet the Euro 6/VI emission standard or pay a daily charge to enter the zone. Petrol
vehicles will have to meet the Euro 4 emission standard. The emission requirement
will be in place 24 hours a day, seven days a week. From 2021, the Mayor proposes
to extend the zone to encompass the North and South Circular boundaries.
Taxis and Private Hire Vehicles
Transport for London (TfL) appoints and regulates Taxi drivers. It is also responsible
for setting the emission limits for taxis and Private Hire Vehicles (PHVs). There is a
15-year age limit for London taxis and all new taxis must now be zero emission
capable (ZEC). The age limit for PHVs is 10 years. All PHVs licensed for the first
time must have a Euro 6 petrol or diesel engine, or a Euro 4 petrol-hybrid engine.
New zero emission capable requirements for PHVs will be phased in from 2020.
Further details of the Mayor’s emission controls for taxis are included in Appendix 6.
The City Corporation has published a draft Transport Strategy. The overarching aim
is to reduce the amount of traffic on the roads in the Square Mile in order to
reallocate street space to pedestrians. A reduction in all types of traffic will be
required to meet the aim of achieving a 25% reduction in traffic by 2030 and 50% by
2044. The City Corporation will therefore support TfL’s efforts to reduce the number
of PHVs operating in central London and work with the taxi industry to reduce empty
running. This will have a positive effect on local air quality.
Buses
London buses have been a significant source of air pollution in the City of London.
The Mayor of London is in the process of cleaning the fleet. He has made a
commitment that all single deck buses operating in London will be zero emission by
the end of 2020. All new double deck buses are now hybrid, electric or hydrogen.
All double deck buses operating in the Square Mile will be at least Euro VI, the latest
Euro Standard, by April 2019. Zero emission double deck buses will be gradually
introduced to achieve an entirely zero emission fleet by 2037 at the latest.
Transport for London has undertaken a review of its central London bus network.
Following a decline in bus use, TFL is examining ways to tackling bus journey times
and reliability. The City Corporation through its draft Transport Strategy, will work
with TfL to identify opportunities to reduce the number of buses travelling through the
31City of London without compromising public transport accessibility. The City
Corporation will also request an accelerated roll out of zero emission capable buses
on routes through the Square Mile.
City Corporation draft Transport Strategy
The City Corporation, through its draft Transport Strategy, is committed to making
streets in the Square Mile great places to walk by prioritising the needs of people on
foot.
Traffic management measures will be identified through Area Based Healthy Street
Plans. The first three plans will cover Barbican and Smithfield; Bank and Guildhall
and the City Cluster and Fenchurch Street.
The draft Transport Strategy, and corresponding Delivery Plan, is fully integrated into
this Air Quality Strategy. It contains a wide range of proposals that will lead to better
air quality in the City of London. The most significant are:
• Support and champion a central London Zero Emission Zone (ZEZ) within the
next Mayoral term. Seek a phased introduction of ZEZ restrictions with the
aim of ensuring that 90% of motor vehicles entering the Square Mile are zero
emission capable by 2030.
• Introduce local ZEZs covering the Barbican and Golden Lane Estates and
City Cluster by 2022
There is also a commitment to:
• Support small businesses to accelerate the transition to zero emission
capable vehicles
• Discourage private vehicle use and provide no additional on street parking
• Introduce car free days from 2019
The Transport Strategy contains the following proposals to reduce the exposure of
pedestrians to pollution:
• Increase the number of pedestrianised, or pedestrian priority streets
• Widen pavements
• Reduce the amount of time people wait for a green signal to cross the road.
• Complete the riverside walkway and improve the quality of the public realm
along the river front.
• Enhance the Barbican High-Walk making it easier to navigate.
• Improve awareness of traffic free walking routes to take people away from
areas of poor air quality
• Timed and temporary street closures including a Lunchtime Streets
programme
• Support and facilitate street closures by third parties
32You can also read