(NLES) Northampton Low Emission Strategy 2017 2025 - December 2017 - The LES forms part of the Northampton Borough Council Air Quality Action ...
←
→
Page content transcription
If your browser does not render page correctly, please read the page content below
Northampton Low Emission Strategy
               (NLES)
            2017 – 2025
The LES forms part of the Northampton Borough Council Air
Quality Action Plan (AQAP) in line with the requirements of
            Part IV of the Environment Act 1995

                                     December 2017
                                                              1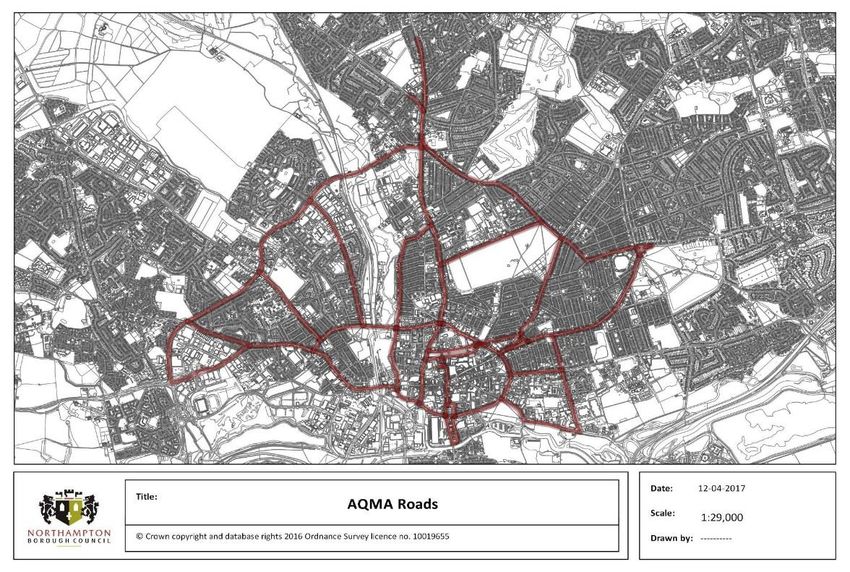
About the Northampton Low Emission Strategy (NLES)

The Northampton Low Emission Strategy (NLES) has been developed through collaboration
between Northampton Borough Council (NBC) and Northamptonshire County Council (NCC),
including Public Health with each organisation having an input and contributing to the
content of the strategy.

The NLES project is funded by DEFRA and managed by the NBC Environmental Health &
Licensing Department, with technical support provided by Low Emissions Strategies Ltd.
The NLES is intended to influence and shape local and regional strategies, plans and policies
to facilitate a reduction in emissions from vehicles, and improve air quality, resulting in a
healthier place for people to live, work and visit.

The Strategy sets out specific aims and objectives to be achieved over the next five years,
although it is recognised that further action will continue to be required beyond the
timeframe of this Strategy. It is intended that the Strategy will be kept under review and will
be renewed towards the end of the five year period to take into account changing needs,
technologies and priorities.

The Strategy forms part of the Northampton Air Quality Action Plan (AQAP) and a Task
Group will be set up to deliver the objectives within this Strategy and provide an annual
progress report.

The Northampton Low Emission Strategy (NLES) forms part of the Northampton Borough
Council (NBC) Air Quality Action Plan. The NLES lays out an integrated, year on year plan to
improve air quality over the period until 2025 through a reduction in vehicle emissions by
accelerating the uptake of cleaner fuels and technologies.

In 2016 we undertook 12 weeks of consultation on the draft LES, receiving substantial
feedback. NBC Scrutiny Panel 4 carried out a review of the draft strategy and action plan
during the winter of 2017 and produced 26 constructive recommendations. We have taken
these comments and recommendations into account during the preparation of this Strategy.

                                                                                               2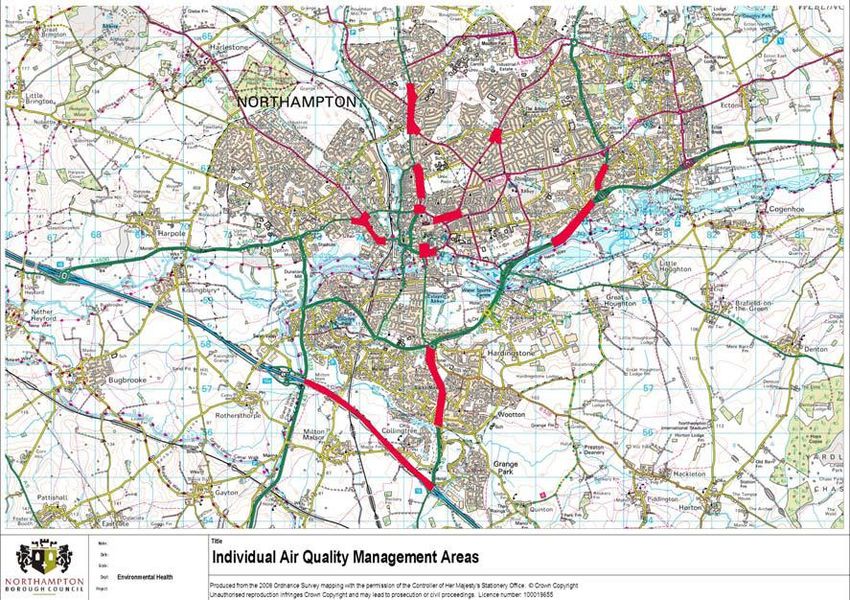
Foreword

           3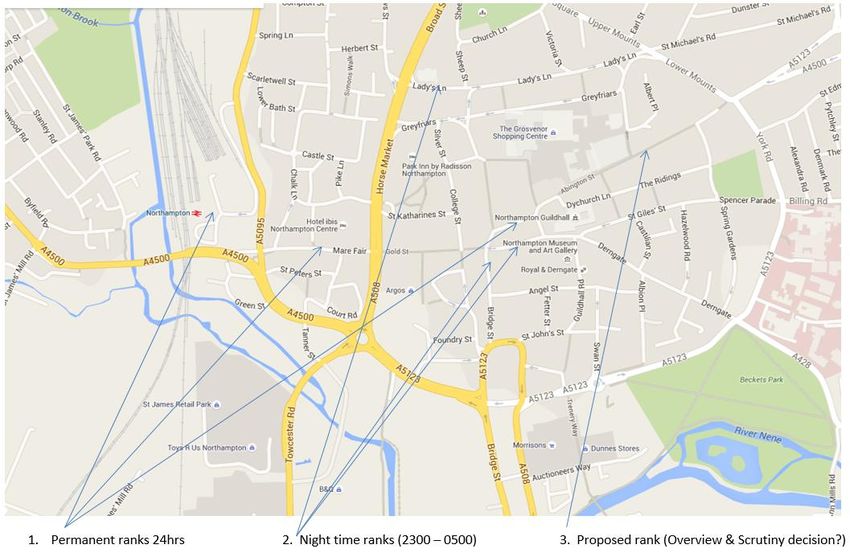
Executive Summary

Traffic in our urban centre and areas near busy roads are affecting concentrations of air
pollution that can have a significant impact on the health of the general population, with
those having underlying health conditions being most at risk. There are two pollutants of
greatest concern: nitrogen dioxide (NO2) and particulate matter (PM), which have an
adverse effect on health and are mainly a problem because of vehicle exhaust emissions,
with diesel exhaust emissions contributing most to the air pollution problem.

Unlike the smoke and smog problems of the past, NO2 and PM are invisible, leading to a
perception that the air is “clean”. However, particulate matter is so fine that it is inhaled
deep into the respiratory tract and, in the case of very fine particles and NO2 may transfer
into the blood stream. A range of health problems are attributed to exposure to elevated
levels of nitrogen dioxide and particulate matter, the most obvious being respiratory
conditions, asthma and coronary heart disease, but evidence is now also showing a strong
association with cancer, strokes, low birth-weight babies and even childhood cognitive
development. These health conditions impact both on quality of life and life expectancy.
The Public Health Outcomes Indicator for air pollution points to as many as one in twenty
deaths each year in Northampton being attributable to particulate air pollution.

NO2 and particulates, together with other air pollutants, have been set an upper air quality
limit value that the general population should not be exposed to in order to protect public
health. These limits are legally binding through EU and UK law. The urban area of
Northampton has been identified as having elevated levels of air pollution and Air Quality
Management Areas (AQMA) have been designated where there is relevant exposure to NO2.
Current projections indicate that concentrations of NO2 may not fall below the limit value in
some parts of the Borough until after 2020. Continued failure to meet the limit values will
put the UK Government at risk of legal action being taken against it under European law,
with the further risk of any fine imposed on the UK Government being passed down to local
authorities if their action, or in-action, has contributed to the limit value being exceeded.
Legal action has already been taken against the UK Government by Client Earth for the
continued breach of the limit values in both the European Courts and UK Supreme Court It
is therefore important, not least for the protection of public health, that all public bodies
work together to achieve compliance with the limit values by the earliest possible date.

Knowing that we have an air quality problem is one thing, but introducing effective actions
to tackle the problem is another. We know that traffic-related emissions are the main
reason why people are exposed to levels of air pollution which can damage health, but our
society and economy is structured around the effective and efficient movement of people
and goods. The challenge is to reduce emissions, without adversely impacting on the
economy and our need to travel. Conversely, this is also an opportunity for our society and
economy to benefit from the innovation and activity that will lead us to a low emission
future.

We already know a lot about the concentrations of air pollutants in the Borough and where
air pollution is highest, however, we also need to build our air quality monitoring and

                                                                                                4
modelling capability to inform evidence-based decision-making so that the most cost-
effective and viable options to deliver air quality improvements are considered.
No single action will solve our air quality problems, but a range of actions and activity is
required at a local, regional, national and European level in order to achieve the desired
reduction in emissions. This Strategy considers the local and regional activity required to
reduce emissions, having regard to the national and European context. The Strategy is a
collaboration between the Borough and County Councils and recognises that the actions
that will have greatest impact are ones which are implemented across the region, such as
regional transport planning, developing electric vehicle charging infrastructure and spatial
planning policies.
This Strategy has three main themes:
Evidence for Change
Creating a Low Emission Future
Northampton Vehicle Emission Framework
The first theme: Evidence for Change, outlines the evidence which is driving the need for
change, including the impact on health and the legal consequences of not taking action.
Evidence arising from national studies and work by the Borough in its role in assessing local
air quality has identified where air quality is poor and what causes the main air pollution
problems. We know that diesel vehicles cause the most significant air quality issues and
exposure to poor air quality is highest in urban areas, and when people live near busy roads
and junctions. Evidence suggests that action targeting the most polluting vehicles which
operate mainly in urban areas, for example older diesel buses, will achieve the most
significant air quality and health benefits. Action to improve air quality can, in most cases,
deliver additional benefits by reducing carbon dioxide emissions and reducing
environmental noise. This evidence will help inform what decision making is required to
reduce emissions, but the evidence base needs to develop further to help inform decision
making in the future and to ensure the aims and objectives of this Strategy are being
achieved.
The second theme: Creating a Low Emission Future, considers what needs to be done to
shape the places where we live and work, how we travel and the choices we make so that
low emission travel becomes part of normal everyday life. The NLES will help inform other
strategies and policies to achieve this. Notable strategic plans include the
Northamptonshire Transportation Plan (2012), Northampton Town Transport Strategy
(2013) and Highways Air Quality Strategy (2013), developed in partnership with
Northamptonshire County Council and the Local Development Plan produced by the
Borough, but other policies and plans, for example on Procurement, and Commissioning of
Services and Taxi Licensing can also influence how the low emission future is achieved and
how the places where we work and live are shaped. An Air Quality & Planning Technical
Guide has been developed as part of the NLES to be used to assess the air quality impact
from new development and help quantify the level of mitigation required to make
developments sustainable. We will use this Guide to help shape new developments, for
5
example by creating electric charging point infrastructure, so that low emission choices are
easy to make.
Clean Air Zones (CAZ) and Low Emission Zones (LEZ) are ways in which local authorities can
regulate emissions from vehicles in urban centres, by only allowing vehicles into zoned
areas which emit a low level of exhaust emissions. Such Zones are considered to be the
most effective way of reducing emissions in pollution hotspots. The Highways Air Quality
Strategy (Policy 4) states – ‘Where air quality and carbon emissions is a problem and a
major concern for local communities, the County Council will consider the introduction of low
emission zones to encourage the use of cleaner vehicles, limit access to certain vehicle types
or reduce the number of vehicles overall.’ The Government has published a national Clean
Air Zone Framework for introducing CAZ. We will work in partnership with the County
Council to look at the feasibility of implementing CAZ in Northampton. This study will look at
current and predicted pollution hotspots and the interventions that can be implemented to
improve vehicle emissions and air quality, including criteria laid down in the national CAZ
Framework or alternative standards that may be appropriate through a LEZ. All stakeholders
will be consulted as part of our assessments and any potential implementation plans.
Changing behaviour is a key element of delivering a low emission future. The car has
become an essential part of everyday life for most people, but increasingly people are
interested in alternative travel options and travel planning, with active travel (walking and
cycling) – the ultimate low emission vehicle – being increasingly important. The NLES can be
used to compliment the travel planning and active travel strategies across Northampton.
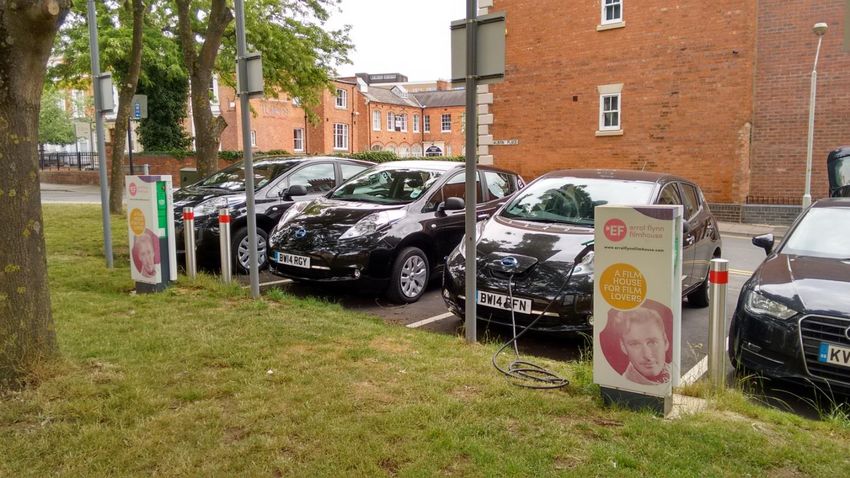
Department for Transport (DfT) figures show that over 100,000 plug-in vehicles were
registered in the UK by mid-2017 as people are seeing the benefits of lower running costs
and environmental benefits. Plug-in vehicles have zero exhaust emission capabilities and
represent a significant opportunity for improving air quality. However, ULEVs still represent
a very small percentage of the cars on the roads in Northampton and more work needs to
6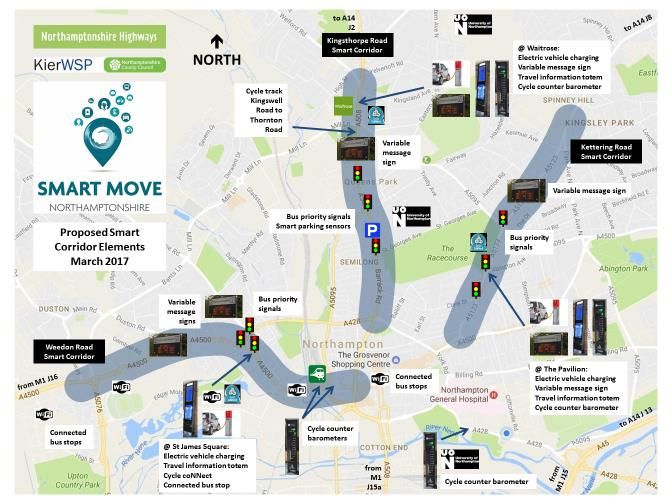
be done to promote ultra-low emission vehicles as a viable option for more people. We will
develop a Northampton Electric Vehicle Plan to promote policies and measures to support
plug-in vehicle uptake – not just for cars but for all vehicle types. We will help facilitate the
private sector in developing the transport energy infrastructure for the future.
The NLES will also help raise awareness of the impact which emissions, particularly from
vehicles, have on air quality on health. It can be confusing picture, for many years diesel
engines have been seen as better for the environment because of their lower CO2 emissions
compared to petrol, but we know that diesel engines emit higher levels of nitrogen dioxide
than their petrol equivalents and so contribute more to air quality problems. The NLES will
help to educate and inform so that everyone, from key decision makers to individuals
considering their next vehicle purchase, will be better informed about the health and
environmental consequences of the choice they make.
Finally, as part of Creating a Low Emission Future, we will lead by example. Public sector
organisations operate a large number of vehicles and employ many people across the region
and therefore have the potential to influence the uptake of low emission vehicles, both as
part of their business operations and in the wider population. We will carry out fleet
reviews to see how low emission vehicles can be incorporated into the vehicle mix, and will
promote the uptake of low emission vehicles for employees. Public authorities can
influence others through the commissioning of services and the procurement of goods and
services so consideration will be given to how this influence can be used to encourage
providers to reduce their emissions.
Theme 3 – Northampton Vehicle Emission Framework considers each of the main vehicle
sectors which contribute to local air pollution problems. The emphasis is on reducing
overall emissions by moving to cleaner fuels and technologies, such as electric, hybrid-
electric, natural gas & bio-methane and hydrogen, and also reducing emissions from
conventional diesel and petrol driven vehicles. The are many factors to be taken into
account when choosing a new vehicle, whether this be an individual, bus company, taxi
driver or fleet manager. Decisions are heavily influenced by previous purchase choices and
initial purchase price. Because alternative fuels and technologies are still emerging onto the
market there is uncertainty about choosing something different. The LES illustrates the
potential for an increasing number of low and ultra low emission vehicle alternatives to save
money. Further work is required to better understand the barriers to ULEV uptake and we
will work with individuals and organisations to make low emission vehicles a viable and
affordable alternative. The following vehicle sectors are considered in the NLES:
Private Cars – Diesel car sales have risen three-fold in the last decade, and now exceed
petrol car sales, with low emission alternatives continuing to represent less than 1% of
privately owned vehicles on the roads of Northampton. As engine technology improves
and new cars come onto the market, emissions will reduce, but this will take a long time
and therefore the LES will promote the accelerated uptake of ultra-low emission fuels
and technologies.
7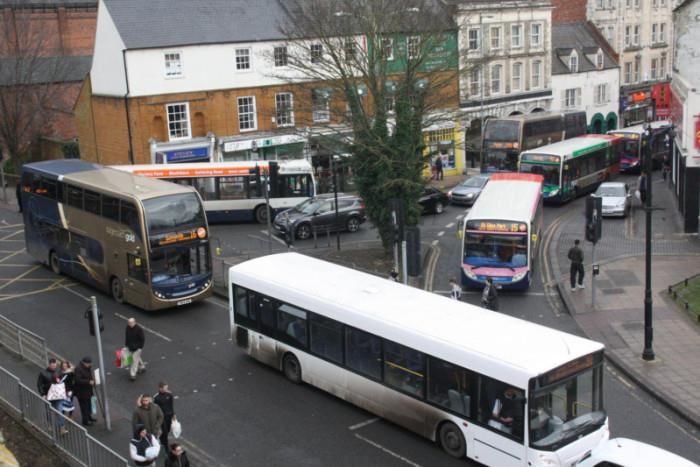
Buses – as a public transport option, buses are part of the solution, but, because they
are mainly diesel powered, they also contribute to the air pollution problem; particularly
in our urban centre and arterial routes where air quality is poorest. Bus companies
typically operate buses for a long time and older buses produce higher emissions than
modern equivalents. The NLES will encourage and support bus operators to accelerate
bus replacement programmes; operate newer, cleaner buses in urban areas; fit NOx and
particulate abatement technology on buses; and consider low emission alternatives as
part of a low emission pathway to 2025.
Commercial Vehicles and Freight – Northampton has one of the busiest strategic
motorway networks in the UK and is a hub for major logistics and distribution
companies. Consequently the number of Heavy Goods Vehicles (HGVs) on the road
network contributes significantly to overall air pollution. Recent years have also seen an
increase in the number of light goods vehicles (LGVs), which may be attributed to an
increase in internet sales, home deliveries and growth in the independent service sector
and trades. The commercial sector can be difficult to influence, but they understand the
need to reduce their carbon footprint and improve green credentials. The NLES will aim
to support the commercial sector to reduce emissions from fleet operations, for
example by assisting companies to understand whole-life costs of vehicles and support
alternative, low emission fuels such as electricity, natural and bio-methane gas, liquefied
natural gas (LNG) and, potentially in the future, Hydrogen.
Taxis and Private Hire Vehicles – over 850 Hackney Carriage taxis and private hire
vehicles operate in Northampton and most are diesel cars, however, the Toyota petrol
hybrid is the most popular private hire vehicle. The majority of journeys are short
journeys in town and city centres and therefore contribute to overall air pollution.
However, as well as being a contributor to the pollution problem, taxis and private hire
can be part of the solution, by show-casing the potential for low-emission vehicles and
“normalising” their use to the thousands of passengers they carry each year. The NLES
will encourage and support taxi and private hire operators to switch to low emission
alternatives and consider what policy incentives will support taxi and private hire
operators to make the change.
Public Sector Fleet – public sector organisation operate many cars, vans and heavy
goods vehicles, such as refuse disposal and highway maintenance vehicles. Public sector
employees also use their own cars, the “grey fleet”, for business journeys. The NLES will
seek to increase the number of low emission vehicles in both the direct fleet and grey
fleet in public sector organisations. We will use whole life costing of vehicles to balance
potentially higher purchase costs, but lower running costs of low emission vehicles
compared to traditional fuel types. Policy incentives will also be considered to
incentivise uptake of privately owned low emission vehicles that form part of the grey
fleet.
A detailed Delivery and Communications Plan will accompany this Strategy.
8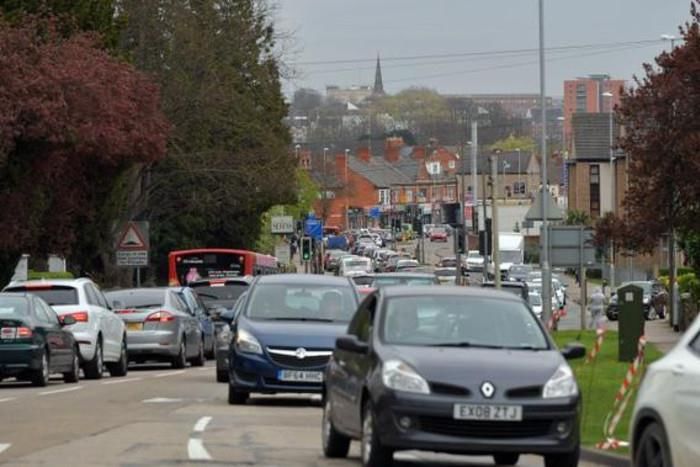
Contents

About the Northampton Low Emission Strategy (NLES)                                    2
Foreword                                                                              3
Executive Summary                                                                     4
Vision, Aims, Objectives                                                              11

1      Introduction                                                                   10
2      Evidence for Change                                                            14
       -      Air Quality & Vehicle Emissions                                         14
       -      Health Impacts of Air Pollution                                         18
       -      Legal Compliance                                                        23
3      Creating a Low Emission Future: Leading by Example                             26
       -      Key Transport Plans and Strategies                                      26
       -      Transport Management & Travel Planning                                  26
       -      Planning & Development Management                                       31
       -      Public Sector Procurement                                               41
       -      Fleet Management                                                        44
       -      Taxi Licensing                                                          45
4      Northampton Vehicle Emission Framework                                         52
       -      Passenger Cars                                                          57
       -      Northampton Electric Vehicle Plan                                       59
       -      Clean Air Zones (CAZ) & Low Emission Zones (LEZ)                        62
       -      Buses                                                                   64
       -      Freight                                                                 69
       -      M1 Motorway                                                             71
5      Delivery, Communication, Monitoring & Review                                   76

       Glossary                                                                       79

Maps:
Map 1 - Air Quality Management Areas (AQMA) in Northampton
Map 2 – Proposed Urban AQMA for Northampton
Map 3 – Spatial Distribution of Deprivation in Northampton
Map 4 – Existing and proposed taxi ranks in Northampton

Figures:
Figure 1 – Emission Reduction Progression
Figure 2 – Low Emission Strategy Drivers, Policy Areas, Stakeholders & Outcomes
Figure 3 – Low Emission Strategy Structure
Figure 4 – Particle size relative to a human hair
Figure 5 – Ilustration of the health benefits from walking and cycling
Figure 6 – Air Quality Classification of Development
Figure 7 – Classification, assessment & mitigation of new developments
Figure 8 – Examples of plug-in, disabled access taxis entering the market
Figure 9 – Real-world NOx emissions from diesel cars compared with regulated limits

                                                                                           9
Figure 10 – Performance of heavy duty engines against Euro Standard (ICCT, 2015)
Figure 11 - Electric Vehicle Charging (Smart Move Project)
Figure 12 – Emission standard for Northampton buses accessing the urban AQMA in 2020

Tables:
Table 1 – Estimated health impact of NO2 in the UK (2013 data)
Table 2 – Estimated fraction of mortality attributable to particulate air pollution in
           Northamptonshire for people aged over 25 years (2010)
Table 3 - Rates of Prevalence for Asthma 2012/13
Table 4 - Mortality rates for COPD Northampton, East Midlands and England 2010
Table 5 – Limit Values and Target dates for NO2 and PM compliance
Table 6 – World Health Organisation (WHO) Air Quality Guideline Values
Table 7 – Additional trigger criteria for major developments
Table 8 – Type 1 mitigation
Table 9 – Type 2 mitigation
Table 10 – Type 3 mitigation
Table 11 – Non-road mobile machinery (NRMM) controls
Table 12 – Emission Reduction Criteria for Tender Evaluation
Table 13 – Age profile of HC and PHV taxis in Northampton
Table 14 - Proposed emission standard requirements for taxis
Table 15 – Driver considerations when purchasing a taxi
Table 16 - Total cost of ownership (TCO) of plug-in and diesel Hackney Carriages
Table 17 – Total cost of ownership (TCO) of plug-in and diesel private hire vehicles
Table 18 – NOx emissions (kg) saved by disabled access taxis based on take-up scenarios of
            Plug-in vehicles
Table 19 – NOx emissions (kg) saved by saloon car taxis based on take-up scenarios of plug-
            in vehicles
Table 20 – Carbon Dioxide equivalent emissions (tonnes) saved by PHV taxis
            based on take-up scenarios of plug-in vehicles
Table 21 - European Emission Standards (passenger cars)
Table 22 – European Emission Standards for heavy duty engines
Table 23 – Quarterly EV registrations in Northamptonshire (2011 to 2017)
Table 24 – Clean Air Zone Classes
Table 25 – Clean Air Zone emission standards for vehicle types
Table 26 – NOx emissions of buses by European Emission Standard and fuel type
Table 27 – PM emissions of buses by European Emission Standard and fuel type
Table 28 – GHG emissions of buses by European Emission Standard and fuel type

                                                                                         10
Vision, Aims and Objectives
Vision
- A vibrant Northampton where clean air creates a healthy environment for
people to live, work and invest
- A Borough where air quality meets the Limit Values as set out in EC Directive
2008/50EC by 2021
Aims
- Improve air quality and health outcomes across Northampton by reducing vehicle
emissions through the accelerated uptake of cleaner fuels and technologies
- Embed an innovative approach to vehicle emission reduction through integrated
policy development and implementation
Objectives
1 General
1a Ensure all relevant Borough and County Council strategies consider and support
measures to improve air quality and health outcomes in partnership with stakeholders
2 Evidence for Change
2a Provide a robust framework for monitoring and modelling air quality across
Northampton
2b Use national and local data to assess the impact on health of Northampton residents
arising from air pollution
2c Work with local health professionals to promote awareness of the impact of vehicle
emissions on health
3 Creating a Low Emission Future: Leading by Example
3a Provide measures to improve vehicle emissions in support of the Northampton Town
Transport Strategy
3b Undertake a Clean Air Zone (CAZ) / Low Emission Zone (LEZ) feasibility study
3c Develop air quality and planning guidance to promote air quality mitigation at design
stage and support wider air quality improvements through off-set mitigation
3d Introduce specifications for electric vehicle charging as part of new development
schemes
3e Implement vehicle emission standards through Social Value procurement practices
3e Consider whole life costs and alternatives to diesel in NBC vehicle fleet procurements
3f Introduce Clean Air Taxi emission standards and infrastructure to support the take-up
of ultra-low emission taxis
4 Northampton Vehicle Emission Framework
4a Look at the feasible implementation of Clean Air Zones (CAZ) / Low Emission Zones
(LEZ) including potential emission standards for buses, taxis, lorries and vans, in line with
National Air Quality Plans
4b Develop measures to support vehicle emission reduction activity through Clean Air
Partnerships and Clean Air Recognition Schemes
4c Provide policies and measures to support the take-up of ultra-low emission vehicles
(ULEV) through the development of a Northampton Electric Vehicle Plan
4d Work in partnership with bus and freight operators to reduce emissions
5 Communication and Delivery Plan
5a Produce an integrated communications and delivery plan for measures in the NLES
111 Introduction
1.1 Like many urban areas Northampton experiences elevated levels of air pollution that
has a measurable health impact on the residents of the Borough. As industrial emissions
have subsided they have been replaced with vehicle related pollution, exacerbated by the
position of the Borough in the vicinity of the national strategic road network.
Northampton Borough Council (NBC) has developed a Low Emission Strategy (NLES) as part
of its Air Quality Action Plan (AQAP) to tackle road transport related pollution and improve
health outcomes by implementing innovative policies and measures that seek to reduce
vehicle emissions by helping to accelerate the uptake of cleaner fuels and technologies. It is
believed that this approach will also secure win wins in reducing vehicle emissions of Carbon
and noise. The LES has been produced with funding support from DEFRA1 Air Quality Grant
Programme. The LES supports and compliments key Borough and County Strategies.
1.2 Levels of nitrogen dioxide (NO2) have remained stubbornly elevated over the last
decade in some measured locations as action to improve air quality has stuttered for several
reasons. Firstly, because over-optimistic predictions of future air quality have encouraged
the belief that things would get better on their own, as newer vehicles, required to meet
more stringent emission standards, enter the fleet. Evidence has shown that many new
vehicles emit far more oxides of nitrogen (NOx, a precursor for NO2) in real-world driving
than in tests by manufacturers.
Secondly, national transport and travel planning guidance has tended to focus on measures
to avoid using vehicles and shifting to sustainable transport modes as a key approach to
solving air quality problems. The LES acknowledges that we can go further and promotes an
emission reduction progression that also seeks to improve the emissions of the vehicle fleet,
whereby, the LES compliments transport and travel planning. See figure 1.
Thirdly, there has been an increase in focus on reducing carbon emissions with some
measures adversely affecting air quality. The Government has encouraged diesel car sales
through reduced Vehicle Excise Duty (VED)2 with sales increasing from 20% of cars bought
to 60% within 15 years3. We now know that even the newest diesel cars can emit
significantly more NOx than petrol cars and in some cases certainly more than the
manufacturer’s tests claim.
Lastly, while transport and travel planning plays a major role in potentially improving air
quality, local authorities can make use of wider policy areas, including land-use planning,
procurement practices and licensing standards to support the accelerated take-up and use
of low emission vehicles that also have the potential to provide an enhanced platform for
inward investment. The LES provides an over-arching framework of vehicle emission
reduction activity to be delivered through an integrated policy approach. Figure 2 illustrates
1
Department for Environment, Food and Rural Affairs
2
https://www.gov.uk/government/publications/vehicle-excise-duty
3
www.smmt.co.uk
12this approach, highlighting the drivers, policy areas, key stakeholders and potential
outcomes of the NLES.
1.3 In 2013, NCC published a Northamptonshire Highways Air Quality Strategy4 as a
‘daughter document’ to the Northamptonshire Transportation Plan (2012)5. The aims and
the policies of the Strategy are shown below. The NLES seeks to update and build on the
vehicle emission improvement policies.
Aim
The aim of this Highways Air Quality Strategy is to reduce the number of transport-related
Air Quality Management Areas in Northamptonshire to zero and maintain that position.
Air Quality Policy 1: We will seek to reduce the impact of vehicle emissions and improve
air quality in Northamptonshire by encouraging modal shift, by managing congestion on our
road network and through effective partnership working.
Air Quality Policy 2: We will aim to reduce the vehicle emissions that have a damaging
effect on air quality by increasing the attractiveness of low-polluting alternatives to the
private car and encouraging modal shift.
Air Quality Policy 3: We will continue to be part of the Plugged in Places scheme and will
work with partners and residents to install charging points at key locations.
Air Quality Policy 4: Where air quality and carbon emissions is a problem and a major
concern for local communities, the County Council will consider the introduction of low
emission zones to encourage the use of cleaner vehicles, limit access to certain vehicle types
or reduce the number of vehicles overall.
Air Quality Policy 5: We will work to reduce vehicle emissions on our urban roads by
tackling congestion through network management.
Air Quality Policy 6: We will work with local operators and Government to seek the
introduction of buses fuelled by alternative fuel sources in Northamptonshire.
Air Quality Policy 7: We will work more closely with the district and borough councils to
improve air quality in the county and reduce the number of Air Quality Management Areas.
Air Quality Policy 8: We will work with our partners and stakeholders to increase the
importance that is placed on air quality management when new developments are planned.
If a proposed development is expected to have a detrimental effect on air quality at a
location then funding should be sought from the developer to mitigate the problem.
4
https://www3.northamptonshire.gov.uk/councilservices/northamptonshire-highways/transport-plans-and-
policies/Documents/Northamptonshire%20Highway%20Air%20Quality%20Strategy.pdf
5
https://www3.northamptonshire.gov.uk/councilservices/northamptonshire-highways/transport-plans-and-
policies/Documents/Northamptonshire%20Transportation%20Plan%20-%20Fit%20for%20Purpose.pdf
131.3 Everyone in Northampton has a role to play in improving air quality, including
individuals, businesses, public sector organisations and local and national Government.
Northampton Borough Council (NBC), together with Northamptonshire County Council
(NCC), recognise that together they can provide the strategic commitment to implement a
range of actions, both at a policy level and practical level, to improve air quality for the
people of Northampton.
Figure 1 – Emission Reduction Progression
Sustainable Improve vehicle
Avoid vehicle use
modal shift emissions
Local Transport Plans Low Emission Strategy
1.4 The NLES has been structured into 3 sections:
* Evidence for Change - which highlights the information gathered by
Northampton on air quality and vehicle emissions and the health impacts of air pollution.
This section also looks at the legal obligations of local air quality management (LAQM).
* Creating a Low Emission Future: Leading by Example – this section looks at
how NBC and NCC can use a variety of policy mechanisms to improve air quality and achieve
good growth.
* Northampton Vehicle Emission Framework – detailing specific vehicle
measures to both discourage the most polluting vehicles while encouraging the uptake of
cleaner vehicle technologies and fuels.
A detailed delivery plan will be developed to allocate roles, responsibilities and timescales
for implementing key NLES measures. The structure of the NLES is illustrated in figure 3.
1.5 The NLES is one of the first emerging strategies of its kind in the UK and has been
developed in parallel with other local authorities. DEFRA`s Plans to Improve Air Quality6
recognises the approach taken by Slough and others and states, “As a minimum we expect all
local authorities with areas currently exceeding the required levels to consider putting in place
a Low Emission Strategy. Such a Strategy could be used to set out a range of commitments
and actions to tackle pollution as part of a coherent multi-year programme and ensure they
identify and exploit the national assistance available.”
6
https://www.gov.uk/government/publications/air-quality-in-the-uk-plan-to-reduce-nitrogen-dioxide-
emissions
14Figure 2 - Low Emission Strategy Drivers, Policy Areas, Stakeholders & Outcomes
Drivers Policy Areas Stakeholders Outcomes
Business & Commerce Green Economy
Economic Growth
Transport Authority
Carbon Cleaner Transport
Transport
Transport Organisations
Sustainable
Highways England Development
Spatial Planning
Planning Authority
Low Improved Health
Air Quality Emission Outcomes
Public Health
Strategy Public Health
Environmental Protection Legal Compliance
Environment
Public Sector Fleet Managers
Social Value
Procurement Procurement
Public Sector Procurement
Noise
Sustainability/Climate Change Improved Air Quality
Climate Change Officers
Local Residents
Carbon Reduction
15Figure 3 - Low Emission Strategy Structure
Northampton Low Emission Strategy
(NLES)
Evidence for Change:
Air Quality & vehicle emissions
Public Health
Legal requirements
Creating a Low Emission Future:
Transport management & travel planning
Planning & development management
Public procurement of vehicles, goods & services
Fleet management
Taxi licensing
Economic development, including partnership working
Northampton Vehicle Emission Framework:
Raising awareness of vehicle emissions
Clean Air Zone feasibility assessment
Northampton Electric Vehicle Plan
Bus
Freight
Taxis
Public Sector Fleet
Communication, Implementation,
Monitoring & Review
162 EVIDENCE FOR CHANGE
2.1 AIR QUALITY AND VEHICLE EMISSIONS
2.11 Nitrogen Dioxide (NO2)
NBC has an extensive air quality monitoring network of automatic monitoring stations
(looking at NO2 and particulate matter) and diffusion tubes (monitoring NO2). Full details of
the monitoring results can be found on the NBC website7. Air Quality Management Areas
(AQMA) have been designated where levels of NO2 exceed the Government’s Air Quality
Objective (AQO), which is equivalent to the European Union (EU) Limit Value8, and where
there is relevant exposure to the public.
No AQMA has been designated due to particulate matter (PM) levels, however,
concentrations in Northampton still have significant impact on health (see section 2.2).
While levels of NO2 have improved in some areas of the Borough, concentrations at key
locations have remained stubbornly elevated over the last decade and at some locations,
concentrations have increased, including in the vicinity of the new bus station. NBC has
revoked 2 Air Quality Management Areas (AQMA) designations where NO2 levels have
improved and there are currently 7 Air Quality Management Areas (AQMA) where there is
relevant exposure, including:
1. ZONE 1 - The M1 corridor (between Junctions 15 and 16)
2. ZONE 2 - Victoria Promenade (an area encompassing a number of properties along
Bridge Stree, Victoria Promenade and Victoria Gardens)
3. ZONE 3 - St James (an area encompassing a number of properties along St James
Road, Weedon Road, Harlestone Road and adjoining streets)
4. ZONE 4 - Harborough Road (an area encompassing roads and properties fronting
parts of Kingsthorpe Grove, Harborough Road, Cranford Terrace, Alexandra Terrace
and Boughton Green Road)
5. ZONE 5 - A45 London Road (An area encompassing a number of properties
overlooking the northbound and southbound carriageways of the A45, extending
from Woodland Road to the Queen Eleanor interchange)
6. ZONE 6 - Campbell Square (An area encompassing a number of properties located at
the junction of Grafton Street, Campbell Street, Regent Square and Barrack Road)
7. ZONE 8 - St Michael's Road (An area encompassing all properties fronting St
Michael's Road)
Map 1 shows the locations of the current AQMA. Due to elevated concentrations in the
vicinity of the bus station and at other locations that are not within AQMA, NBC are
considering the re-designation of all the central AQMA to form one urban AQMA, covering
all the main Town Centre roads. The proposed AQMA is shown in map 2.
7
http://www.northampton.gov.uk/info/200075/pollution/1083/air-quality-review
8
https://uk-air.defra.gov.uk/air-pollution/uk-eu-limits
17The predominant cause of elevated levels of NO2 is road transport emissions. The emissions
of Oxides of Nitrogen (NOX - the pre-cursor for NO2) from different vehicle types have a
varying significance, depending on location. For example, buses are a significant contributor
in the inner urban area and on arterial routes, while heavy and light goods vehicles are a
significant contributor on trunk roads. Passenger cars, particularly diesel, play a significant
role in all areas.
Map 1 – Northampton Air Quality Management Areas (AQMA)
Map 2 – Proposed urban Air Quality Management Area (AQMA) roads in Northampton
182.12 Continuing Assessment of Low Emission Strategy Measures
NBC and NCC will undertake a detailed assessment of current and future air quality to 2025,
taking into account predicted traffic growth in the Borough. This modelling will incorporate
traffic growth figures for future years that are predicted by the NCC transport models and
use the latest vehicle emission factors and local monitoring data to evaluate the following:
Levels of NO2 and PM in identified hotspots over the coming years
Any new, predicted areas of concern
The impact of measures in the NLES to improve air quality in key locations, including
the potential implementation of Clean Air Zones (CAZ) or Low Emission Zones (LEZ)
The outputs from this assessment will be used in the consideration of any additional activity
that is required to improve air quality to meet EU Limit Values and improve health.
The outputs will be used by Public Health, as part of the ongoing NLES health impact
assessment (HIA) for the Borough, looking at any benefits or disbenefits to health arising
from the implementation of key intervention scenarios, such as CAZ or LEZ.
192.2 HEALTH IMPACTS OF AIR POLLUTION
2.21 It is estimated that the health impact of NO2 in the UK accounts for 23,000 (9,500 –
38,000) premature deaths (see table 1), while the combined impact of NO2 and particulate
matter (PM2.5) in the UK is estimated to cause 44,750 to 52,500 attributable deaths per
annum, with an annual cost to society of £25.3bn to £27.9bn9.
Table 1 – Estimated health impact of NO2 in the UK (2013 data)
Central (2.5%) Low (1%) High (4%)
Annual equivalent 23,500 9,500 38,000
attributable deaths
Annual Social Cost £13.3bn £5.3bn £21.4bn
2.22 The adverse health effects from short and long-term exposure to air pollution range
from premature deaths caused by heart and lung disease to worsening of respiratory
symptoms (i.e. asthma, chronic obstructive pulmonary disease (COPD, commonly known as
chronic bronchitis), which lead to a reduced quality of life and increased health care costs.
There is also evidence linking air pollution with a range of cancers (lung and bladder in
particular), strokes10, low birth weight babies11 and subsequent neurodevelopment
problems in children12,13. In 2013, the World Health Organisation (WHO) classified diesel
exhaust emissions as carcinogenic to humans14.
2.23 The two main pollutants of concern in urban areas are nitrogen dioxide (NO 2) and
particulate matter (PM10, PM2.5). Studies have shown an association between nitrogen
dioxide in outdoor air with adverse health effects, including reduced life expectancy,
however, it has not been clear if these effects were caused by NO2 itself or by other
pollutants (such as particulate matter) emitted from the same source: for example traffic
will produce both NO2 and PM emissions. The Government has recently stated15 that NO2
increases mortality by an average of 4.3% across the UK.
2.24 Particulate Matter
9
Tackling nitrogen dioxide in our towns and cities, UK overview document, DEFRA, December 2015,
10
Short term exposure to air pollution and stroke: systematic review and meta-analysis, BMJ March 2015;
350:h1295
11
http://www.thelancet.com/journals/lanres/article/PIIS2213-2600(13)70192-9/abstract
12
http://www.ncbi.nlm.nih.gov/pubmed/25229653
13
Association between Traffic-Related Air Pollution in Schools and Cognitive Development in Primary School
Children: A Prospective Cohort Study, PLOS Medicine (March 2015)
14
http://www.iarc.fr/en/media-centre/iarcnews/pdf/pr221_E.pdf
15
https://www.gov.uk/government/uploads/system/uploads/attachment_data/file/460401/air-quality-
econanalysis-nitrogen-interim-guidance.pdf
20Figure 4 illustrates the size of particulate matter fractions relative to a human hair. The
small particle sizes means that that these pollutants can be inhaled deep into the lung tissue
and the smallest particles can pass into the bloodstream and be circulated around the body
to key organs, including the liver and brain. The Government Committee on the Medical
Effects of Air Pollutants (COMEAP)16 has found a clear causal link between exposure to
particulates and adverse impacts on health, with a clear recommendation that reducing the
concentration of particulate matter in air will benefit public health.
Figure 4 - Particle size relative to human hair
PM10
PM2.5
PM0.1
PM10 – coarse particles (smaller than 10 microns / 0.01mm)
PM2.5 – fine particles (smaller than 2.5 microns / 0.0025mm)
PM0.1 – ultra-fine particles (smaller than 0.1 microns / 0.0001mm)
Public Health England (PHE)17 use PM2.5 as an indicator for mortality attributable to
particulate air pollution. The Indicator suggests that in 2010, across Northampton, 6.1% of
people aged over 25 will die prematurely each year because of particulate air pollution:
equivalent to 102 deaths per year or 1168 associated life years lost. Table 2 shows the
estimated fraction of mortality attributable to particulate air pollution for people aged over
25 years in Northamptonshire.
2.25 Premature death is the ultimate health impact associated with air pollution, but poor
air quality particularly affects people with pre-existing respiratory and cardiac problems. It
16
Statement on the Evidence for Differential Health Effects of particulate Matter According to Source or
Components, COMEAP (March 2015)
17
Estimating Local Mortality Burdens Associated with Particulate Air Pollution, Public Health England, 2014
21can be seen from Table 3 and 4 that the number of people affected by asthma and COPD in
Northampton, respectively, is higher than for England as a whole. These figures give an
indication of the levels of ill health and the size of the ‘high risk’ population that will benefit
most from improvements in air quality in the Borough.
Table 2: Estimated fraction of mortality attributable to particulate air pollution in
Northamptonshire for people aged over 25 years (2010)7.
Percentage Attributable Associated Life-
mortality Deaths aged 25+ Years lost
attributable to
PM2.5
England 5.6% 25,002 264,749
Northamptonshire 5.7% 323 3,513
Corby 5.6% 29 330
Daventry 5.5% 33 349
East 5.5% 42 390
Northamptonshire
Kettering 5.8% 47 493
Northampton 6.1% 102 1168
South 5.4% 34 384
Northamptonshire
Wellingborough 5.9% 36 400
Table 3: Rates of Prevalence for Asthma 2012/1318
% Population with Number of People
Asthma with Asthma
Northampton 6.12% 13,800
England 5.9% 3,127,590
Table 4: Mortality rates for COPD Northampton, East Midlands and England 201019
All Cause Mortality COPD Mortality (per
(per 100,000) 100,000)
Northampton 589 29
East Midlands 545 24
England 538 25
18
Public Health Northampton
19
NHS Information Centre for Health and Social Care
222.26 The evidence suggests there is a close link between air pollution and areas of high
deprivation. Individuals living in areas of high deprivation often live in accommodation close
to roads that have high levels of emissions. The Environment Agency estimates that people
living in the most deprived areas have over five times the exposure to air pollutants as
individuals living in the least deprived areas (Environment Agency, 2003). Individuals in more
deprived areas have poorer health in general, so they suffer more adverse health effects than
people experiencing the same level of emissions exposure in less deprived areas (British
Medical Association, 2012).
The proportion of children living in high traffic density areas has been found to increase with
decreasing median family income for all ethnicities except white (Gunier, 2003). Minority
children are about three times more likely to live in high traffic areas compared to white
children. Therefore minority children have a higher potential of exposure to vehicle
emissions, and this is of particular concern considering the previously discussed vulnerability
of children to air pollution and emissions. Map 3 shows the spatial distribution of deprivation
in Northampton.
Map 3 – Spatial Distribution of Deprivation in Northampton
232.27 Damage Costs
The mortality and morbidity effects of exposure to poor air quality can be translated into an
economic cost to society. A conservative estimate for one type of pollution (particulates) is
that it reduces average life expectancy in the UK by around six months, worth £16 billion a
year in the UK20. HM Treasury together with DEFRA have developed guidance21 on how to
quantify the economic impact that policies, plans and projects have on air quality. The
guidance uses “damage costs” to quantify the impact of different pollutants from different
sectors.
Transport accounts for the most significant economic impact on air quality with an average
“cost” of £44,430 and £25,252 per tonne of emissions for particulate matter (PM) and
Oxides of Nitrogen (NOx) respectively. This impact is even greater in urban areas, for
example in urban conurbations the damage cost associated with transport rises to £107,965
and £61,365 per tonne for PM and NOx respectively.
The concept of damage costs associated with air quality is used later within this Strategy
when considering “good growth” and particularly in relation to new developments and the
role of the planning system to contribute to the achievement of sustainable development. It
is also used in comparing the whole life costs (WLC) of different vehicle technologies.
2.3 LEGAL COMPLIANCE
2.31 NBC has a legal duty under the Environment Act 199522 to review and assess air
quality in the Borough and designate any areas where there is relevant exposure to the
public to air pollution that is likely to exceed the Government Air Quality Objectives (AQO)
as Air Quality Management Areas (AQMA). NBC is required to produce an Air Quality Action
Plan (AQAP) to show how we will pursue the achievement of the AQO. This LES forms part
of the AQAP for Northampton.
Limits on air quality concentrations are set by the EU and adopted by Member States. In the
UK the EU Limit Values are the same as the AQO (see table 5). While local authorities have a
duty to pursue Government Air Quality Objectives (AQO), there is no legal duty to meet the
AQO, however, the reserve powers of the Localism Act 201123 allow for any EU fines to be
passed onto any public authority “whose act or omission” has contributed to the breach in
EU law.
The EU has commenced infraction proceedings against the UK Government and Devolved
Administrations for failing to meet the legally binding EU Limit Value for NO2. As the UK has
voted to leave the EU it is unclear at present whether the current Limit Values will be
retained or whether sanctions will be imposed. It should be noted that the main driver to
improve air quality is public health and that EU Limit Values are health based and correlate
20
https://www.gov.uk/guidance/air-quality-economic-analysis
21
Valuing impacts on air quality: Supplementary Green Book guidance, HM Treasury and DEFRA, May 2013
22
http://www.legislation.gov.uk/ukpga/1995/25/contents
23
http://www.legislation.gov.uk/ukpga/2011/20/contents/enacted
24with the World Health Organisation (WHO) Air Quality Guideline Values for NO2, while the
WHO recommends lower concentrations for particulate matter than the EU Limit Values
(see table 6).
Table 5 - Limit Values & Target dates for NO2 and PM compliance
Table 6 - World Health Organisation (WHO) Air Quality Guideline Values
253. CREATING A LOW EMISSION FUTURE: LEADING BY EXAMPLE
3.1 In order to create change it is important that key organisations, including the
Borough and County and other public sectors organisations who promote health and
environmental improvements, lead by example. Public sector organisations operate fleets
of vehicles and are significant employers in the area, generating thousands of business miles
each year, and are responsible for spending public money when procuring goods and
services. These represent significant opportunities for influencing change, both within the
public sector, but also beyond, including employees and the many private and voluntary
sector organisations who engage with the public sector on a daily basis.
Additionally, we can influence vehicle emission improvements through our transport plans
and strategies, local planning policies and taxi licensing standards.
We are also mindful of the economic opportunities that new technologies can bring. The
NLES seeks to provide a platform for inward investment through the promotion of
alternative vehicle emission technologies as part of the transition to a low emission
economy. Alternative refuelling and electric vehicle charging infrastructure, new vehicle
ownership and usage models, maintenance and ancillary support mechanisms and the
development of SMART technologies to assist ultra-low emission vehicle (ULEV) take-up will
require the development of new skills as part of the drive to put Northampton at the
forefront of creating low emission business opportunities.
3.2 TRANSPORT MANAGEMENT & TRAVEL PLANNING
NBC will:
Promote modal shift away from cars to sustainable transport modes,
including public transport, walking and cycling
Promote travel planning
Undertake a Clean Air Zone (CAZ) / Low Emission Zone (LEZ) feasibility
study in partnership with NCC and in line with the national Clean Air
Zone Framework and Northamptonshire Highways Air Quality Strategy
Promote the uptake of ultra-low emission vehicles (ULEV) in line with
the Northampton Electric Vehicle Plan
3.21 NCC published the Northamptonshire Transportation Plan in 2012. As part of the
Plan, thematic strategies and town strategies have, or are in the process of being published
as ‘daughter documents. These include the Northampton Town Transport Strategy
26(2013)24and thematic strategies regarding Air Quality (2013), Smart Travel Choices (2013)25 and a Bus Strategy draft for consultation (2017)26. The Northampton Town Transport Strategy identifies key transport issues affecting Northampton, including the lack of a completed Outer Ring Road which adds to congestion on the Inner Ring Road. The Strategy outlines key modal shift measures and plans to manage traffic growth and congestion which will have a potential air quality benefit in pollution hotspots near junctions. The Strategy also includes a commitment to improve air quality so that AQMA can be revoked. The NLES seeks to support the Transport Strategy by focussing on measures that are capable of improving the emissions of vehicles on the Borough roads. 3.22 Smart Travel Choices The Smart Travel Choices Strategy (2013) outlines policies and measures to promote sustainable modal shift through active travel choices and travel planning. Active travel is an approach to travel and transport that focuses on physical activity (walking and cycling) as opposed to motorised and carbon-dependent means. Active travel is cheap, inclusive and accessible, but is also the ultimate “low emission vehicle”. Choosing to walk or cycle over motorised transport will not only reduce air pollutants, congestion and climate change impacts (20% of car-related CO2 emissions are from journeys
the scale of change necessary to improve air quality, the NLES focus will be on reducing
vehicle emissions.

Figure 5 – Illustration of the health benefits from walking and cycling

Travel Planning

A Travel Plan is a long-term management strategy for integrating proposals to promote and
encourage sustainable travel. Travel Plans are a tool particularly aimed at reducing the
need to travel, gaining economic efficiencies, reducing the impact of car travel and
encouraging greater use of public transport, cycling and walking.

In addition to general travel planning guidance produced by NCC in partnership with NBC,
specific Area Travel Planning (ATP) Strategies have been produced for Brackmills and Telford
Way Industrial Estates.

Employers are also encouraged to employ smart working practices to reduce the need for
journeys altogether, for example: flexible working, home working and using remote
tele/video conferencing facilities.

The current travel planning model focuses on reducing journeys by car, however, the
approach can also be used to encourage emission reductions. The NLES will use the existing
Travel Planning Networks to engage with key employers, providing access to thousands of
employees in the Borough to promote the uptake low emission vehicles when developing
travel plans.

Travel planning is also important when new housing and business developments are taking
place because people are considering new ways of travel and are more likely to consider
alternative travel options. Travel Planning is already a key feature of the development

                                                                                           28
management process and developers are often required to produce travel plans for new
developments. The Air Quality and Planning Guidance will add further weight to travel
planning as a tool to off-set and mitigate against the impact of air quality from new
developments.
3.23 Clean Air Zones (CAZ) & Low Emission Zones (LEZ)
In July 2017, the Government published its ‘UK plan for tackling roadside nitrogen dioxide
concentrations’29. The plans set out the Government’s approach to improving air quality in
the UK, reducing health impacts, and fulfilling its legal obligations. The plans include a
framework for implementing Clean Air Zones (CAZ) in the UK30. The framework identifies
towns and cities where NO2 concentrations are predicted to exceed the EU Limit Value in
2020 and five cities outside London, comprising Birmingham, Derby, Leeds, Nottingham and
Southampton, will be legally required to introduce Clean Air Zones (CAZ) in the shortest
possible time and by 2020 at the latest. London will be required to introduce an Ultra-Low
Emission Zone in 2019 that will initially cover the Congestion Charging Area and then be
expanded to the area bounded by the North and South Circular roads. The framework also
identifies over 20 other towns and cities that will also be considered for mandated CAZ.
NO2 levels in Northampton are significantly elevated in key locations and we believe that the
Government’s modelling is over optimistic in predicting compliance with the EU Limit Values
in Northampton by 2020. For example, the Government model assumes that 73% of all bus
km travelled in Northampton in 2020 will be by Euro VI Standard buses. We know that, given
the current bus emission profile (see section 4.6), there will only be a few Euro VI buses
introduced as part of current investment plans. Therefore, we need to consider robust plans
that can effectively reduce vehicle emissions in key locations - setting standards that, at least,
mirror the Government modeling assumption. This could be achieved through the
implementation of Clean Air Zones (CAZ) or Low Emission Zones (LEZ).
The aim of CAZ is to bring together local measures to deliver immediate action to improve
air quality and health with support for towns and cities to grow while delivering sustained
reductions in pollution and a transition to a low emission economy. Where there are the
most persistent pollution problems, this is supported by restrictions to encourage only the
cleanest vehicles to operate in the town or city.
29
https://www.gov.uk/government/publications/air-quality-plan-for-nitrogen-dioxide-no2-in-uk-2017
30
https://www.gov.uk/government/uploads/system/uploads/attachment_data/file/612592/clean-air-zone-
framework.pdf
29Clean Air Zones fall into two categories:
Non-charging Clean Air Zones – These are defined geographic areas used as a focus
for action to improve air quality. This action can take a range of forms but does not
include the use of charge based access restrictions. Emission standards for buses,
coaches and taxis are required in addition to measures to promote the uptake of
ULEVs
Charging Clean Air Zones – These are zones where, in addition to the above, vehicle
owners are required to pay a charge to enter, or move within, a zone if they are driving
a vehicle that does not meet the particular standard for their vehicle type in that class
of zone. Clean Air Zone proposals are not required to include a charging zone. Certain
exemptions may be granted for specialist vehicle types including emergency vehicles.
With current and predicted air quality levels in Northampton, NBC will assess the feasibility
of implementing a CAZ in the Borough, including the consideration of non-charging and
charging CAZ requirements. The type of zone envisaged would not include passenger
vehicles.
Low Emission Zones (LEZ)
The Government has published a national CAZ Framework, setting fixed emission standards
and charging criteria for vehicles within a Zone. As Northampton is not mandated to
introduce or consider the feasibility of a CAZ it is possible that a LEZ may be more suitable
for Northampton. A LEZ is similar to a CAZ, however, there is more flexibility/discretion as to
the emission standards to be set and enforcement criteria to be used which reflect our local
needs and circumstances.
NBC, in partnership with NCC, will undertake a feasibility study regarding the potential for
implementing either a CAZ or a LEZ in Northampton.
Further information can be found in Section 4 – Northampton Vehicle Emission
Framework
30You can also read