REVIEW OF INTERNATIONAL POLICIES FOR VEHICLE FUEL EFFICIENCY - INTERNATIONAL ENERGY AGENCY AGENCE INTERNATIONALE DE L'ENERGIE
←
→
Page content transcription
If your browser does not render page correctly, please read the page content below
INTERNATIONAL ENERGY AGENCY
           AGENCE INTERNATIONALE DE L’ENERGIE

REVIEW OF INTERNATIONAL POLICIES
      FOR VEHICLE FUEL EFFICIENCY

                                IEA INFORMATION PAPER

                       In Support of the G8 Plan of Action

                                              TAKAO ONODA
                                  INTERNATIONAL ENERGY AGENCY
                                  © OECD/IEA, August 2008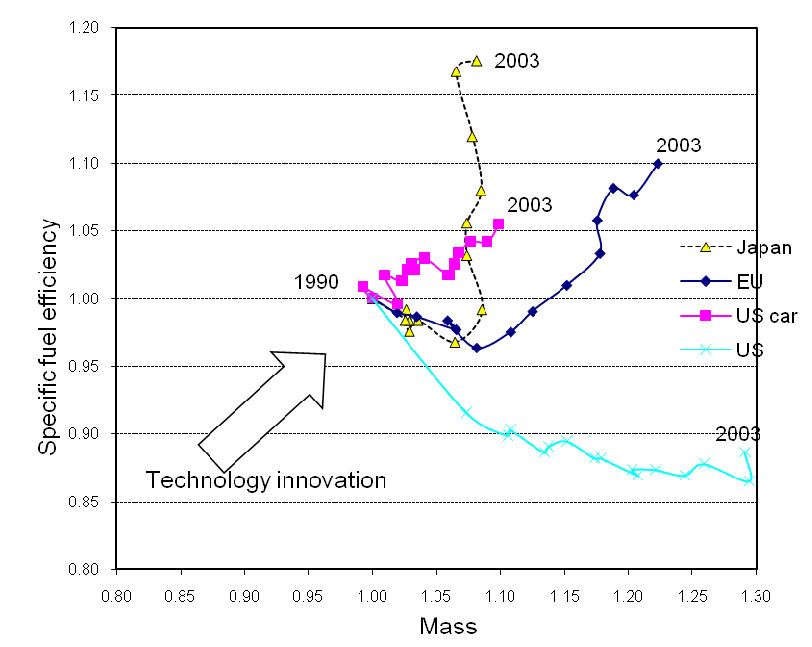
INTERNATIONAL ENERGY AGENCY
The International Energy Agency (IEA) is an autonomous body which was established in
November 1974 within the framework of the Organisation for Economic Co-operation and
Development (OECD) to implement an international energy programme.
It carries out a comprehensive programme of energy co-operation among twenty-eight of
the OECD thirty member countries. The basic aims of the IEA are:
To maintain and improve systems for coping with oil supply disruptions.
To promote rational energy policies in a global context through co-operative relations
with non-member countries, industry and international organisations.
To operate a permanent information system on the international oil market.
To improve the world’s energy supply and demand structure by developing alternative
energy sources and increasing the efficiency of energy use.
To promote international collaboration on energy technology.
To assist in the integration of environmental and energy policies.
The IEA member countries are: Australia, Austria, Belgium, Canada, Czech Republic,
Denmark, Finland, France, Germany, Greece, Hungary, Ireland, Italy, Japan, Republic of
Korea, Luxembourg, Netherlands, New Zealand, Norway, Poland, Portugal, Slovak Republic,
Spain, Sweden, Switzerland, Turkey, United Kingdom and United States. The European
Commission also participates in the work of the IEA.
ORGANISATION FOR ECONOMIC CO-OPERATION AND DEVELOPMENT
The OECD is a unique forum where the governments of thirty democracies work together
to address the economic, social and environmental challenges of globalisation. The OECD
is also at the forefront of efforts to understand and to help governments respond to new
developments and concerns, such as corporate governance, the information economy
and the challenges of an ageing population. The Organisation provides a setting where
governments can compare policy experiences, seek answers to common problems, identify
good practice and work to co-ordinate domestic and international policies.
The OECD member countries are: Australia, Austria, Belgium, Canada, Czech Republic,
Denmark, Finland, France, Germany, Greece, Hungary, Iceland, Ireland, Italy, Japan, Republic
of Korea, Luxembourg, Mexico, Netherlands, New Zealand, Norway, Poland, Portugal, Slovak
Republic, Spain, Sweden, Switzerland, Turkey, United Kingdom and United States.
The European Commission takes part in the work of the OECD.
© OECD/IEA, 2008
International Energy Agency (IEA),
Head of Communication and Information Office,
9 rue de la Fédération, 75739 Paris Cedex 15, France.
Please note that this publication is subject
to specific restrictions that limit its use and distribution.
The terms and conditions are available online at
http://www.iea.org/Textbase/about/copyright.aspREVIEW OF INTERNATIONAL POLICIES FOR
VEHICLE FUEL EFFICIENCY
Abstract
At Gleneagles, United Kingdom in 2005, the G8 leaders signed a communiqué that
included an initiative called the Gleneagles Plan of Action (GPOA), which addresses
climate change, clean energy and sustainable development. This paper is one element of a
comprehensive response to the GPOA in which G8 leaders pledged to encourage the
development of cleaner, more efficient and lower-emitting vehicles, and to promote their
deployment, by, among other means, asking the IEA to review existing standards and
codes for vehicle efficiency and to identify best practices. Representative samples of fuel
efficiency standards as well as voluntary programs are compiled. In addition, since
standards are only one of the means by which governments can reduce fuel consumption
and carbon dioxide emissions from motor vehicles, this paper assesses a broader set of
governmental initiatives aimed at promoting the deployment of fuel efficient vehicles
such as labelling and financial incentives. Eight recommendations regarding the nature of
measures, attributes of an effective standard, standard stringency and standard related
policies are made in this paper.
Since 2005, the IEA has been engaged in a programme of work for the G8 addressing the
challenges of climate change, clean energy and sustainable development. Aiming at a
“clean, clever and competitive energy future”, this programme has produced wide-
ranging analysis and policy recommendations including, inter alia, the IEA's 25
recommendations, which the G8 leaders agreed to implement at the G8 Hokkaido
Toyako Summit. Detailed information is available on the IEA’s website at www.iea.org.
Acknowledgements
The author of this paper is Mr. Takao Onoda, Policy Analyst with the Energy Efficiency
and Environment Division of the IEA.
The author would like to thank Paul Waide, Ingrid Barnsley, Richard Bradley, Pieter
Boot, Nigel Jollands, Rebecca Gaghen, Lew Fulton, Pierpaolo Cazzola and Emi Mizuno
(IEA) for the information, comments and ideas they have provided throughout my
research. Alan Meier (Lawrence Berkeley National Laboratory), Steven Plotkin (Argonne
National Laboratory), Giacomo Mattinò (DG Enterprise, European Commission),
Andreas Veispak (DG Enterprise, European Commission), Nobuyuki Konuma (Ministry
of Land, Infrastructure and Transport, Japan), Shuji Okuda (Ministry of Economy, Trade
and Industry, Japan), Akio Tamano (Toyota Motor Co.), Drew Kodjak (International
Council on Clean Transport), Akihiko Hoshi (Misson of Japan to the European Union)
and EEWP delegates also provided very useful suggestions and advice. Charlotte Forbes
and Janet Pape (IEA) helped edit this document.
3List of Acronyms and Abbreviations
ACEA European Automobile Manufacturers’ Association
AIAMC Association of International Automobile Manufacturers of Canada
APS Alternative Policy Scenario
CADA Canadian Automobile Dealers Association
CAFE Corporate Average Fuel Economy
CVMA Canadian Vehicle Manufacturers’ Association
DOT Department of Transport
EPA Environment Protection Agency
ETP Energy Technology Perspective
FCAI Federal Chamber of Automotive Industry
G8 Group of Eight
GHG Green House Gas
GPOA Gleneagles Plan of Action
GVWR Gross Vehicle Weight Rating
HDV Heavy Duty Vehicle
JAMA Japan Automobile Manufacturers’ Association
KAMA Korean Automobile Manufacturers’ Association
LDV Light Duty Vehicle
LPG Liquefied petroleum gas
MOU Memorandum of Understanding
MVMA Motor Vehicle Manufacturers’ Association
MY Model Year
NHTSA National Highway Traffic Safety Administration
NOx Nitrogen Oxide
NRCan Natural Resource Canada
PM Particulate Matter
SUV Sport Utility Vehicle
UNECE/WP29 United Nations Economic Commission for Europe/Working Party 29
UNFCCC/ United Nations Framework Convention on Climate Change/
COP3 Conference of the Parties
UPI Uniform Percentage Improvement
WEO World Energy Outlook
4WD Four-wheel-drive vehicles
4Table of Contents
Abstract ...................................................................................................3
Acknowledgements ...............................................................................3
List of Acronyms and Abbreviations ................................................4
List of Figures ........................................................................................6
List of Tables ..........................................................................................6
List of Boxes ...........................................................................................6
Executive Summary ..............................................................................7
I. Introduction ................................................................................. 12
II. Current Policies to Improve vehicle fuel efficiency ............ 15
III. Looking forward: identifying effective policies .................. 25
IV. Conclusions .................................................................................. 44
V. Recommendations ...................................................................... 47
VI. Closing remarks .......................................................................... 49
References ............................................................................................ 50
5List of Figures
Figure 1: Relationship between on-road fuel efficiency, tested fuel efficiency, etc ...................... 14
Figure 2: CAFE standards.......................................................................................................................... 18
Figure 3: Revised fuel economy label ..................................................................................................... 19
Figure 4: The Reformed CAFE targets .................................................................................................. 20
Figure 5: Illustration of GHG Emissions from Light Duty Vehicles ............................................. 21
Figure 6: Chinese standards and vehicles’ fuel efficiency performances .......................................... 22
Figure 7: Australian Average Fuel Consumption and FCAI Targets ............................................. 23
Figure 8: CO2 Emissions ............................................................................................................................ 26
Figure 9: Average Vehicle Mass of Japanese Fleet............................................................................... 27
Figure 10: Fuel efficiency performance of HDVs in Japan ................................................................. 30
Figure 11: Example of vehicle shapes with similar fuel efficiencies and different footprints .... 35
Figure 12: Magnitude of Improvements using Current and Proposed Standards....................... 38
Figure 13: Magnitude of Improvements using Current Policy Initiative ...................................... 38
Figure 14: Trend of fleet average vehicle masses and fuel efficiencies ............................................ 39
Figure 15: Fuel efficiency and mass trends (1990=1) .......................................................................... 40
Figure 16: Death Rate and Serious Injury Rate of Car-to-car Collisions........................................ 41
List of Tables
Table 1: Average LDV on-road fuel efficiency in 2004 and 2030 .................................................. 13
Table 2: Implementation of policy measures for technical fuel efficiency improvement ........... 15
Table 3: 2015 Standards for Passenger Vehicles ................................................................................ 17
Table 4: Gas Guzzler Tax ........................................................................................................................ 19
Table 5: Outcome of Voluntary and Regulatory Programs ............................................................. 28
List of Boxes
Box 1: Is fuel efficiency standard necessary for freight vehicles?.................................................... 30
Box 2: Comparison of Weight-based Standards and Size-based Standards.................................. 34
Box 3: Policies for Average Fleet Mass Management ....................................................................... 41
6Executive Summary
In response to threats posed to the future supply of energy and to the environment, the G8
leaders agreed to an initiative called the Gleneagles Plan of Action (GPOA)1 which addresses
climate change, clean energy and sustainable development. In the GPOA, G8 leaders pledged
to encourage the development of cleaner, more efficient and lower-emitting vehicles, and to
promote their deployment by, among other means, asking the IEA to review existing
standards and codes for vehicle efficiency and to identify best practices. Since then, the IEA
has been engaged in a programme of work for the G8 including a study on existing standards
and best practices in reducing vehicle fuel use, and submitted, at the G8 Hokkaido Toyako
Summit meeting in July 2008, 25 recommendations as a comprehensive response to the
GPOA. The G8 leaders, in the summit document, have declared that they “will maximize
implementation of the IEA's 25 recommendations on energy efficiency.” This paper has been
written to provide one aspect of the IEA response.
There are significant potentials for saving energy in the transport sector. The IEA’s Energy
Technology Perspectives (ETP) 2008 projects that the fuel economy of new light-duty vehicles
could be improved by 50% by 2030 using cost effective technologies, including but not limited
to hybridization. This would result in close to a half million tonne (oil equivalent) reduction
in fuel use and close to 1 Gt annual reduction in CO2, nearly doubling by 2050 as improved
vehicles fully penetrate the stock. However, in order to achieve these energy savings,
appropriate and effective policies and measures should be introduced.
This paper, in response to the above-mentioned G8 request, reviews past and current
voluntary and regulatory fuel efficiency programs and then assesses the effectiveness of these
policies from the viewpoints of enforcement, standard design, standard stringency and
standard related policies. The results of this review are as follows:
Findings
Finding 1: Voluntary vs. Regulatory Measures
While both voluntary and regulatory measures have been widely introduced to improve
vehicle fuel efficiency, the results have been mixed. On the one hand, voluntary programs
have generally fallen short of their targets. On the other hand, mandatory programs produced
decent results, although their effectiveness seems to depend on the ways in which the policies
were designed. In most cases, mandatory targets achieved their goals, although in one case,
overall fleet average fuel efficiency deteriorated partly because of perverse effects in the standard
design.
As a result of the general ineffectiveness of voluntary programs to constrain vehicle energy
efficiency, there is a general trend away from them. Japan switched from a voluntary program
1 This agreement was developed at the G8 Summit meeting in Gleneagles, the United Kingdom in 2005.
7to a regulatory one in 1999, as did Korea in 2005. The European Union and Canada are also
considering such a change.
Regulatory measures could have played a role in deterring the ever-increasing trend of fleet-
average vehicle weight that can be seen worldwide. In some cases, a regulatory measure
prompted manufacturers to apply innovative technologies to vehicles to make them more
efficient, rather than bigger and more powerful, and thus heavier.
Finding 2: Attributes of an Effective Standard
Scope
Both the range of vehicles to which a standard applies in a vehicle category, such as the
passenger car category, and the coverage of vehicle categories are closely related to the
effectiveness of the standard. In general, standards with a broader scope (e.g. covering a
greater range of vehicle types) tend to lead to greater fuel savings. However, broadening the
scope of a standard may increase the administrative cost of testing vehicles. Some
manufacturers – especially those of light duty vehicles – can reduce such costs by producing
large amounts of the same type of vehicles. Others (e.g. some small-volume truck
manufacturers) need to find ways to decrease the costs of the testing, by utilizing new
methods, such as computer simulation, for example.
With the exception of Japan, standards for heavy duty vehicles have not yet been introduced.
Based on the Japanese experience, it appears that such standards could result in fuel savings
world wide although some further in-depth analysis is needed to confirm this.
Testing procedures
What makes a good testing procedure? Consumers expect the tested fuel efficiency values to
be similar to the fuel efficiency values they experience on road. In order to move in that
direction, test procedures should reflect as many factors affecting the value of the fuel
efficiency as possible. These requirements must be balanced against the increased cost of
testing.
Fuel efficiency values are generally tested with the same or similar test procedures used to
test local pollutant emissions of vehicles. This is done in part because it is an effective way to
reduce the cost of testing and because some technologies for improving fuel efficiency can
adversely affect the amount of local pollutant emissions.
There have also been some efforts to harmonize at least some aspects of testing procedures.
This would be another effective way of reducing costs although it would be very difficult to
achieve, especially in the short term. Eventually there could be large benefits from an
internationally harmonized test procedure, allowing countries around the world to use similar
libelling systems and adopt similar regulatory systems (or at least systems based on similar
measurements).
8Technology neutrality
Fuel efficiency standards are usually set to require the same level of efficiency regardless of
the technologies that vehicles adopt. There are, however, cases where requirements are
established on the basis of the technology used. In general, setting requirements that favour
one kind of energy efficiency technology over another will distort technology development.
Regulatory flexibility
Regulatory policies can suffer from being inflexible. Existing regulatory measures generally
try to use a range of mechanisms such as manufacturer fleet averaging, attribute based
targets, weighted average criteria and credit trading systems to increase policy flexibility. In
general, high degrees of regulatory flexibility allow more stringent targets to be met at lower
cost (compared to less flexible approaches). Lead time would also be an important factor for
lowering the cost.
Attribute based standards can offer the possibility that standards can get much closer to
economic efficiency and may be more likely to ensure greater fairness among all automakers.
Although they would not necessarily ensure the achievement of an overall improvement for
vehicle fuel efficiency (as such standards are subject to weight or size shifts), a standard
design in which relatively stringent requirements are imposed on heavier and bigger vehicles
could solve at least part of this concern.
Flexible measures can bring some regulatory costs. In order to properly implement a credit
trading system, for example, credits must be tracked and all related data such as registration
data should be available within a short period of time.
Finding 3: Standard Stringency
There are several approaches to setting the level of stringency of a policy. The approach that
guides part of the European Commission and NHTSA’s policy is to set the level of ambition
at the point where the increased retail cost of the vehicle is offset by savings from reduced
fuel consumption. This cost effectiveness analysis depends largely on expectations of existing
and emerging technologies (cost and effectiveness), and financial considerations such as
discount rates and payback period. An alternative approach is the Japanese Top-Runner
programme, in which stringency is based on the performance of the best in each weight class
on the market. Under this program, the value of the mass produced vehicle with the highest
fuel efficiency is used as a base value and factors such as fuel saving potential of future
technologies are taken into consideration afterward.
Given that vehicle manufacturers are global entities and fuel efficiency technologies spread
around the globe rapidly, governments could also look to the situation in other countries and
regions for additional guidance. Although detailed country-by-country analysis is crucial and
direct comparison of standard stringency would be a considerable challenge in light of
different test procedures and other factors, governments could nonetheless refer to fuel
efficiency improvement rates achieved and targeted in other countries or regions as a starting
point.
9Finding 4: Standard-related policies
Labelling
Governments have been asking manufacturers to introduce labelling schemes with the hope
that they will lead to fuel savings and various labelling schemes have been introduced, though
in isolation these appear unlikely to lead to significant fuel efficiency improvements. However,
fuel efficiency labels do help consumers compare vehicle choices, and might particularly
influence choices between otherwise similar vehicles that have different fuel efficiency ratings.
Financial incentives
Differentiated financial incentives based on tested fuel efficiency or CO2 emissions would be
effective tools to stimulate demand for fuel efficient vehicles, particularly when coupled with
good labelling programs. It can provide additional stimulus to producers and consumers to go
beyond simply the attainment of designated targets. Such incentives could take the form of a
tax deduction based on the fuel efficient performance, a fee for less fuel efficient cards or a
“feebate” which is a combination of rebates for fuel efficient cars and the fees. Given the fact
that some technologies for improving fuel efficiency have a negative impact on local pollutant
emissions, performance in reducing local pollutant emissions could also be taken into
consideration when certifying vehicles for financial incentives.
Recommendations
Recommendation 1: Voluntary vs. Regulatory Measures
In order to achieve significant energy savings in the transport sector, governments should
introduce regulatory fuel efficiency standards.
Recommendation 2: Attributes of an Effective Standard
Scope
The scope of the policy framework should be broad enough to at least cover all light duty
vehicles and should not allow “leakage” into categories not covered by standards. Broadening
the scope to include other vehicles, such as heavy duty vehicles, should also be considered.
Test procedure
Test procedures should reflect as many factors that affect the “on-road” value of fuel efficiency
as possible. At the same time, in order to lower the cost of testing vehicles, test procedures for
fuel efficiency standards should be the same as, or as similar as possible to, the procedures for
local pollutant emission regulation. In addition, governments should consider the
harmonization of test procedures and participate in related international harmonization
activities in UNECE/WP29 (World Forum for Harmonization of Vehicle Regulations).
10Technology neutrality
Unless there are clear reasons for not doing so, requirements should be based on reaching a
targeted fuel efficiency performance level and not based on promoting particular technologies.
Regulatory flexibility
Policy mechanisms for increasing regulatory flexibility, such as attribute-based targets,
weighted average criteria, credit trading systems and appropriate lead times, should be
considered in order to improve fuel efficiency with less cost. The best type/types of flexibility
and optimal form of a regulatory system may vary depending on the particular concerns and
other national circumstances within a country (e.g. concerns about equity among
manufacturers).
Recommendation 3: Standard stringency
Governments should consider as high a fuel efficiency improvement rate as is currently set in
any country or region, while taking into account, among other factors, costs and other
(possibly conflicting) policy objectives such as emission regulations and compliance methods. 2
Optimally, the standard should be set at a level that maximizes net social benefit, though it is
acknowledged that this may not be easy to identify.
Recommendation 4: Standard related policies
Labelling
Governments should continue to explore effective ways of labelling. If possible, the labels
themselves should be consistent across countries that adopt similar labelling schemes.
Financial incentives
Governments should note that differentiated financial incentives such as a tax deduction
and/or a fee or a “feebate” based on fuel efficient performance can be useful to complement
fuel efficiency standards. Moreover, fiscal incentives can also be designed in a multi-attribute
approach, taking into consideration local pollutant emissions and other factors that have a
trade-off relationship with fuel efficiency performance, when rating and certifying vehicles for
financial incentives.
2 It should be noted that what this paper recommends is different from Uniform Percentage
Improvement (UPI), which requires each manufacturer to achieve the same percentage increase in fuel
efficiency. UPI could have the advantage of keeping a fleet averaging approach while allowing different
manufacturers to face a target relevant to their position in the market. But it could also place a heavier
burden on smaller vehicle manufacturers or discourage manufacturers from deploying more fuel
efficient technologies, out of fear that they may face more stringent requirements in the future. This
paper recommends that the stringency level of standards be set while taking the annual improvement
rate of other regions and other factors into consideration, and that the same standards be applied
nationwide to all manufacturers once they are set.
11I. Introduction
Background
Road vehicles dominate global oil consumption and are one of the fastest growing energy end-
uses. The transport sector is responsible for nearly 60% of world oil demand and road
transport accounts for nearly 80% of the total transport energy demand. (World Energy Outlook
2007, page 222) Transport accounts for around 25% of energy-related carbon dioxide (CO2)
emissions. Reducing the fuel used for transportation is therefore among the highest priorities
in all IEA member countries.
However, reducing fuel consumption in the transport sector has proven to be a difficult task.
Furthermore, current policies are insufficient to stop road vehicle energy use rising above
current levels. Even if governments were to actually implement all the measures that are
currently being considered, road vehicle energy use and CO2 emissions would still rise through
to 2030 at 1.4% and 1.3% per annum, respectively, under scenarios developed in the World
Energy Outlook 2006, (page 223). Potential fuel shortages and international commitments to
reduce CO2 emissions are now prompting countries to reconsider their policies to improve
vehicle fuel economy.
At their 2005 Summit in Gleneagles, the United Kingdom, G8 leaders recognized that energy
use in the transport sector is a crucial element of any sustainable development policy. They
agreed to the G8 Gleneagles Plan of Action (GPOA), which covers key actions necessary to
achieve sustainable development by mitigating climate change and promoting the use of clean
energy sources. In the GPOA, they pledged, inter alia, to encourage the development of cleaner,
more efficient vehicles. To this end, the G8 leaders asked the International Energy Agency
(IEA) to review existing standards and codes for road vehicle efficiency and to identify
practices that effectively reduce energy use.
Since 2005, the IEA has been engaged in a programme of work for the G8 addressing the
challenges of climate change, clean energy and sustainable development in which, among other
studies, analysis on existing standards and best practices in reducing vehicle fuel use has been
carried out. The IEA, based on the result of the programme of work, submitted 25
recommendations on energy efficiency at the G8 Hokkaido Toyako Summit meeting in July
2008 as a comprehensive response to the GPOA. The G8 leaders, in the summit document,
have declared that they “will maximize implementation of the IEA's 25 recommendations on
energy efficiency.”
World Energy Outlook Energy Savings Potential
According to the Alternative Policy Scenario (APS) of the World Energy Outlook 2006 (WEO) ,
which assumes that the policies and measures that governments are currently considering to
enhance energy security and mitigate CO2 emissions would be fully implemented, the average
on-road fuel efficiency for new light duty vehicles (LDVs)would be improved from 10.7 km/l in
2004 to 16.1 km/L in OECD countries, 10.0 km/l to 14.3 km/l in transition economics, and
9.7 km/l to 14.1 km/l in developing countries.
12Table 1: Average LDV on-road fuel efficiency in 2004 and 2030
2004 (km/l) 2030 (km/l)
OECD 10.7 16.1
North America 8.6 12.8
Europe 13.0 19.6
Pacific 11.6 17.5
Transition economies 10.0 14.3
Developing countries 9.7 14.1
China 8.8 13.3
India 9.9 14.1
Brazil 11.0 16.1
Based on these figures, worldwide fuel use for LDVs could be lowered by 15% or CO2
emissions decreased by 590 Mt by 2030 if the policies and measures were to be fully
implemented.3
The WEO APS 2006 did not take into account the latest policy announcements, including the
following: Japan’s new fuel efficiency standards for LDVs issued in July 2007, the European
Commission’s proposed legislation to reduce average CO2 emissions of new passenger cars to
120 g/km by 2012, the Energy Independence and Security Act of 2007 of the United States
that requires fuel economy standard of 35 miles per gallon (mpg) by 2020, the European
Commission’s proposed research and development (R&D) support program, which aims to
reduce CO2 emissions to 95g CO2/km (25.3-28.1km/l) by 2020, and so forth. These additional
policies can be expected to further drive fuel efficiency improvements.
The IEA Energy Technology Perspectives 2008 takes matters a step further: it estimates a cost-
effective technical potential for fuel economy improvement of 50% (50% reduction in new
vehicle fuel use per kilometre) by 2030. This would be challenging to achieve, but its
accomplishment would result in close to a half million tonne (oil equivalent) reduction in fuel
use and close to 1 Gt annual reduction in CO2, increasing thereafter as older stock is phased
out. Achieving such a target should be possible, but it will require strong policies that
maximize technology uptake and minimize fuel economy losses due to increases in vehicle size,
weight and power. In the ETP “Blue Map” scenario, improvement in fuel economy is clearly
one of the most important and cost effective measures available for transport, and plays an
important role in achieving an overall CO2 reduction target of 50% below 2005 levels by 2050
across energy sectors.
The purpose of this paper
The purpose of this paper is to provide a solid foundation for a comprehensive response to the
above-mentioned G8 request. Therefore, the paper reviews the effectiveness of voluntary
target and regulatory standard programs aimed at accelerating the deployment of more fuel
efficient vehicle technologies. The paper also seeks to quantitatively compare vehicle efficiency
programs, where possible. In the course of conducting the review, it is also necessary to
explore the attributes of effective standards, their stringency, and related policies, including
financial incentives in individual countries.
3 It is assumed that the improvement rate of on-road fuel efficiency in each region is constant.
13This paper naturally focuses on G8 countries, but also includes information about programs in
China, Korea and Australia.. Some of the selected countries have over 30 years of experience
with policies to improve vehicle fuel efficiency. The range of policies is dramatic, ranging from
hands-off approaches (doing nothing is a kind of policy), to voluntary programs to strict
mandatory regulations. It is therefore reasonable to consider which past and present policies
have resulted in outstanding outcomes and which have not. The answer to this question will
help IEA member countries – indeed, all countries – formulate more effective programs to
improve the energy efficiency of their vehicles.
Improving the technical efficiency of vehicles or the tested fuel efficiency is only one element of
a comprehensive program to reduce fuel use and CO2 emissions from motor vehicles. For
example, as Figure 1 shows, real “on-road” fuel efficiency is also strongly affected by driving
behaviour and the fuel efficiency of vehicle non-engine components not considered in the fuel
efficiency test. To be most effective, technical efficiency improvements need to be combined
with other policies such as those to increase on-road fuel efficiency, reduce the distances
travelled by private vehicles, change the mix of vehicles providing trips, promote conversion to
fuels with lower carbon content, and shift trips to public transport. More specifically, additional
policies, including promotion of eco-driving, fuel taxes, creation of public transit, and regional
planning, will be needed to encourage greater reliance on high quality communication in place
of physical trips. These aspects are not addressed in this paper since this was not requested by
the G8 at this time. It is anticipated that future IEA papers will investigate energy policies
beyond those affecting vehicles themselves.
Figure 1: Relationship between on-road fuel efficiency, tested fuel efficiency, etc.
on-road fuel efficiency
fuel efficiency driving
tested fuel efficiency of components behaviour
The focus on efficiency also means that the relative merits of specific future vehicle
technologies such as hybrids/batteries, bio-fuels, and future fuel cells, etc., which may each play
a major role in road transport in the future, are not addressed in this paper. In general it is
recognized that there is an urgent need to implement new measures that will empower a more
secure, environmentally acceptable energy system. Developing and reducing the cost of
innovative technologies will involve time; improving vehicle fuel efficiency ought to be a first
step in this campaign. These policies make economic sense, produce energy savings and
provide time to develop and reduce the costs of the above-mentioned, innovative technologies.
Organisation of this paper
The paper first reviews the recent history of voluntary and mandatory fuel efficiency programs.
It then assesses the effectiveness of policies to improve fuel efficiency with respect to the nature
of measures, standard design, standard stringency and standard related policies. Based on
these assessments, it offers conclusions and recommendations.
14II. Current Policies to Improve vehicle fuel efficiency
Introduction
Several countries have some sort of policy to improve the technical fuel efficiency of their
vehicle fleets. However, the particular measures employed to fulfil such policies differ markedly
from country to country.
The most common measures to improve technical fuel efficiency are:
• Regulatory standards;4
• Voluntary targets;
• Financial incentives; and
• Consumer information.
Most countries rely on a combination of the above in seeking to fulfil their policy aims. Table 2
presents the policy measures used in the European Union, Japan, the United States, Canada,
China, Korea and Australia. Each economy’s approaches will now be discussed.
Table 2: Implementation of policy measures for technical fuel efficiency improvement
Regulatory Voluntary Vehicle tax Consumer
standards targets differentiation information
EU pl* im* pl** im
Japan im im im
United States im im im
Canada pl im* im
China im im im
Korea im im im
Australia im im
im = implemented
pl = planned or under consideration
* Voluntary and Regulatory measures in EU are on CO2, not directly on fuel efficiency.
Similarly, Voluntary target in Canada is on GHG.
** Several EU member states have already implemented the tax systems and the
European Commission is currently calling for harmonization of the systems.
The European Union
While there was a clear trend toward fuel efficiency improvements up to the mid-1980s,
average fuel efficiency remained the same from then until the mid-1990s. These trends
occurred during relatively low fuel prices and in the absence of a fuel efficiency standard. In
4This paper distinguishes between voluntary targets on the one hand and regulated,
mandatory targets on the other.
15December 1995, in light of concerns regarding the lack of progress in further improving the
fuel efficiency of cars, the European Commission proposed a strategy to reduce CO2 emissions
from passenger cars towards the average fuel-efficiency target of 120g CO2/km with a time
horizon beyond 2005 for the attainment.
In the late 1990s, the European Commission agreed with the European Automobile
Manufacturers’ Association (ACEA), the Japan Automobile Manufacturers’ Association
(JAMA) and the Korean Automobile Manufacturers’ Association (KAMA) that each association
would commit to the same quantified CO2 emission objective for the average new passenger
car sold in the EU. The content of the commitments was that the members of each of these
associations should collectively achieve a CO2 emission target of 140g CO2/km by 2008
(ACEA) or by 2009 (JAMA and KAMA). The matter of how to share the burden of the
objective between the different manufacturers within an association was left to each association
itself to decide.
EU directive 1999/94/EC adopted in 1999 gives EU countries the authority to require
mandatory labels indicating information on the fuel economy and CO2 emissions of light duty
vehicles to be displayed on LDVs sold within their borders and therefore enables vehicle
purchasers to make an informed choice. According to the directive, the information must be
provided to consumers in the following ways:
• A fuel economy and CO2 emissions label for all new cars must be displayed at the point
of sale.
• A poster (or a display) showing the official fuel consumption and CO2 emission data of
all new passenger car models must be displayed at the respective point of sale.
• A guide on fuel economy and CO2 emissions must be produced on at least an annual
basis.
• All promotional literature must contain the official fuel consumption and specific CO2
emission data for the passenger car model to which it refers.
In addition, thanks to the directive, a number of organisations in EU member states maintain
Internet sites which display the official fuel consumption and CO2 emissions of new passenger
car models offered on their regional markets. In spite of this, there is no harmonized format for
labels so that different labels can be seen in different member states. Furthermore, there are
currently no common energy or CO2 performance thresholds in place across the EU.
Additional measures, notably financial incentives, have been introduced in several member
states and recognized by the European Commission as necessary to reduce CO2 emissions from
new passenger cars and to meet the Community target of 120 grams CO2/km. In 2005, the
European Commission made a proposal for a Council Directive on passenger car related taxes
that aims, inter alia, at introducing a CO2 element in the calculation of car taxes for those
member states that have such taxes. (To-date, it has not yet been adopted.)
Japan
The Japanese government has twice introduced non-binding fuel efficiency targets. The first
target was set in 1978, with the target year of 1985, and the second one in 1990, with the
target year of 2002.
In 1998, the Law concerning the rational use of energy (Energy Conservation Law) was
amended. The amended law provided for the introduction of regulatory “Top Runner”
16standards and the mandatory display of energy efficiency values, and so forth, for various
machineries, including passenger vehicles and freight vehicles. According to this law, standards
are determined based on the performance of the vehicles whose performance is the best (“Top
Runner”) in the national market and on a range of other factors.
Fuel efficiency standards using the “Top Runner” method were first introduced in 1999 for
light duty vehicles (gasoline vehicles and diesel vehicles). They were followed by a series of fuel
efficiency standards: standards for LPG vehicles were introduced in 2003, and in 2006
standards for heavy duty vehicles (diesel vehicles) were introduced for the first time in the
world. Currently, all light duty vehicles (passenger cars and light freight vehicles [vans]) and
heavy duty diesel vehicles are covered by the legislative framework. In 2005, the government
set up a committee to establish new fuel efficiency standards for light duty vehicles and in 2007,
the new standards were made public. Now, there are two groups of targets (“incumbent” 2010
standards and new 2015 standards) for light duty vehicles. Table 3 shows the 2015 standards
for passenger vehicles.
Table 3: 2015 Standards for Passenger Vehicles
target standard value
Class vehicle weight (kg)
(km/l)
1 0 - 600 22.5
2 601 - 740 21.8
3 741 - 855 21.0
4 856 - 970 20.8
5 971 – 1 080 20.5
6 1 081 – 1 195 18.7
7 1 196 – 1 310 17.2
8 1 311 – 1 420 15.8
9 1 421 – 1 530 14.4
10 1 531 – 1 650 13.2
11 1 651 – 1 760 12.2
12 1 761 – 1 870 11.1
13 1 871 – 1 990 10.2
14 1 991 – 2 100 9.4
15 2 101 – 2 270 8.7
16 2 271 - 7.4
The law also requires manufacturers to provide information on the fuel efficiency of vehicles
through labelling. Fuel efficiency values are accompanied by CO2 emission values converted
from the fuel efficiency values, although people are generally more accustomed to fuel efficiency
values provided in the unit of kilometre per litre (km/l).
In addition, in order to further stimulate consumer interest in fuel efficiency performance and
to encourage the wide deployment of fuel efficient vehicles, the vehicle fuel efficiency
certification program was implemented in April 2004. Under the program, vehicles are ranked
according to their fuel efficiency performance and certified in four levels (initially vehicles were
certified in two levels, and it was expanded to four levels in 2006) - the level meeting the target
and the levels exceeding the target by 5%, 10% and 20%. Manufacturers can attach the certified
stickers showing the vehicle’s fuel efficiency performance level to the rear windows of the
vehicles.
17Furthermore, in an effort to tackle global and local environmental issues, a tax reduction
incentive for both fuel efficient and less polluting vehicles was introduced in 2001 to accelerate
wider deployment of more fuel efficient and cleaner vehicles.
The United States
In 1975, the Energy Policy and Conservation Act was enacted into law by Congress, and the
CAFE program, under which mandatory fuel economy standards are set for passenger car and
light truck fleets, was established.
CAFE is “the sales weighted average fuel economy, expressed in miles per gallon (mpg), of a
manufacturer’s fleet of either 1) passenger or 2) light trucks up to 8 000 pounds (3 632 kg)5
gross vehicle weight rating (GVWR) produced in the United States over any particular model
year (MY).” The values are determined by computing the weighted fuel economy average of
the various model types of a manufacturer in a model year.
The short-term goal of the Act was to double new car fuel economy by model year 1985 (to
27.5 mpg.6 Congress set fuel economy standards for some of the intervening years. For the
post-1985 period, Congress provided for the continued application of the 27.5 mpg standard for
passenger cars, but gave the Department of Transportation (DOT) the authority to set higher
or lower standards. For light trucks, Congress did not specify a target for the improvement of
their fuel economy. Instead, it provided that light truck standards should be set at the
maximum feasible level for MY 1979 and each model year thereafter. Consequently, light truck
fuel economy standards have been established by the National Highway Traffic Safety
Administration (NHTSA) of DOT for MY 1979 through MY 2007. CAFE standards up to MY
2007 are shown in Figure 2.
Figure 2: CAFE standards
Source of data: NHTSA
5 from 2011, 10 000 pounds (4 540 kg)
6 Equivalent to 11.7 km/l (1 mpg = 0.425 km/l)
18In the United States, fuel economy estimates have been provided for more than 30 years to
consumers as a tool to help shoppers compare different vehicles. The labelling includes
information comparing the fuel efficiency of different vehicles, expected on-road fuel efficiency
and estimating annual fuel cost. Figure 3 shows the revised fuel economy label that will appear
on vehicle window stickers beginning with 2008 models.
Figure 3: Revised fuel economy label
The Gas Guzzler Tax was established by the Energy Tax Act of 1978. The purpose of this tax
is to discourage the production and purchase of fuel inefficient vehicles. The tax applies only to
passenger cars – trucks, minivans, and SUVs are not covered. Table 4 shows vehicle fuel
efficiencies and amount of taxes.
Table 4: Gas Guzzler Tax
Fuel efficiency (mpg) Tax
at least 22.5 No tax
at least 21.5, but less than 22.5 $1000
at least 20.5, but less than 21.5 $1300
at least 19.5, but less than 20.5 $1700
at least 18.5, but less than 19.5 $2100
at least 17.5, but less than 18.5 $2600
at least 16.5, but less than 17.5 $3000
at least 15.5, but less than 16.5 $3700
at least 14.5, but less than 15.5 $4500
at least 13.5, but less than 14.5 $5400
at least 12.5, but less than 13.5 $6400
less than 12.5 $7700
In April 2006, the NHTSA published a rule making for a reform of the structure of the CAFE
program for light trucks (the Reformed CAFE), as well as standards for model year 2008-2011.
19Under the Reformed CAFE system, each light truck manufacturer is required to achieve the
level of CAFE which is based on each vehicle’s target level, set according to vehicle size. The
targets are assigned according to the vehicle’s “footprint” (the product of the average track
width multiplied by the wheelbase). Each vehicle is assigned to a target specific to the footprint
value shown in Figure 4.
Figure 4: The Reformed CAFE targets
Source: NHTSA
Canada
As the Canadian automobile markets are highly inter-linked with the US markets, fuel
efficiency of the Canadian vehicle fleet could have been affected by US policy development.
In Canada, a number of voluntary agreements on vehicle fuel efficiency have been implemented
since the late 1970s. These include three Memoranda of Understanding (MOUs) signed
between Natural Resources Canada (NRCan), and manufacturers associations and a dealers
association in late 1995 to early 1996, and an MOU signed between NRCan and domestic and
international vehicle manufacturers in 2005.
The Transport Canada Voluntary Motor Vehicle Fuel Consumption Program, originally
established in 1975, sets minimum levels of fuel efficiency performance for the auto industry.
Separate levels are set annually for new passenger cars and for new light duty trucks. A
company’s performance is measured by averaging fuel efficiency across its fleet. Although the
targets are voluntary ones, the levels of the targets have been harmonized with US fuel
economy standards.
An MOU between the Motor Vehicle Manufacturers’ Association (MVMA) and NRCan
concerning motor vehicle fuel efficiency was designed to support and enhance the important
role that fuel efficiency improvements can play in reducing greenhouse gas (GHG) emissions
across the transportation sector. According to NRCan, the most cost-effective method of
realizing such improvement is through a balanced approach aimed at vehicle owners and
20operators, as well as vehicle technology. Similar MOUs were signed between NRCan, and the
Association of International Automobile Manufacturers of Canada (AIAMC) and the Canadian
Automobile Dealers Association (CADA).
Additionally, an MOU between the NRCan, and the Canadian Vehicle Manufacturers’
Association (CVMA) and AIAMC was made in 2005 to further reduce GHG emissions. It calls
on the automotive industry to reduce GHG emissions from light duty vehicles, so that annual
reductions of 5.3 Mt will be achieved in 2010. Figure 5 illustrates GHG emission from LDVs
which is expected to be stabilized at the 2005 level.
In November 2007, the Motor Vehicle Fuel Consumption Standards Act was proclaimed to
enhance the Government of Canada’s authority to regulate GHGs from vehicles after the
expiry of the MOU between the NRCan, and CVMA and AIAMC. Regulations would take
effect for the 2011 model year.
Figure 5: Illustration of GHG Emissions from Light Duty Vehicles
Source: Joint Government-Industry GHG MOU Committee, Canada
The National Development and Reform Commission announced in 2004 that it would
introduce mandatory fuel efficiency standards for passenger cars. One of the objectives of these
standards is to mitigate China’s increasing dependence on foreign oil. The standards have two
implementation phases: Phase 1 took effect in 2005 and Phase 2 will take effect in 2008.
The standards are classified into 16 categories based on vehicle weight. Standard values are set
for each category. In addition, there are different standard values for manual transmissions and
automatic transmissions. Compared with the Japanese regulation, which also has weight based
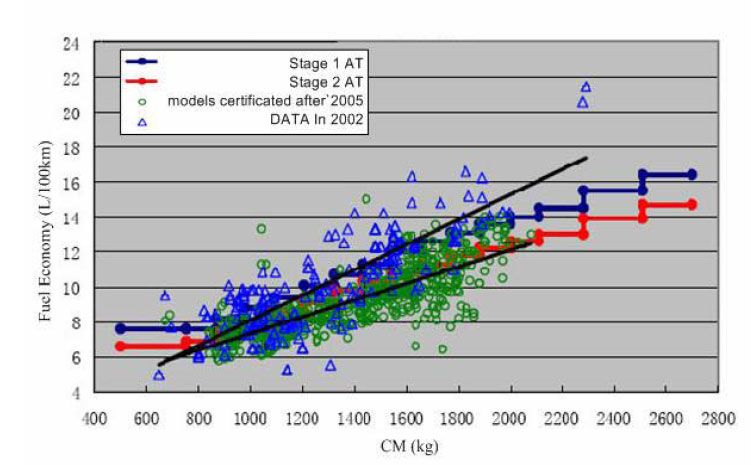
categories, the Chinese standards tend to be harder on heavier vehicles than lighter ones. The
figure below shows the phase 1 and phase 2 standard values for vehicles with automatic
transmissions and fuel efficiency performances of vehicles sold in 2002 and those certified after
2005.
In order to be able to market a certain type of vehicle, manufacturers have to get the vehicle
type certified to comply with the standards. The standard values are maximum allowable limits
for each vehicle type, not the limits for the fleet average of the categories.
21Figure 6: Chinese standards and vehicles’ fuel efficiency performances
Source: IEA workshop presentation (2007) presented by Energy Foundation
Korea
Fuel efficiency targets have been in place in Korea since the 1990s. In addition, based on the
Energy Utilization Rationalization Act, the Average Fuel Economy program and fuel economy
rating identification of motor vehicles were introduced in 2005.
Current fuel efficiency targets are as follows with the target year of 2009:
25.1 km/l for displacement equal to 800cc or less,
22.3 km/l for displacement exceeding 800cc, and equal to 1 100cc or less,
19.4 km/l for displacement exceeding 1 100 cc, and equal to 1 400 cc or less,
18.2 km/l for displacement exceeding 1 400 cc, and equal to 1 700 cc or less,
13.5 km/l for displacement exceeding 1 700 cc, and equal to 2 000 cc or less,
12.4 km/l for displacement exceeding 2 000 cc, and equal to 2 500 cc or less,
10.8 km/l for displacement exceeding 2 500 cc, and equal to 3 000 cc or less, and
9.9 km/l for displacement exceeding 3 000 cc.
In 2005, this policy was strengthened so that the minister in charge may now make public the
instances in which a manufacturer does not meet the designated target.
Furthermore, in order to strengthen the above-mentioned policies, the Average Fuel Economy
program – similar to the US CAFE program − was also introduced in 2005 and applies to
domestic vehicle manufacturers who have sold more than 1000 passenger cars annually. It is
also likely to be applied to imported car manufacturers from 2010. The reference average fuel
economy standards are 12.4 km/l for vehicles with engine displacement of 1 500cc or less, and
9.6 km/l for displacement exceeding 1 500cc. A credit calculated by specific formula may be
granted. Vehicles are tested using the FTP 75 cycle (a test procedure used for US City mode).
If a manufacturer falls short of the referenced average fuel economy, the minister in charge
may issue an order of improvement. And if the order is not respected, he or she may announce,
22among other things, the name of the manufacturer and a detailed model list, along with the
degree of non-compliance against the referenced fuel economy.
Finally, a labelling scheme with fuel economy rating identification was also introduced in 2005.
By virtue of this scheme, all passenger cars are required to display a “fuel economy label”,
which indicates the car’s fuel economy rank (1-5) and its fuel economy (km/l).
Australia
The Federal Chamber of Automotive Industry (FCAI), which is an organisation representing
the automotive industry in Australia, has developed a voluntary Code of Practice for reducing
the fuel consumption of new passenger cars. The code commits FCAI members to a voluntary
target of 6.8L/100km for petrol passenger cars by 2010. This represents an 18% improvement
in the fuel efficiency of new vehicles between 2002 and 2010. The government reached
agreement with the FCAI in 2003 on this voluntary target. The FCAI had previously adopted
two voluntary codes of a similar nature, which included voluntary targets (Figures 7).
Figure 7: Australian Average Fuel Consumption and FCAI Targets
Source: Pew Centre
On a related issue, a mandatory fuel consumption labelling scheme was introduced in 2001.
The scheme applies to:
• new passenger cars up to 2.7 tons gross vehicle mass - from 1 January 2001 and
• all new vehicles up to 3.5 tons gross vehicle mass - from 1 January 2004.
Under this scheme, a fuel consumption label is required to be placed on the windscreen of all
new cars sold in Australia. These model-specific labels show the car’s fuel consumption in litres
per 100 km, and its CO2 emissions per kilometre.
The Fuel Consumption Guide provides information based on tests conducted in accordance
with Australian standards. Information for most models up to 2.7 tons, manufactured between
1986 and 2003, is available in an online database operated by the government and is publicly
accessible.
23Summary
Japan, China, Korea and the United States regulate the fuel efficiency of light duty vehicles by
way of standards. The United States has the longest history of mandatory fuel efficiency
standards, having introduced them in the mid-1970s. Japan followed in 1998 by adopting the
“Top Runner” standards, under which next generation vehicles must meet the level of fuel
efficiency of the current “top runner”, in other words, the most efficient vehicles. China
introduced regulatory standards for passenger cars in 2004, while Korea followed the next year.
The EU, Canada and Australia currently have voluntary programs for the promotion of vehicle
fuel efficiency and two of these are moving toward regulatory programs. The EU first agreed
on voluntary targets with industry associations in 1998. In December 2007, the European
Commission announced a proposed registration to reduce CO2 emissions from cars to
120g/km by 2012. A similar shift can be seen in Canada, which has an even longer history of
voluntary agreements with the auto industry, having initiated such processes in the late 1970s.
In November 2007, an act was passed to enhance the Canadian federal government’s authority
to regulate vehicle fuel efficiency. Regulations would take effect for the 2011 model year.
Australia introduced several voluntary agreements. The Australian government reached
agreement with industry in 2003 enact on the current voluntary targets; however, previous
agreements were not complied with.
Additionally, both the United States and Japan have tax incentive (or disincentive) programs.
Under the Japanese program, buyers of fuel efficient and less polluting vehicles are eligible to
receive a tax deduction, while in the United States, customers of gas guzzler vehicles pay an
additional tax levy.
Unlike many other regions, the EU regulates CO2 emissions, not fuel efficiency. From 2011,
Canada will regulate GHGs.
As mentioned above, each region has different policies to improve the technical fuel efficiency
of vehicles. The following section assesses the effectiveness of the various policy approaches by
analysing their binding power, standard design, standard stringency and standard-related
policies.
24III. Looking forward: identifying effective policies
As mentioned in Section I, the worldwide fuel consumption of LDVs could be lowered by as
much as 15% and CO2 emissions decreased by 590 Mt in 2030 if the policies and measures
currently being considered were to be fully implemented. Section II reviewed vehicle fuel
efficiency policies and measures, highlighting that selected countries tend to rely on a mix of
measures to encourage greater fuel efficiency. But, how effective are those policies? Are some
measures more effective than others, and/or have some countries been more successful in
implementing them than others? This section assesses the effectiveness of policies to improve
fuel efficiency with respect to nature of measures, standard design, standard stringency and
standard-related policies.
Voluntary programs
Voluntary programs were most popular during the 1980s and 1990s when it was generally
thought that less government intervention would be appropriate to accomplish the greatest
improvements in fuel efficiency, and the need to save fuel and reduce CO2 emission seemed less
urgent.
The European Union
Voluntary agreements were made by ACEA in 1999 and by JAMA and KAMA in 2000. In
February 2007, the Commission issued a communiqué called “Results of the review of the
Community Strategy to reduce emissions from passenger cars and light-commercial vehicles.”
In the communiqué, the Commission used, among other things, Figure 8, which illustrates
CO2 emissions from cars in Europe and concluded as follows:
Emissions from the average new car sold reached 163 g CO2/km in 2004, 12.4% below
the 1995 starting point of 186 g CO2/km. Over the same period, new cars sold in the
EU became significantly bigger and more powerful, while prices increased less than the
rate of inflation.
Investigations into the impact of the limited demand side measures adopted thus far by
member states indicate that improvements in car technology have delivered the bulk of
reductions.
The progress achieved so far goes some way towards the 140 g CO2/km target by
2008/2009, but in the absence of additional measures, the EU objective of 120 g
CO2/km will not be met by 2012. As the voluntary agreement did not succeed, the
Commission considers it necessary to resort to a legislative approach and has
underlined that in addition to the proposed legislation, urgent action should also be
taken by the public authorities to keep the emission reductions on track, also towards
2008/2009, for instance through fiscal incentives and green public procurement.
25You can also read