DECARBONISATION OPTIONS FOR THE DUTCH CEMENT INDUSTRY - C. Xavier, C. Oliveira - Manufacturing Industry Decarbonisation Data Exchange Network
←
→
Page content transcription
If your browser does not render page correctly, please read the page content below
DECARBONISATION OPTIONS
 FOR THE DUTCH CEMENT
 INDUSTRY

 C. Xavier, C. Oliveira

 25 March 2021

Manufacturing Industry Decarbonisation Data Exchange Network
Decarbonisation Options for the Dutch Cement Industry
© PBL Netherlands Environmental Assessment Agency; © TNO
The Hague, 2021
PBL publication number: 4339
TNO project no. 060.47868 / TNO 2021 P10108

Authors
C. Xavier and C. Oliveira

Acknowledgements
We would like to thank Rob Huydts (ENCI HeidelbergCement), Mark van Halderen (ENCI
HeidelbergCement), Kira West (TNO), Dick van Dam (PBL), and Ton van Dril (TNO) for their
help and valuable input.

MIDDEN project coordination and responsibility
The MIDDEN project (Manufacturing Industry Decarbonisation Data Exchange Network) was
initiated and is also coordinated and funded by PBL and TNO Energie Transitie. The project
aims to support industry, policymakers, analysts, and the energy sector in their common
efforts to achieve deep decarbonisation. Correspondence regarding the project may be
addressed to:
D. van Dam (PBL), Dick.vanDam@pbl.nl or S. Gamboa Palacios (TNO),
silvana.gamboa@tno.nl

Erratum
In this version a reference has been corrected to: Kudra, T., 2012. Energy Performance of
Convective Dryers. Drying Technology, 30(11-12), pp.1190-1198.

This publication is a joint publication by PBL and TNO Energie Transitie and can be
downloaded from: www.pbl.nl/en. Parts of this publication may be reproduced, providing the
source is stated, in the form: Xavier, C. & Oliveira, C. (2021), Decarbonisation Options For
The Dutch Cement Industry. PBL Netherlands Environmental Assessment Agency and TNO
Energie Transitie, The Hague.

PBL Netherlands Environmental Assessment Agency is the national institute for strategic
policy analysis in the fields of the environment, nature and spatial planning. PBL contributes
to improving the quality of political and administrative decision-making by conducting
outlook studies, analyses and evaluations in which an integrated approach is considered
paramount. Policy relevance is the prime concern in all of PBL’s studies. PBL conducts
solicited and unsolicited research that is both independent and scientifically sound.

TNO Energie Transitie has a twofold mission: to accelerate the energy transition and to
strengthen the competitive position of the Netherlands. TNO conducts independent and
internationally leading research and we stand for an agenda-setting, initiating and supporting
role for government, industry and NGOs.

This report has received contributions from ENCI HeidelbergCement. PBL and TNO remain
responsible for the content. The decarbonisation options and parameters are explicitly not
verified by the company.
Contents
Summary 4

INTRODUCTION 5
1 CEMENT PRODUCTION IN THE NETHERLANDS 6
2 CEMENT PRODUCTION PROCESS 8
2.1 Dutch Production Process 9

 2.1.1 Raw materials for the Dutch cement production 12
 2.1.2 Drying Process 14
 2.1.3 Dosage Process 14
 2.1.4 Grinding Process 14

2.2 Greenhouse gases emissions for the Dutch cement production 15
2.3 Overview of inputs and outputs of energy and materials 17

3 CEMENT PRODUCTS AND APPLICATION 18
3.1 Cement Products 18
3.2 Cement global market 19
3.3 Dutch cement market 21

4 OPTIONS FOR CEMENT DECARBONISATION 24
4.1 Primary Decarbonisation Alternatives 24

 4.1.1 Fuel Substitution - Drying 25
 4.1.2 Process Design Change – Grinding 30
 4.1.3 Alternative Feedstock – Clinker Substitutes 31

4.2 Other Decarbonisation Alternatives 35

 4.2.1 Sustainable clinker production 35
 4.2.2 Re-carbonation or CO2 uptake 36
 4.2.3 Efficient cement use in concrete 37
 4.2.4 Cement and concrete circularity 38

5 DISCUSSION 40
6 REFERENCES 42

 A MIDDEN report – PBL – TNO | 3
FINDINGS

Summary
The Dutch cement production takes place at the Eerste Nederlandse Cement Industrie
(ENCI), the first and only cement industry active in the Netherlands (since 1926). The
company is nowadays owned by the German multinational HeidelbergCement and has two
producing industrial plants, one located in Rotterdam and one based in IJmuiden. The
Rotterdam and IJmuiden industrial sites have a production capacity of 600 kilotonnes (kt)
and 1,400 kt of cement per year, respectively. They produce two main different types of
cement for the Dutch market, Portland cement (CEM I) and blast furnace slag cement (CEM
III). The main feedstock for cement production is clinker, which is not produced in the
Netherlands anymore. For this reason, the Dutch market is depending on imports of clinker
from other EU countries.

The production process of ENCI Netherlands consists of drying, dosing, and grinding. The
drying process serves to prepare the portion of the (wet) blast furnace slag coming from the
steel industry before dosing it and mixing it with the other components. The drying step is
the main one responsible for direct carbon emissions in the industrial sites because the
dryer's thermal energy is generated by burning natural gas. The dosing and grinding
processes are done sequentially, with the grinding installations being responsible for most of
the electricity demand of the sites. The raw materials (clinker, blast furnace slag (BFS),
limestone, and calcium sulphate) are dosed, mixed, and ground according to the desired
cement type. There are differences within the grinding facilities in the IJmuiden and
Rotterdam industrial sites; in IJmuiden, a roller press and two ball mills are used in the
process, while Rotterdam uses only two ball mills. After the raw materials go through the
grinding processes, the cement is ready for use.

This study identified the following as the main decarbonisation options for the Dutch cement
industry:
 • Fuel substitution to reduce the use of natural gas. The literature's alternatives
 mentioned are: heat pump dryer (using renewable electricity), solar dryer, hydrogen
 and biogas use as fuel substitute, and waste heat use from other industrial sites.
 • Process design change to further improve the energy efficiency in the grinding
 process. The literature's alternatives mentioned are: roller press (both as pre-
 grinding and as grinding equipment), vertical roller press, or high-pressure grinding
 rolls instead of the ball mills and high-efficiency classifiers.
 • Alternative feedstock to reduce the use of the carbon-intensive clinker even more.
 The literature's alternatives mentioned are: blast furnace slag, fly ash, natural
 pozzolanas, natural calcined pozzolanas, limestone and belite cement.

Cement is an important sector towards the decarbonisation of industry, for having high
carbon-intensive processes and being the most extensive manufactured product in volume
on earth. For that reason, this report also mentions some of the most relevant
decarbonisation alternatives presented in the literature for the cement manufacturing chain
as a whole, beyond the partial production processes sited in the Netherlands (including,
then, clinker production). The main topics of this subject from literature are: more
sustainable clinker production, re-carbonation, CO2 uptake, efficient use of cement in
concrete and increased circularity of cement and concrete circularity.

PBL – TNO | 4 – A MIDDEN report

FULL RESULTS

Introduction
This report describes the current situation for cement production in the Netherlands and the
options and preconditions for its decarbonisation. The study is part of the MIDDEN project
(Manufacturing Industry Decarbonisation Data Exchange Network). The MIDDEN project aims
to support industry, policymakers, analysts, and the energy sector in their common efforts to
achieve deep decarbonisation. The MIDDEN project will update and elaborate further on
options in the future, in close connection with the industry.

Scope
In the Netherlands, cement producers include ENCI Rotterdam and ENCI IJmuiden.
Production processes include drying, dosing and grinding; products include: Portland Cement
(CEM I) and Blast Furnace Slag Cement (CEM III).
The main options for decarbonisation for the Dutch cement production are alternative
feedstock, alternative fuel, electrification, and process design changes. This report also
briefly discusses the decarbonisation options for feedstock (clinker) production which takes
place outside Netherlands’ borders.

Reading guide
Section 1 introduces the Dutch cement industry. Section 2 describes the current situation for
cement production processes in the Netherlands, and Section 3 describes the relevant
products of these processes, while options for decarbonisation are systematically quantified
and evaluated in Section 4. The feasibility of and requirements for those decarbonisation
options are discussed in Section 5.

 A MIDDEN report – PBL – TNO | 5
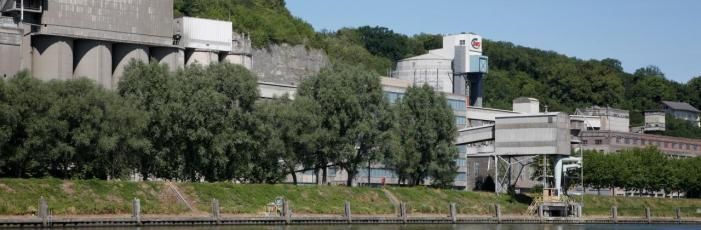
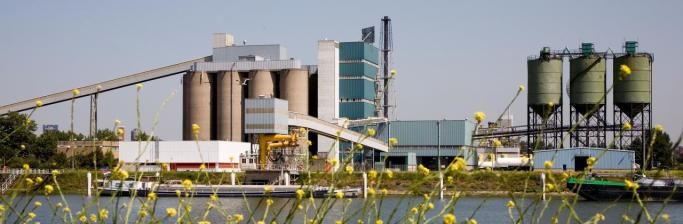
1 Cement production
in the Netherlands
Cement is the largest manufactured product on Earth by mass. It is a hydraulic binder that
can be produced by grinding and mixing different components like cement clinker,
granulated blast furnace slag (GBFS), pozzolana (siliceous or silico-aluminous material with
cementitious properties in the presence of moisture), limestone, and fly ash. Those various
components go through distinct processes and treatments and are dosed in different
quantities to form different types of cement (ECRA, 2015). When mixed with water and other
minerals, it creates other cement-based binding materials, such as the concrete, the second
most utilized material in the world after water (Scrivener, John, & Gartner, 2016). The high
demand for this material in our civilization is directly linked to the economic development of
societies. The common goal of achieving a more just, sustainable society requires substantial
progress in the built environment, which drives the growth of this industry.

The Dutch production takes place at the Eerste Nederlandse Cement Industrie (ENCI), the
first and only cement industry active in the Netherlands since 1926. Currently, the company
is owned by the German multinational cement giant HeidelbergCement and has two
producing industrial plants, one located in Rotterdam and the other based in IJmuiden
(Figure 1 and Figure 2). They also owned another plant in Maastricht that was recently
closed (Figure 3). ENCI has a central office located 's-Hertogenbosch, where the sales,
planning, and marketing activities occur. Within the two active industrial sites, the company
has a production capacity of around 2 million tonnes (Mt) of cement per year and produces
mainly cements type CEM III (Blast Furnace Slag Cement) and CEM I (Portland Cement).
ENCI's principal clients are concrete plants and building companies that use cement for
concrete. The Rotterdam site provides a specific research center with laboratories that
conduct studies to assist clients produce cheaper and more efficient concrete, also serving to
HeidelbergCement's Belgian interests. That connection between product and services
provided allows clear interaction between cement making, research, and buyer interest
(Global Cement, 2012 ).

Figure 1- ENCI Rotterdam industrial site.

PBL – TNO | 6 – A MIDDEN report
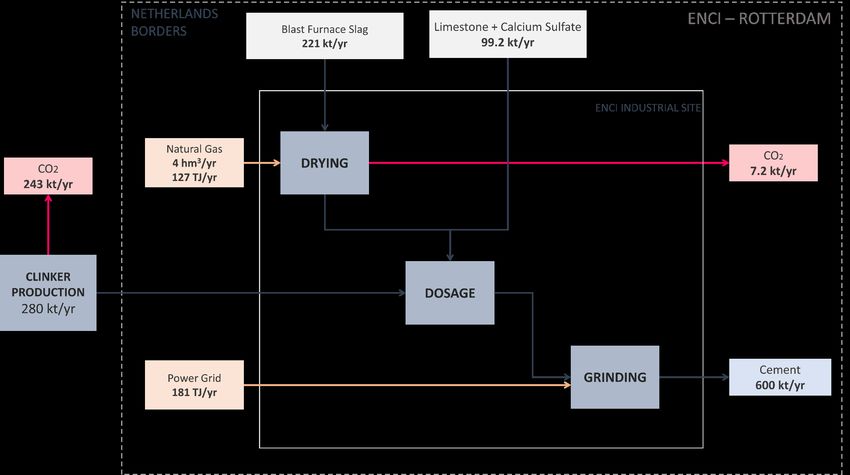
Figure 2 - ENCI IJmuiden industrial site

Figure 3 - ENCI Maastricht closed industrial site.

The Netherlands is one of the countries that do not produce all the demanded cement. The
country’s natural and geographical characteristics have strongly influenced the consumption
and production of cement in the country. The predominance of open water environments in
the Netherlands' landscape creates some disadvantages for the concrete industry. The moist
and saltiness are characteristics that can directly affect the concrete durability, especially in
areas where the water table is elevated. The Dutch low stocks of limestone make the
industry dependent on imported clinker from across the border in Germany and Belgium. For
this reason, ENCI benefits from the limestone area of the CBR's Lixhe plant in Belgium, which
is only 12km to the south of the Dutch border. Those characteristics drove the cement
industry to be ruled by cement type CEM III, rich in blast furnace slag which contributes to
enhanced durability to concrete structures with less use of clinker (Global Cement, 2012 ).
Still on the influence of geographic conditions on cement production, the Netherlands’ coastal
and inland waterways narrow the distances over which cement is transported by road or rail.
Thus, large amounts of material are carried by boat to inland areas, a delivery configuration
that would be more difficult for other nations.

The cement production in the Netherlands is remarkably different from most of the cement
sites worldwide due to the aforementioned distinct characteristics and the environmental
standards. When analysing only the Dutch scope of production, Dutch cement's ecological
situation is in a relative advantage compared to the production of other countries. The most
carbon-intensive process in the cement industry is the limestone's treatment to turn into
clinker. Thus, the extensive use of Blast Furnace Slag (BFS) to substitute the Portland clinker
cement in the Netherlands represents an advantage. These two materials are by-products of
other industrial processes and require low or no emissions in order to be used in the cement
production chain. The Portland cement is extensively used in other countries and has a
clinker content of 95%, while the Dutch cement has an average clinker content of 46%
(Cement & Beton Centrum, 2019). On the other hand, the Dutch cement industry still has
room to improve, especially towards reducing import of the carbon-intensive clinker from
outside the borders.

 A MIDDEN report – PBL – TNO | 7
2 Cement production
process
As the most manufactured product in the world, cement production is large in size with many
manufacturing sites around the world that share a very similar process (IEA; CSI, 2019).
Cement, as a product, can be worldwide understood as the result of processing different
types of minerals undergoing continuous grinding, thermo-treatment, and dosing processes;
being limestone, clay, and gypsum the main used raw materials (Leetham, 2015). The
minerals composition can be slightly distinct among companies due to countries' quality
standards or specific uses. The type of cement produced can change with the addition of
alternative binding materials. The production chain can be simplified and divided into two
main steps: clinker fabrication and cement production. Figure 4 presents more details of both
stages. The Dutch manufacturing industry for cement, unlike most other countries, does not
include anymore the production of clinker and focuses on the second stage of cement
production.

The main element of cement production is clinker. Clinker is produced through energy-
intensive kiln process and provides the mineral composition necessary for the binder function
of cement in concrete (Cement & Beton, 2018). This production process generally has the
following pathway:
 a) Raw Material Extraction: Marl (lime-rich mineral), loam, fly ash, and ferrous raw
 materials are the primary raw material for the manufacture of clinker. Excavations in
 the soil remove the minerals from nature while the fly ashes come from other
 industries.
 b) Transport: The raw materials are transported to the manufacturing industry. The
 clinker production facilities are almost always located next to, or very close to, the
 sources of the main raw materials to facilitate this stage.
 c) Crushing: The marl is broken and sieved in the crushing facility, removing a
 considerable amount of flint stones from the limestone.
 d) Milling: The lime with the other raw materials go to the milling zone to be
 homogenized and pre-mixed in finer grains.
 e) Drying and Preheating: The ground components of clinker are dried to obtain a flour-
 like composition fed to a preheating cyclone tower. As it falls, the flour absorbs rising
 gas energy and reaches a temperature of 800 °C.
 f) Kiln: The flour goes to a rotary oven gradually heated to a temperature of about
 1450 °C. This stage is the most carbon-intensive in cement manufacturing, mainly
 because of the large amount of raw material heated with fossil fuels at such a high
 temperature. Some companies have been using alternative fuels for this process,
 decreasing the carbon footprint.
 g) Cooling: When leaving the oven, the clinker is led to an air-cooling system, causing
 its temperature to drop to approximately 100 °C.

The next step is the cement production itself. At this stage, the type of cement produced is
defined, mostly by changing its composition and granularity. This process is composed
basically by the grinding and dosing of clinker and other binding additives. The primary type
of cement produced worldwide is the Portland Cement, which has more than 95% of clinker
on its composition (Leetham, 2015). This grinding and dosing of clinker and other binding

PBL – TNO | 8 – A MIDDEN report
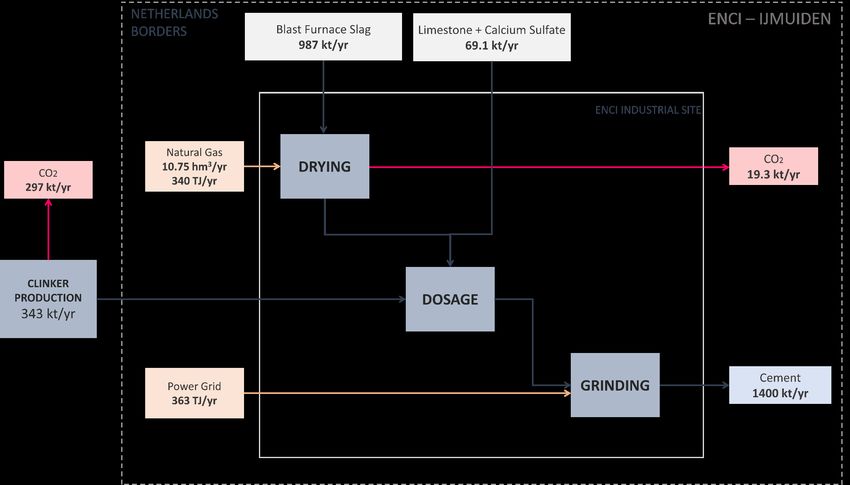
additives is the only process occurring in the Dutch manufacturing facilities and it will be
explored in the following section.

Figure 4 - Cement manufacturing Process. 1 - Clinker Production; 2 - Cement
Manufacturing (Chrysostomou, Kylili, Nicolaides, & Fokaides, 2015).

2.1 Dutch Production Process
The Dutch cement manufacturing process no longer includes the production of clinker. The
industrial site responsible for producing clinker inside borders was the Maastricht production
site of ENCI that completely closed in 2020. Before that, at the beginning of 2019, the
clinker production was, due to an agreement on ending extraction from the adjacent
limestone quarry, already stopped, making the Dutch cement production sites completely
dependent on imports of clinker. The main importation sources of clinker to the Dutch
cement production sites are the Belgian Heidelberg Cement facilities, part of the Benelux
production organization. One of these plants is located in Lixhe 12 km to the south from the
former Maastricht site, the other is located in Antoing. They support the cement production
of Rotterdam and IJmuiden. The increase in the maintenance and operation costs led the
ENCI to declare that this site was unable for this industrial site to remain competitive, which
led to its closure (Horrichs, 2019 ).

Thus, the Dutch production process is only related to the grinding and dosing facilities,
running in the Rotterdam and IJmuiden industrial ENCI sites. Both produce the same types
of cement and have a similar manufacturing configuration regarding the raw materials use
and the process chain. The main differences, however, rely on the production capacity, on
the mix composition of raw materials, on the amount of each type of cement produced,
energy use, and emissions. Figure 5 and Figure 6 show the production scheme for both
IJmuiden and Rotterdam industrial sites, respectively, and indicate the estimated differences
between the amount of raw material used (grey), energy demand (yellow), production
capacity (blue) and emissions (red) in tons per year. The values presented are estimations
based on the full-capacity production of each production site, according to the mixture mass
balance proportions.

 A MIDDEN report – PBL – TNO | 9
Figure 5 - Production process scheme for ENCI IJmuiden in full production capacity.

PBL – TNO | 10 – A MIDDEN report
Figure 6 - Production process scheme for ENCI Rotterdam in full production capacity.

 A MIDDEN report – PBL – TNO | 11
To draft the Dutch cement production process in Figure 5 and Figure 6, the material and
energy flows were estimated according to public data on the ENCI production capacity for
each industrial site (ENCI , 2017). The clinker and blast furnace slag consumption were
retrieved from ENCI (2017), the CO2 emissions are based on NEA (2020) and
Emissieregistratie (2005), and the process scheme is according to interviews with the
company. The portion of the other binders (calcium sulphate and limestone) were calculated
considering the composition and shares of the different types of Dutch cement (ENCI, 2020a;
2020b; 2020c). The volume of natural gas consumed and, consequently, the energy demand
for drying, were obtained by considering its emission factor (Zijlema, 2018) and the carbon
emissions of this process. Also, the electricity use was calculated according to the grinding
equipment used on each industrial site, its capacity and consumption (ECRA, 2015). Finally,
the CO2 emissions of the imported clinker were estimated according to the emission factor
for this process (Betonhuis, 2014).

2.1.1 Raw materials for the Dutch cement production

The production process schemes for both industries highlight the variety of materials used to
manufacture ENCI's cement. As mentioned previously, the Dutch production has a
distinguished cement manufacturing which consists mostly of CEM III (Blast Furnace Slag
cement) and CEM I (Portland Clinker cement). Blast furnace slag (BFS) plays an important
role in the production. It is supplied by the nearby steel manufacturer Tata Steel based in
IJmuiden, produced during the quenching of molten iron slag with water (Krese, Strmčnik,
Dodig, & Lagle, 2019). CEM III has a composition of 36 to 95%wt of BFS, which explains the
large amount demanded (around 1,200 Mt BFS for both industrial sites) (ENCI, 2020a). Also,
the production of BFS cement is growing in the past years, especially in the IJmuiden
production site which is close to the Tata Steel factory, the primary producer of this material
(ENCI , 2017; Keys, Van Hout, & Daniels, 2019). Figure 7 shows the growth of its
consumption in the past years.

Figure 7 - Amount of blast furnace slag consumed in ENCI in tonnes (ENCI , 2017)

Another essential raw material for the Dutch cement sector is clinker. All types of cement
produced in IJmuiden and Rotterdam use clinker as one of the main components, but
especially in the Portland cement CEM I, composed of 95-100%wt of clinker. The other main

PBL – TNO | 12 – A MIDDEN report
type of cement produced, BSF cement CEM III, contains around 20-64%wt of clinker,
respectively (ENCI, 2020b) (ENCI, 2020c). The industrial sites are becoming relatively
more dependent on clinker since the cement production is continuously increasing, as shown
in Figure 8. From 2017 onwards it is expected that the clinker consumption has increased
even more. This, alongside with the Maastricht site's closure tends to increased import
dependence of this good.

Figure 8 - Amount of clinker consumed in ENCI in tonnes (ENCI , 2017)

Calcium sulphate and limestone are the other raw materials used in ENCI's cement
manufacturing. After the recent closure of the Maastricht factory, it is expected that the
IJmuiden and Rotterdam sites will work in almost full capacity running continuously. For that
reason, the values presented in Figure 5 and Figure 6 are estimates of the raw materials
consumption for the total capacity of both plants. Table 1 also displays the original values
shared by the company and the drafted estimates.

Table 1 - Estimation for raw materials input in Rotterdam and IJmuiden (ENCI ,
2017), (internal communication with the company, 2020)

 FULL PRODUCTION CAPACITY ESTIMATE
 IJmuiden Rotterdam
 Production Capacity kt/yr) 1,400 600
 Clinker (kt/yr) 343 280
 Blast Furnace Slag (kt/yr) 987 221
 Calcium Sulphate (kt/yr) 17 25
 Limestone (kt/yr) 52 74

 A MIDDEN report – PBL – TNO | 13
2.1.2 Drying Process

The BFS that is supplied for the Dutch cement production is still wet and needs to be dried
before being dosed and incorporated into ENCI's final product. For this reason, the
Rotterdam industrial site uses an individual dryer before the grinding facilities. The IJmuiden
site uses a drying process coupled with a roller press, step that occurs previously to the ball
mill grinding. Both drying methods use natural gas as fuel, and they are the only significant
source of scope 1 emissions (direct CO2 emissions on-site) in this process (internal
communication with the company, 2020). It was considered that all emissions registered at
the industrial site come from this process step with the burning of fuel in order to estimate
the amount of natural gas used for the drying process (Zijlema, 2018). Then, each industrial
site's most recent emission records and literature values for the CO2 emission per m3 of the
fuel were used, generating the results presented in Table 2. The values and the estimations
for full load capacity are also presented. Also, it is important to highlight that there is
relevant energy losses in industrial gas dryers. For indirect dryers, there are around 30%
losses already in the heat exchange of the drying gas to the substrate. For direct dryers,
even almost all of the heat carried by the natural gas is passed into drying air, thermal
energy losses to the environment and released with exhaust gases reduce the overall energy
efficiency to 60% or less (Kudra, 2012).

Table 2 - Estimation of natural gas consumption for the ENCI Rotterdam and
IJmuiden (Zijlema, 2018).

 FULL PRODUCTION CAPACITY ESTIMATION
 IJmuiden Rotterdam
 Production Capacity (kt/yr) 1,400 600
 CO2 Emission (kt/yr) 19.3 7.2
 Natural Gas Consumption (million m3/yr) 10.7 4.0
 Natural Gas Consumption (TJ/yr) 340.3 127.4

2.1.3 Dosage Process

The dosing process carried out in the production of cement serves mainly to control the
quantity of each type of cement produced. According to ENCI (2020a, 2020b, 2020c), there
are two different types of cement produced within the Dutch production chain:

 • CEM I Portland cement (95-100%wt clinker)
 • CEM III Blast Furnace Slag cement (20-64%wt clinker; 36-80%wt BFS).

2.1.4 Grinding Process

The process of grinding raw materials is also essential to allow differentiating quality and
applications to the cement produced. Grinding is the most electricity-intensive process in
cement manufacturing, being responsible for 60 to 70% of the electrical energy used in the
whole European cement production chain (ECRA, 2015). In the Dutch industry, this number
increases from 90 to almost 100%, since it does not have the early stages of processing the
marl for clinker formation. The grinding configuration for both industrial sites is different
from each other. In the Rotterdam site, two ball mills are used in the grinding process. This
method is reported in the literature as the least energy-efficient way to grind the cement,
consuming around 30 to 42 kWh per tonne of ground mix. For IJmuiden, the configuration
uses a combination of a roller press for pre-grinding and two ball mills for grinding. The roller

PBL – TNO | 14 – A MIDDEN report
press as a pre-grinding installation helps to improve the energy efficiency of the process,
being reported to have a potential decrease in electricity consumption of up to 30%, or 8-12
kWh per tonne of ground mix (IFC, 2017). Also, it is important to notice that the grinding
process is intrinsically a low efficiency process, where up to 80% of the energy is dissipated
as heat (Napier-Munn, 2013). Considering those values, Table 3 presents an estimation for
the energy consumption of this process on each industrial site. After the grinding process,
the cement is ready to be packed and stored/transported.

Table 3 - Electricity consumption for the grinding process - ENCI

 FULL PRODUCTION CAPACITY ESTIMATION
 IJmuiden Rotterdam
 Production Capacity (kt/yr) 1,400 600
 Pre-Grinding Configuration ROLLER PRESS -
 Grinding Configuration BALL MILL + BALL MILL BALL MILL + BALL MILL
 Electricity Consumption (TJ/yr) 241 – 381 155 – 180

2.2 Greenhouse gases emissions for the Dutch cement
 production
Clinker production is the main source of CO2 emissions in the cement sector, but The
Netherlands does not produce this material inside its borders. Hence, the reduction of the
carbon emissions related to the production of clinker outside the country is not the primary
focus of this study. Since the Dutch cement industry's current configuration is composed by
only grinding and dosing, the scope 1 emissions are remarkably lower compared to other
cement industrial sites with coupled production. For that reason, emissions related to clinker
production will be mentioned in this chapter to provide a complete view of cement production
and also be further discussed in Section 4. Nevertheless, the accompanying MIDDEN dataset
includes only scope 1 emissions and addresses the energy consumption per process unit.

For the CO2 emissions related to ENCI’s industrial process, the information for the IJmuiden
production sites was retrieved from the NEA database with a value of 13.7 kilotonnes of CO2
in 2019 (NEA, 2020). Since all the electricity consumption related to the grinding process is
purchased and its emissions fall into the scope 2 (indirect emissions related to imported
energy which is consumed by the process), all that CO2 comes from the drying process. The
Rotterdam site emissions are not in the ETS database, for that reason the information
regarding its emissions was retrieved from the Emissieregistratie database
(Emissieregistratie, 2020), showing an emission of 7.2 kilotonnes of CO2 in 2005, which is
the most recent data available (Emissieregistratie, 2020).

 A MIDDEN report – PBL – TNO | 15
Taking into account that in 2018 around 0.56 kg of CO2 was produced per kWh of electricity
in the Netherlands (PBL, 2020) and that it is estimated that 0.9 tonnes of CO2 are produced
per tonne of clinker manufactured (Betonhuis, 2014), it is possible to estimate the number of
emissions on scope 2 and 3 related to the cement production. Scope 3 emissions include the
direct emissions related to the feedstock production; for the Dutch cement sites, the clinker
production emissions are scope 3 because this material is produced elsewhere. Thus, Table 4
and Figure 9 present an overview of the estimated scope 1 emissions form the ENCI
industrial sites and the emissions related to the scope 2 and 3, regarding electricity
generation and the production of the clinker outside the Dutch borders, respectively. It is
interesting to notice that the scope 1 emissions are assessed to represent only 2 to 5% of
the sum of emissions of the whole production chain.

Table 4 - CO2 emissions estimation for the ENCI Rotterdam and IJmuiden industrial
sites

 FULL PRODUCTION CAPACITY ESTIMATION
 IJmuiden Rotterdam
 Production Capacity (kt/yr) 1,400 600
 SCOPE 1: ENCI direct emissions (kt CO2/yr) 19.3 7.2
 SCOPE 2: Electricity generation emissions 46.1 28.2
 estimation
 – outside the fence (kt CO2/yr)
 SCOPE 3: Clinker production emissions estimation 309 252
 – outside the fence (kt CO2/yr)

 NOTE: Emission factor of 0.56 kg of CO2 per kWh of electricity in the Netherlands (PBL, 2020).
 Emission factor of 0.9 tonnes of CO2 per tonne of clinker manufactured (Betonhuis,
 2014).

 400
 KTONS OF CO2

 350
 309

 300
 252

 250

 200

 150

 100
 46.1

 28.2
 19.26

 50
 7.21

 0
 IJMUIDEN ROTTERDAM
 SCOPE 1 SCOPE 2 SCOPE 3

Figure 9 - Scope 1 emissions for cement production compared with the scope 2 and
3 emissions estimated for electricity consumption and clinker production (PBL,
2020) (Zijlema, 2018).

PBL – TNO | 16 – A MIDDEN report
2.3 Overview of inputs and outputs of energy and
 materials
Considering the discussion, estimations and considerations above mentioned, it is possible to
draft the input and output flows for energy and materials on the Dutch cement production,
presented in the Table 5:

Table 5 - Overview of inputs and outputs of energy and materials for the Dutch
cement industrial sites

 FULL PRODUCTION CAPACITY ESTIMATION
 IJmuiden Rotterdam
 Energy Inputs (TJ/yr) 703.2 308.8
 Electricity (TJ/yr) 362.9 181.4
 Heat - Natural Gas (TJ/yr) 340.3 127.4
 Energy Outputs (TJ/yr) 630.6 272.5
 Water Vapour (TJ/yr) 238.2 89.2
 Heat loss (TJ/yr) 102.1 38.2
 Losses - Grinding Process (TJ/yr) 290.3 145.1
 Material Inputs (kt/yr) 1,399 600
 Clinker (kt/yr) 343 280
 Blast Furnace Slag (kt/yr) 987 221
 Calcium Sulfate (kt/yr) 17 25
 Limestone (kt/yr) 52 74
 Material Outputs (kt/yr) 1,419.3 607.2
 CEM I (kt/yr) 131.3 308.8
 CEM III (kt/yr) 1,268.8 291.3
 CO2 (kt/yr) 19.26 7.21

 A MIDDEN report – PBL – TNO | 17
3 Cement products and
application
Cement represents an essential value in our society and it is deeply integrated into our daily
life. Its primary use is as a binder in concrete, a versatile and robust building material with a
wide variety of utilization. It is used in practically every type of building, including houses,
highways, skyscrapers, hospitals, industrial sites and ornaments like patios, floors,
staircases, driveways, pool decks, and sculptures. Because of its extensive use, cement is
the largest manufactured product in the world in volume.

3.1 Cement Products
There are different types of cement in the market, but they can be divided according to their
composition. The European cement standard EN 197-1 specifies 27 types of cement and their
components, which are classified into the subsequent classes (CEN, 2011):
 • CEM I Portland cement (>95%wt clinker)
 • CEM II Portland-composite cement (65-94%wt clinker)
 • CEM III Blast furnace slag cement (5-64%wt clinker)
 • CEM IV Pozzolanic cement (45-89%wt clinker)
 • CEM V Composite cement (20-64%wt clinker).

The recent trends of environmental awareness on the carbon emissions related to clinker
manufacturing are changing the production and consumption of these cement types. In
Europe, the Portland cement, which was the most consumed type in the past, lost market
share for the Portland Composite (CEM II) and Blast Furnace Slag Cement (CEM III). The
most sold cement type in Europe is currently the CEM II-A, as shown in Figure 10, where
clinker is replaced with limestone up to a full replacement of 20%wt (Favier, De Wolf,
Scrivener, & Habert, 2018).

Figure 10 – European cement share by type in 2015 (Favier, et al. 2018).

PBL – TNO | 18 – A MIDDEN report
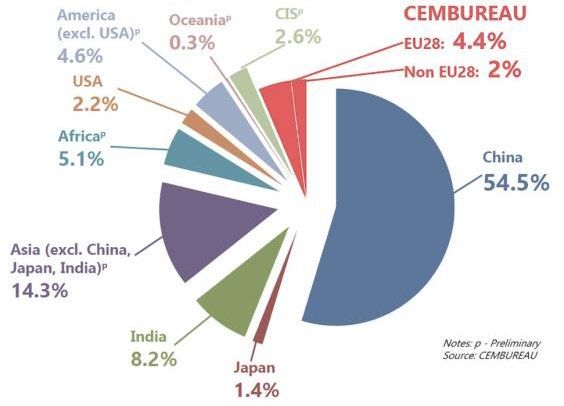
Worldwide, the cement's primary use is on the building industry as the main material for
concrete. According to the European Cement Association (2020), there are two main types of
application: ready-mix concrete or prefabricated concrete. The first is manufactured in a
batch-mixing industrial plant and distributed by a truck-mixer to the construction facilities.
The prefabricated (or precast) is shaped and casted in a reusable mould, and transported to
the construction site to be immediately used (Cembureau, 2020). Around 76% of the
European cement produced is used within these two categories, where 56% goes for ready-
mix concrete and 20% to precast concrete. Retailers, wholesalers, builders creating their
own concrete, and mortars for big building sites consume the remaining 24% of the cement
produced (Cembureau, 2020).

3.2 Cement global market
The total global cement production is about 4 billion tonnes (Cembureau, 2020). China is by
far the biggest producer of cement globally, representing approximately 54.5% of world
production, as shown in Figure 11. However, the Chinese market is almost wholly controlled
by domestic suppliers, with little impact from multinational players. The second-largest
market, India, also is mostly covered by large domestic companies such as UltraTech
Cement, Dalmia Bharat, and Chettinad Cement, with not much international share or only
locally-branded multinational subsidiaries (Edwards, 2018).

Figure 11 - World cement production share 2018 (Cembureau, 2020) 1

Table 5 shows the leading players in the cement market, ranked by total cement capacity
and excluding those from China, which are disproportionally big, and mostly only locally
influenced.

1 CIS refers to the Commonwealth of Independent States, which is a Eurasian organization with Russia as the

largest member state.

 A MIDDEN report – PBL – TNO | 19
Table 6 - Top cement producers worldwide (Edwards, 2018).

 PRODUCER (ORIGIN) CAPACITY (Mt/yr) NUMBER OF PLANTS

 LafargeHolcim (Switzerland) 345.2 220
 HeidelbergCement (Germany) 185.4 141
 Cemex (Mexico) 91.6 61
 UltraTech Cement (India) 91.4 39
 Votorantim (Brazil) 70.8 59
 InterCement (Brazil) 53.5 42
 CRH (Ireland) 50.5 54
 Buzzi Unicem (Italy) 49.2 37
 Eurocement (Russia) 47.2 19
 Dangote Cement (Nigeria) 43.8 12

The cement market has been consistent in the past decades, with global production growth
of more than 2.5 times from 2000 to 2013, stabilizing since 2014, as shown in Figure 12.
The most significant influence that drove this increase at the beginning of the century was
primarily China’s domestic construction boom and development. This shows how correlated
the urbanization and development processes are to the cement use and production. Also,
cement industry operating margins (profit after costs and before taxes) have settled under
12% after the 2008 crises, but it reached the pre-2007 margin of around 14% in 2018,
showing a positive financial tendency (Bjacek, 2019).

Figure 12- Global cement production (Bjacek, 2019).

Besides that, different factors such as population growth, urbanization in developing
countries and infrastructure improvements are expected to increase cement production by
12-23% above the 2014 level by 2050 (IEA; CSI, 2019). Figure 13 shows the projection for
the production pattern of cement across the world until 2050, showing how cement
production levels vary extensively across regions. According to 2016 measures, the Chinese
national cement production peaked in 2014, with a production per capita of 1.8 tonnes, way

PBL – TNO | 20 – A MIDDEN report
above the global values that range on 575 kg per capita. Other developing countries, such as
India, are expected to extend their production to accomplish their infrastructure progress
demands, rising three times the production level by 2050. According to this analysis, the
Asia Pacific growth would remain relatively stable and represent almost the double of the
current production over this period. This growth rate in India and Asia would be equivalent to
more than 90% of Chinese production's expected growth rate reduction. The remaining
foreseen global cement production expansion is in Africa, with more than triple, and America
with almost double their current cement production level by 2050 (IEA; CSI, 2019).

Figure 13 - Cement production by region towards 2050 (IEA; CSI, 2019)

Cement prices can vary across regions due to trade environments, input costs, and demand
and supply, among other factors. Despite the recent lower demand from China, the market is
today more mature and developed, leading to new market growth with more balanced prices
due to the increase of supply-demand in emerging markets.

3.3 Dutch cement market
The cement consumption in the Netherlands, with roughly 5 Mtonnes, is only 0.1% of the
worldwide consumption (Cement Online, 2017). Since the national production is responsible
for only approximately 2 Mtonnes, a considerable amount of the country's cement consumed
is imported, mostly from other EU countries. Besides that, even the cement produced inside
the Dutch borders is dependent on imports, since the country has no clinker production
anymore. However, as shown in Figure 14, the cement and clinker imports are decreasing in
the past years. That can be understood as a direct response to the growing consumption and
production of CEM III and CEM II within the Dutch production chain. In 2019, for example,
around 54% of the Dutch cement consumption was still imported from outside the borders
(CBS, 2020).

 A MIDDEN report – PBL – TNO | 21
3864
 4000
 CEMENT
MEGATONNES PER YEAR CLINKER
 3500 3266
 3140
 2982
 3000 2782 2798
 2590 2633 2643 2620
 2556

 2500 2303

 2000

 1500

 1000 716 665 635
 558
 493
 424
 353
 500 222 247
 192
 117 126

 0
 2008 2009 2010 2011 2012 2013 2014 2015 2016 2017 2018 2019

Figure 14 - Cement and clinker imports in the Netherlands. Data: (CBS, 2020)

Regarding cement consumption in the Netherlands, blast furnace cement share is reasonably
steady, ranging around 50 to 60%. Also, the percentage is shared between Portland Cement
(CEMI) with 35% and mainly Portland flying ashes (CEM II) with shares between 5 and 15%.
CEM III leads the Dutch production, making the Netherlands a reference worldwide for
production of low CO2 BFS cement. The mortar industry uses from 50 to 55% from the total
produced, while the concrete industry is responsible for about 35 to 40% of the cement
consumption. The rest reaches construction projects via contractors, building material
dealers, suppliers of floor and masonry mortar (Global Cement, 2012 ).

Analysing the expressive amount of cement imported by the Netherlands, it is noticed that
the main imported types are also Portland Cement (CEM I) and alternative binders cement
(CEM II and III). Figure 15 shows that, between 2008 and 2020, around 66% of the imports
are of CEM I, while 28% are of CEM II and III. Calcium Aluminate Cement, a high-
performance cement resistant to microbial corrosion and adequate for specific use in sewer
infrastructures (Scrivener, Cabiron, & Letourneuxb, High-performance concretes from
calcium aluminate cements, 2009), has 3% of the share, while other special cement, such as
dental, resins and fireproof cement, has the other 3% (CBS, 2020).

PBL – TNO | 22 – A MIDDEN report
Special
 Cement, 3%

 CEM II and
 CEM III, 28%

 Calcium
 Aluminate
 CEM I, 66%
Cements, 3%

Figure 15 - Netherlands cement imports, 2008-2009 (CBS, 2020)

In the Netherlands, the import prices for Portland cement is relatively constant between
2008 and 2019. According to CBS data (Figure 16), the average price is between 60 and 85
euros/tonnes in that timespan (CBS, 2020).

 100
 CEM I
 90
 80 85.0
 79.9 79.3 77.8
 70
 71.8 74.0
 71.3
PRICE (EURO/TONNES)

 60 65.7 65.4 67.4
 59.7 61.8
 50
 40
 30
 20
 10
 0
 2008 2009 2010 2011 2012 2013 2014 2015 2016 2017 2018 2019

Figure 16 - Import prices for Portland CEM in the Netherlands from 2008 - 2019.

 A MIDDEN report – PBL – TNO | 23
4 Options for cement
decarbonisation
Many literature studies mention clinker production as the largest emitter of greenhouse
gases in quantity. The carbon-intensive stage of clinker production, coupled with the massive
demand for cement in the market, makes this commodity’s emissions reduction very
essential for the industry in general. As mentioned earlier in Section 2, the Dutch production
in Scope 1 does not encompass the clinker production, since this is an imported feedstock, it
fits within Scope 3.

Due to the cement industry's particularities, this chapter will be subdivided into "Primary
Decarbonisation Alternatives", encompassing the options usually presented by the MIDDEN
methodology and under the Dutch cement sites’ limits, and "Other Decarbonisation
Alternatives", analysing other alternatives outside the Dutch industry scope for a more
holistic analysis. Only the primary options will be considered for the MIDDEN database, while
the other alternatives will be mentioned in this report with the purpose to broaden the view
regarding the whole production chain.

4.1 Primary Decarbonisation Alternatives
This section describes possible decarbonisation options for the cement manufacturing
process. Conceptually, there are several different actions that can reduce carbon emissions
in an industrial process. The methodology adopted in MIDDEN to explore and evaluate each
option is illustrated by Figure 17. Literature review and analysis of each specific technology
were key aspects of the investigation. The alternative solutions include the following topics
that could play a role in the ENCI process decarbonisation:

• Fuel substitution (1): substitution of the (currently fossil) energy supply: e.g., biogas,
 hydrogen, recycled heat, or using electric energy.
• Feedstock substitution (2), e.g., with biomass, recycled flows, or other upstream material
 substitution.
• Energy efficiency improvements (3) that do not fall under incremental ‘autonomous’
 efficiency improvement (which is currently 0.5% annually, but might reduce in the
 future).
• Use of residual energy (6) (heat), in company or externally.

Of these, only fuel substitution, energy efficiency improvements and in-house residual
energy use lead to a reduction in scope 1 emissions, while feedstock substitution and
external use of residual energy reduce emissions elsewhere.

PBL – TNO | 24 – A MIDDEN report
Figure 17 - CO2 reduction categories investigated in MIDDEN

4.1.1 Fuel Substitution - Drying

The primary (and almost only) source of direct carbon emissions of scope 1 in the Dutch
cement industry originates from the process of drying the wet Blast Furnace Slag. As Figure
5 and Figure 6 show, this process uses natural gas as the main fuel in IJmuiden and
Rotterdam, the combustion generates the heat needed to remove the water content of the
BFS granulates. Replacing this fuel with a lower carbon alternative or changing this process
would be essential to reduce industrial site emissions. Among the existing alternatives, the
following stand out:

1. Heat Pump Dryer:

Heat pump dryers are a novel technology that has developed from pilot projects to industrial
utilisation in Norway. This type of dryer is designed to be thermally efficient, to operate in a
closed-system of different fluids and to use electricity to increase and delivery optimal heat
exchanges, with no emission to the climate and environment. For a full cycle sustainable
drying process, the use of renewable sources of electricity should be used.

A heat pump dryer (HPD) is projected centring on capacity, efficiency, sustainability, and
operation with environmentally friendly fluids (Alves-Filho, Walmsley, Varbanov, Su, &
Klemeš, 2018). Figure 18 describes a simplified scheme of the several cooling elements
integrated with the drying chamber in a general HPD mechanism. The input of drying air
goes through the drying chamber at point 1 and removes the moisture from the product to
be dried. The water-rich air at point 2 is directed to the evaporator.

There are two different types of evaporator systems that can be used. One is a direct
expansion coil, where a refrigerant goes through a double-phase transition from liquid to
vapor, cooling, and dehumidifying the air in this process. The other is a cooling water system
where heat exchange with lower temperature that cools the air and dehumidify it uses water
instead of a refrigerant. Figure 18 represents the schematic model of a refrigerant drying
system in a drying chamber. The drying air 1 goes through the drying chamber, removing

 A MIDDEN report – PBL – TNO | 25
the humidity of the system. During this dehumidification, from point 2 to 3, the air exchange
heat with the refrigerant and its temperature is lowered to its dew point, condensing its
water content. The heat removed from the system is absorbed and used to boil the
refrigerant (or cooling water) to a vapour state in the evaporator. The high-temperature
refrigerant is then pumped to the condenser (3), increasing even more its enthalpy in this
process. The dried air from the drying chamber goes to be heated again in the condenser
(4), exchanging heat again with the refrigerant in the condenser moving to the starting point
1 when it is used again used in the drying chamber (Chua, Chou, Ho, & Hawlader, 2002).
This operation is only possible due to the different temperatures and pressures that allow the
heat change between the refrigerant and the drying air, using electricity as an energy
source.

Figure 18 - Schematic representation of heat pump drying system (Chua, Chou, Ho,
& Hawlader, 2002).

Among the advantages of this type of drying are improvements in energy efficiency, accurate
control of drying conditions, flexibility to a wide range of drying conditions, an increase of
throughput and reduced operational costs. The disadvantages are related to maintenance
costs, refrigerant leaks, and high capital expenditure when compared to other drying
mechanisms (Chua, Chou, Ho, & Hawlader, 2002).

2. Hydrogen Dryer

An alternative to this process would be to replace the fuel with hydrogen. For this option be
considered as a decarbonization alternative, the hydrogen used should be either ‘blue’
(methane reforming while capturing the formed CO2) or ‘green’ (electrolysis with renewable
electricity). Although the use of hydrogen for drying processes has not yet been applied on a
large scale, this is a fuel with relevant potential for replacing natural gas. Hydrogen
combustion is a very exothermic process and produces water vapor, following the chemical
reaction:

 1
 2 + 2 → 2 ∆ℎ = −286 /
 2

The amount of hydrogen needed to produce the same amount of energy for the drying
process is described by Table 7. The caloric values are according to RVO (Zijlema, 2018).

Table 7 - Hydrogen demand for drying (own calculations)

PBL – TNO | 26 – A MIDDEN report
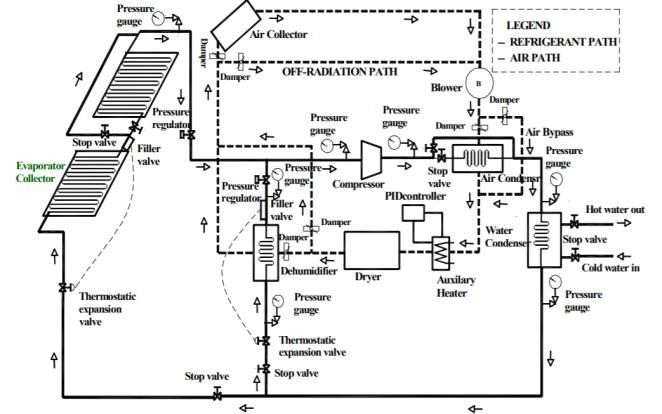
FULL PRODUCTION CAPACITY ESTIMATION
 IJmuiden Rotterdam
 Natural Gas Consumption (million m3/yr) 10.7 4
 Natural Gas Consumption (kt/yr) 8.6 3.2
 Energy Demand for Drying (TJ/yr) 340 127
 Hydrogen Demand (million m3/yr) 31.5 11.8
 Hydrogen Demand (kt/yr) 2.7 1

3. Biogas Dryer

One option of biogas that could be used is Substitute Natural Gas (also called SNG,
biomethane, and green gas), the upgraded form of the biogas produced by anaerobic
digestion of organic substrates. The upgrade of biogas is done by removing the CO2 content
and cleaning the siloxanes (organic materials, such as chlorine and sulphur), resulting in a
gas with the same natural gas characteristics (RVO, 2019). In that way, the production
process would remain exactly the same, as well as the mass and energy flows; only the type
of fuel would be changed. Instead of upgrading the biogas to SNG, the biogas may also be
used directly without upgrading. The current Dutch biogas production is limited to agriculture
(manure), sewage sludge treatment (industrial and public) and some house hold waste (GFT)
treatment, therefore, which brings constraints for sourcing this fuel to the cement sites.

4. Solar Dryer

Solar thermal energy is used for drying processes for a long time, even before the most
evolved societies developed. However, solar drying for industrial-scale operations is still little
used since the use of fossil fuels for this purpose began. More recently, environmental
concerns and the desire to decarbonise the industry, have led research and some sectors to
evaluate new ways to use this source of energy in their processes. The use of these kinds of
technologies may contribute to the transition to a low-carbon energy future (Kamfa, Fluch,
Bartali, & Baker, 2020). Therefore, new technologies have emerged to increase efficiency
and use solar energy for drying processes applications.

Today, the primary forms of solar drying in the industry can be divided in three main
categories:
 • solar natural dryers using natural energy sources only;
 • semi-artificial solar dryers, with a fan connected to an electric motor to keep a
 continuous airflow in the drying space; and
 • solar-assisted artificial dryers, able to operate using conventional energy sources, if
 needed.

Each of these categories may present different configurations of drying systems, with
different designs, sizes, temperature ranges, and objectives. Those different configurations
should be considered when analysing the best options for the BFS drying in the Dutch
Cement industry. Given the specifications of the cement process, the solar-assisted dryer
with heat pump and heat storage could be a good option. For the Netherlands, due to the
rate of solar radiation not being as high as in tropical countries, relying only on solar energy
for drying can be risky at some times of the year. This type of configuration, however, can
work with or without the use of solar energy. It is a combination of a heat pump with
thermo-solar panels, that increases energy efficiency and can make it even independent of
electricity, providing the same drying effect of a standard heat pump.

 A MIDDEN report – PBL – TNO | 27
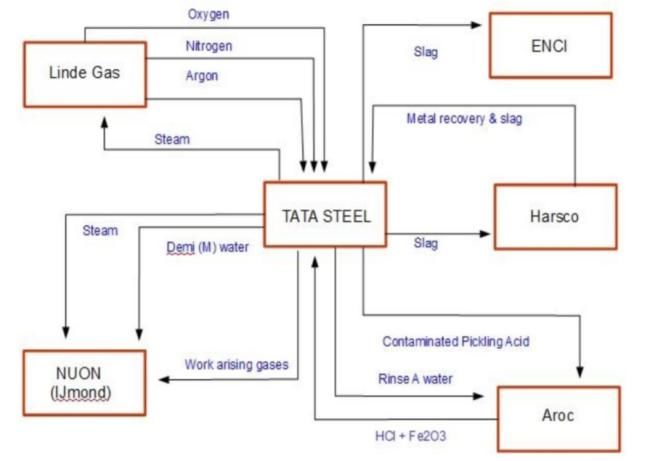
Figure 19 shows this configuration with two different paths in this system, one with airflow
(stripped line) and the other with the refrigerant (continuous line) (Mohammod & Rahman,
2003). The air system is composed of the solar air collector, air-cooled condenser, auxiliary
heater, blower, dryer unit, dehumidifier, temperature controller and dampers. The solar air
collector warms the circulating air and then passes over the condenser coil, where it is
heated even more by the energy released by the condensing refrigerant. The air is,
therefore, used for drying purposes, so depending on the temperature and the
meteorological conditions, there is no need to use electric energy or the refrigerant cycle in
the process. Then, the airflow that leaves the dryer is cooled and dehumidified, and the heat
removed goes to the air-cooled condenser to be used in the next cycle.

For the refrigerant flow path, the different components are dehumidifier, collector
evaporator, an open type reciprocating compressor, evaporator pressure regulators,
expansion valves, condenser tank and a fan coil unit. Also, in a clear vision, the refrigerant
gas that comes out of the air-cooled condenser goes through the coil submerged in a tank,
heating the water by releasing the heat and assuring complete condensation (Mohammod &
Rahman, 2003).

Figure 19- Solar Dryer with heat pump and heat storage (Mohammod & Rahman,
2003).

5. Waste Heat from other industrial sites

The BFS drying is an energy-intensive process that could benefit from the utilization of waste
heat from other near industrial sites for drying or even pre-drying. Industrial waste heat is
described as heat discarded from industrial processes, which is utilized for other processes
within the same industrial site or not. This waste heat comes in the form of different thermal
carriers, in which the most common ones are exhaust gas, flaring gas, low-quality steam,
cooling air, hot oil, cooling water, or even hot steel. Both ENCI grinding factories are located
in an industrial cluster, close to other industrial sites that could provide a source of waste
heat for the drying process. Those synergies would need to be evaluated, but Figure 20
shows the synergies that the IJmuiden industrial cluster has correlated with the Tata Steel
industrial site and with other industries (Gorazd Krese; Boštjan Strmčnik; Vera Dodig; Boris

PBL – TNO | 28 – A MIDDEN report
Lagler , 2019). Besides sourcing BFS to ENCI IJmuiden, Tata Steel also provides steam to
other industries.

Figure 20 - Current Industry Symbiosis in IJmuiden industrial cluster (Gorazd
Krese; Boštjan Strmčnik; Vera Dodig; Boris Lagler , 2019)

Cost Analysis

Table 8 presents the cost analyses for the drying techniques presented in this section.
Natural gas is the current technology used. Only its operational costs were considered,
adding the fuel cost to the maintenance and operation costs concerning its power capacity,
according to Global Petrol Prices (2020). For the industrial closed heat pumps, its variable
operation and maintenance (O&M) costs are fully dependent on the electricity price according
to Lensink (2020). The heat pump has an expected lifetime of 12 years and its efficiency
(expressed as the energy output per electricity consumption, or COP) is for this purpose
assumed to be 3.5 as in the SDE subsidy scheme (Lensink, 2020). For the hydrogen and
biogas (SNG) alternatives, this study considers that only operational costs would change due
to the fuel and O&M changes, according to parameters found in Elzenga & Lensink (2020)
and Gorre (2019), respectively. No specific information about costs for solar and waste heat
drying were found in the literature for the capacity required for ENCI industrial site. The
capital costs consider in its calculation the necessary modifications and new equipment to
run the new process. Theoretically, for SNG as biogas, the fuel would be similar enough to
the original natural gas to an extent of not needing changes in the infrastructure. For using
hydrogen however, modifications or even new equipment would be probably needed, but due
to lack of information on hydrogen dryers in the literature, that cost could not be estimated.
The operational costs consider workforce, maintenance and operation according to the
literature, excluding the costs for utilities (electricity, water, fuel costs).

 A MIDDEN report – PBL – TNO | 29
Table 8 - Costs figures of drying techniques (excluding utilities)

 TECHNOLOGY IJMUIDEN ROTTERDAM
 Capacity CAPEX OPEX Capacity CAPEX OPEX
 (TJ/yr) (MEURO2020) (MEURO2020/ (TJ/yr) (MEURO2020) (MEURO2020/
 yr) yr)
Heat Pump1 340.3 13.47 0.296 127.4 4.93 0.108
Hydrogen Dryer 2 340.3 Unknown 0.44 127.4 Unknown 0.306
Biogas Dryer 340.3 0 0.162 127.4 0 0.097
(SNG)3

1 - (Lensink, 2020)
2 - (Elzenga & Lensink, 2020)
3 - (Gorre, 2019)

4.1.2 Process Design Change – Grinding

The process of grinding substrates to form cement is one of the most energy-intensive
processes in the production. In the case of ENCI's industrial plants, this process uses the
configuration of two ball mills in Rotterdam and one roller press and two ball mills in
IJmuiden. The ball mills are reported as one of the least energy-efficient for the cement
industry with an energy consumption of between 30-42 kWh per tonne of grounded material.
More energy-efficient configuration options for that process would be the following (ECRA,
2015):

 • Roller Press as pre-grinding, with 8-12 less kWh per tonne of ground material
 • Vertical roller mill, with 21-33 kWh per tonne of ground material
 • High pressure grinding rolls, with 23-30 kWh per tonne of ground material

The above alternatives for configurations could represent significant energy savings for the
ENCI Rotterdam and IJmuiden industrial sites, as shown in Table 9. By using a configuration
with Roller Press and Vertical Roller Mill, for example, it would be possible to save up to 26%
of energy in Ijmuiden and up to 42% in Rotterdam.

Table 9 – Energy demand for using roller press as pre-grinding coupled with
different grinding configurations (ECRA, 2015).

 FULL PRODUCTION CAPACITY ESTIMATION
 IJmuiden Rotterdam
 Production Capacity (kt/yr) 1,400 600
 Capacity Utilization 100% 100%
 ROLLER PRESS BALL MILL+
 Actual Grinding Configuration ENCI
 + 2 BALL MILL BALL MILL
 Actual Configuration Energy Consumption (GWh/yr)
 67-106 43-50
 ENCI
 Roller Press + 2 Ball Mill Configuration (GWh/yr) 67-106 29-47
 Roller Press + 2 Vertical Roller Mill Configuration
 42-81 18-35
 (GWh/yr)
 Roller Press + 2 High-Pressure Rolls Configuration
 48-73 20-31
 (GWh/yr)

PBL – TNO | 30 – A MIDDEN report
You can also read