Saving Money - Climate Action Plan Delivering the - IWEA
←
→
Page content transcription
If your browser does not render page correctly, please read the page content below

Saving
Money
70 by 30
Implementation Plan
May 2020

Delivering the
Climate Action Plan

DELIVERING 70 BY 30: SAVING MONEY

TABLE OF CONTENTS

FOREWORD ...................................................................................................................................................... 1

Policy Choices to Reduce the Cost of Onshore Wind in Ireland .................................................................. 3

        EXECUTIVE SUMMARY .......................................................................................................................... 5

        INTRODUCTION ...................................................................................................................................... 7
  2.1       Context and objectives ........................................................................................................................................................... 7
  2.2       About Everoze .......................................................................................................................................................................... 7

        MODELLING METHODOLOGY ............................................................................................................. 8
  3.1       Modelled scenarios .................................................................................................................................................................. 8
  3.2       Modelling approach .................................................................................................................................................................. 8

        PLANNING AND ENVIRONMENT ...................................................................................................... 10
  4.1       Scenario 1: Tip heights .......................................................................................................................................................... 10
  4.2       Scenario 2: Noise ................................................................................................................................................................... 11
  4.3       Scenario 3: Life extension ..................................................................................................................................................... 12
  4.4       Scenario 4: Simplified planning ............................................................................................................................................. 13

        GRID DEVELOPMENT AND REFORM ................................................................................................ 17
  5.1       Scenario 5: Curtailment and constraint ............................................................................................................................ 17
  5.2       Scenario 6: Grid Charging Mechanisms reform .............................................................................................................. 20
  5.3       Scenario 7: Smart connections ............................................................................................................................................ 21
  5.4       Scenario 8: Balancing cost reform ...................................................................................................................................... 21

        TAX POLICY REFORM .......................................................................................................................... 23
  6.1       Scenario 9: Business rates reform ...................................................................................................................................... 23
  6.2       Scenario 10: Grid capital allowances.................................................................................................................................. 24

        CONCLUSIONS ...................................................................................................................................... 25

Appendix 1: Scenario assumption register ................................................................................................... 27

                                                                                                                                                                                             Page i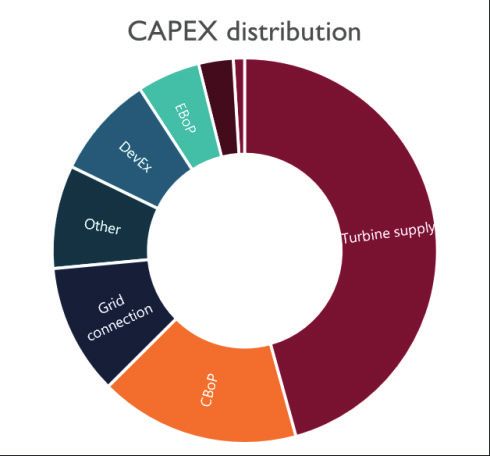
DELIVERING 70 BY 30: SAVING MONEY

LIST OF TABLES

Table 1: LCOE scenario summary ........................................................................................................................................................ 8
Table 2: Planning and Environment price tag summary ................................................................................................................. 10
Table 3: Tip height scenario key assumptions .................................................................................................................................. 11
Table 4: Grid development and reform price tag summary ......................................................................................................... 17
Table 5: Tax policy reform price tag summary ................................................................................................................................ 23

LIST OF FIGURES

Figure 1: CAPEX and OPEX distributions .......................................................................................................................................... 9
Figure 2: LCOE scenario waterfall ...................................................................................................................................................... 26

DISCLAIMER

This report is made available for information only. It is not intended to amount to advice on which you should rely.
You should always obtain professional or specialist advice before taking, or refraining from, any action related to the
content of this report.
Although in the drafting of this report we have made reasonable efforts to ensure the accuracy of its content, we
make no representations, warranties or guarantees, whether express or implied, that the content of the report is
accurate, complete or up to date. We disclaim liability for any loss, howsoever caused, arising directly or indirectly
from reliance on the information in this report.
This report has been prepared and is issued by Everoze Partners Limited (“Everoze”) to the named Client on the title
page in accordance with the contract document IWEA001-P-01-A dated 27 August 2019 which governs how and by
whom this report should be read and used.
Everoze Partners Limited is registered in England & Wales, Registration number 09588207
EVEROZE TEAM

Prepared by                                                                                   Andrew Strachan

Checked by                                                                                    Alex Olczak

Approved by                                                                                   Simon Bryars

Everoze Partners Limited is registered in England & Wales, Registration number 09588207

ABBREVIATIONS

AEP                     Annual Energy Production                                              OPEX                  Operational Expenditure
IWEA                    Irish Wind Energy Association                                         DUoS                  Distribution Use of System
LCOE                    Levelised Cost of Energy                                              TUoS                  Transmission Use of System
WACC                    Weighted Average Cost of Capital                                      TLAF                  Transmission Loss Adjustment Factor
CAPEX                   Capital Expenditure                                                   DLAF                  Distribution Loss Adjustment Factor
RVs                     Rateable Values                                                       ARV                   Annual Rate on Valuation

                                                                                                                                                                                  Page ii
DELIVERING 70 BY 30: SAVING MONEY

FOREWORD
Wind energy has led Ireland’s efforts to tackle climate change. It currently saves more CO2
emissions each year in Ireland than all other forms of renewable energy combined and in 2018
avoided €432 million in fossil fuel imports.
Like many other countries wind energy in Ireland required financial support over the last two
decades (i.e. REFIT) but, in return, wind energy has driven down the price of electricity on the
wholesale market.
Energy experts Baringa calculated that wind energy is currently reducing the wholesale price of
electricity each year by approximately 20 per cent, which is almost €400 million per year1. When
all costs and savings are accounted for, Baringa concluded that wind energy in Ireland has only
cost €1 per person per year since 2000. In return, the consumer is getting a third of electricity
from wind energy which is now saving more than 3 million tonnes of CO2 annually.
This story can get even better. Over the last 20 years the price of wind energy has been falling steadily. Wind farms in
the Nordic countries are selling power at prices as low as €30/MWh2 while in Spain, Germany, Turkey and Poland3 prices
have fallen to €40/MWh.
To put this in context, the average annual price on Ireland’s wholesale electricity market over the last 10 years ranged
from €45-65/MWh, so we have now entered an era where wind energy could potentially be cheaper as well as greener4.
But whether our industry achieves this is not solely up to us.
In the next two to three years the Irish Government will face an array of policy choices that can cut – or drive up – the
price of wind-generated electricity. Government Ministers, officials in various departments and other policymakers will
soon decide whether Ireland’s homes are powered with some of the most, or the least, expensive electricity in global
markets.
Baringa calculated previously that if onshore wind in Ireland can be delivered at €60/MWh, on average, between 2020
and 2030, then the 70 per cent renewable electricity target set out in the Climate Action Plan will actually be cost neutral
for the consumer5. If we can achieve prices under €60/MWh then Ireland’s electricity consumers will be saving money.
A key driver of falling prices in other countries was the move by policymakers from renewable electricity ‘tariffs’ to
‘auctions’. The REFIT scheme was tariff based, which meant that every wind farm got the same fixed price for its electricity,
typically around €80/MWh.
However, in an auction, each wind farm bids a price and only the projects that offer the best value make it into the
support scheme. The competitive bidding environment in auctions has driven down the price of renewable electricity in
other countries over the last decade and, as expected, Ireland will hold our first auction in July 20206.
Auctions have put price front and centre for renewable electricity in Ireland, but they are only part of the picture. Prices
will only fall if wind projects can provide their power at the best possible price. IWEA commissioned this work by Everoze
to examine a series of scenarios and policy choices available to the Government that will reduce or increase the cost for
consumers of electricity generated by wind power.
It is clear from the analysis that policymakers will have a huge influence over the cost of wind energy in the coming
decade. If all the potential savings are implemented then onshore wind in Ireland could absolutely match the record lows
in other EU countries of approximately €40/MWh. This requires taller turbines, 30-year consents, a more efficient

1
    https://www.iwea.com/images/files/baringa-wind-for-a-euro-report-january-2019.pdf
2
    https://iwea.com/images/Article_files/10._14.30_Cathrine_Torvestad.pdf
3
 https://www.linkedin.com/posts/giles-dickson-98607229_energy-renewableenergy-coal-activity-
6621332388104548352-ddci
4
    https://www.iwea.com/images/files/iwea-cheaper-and-greener-final-report.pdf
5
    https://www.iwea.com/images/files/70by30-report-final.pdf
6
    http://www.eirgridgroup.com/site-files/library/EirGrid/RESS1-AT-RESS-1-Auction-Timetable-171219.pdf

                                                                                                                      Page 1
DELIVERING 70 BY 30: SAVING MONEY

planning system, lower balancing costs in the electricity market, smarter grid connections, reforms to grid charges, and
capital allowances.
To achieve this, we have developed ten ‘cost saving’ policy choices demonstrating how policymakers can facilitate a 46.5
per cent drop in onshore wind costs.
But there is another possibility. The Government can also make a series of decisions that will, perhaps unwittingly, drive
up the cost of onshore wind energy in Ireland. If this is the road taken, a country with some of the best wind resources
in the world may end up paying some of the highest prices.
The most immediate decision is the proposed noise limits in the draft Wind Energy Development Guidelines, potentially
the most extreme in Europe, which will require wind farms to switch off if they create a noise louder than the hum from
your kitchen fridge.
With such extraordinary noise limits wind farms will need to be turned off much more often than in the past, which will
increase the cost of producing renewable electricity.
Another immediate concern is the ongoing revaluation being carried out by the Valuation Office, which is increasing the
commercial rates for a wind farm by 200-300 per cent. Longer-term, likely increases in constraints and curtailment on
the electricity grid will also add costs to wind energy development, as like the noise limits, these will require wind farms
to switch off more and more when the wind is blowing. When combined these measures could increase onshore wind
prices by 34 per cent which would increase costs to ~€100/MWh for onshore wind in Ireland.
So, if all savings are applied, Ireland will become a world-leader in low-cost wind energy and potentially reach levels of
€40/MWh, but if the wrong choices are made, if all the additional costs are imposed, Irish electricity consumers will see
the impact on their bills every month.
Under the new auction system, the ultimate beneficiary of lower onshore wind prices will be the electricity consumer. If
wind farms can offer lower prices into the auction, then the Irish electricity consumer will pay less on the PSO and, if
onshore wind can offer prices lower than the electricity market, wind farms could potentially be paying money back to
the electricity consumer.
International energy experts Pöyry calculated that for every €10/MWh reduction in wind energy in the auctions, the Irish
electricity consumer will save ~€1.5 billion.
Although this study is focused on onshore wind, many of the potential savings and costs are applicable to other forms of
renewable electricity also, particularly offshore wind and solar, which are also central to the Government’s plans for 70
per cent renewable electricity by 2030.
In this study, Everoze has shown that it is policymakers, not industry; Ministers and officials, not wind farm developers
and operators, who will decide whether onshore wind in Ireland is at €40/MWh or €100/MWh. Those decisions are
theirs, and theirs alone, to make and we hope this study will ensure the choices they make are informed and focused on
delivering renewable electricity at the lowest possible cost to the consumer.

Dr. David Connolly
CEO, IWEA

                                                                                                                     Page 2
DELIVERING 70 BY 30: SAVING MONEY

Policy Choices to Reduce the Cost of Onshore Wind in Ireland
                                                                                                                                                             Others
    Name                             Description                                       Lead Stakeholders                         Most Affected                             Cost Impact
                                                                                                                                                           Impacted^
                        Ensure that taller wind turbines can be                                                                All Consumers receive
    1. Tip                                                                    DHPLG, DCCAE, Communities, Local                                                             -27 per cent
                      accommodated in the revised Wind Energy                                                                 savings via the PSO due
   Heights                                                                       Authorities, An Bord Pleanála                                                             -€20.3/MWh
                              Development Guidelines                                                                         to lower RESS bid prices.
                                                                                                                                 All Consumers pay
   2. Noise         Ensure the revised Wind Energy Development                DHPLG, DCCAE, Communities, Local                 additional costs via the                    +11.4 per cent
    Limits          Guidelines do not include extreme noise limits               Authorities, An Bord Pleanála                PSO due to higher RESS                        +€8.6/MWh
                                                                                                                                      bid prices.
   3. Life                                                                     Local Authorities, An Bord Pleanála,                                       Offshore Wind;    -10 per cent
                      Grant planning for wind farms for 30 years                                                                  All Consumers.
  Extension                                                                                   DHPLG                                                            Solar        -€7.5/MWh
                  a) Enhanced community engagement; b) Implement             a) Wind farm developers; b) DHPLG &              All Consumers. Some
                   regional planning for wind energy; c) Improve SID         Regional Authorities (via REPDF); c) An             savings should be
 4. Simplified                                                                                                                                                             -1.5 per cent
                      engagement and decision timelines in An Bord           Bord Pleanála & DHPLG; d) DHPLG &                allocated to additional     Offshore Wind
   Planning                                                                                                                                                                 -€1.1/MWh
                   Pleanála; d) Facilitate grid consenting in parallel to   CRU to facilitate grid installations on public    resources in Regional
                                   wind farm consenting.                                       roads                            Authorities & ABP.
                  Continuation of the DS3 program to ensure enough
                 system services (reserve, inertia, reactive power, and
                                                                            CRU to provide enough resources via PR5
                    ramping) can be provided, ideally by zero-carbon
     5a.                                                                         and EirGrid/ESBN to implement,                                           Offshore Wind;   +10 per cent
                      services, to increase SNSP to 95 per cent and                                                            All Consumers. Some
 Curtailment                                                                particularly via continuation of DS3, more                                         Solar       +€7.5/MWh
                   eliminate ‘Min Gen’. Create more flexibility on the                                                            savings should be
                                                                            interconnection and flexible technologies.
                     Irish grid via interconnection and Demand Side                                                             allocated to EirGrid,
                                    Management/storage.                                                                         ESBN & industry to
                      Progress grid reinforcements based on future            CRU to provide enough resources via             invest in new solutions
                       development along with alternative network                 Price Review 5 and EirGrid to                       required.
    5b.                                                                                                                                                   Offshore Wind;    +8 per cent
                 solutions using best-in-class community engagement.         design/consent based on future outlook.
 Constraints                                                                                                                                                   Solar        +€6/MWh
                  Streamline EirGrid’s ‘six-step’ process and create a      ESBN to build the grid once a clear need is
                             Grid Capacity Advisory Council.                             demonstrated.
                                                                                                                               All Consumers will
                 Provide fixed grid charges (DLAF, TLAF, DuOS and                                                              benefit from lower
   6. Grid         TuOS) before financial close of a wind farm and                                                           capital costs. Reform of     Offshore Wind;    -3 per cent
                                                                            CRU to review grid charges methodology.
   Charges        allocate future cost changes to new connections                                                              grid charges should             Solar        -€2.3/MWh
                               and/or to be socialised.                                                                         otherwise be cost
                                                                                                                                      neutral.

                                                                                                                                                                                    Page 3
DELIVERING 70 BY 30: SAVING MONEY

                       More contestability for grid connections, sufficient                                                      All Consumers. Some
                                                                                  CRU via review of Hybrid policy, ECP
                      grid offers and alignment of grid offer process with                                                          savings should be
   7. Grid                                                                        policy and PR5. EirGrid and ESBN to                                        Offshore Wind;        -1 per cent
                         RESS auctions, facilitate hybrid connections by                                                         allocated to EirGrid &
 Connections*                                                                    implement Hybrid and ECP policy with                                             Solar            -€0.8/MWh
                    allowing separate legal entities and dynamic sharing of                                                        ESBN for additional
                                                                                    resources/incentives from PR5.
                              capacity at a single connection point.                                                              resources to deliver.
                           Create more flexibility on the Irish grid via
                      interconnection and DSM/storage; couple I-SEM to                                                            All Consumers with
                                                                                EirGrid via SEMO and CRU to update the
  8. Balancing        Europe via SIDC (formerly XBID); improve liquidity                                                         some savings offset by      Offshore Wind;        -3 per cent
                                                                                  I-SEM design. EirGrid to facilitate more
      Costs          in the continuous markets by allowing new products                                                            investment in new              Solar            -€2.3/MWh
                                                                                interconnection and flexible technologies.
                          and GB access to all intraday markets; avoid                                                                 solutions.
                                   excessive system margins.
                    Reverse recent increase in commercial rates for wind
                        farms so they are maintained at similar levels to
                                                                                  DHPLG to update the Valuation Act.           All Consumers. Reduced
     9.              those payable by fossil fuel generators. For example,
                                                                                Valuation Office to implement based on a       commercial rates liability                          +5 per cent
  Commercial           Ireland could decrease the rates payable by wind                                                                                            Solar
                                                                                 more transparent and robust valuation         will enable wind farms to                           +€3.8/MWh
    Rates            farms by updating the Valuations Act to exclude the
                                                                                         scheme for wind farms.                sell power more cheaply.
                      moving parts of a wind turbine which is the case in
                                        Northern Ireland.
                                                                                                                                Lower costs for wind,
                         Allow the capital costs associated with grid
   10. Grid                                                                                                                     but tax reductions will
                    connections to be included as capital expenditure like      Department of Finance and the Revenue                                        Offshore Wind;        -1 per cent
    Capital                                                                                                                      need to be collected
                    roads, turbines and electricity systems when reducing                 Commissioners                                                           Solar            -€0.8/MWh
  Allowances                                                                                                                    elsewhere or offset by
                      the amount of tax payable, as allowed in the UK.
                                                                                                                                future growth in wind.
                                                                                                                                                                                  -46.5 per cent
 Total Savings
                                                                                                                                                                                    -€35/MWh
                                                                                                                                                                                  +34.4 per cent
  Total Costs
                                                                                                                                                                                   +€26/MWh
^The analysis was originally based on onshore wind, but there are a number of policies that will potentially benefit offshore wind and solar also, which are also central to the Irish
government’s plans for 2030.
*This does not account for the cost of uncertainty due to grid delivery. For example, if renewable electricity auctions include ‘cliff edge’ deadlines then this will create additional risk for a
project, particularly in relation to the timelines for grid delivery. This will be an additional cost to consider and was beyond the scope of the analysis here.

                                                                                                                                                                                             Page 4
DELIVERING 70 BY 30: SAVING MONEY

           EXECUTIVE SUMMARY
The cost of electricity generated by onshore wind farms in Ireland has fallen since the first REFIT projects were
installed in 2006 and continues to fall. In addition to various technical and commercial factors, it is clear that policy and
regulation are key to driving down the cost of electricity from onshore wind.
The right policy choices can accelerate falling prices but, at the same time, making the wrong choices can push the cost
of electricity from onshore wind up, not down.
To support previous strategic studies on cost of energy trajectories in Ireland, IWEA has identified a series of policy
choices facing the Government today and in the next two to three years.
IWEA commissioned Everoze to assess the impact of these choices on the cost of electricity generated by onshore
wind in Ireland. A straightforward discounted cash flow model has been used to evaluate the discrete impact of each
policy scenario on overall LCOE.
The scenarios modelled in this report are summarised below, grouped under three broad themes:
       1. Planning and Environment
          • Increasing turbine tip heights to provide access to better wind resources and the latest turbine
              technology.
          • Applying some of the most extreme noise limits known to industry to wind farm development as
              proposed in the draft Wind Energy Development Guidelines.
          • Increasing a wind farm’s operating life.
          • Designing a more streamlined and predictable planning system.
       2. Grid Development and Reform
          • Rising levels of constraint and curtailment, collectively known as dispatch-down.
          • Reforming the system of charges7 imposed on wind farms.
          • Improving the development of grid connections, giving increased contestability, better standard
             requirements and promoting hybrid connections.
          • Reducing balancing costs in Ireland’s electricity market (I-SEM) through appropriate regulation, allowing
              volatility and encouraging storage.
       3. Tax Policy Reform
          • Increasing business rates for wind farms arising from the ongoing Ireland-wide revaluation.
          • Including grid connection costs as capital allowances in the same manner as other capital expenditure.

The results of the modelling exercise, presented graphically below, show that the choices for policymakers that would
cut the cost of wind energy by the greatest amount are:
       •   Increasing turbine tip height;
       •   Extending the operating life of wind farms;
       •   Reform balancing costs in the electricity market; and
       •   Reform of system charging.
All of these would deliver measurable, identifiable, direct savings to the Irish electricity consumer. More modest savings
could be realised from simplification of the planning consent process and a smarter approach to grid connections while
additional savings are also possible from reforming the tax treatment of grid connection costs.
On the other hand, the cost of onshore wind will increase significantly in the short term if the extreme noise limits
contained in the proposed Wind Energy Development Guidelines are implemented. This will mean higher bills for the
electricity consumer.

7
    System operators providing fixed loss factors (DLAF and TLAF) and use of system charges (DUoS and TUoS).

                                                                                                                       Page 5
DELIVERING 70 BY 30: SAVING MONEY

Further short-term cost increases would result if commercial rates continue to rise for wind farms under the ongoing
revaluation.
Over the longer-term, there is a further risk of significant price rises from delays to the reinforcement of the electrical
grid (resulting in increased constraints) or failure to build on the success of the DS3 programme (resulting in increased
curtailment), both of which would push up the price of electricity in Ireland.

                       n Cost reducer – direct consumer saving   n Cost raiser – direct consumer cost
                       n Cost reducer – savings transferred      n Cost raiser – costs transferred

Our analysis shows just how significant the role of Irish policymakers will be in supporting the development of onshore
wind energy at the best possible price for the consumer.
It also makes clear that the Government has a major role to play in supporting industry to achieve the Climate Action
Plan’s target to meet 15 per cent of electricity demand from renewable sources contracted through Corporate PPAs.8
The choices made by policymakers will determine the price wind farms can offer the large energy users who are the
potential customers for such agreements. The more prices can be reduced, the stronger the likelihood of achieving that
target.
However, the wrong policy choices can increase costs and wipe out the savings that may be obtained from other
efforts. Therefore, a measured approach, that is mindful of the consequences for cost of energy, needs to be taken if
continued cost reductions are to be achieved.
An important caveat to this study is that levelised cost should not be confused with bid prices or strike prices. It must
be emphasised that this analysis provides only an assessment of the relative impact of policy scenarios on overall LCOE
for a notional base case site.
It is not an attempt to prejudge any derivation of bid price or strike prices that may be put forward as part of the
upcoming RESS auction process. There are many technical and commercial factors that will influence the bid price that
is appropriate for an individual project and this report does not seek to define the bounds of such factors.
By putting a price tag on various policy levers that are available to government Everoze hopes that this report will help
prioritise efforts on future policy changes across all stakeholders such as IWEA, EirGrid, ESB Networks, CRU, An Bord
Pleanála, Valuation Office, DCCAE, DHPLG, and DPER.

8
    https://www.dccae.gov.ie/documents/Climate%20Action%20Plan%202019.pdf

                                                                                                                     Page 6
DELIVERING 70 BY 30: SAVING MONEY
INTRODUCTION
2.1 CONTEXT AND OBJECTIVES
The cost of electricity generated by onshore wind farms has fallen since the first REFIT projects were installed in 2006
and continues to fall. Advances in turbine technology, improvements in yield assessment, better project design and
streamlining of supply chains have combined to allow new projects to deliver electricity to the Irish consumer more
economically than ever before.
The wind industry in Ireland is rightly proud of their achievements and recognises that there is more that could be
done to deliver wind generated electricity even more cheaply and so further lead Ireland’s transition to a low-carbon
economy.
Policy and regulation are key to reducing cost. The right policies can reduce the price of electricity; however, if the
wrong choices are made we will see the cost of electricity from onshore wind rise, not fall.
The findings of the Economic analysis to underpin a new renewable electricity support scheme in Ireland (DCCAE, May 2017)
and 70 by 30, A 70 per cent renewable electricity vision for Ireland in 2030 (Baringa, October 2018) studies mapped out a
cost reduction trajectory for Irish onshore wind. The 70 by 30 study defined the price point (€60/MWh LCOE) at
which onshore wind reaches parity with fossil fuel generation, meaning that electricity from wind power can be
generated at no net-cost to the Irish consumer.
While these studies provided valuable macro-economic context for renewable electricity, they did not explicitly identify
how policymakers can help to achieve the desired objective of cutting energy costs or how they might undermine it.
The Irish Wind Energy Association (“IWEA”) has commissioned Everoze Partners Limited (“Everoze”) to assess the
sensitivity of the cost of electricity generated by onshore wind in Ireland to various policy scenarios.
The objective of this study is to aid the development of energy policy by putting a price on the various choices and
options available to the Government. Only by understanding how a decision can increase or reduce the cost of
electricity can informed choices be made.
2.2 ABOUT EVEROZE
Everoze is an employee-owned renewables, storage and energy flexibility consultancy. Our unique strength is bridging
the gap between the technical and the commercial. We are a team of over 50 consultants who are flexible, experienced
and interdisciplinary, working closely with our clients to make projects, companies and technologies futureproof and
financeable.
Everoze is a leading provider of independent technical due diligence in the onshore wind sector in Ireland, having
advised many of the leading players in the renewables investment community on over 50 individual wind farms over the
past 4 years.
Everoze is experienced in the field of techno-economic modelling of a range of technology types, as evidenced by the
following publicly available strategic studies:
• Onshore Wind in Scotland: opportunities for reducing costs and enhancing value, August 2016
• Batteries: beyond the spin, October 2017
• Cracking the Code: a guide to energy storage revenue streams and how to derisk them, July 2016
• Swarm Governance: flying to a future of domestic energy-as-a-service, June 2019
In addition to the above studies, Colin Morgan, a founding partner at Everoze, chaired the Renewable UK onshore wind
cost reduction task force, which produced the influential Onshore Wind Cost Reduction Taskforce Report in April 2015.
Page 7DELIVERING 70 BY 30: SAVING MONEY
MODELLING METHODOLOGY
3.1 MODELLED SCENARIOS
In collaboration with IWEA, Everoze has developed the following 10 scenarios that have formed the basis of the LCOE
sensitivity testing described in this report. These scenarios fall under three broad themes of:
• Planning and Environment;
• Grid development and reform; and
• Tax policy reform.
Further details of each scenario are given in Sections 4, 5, and 6.
Group No. Title Scenario description
Planning and 1 Tip heights Assesses the impact of increased Annual Energy Production
Environment (AEP) realised through increasing tip heights from 125m to
150m or 180m.
2 Noise Assesses the impact of AEP reduction due to extreme noise
emission regulations.
3 Life extension Assesses the impact of increasing wind farm operating life from
20 years to 25 years or 30 years.
4 Simplified planning Assesses the impact of reduced development costs as a result of
more readily obtained planning consent.
Grid 5 Constraint and Assesses the impact of increased constraint and curtailment
development Curtailment losses.
and reform
6 System charging reform Assesses the impact of fixed loss factors (TLAF) and charges
(DUoS & TUoS), allowing reduced Weighted Average Cost of
Capital (WACC).
7 Smart connections Assesses the impact of reduction in grid connection costs
through increased contestability, improved standard
requirements and promotion of hybrid connections.
8 Balancing cost reform Assesses the impact of reducing balancing costs in the wholesale
electricity market through appropriate regulation, allowing
volatility and encouraging flexible technologies such as
interconnection and storage.
Tax policy 9 Business rates reform Assesses the impact of the proposed increase in commercial
reform rates for onshore wind farms.
10 Grid capital allowances Assesses the impact of adjusting the tax treatment of grid
connection costs.
TABLE 1: LCOE SCENARIO SUMMARY
3.2 MODELLING APPROACH
Everoze has used a discounted cash flow model to evaluate the discrete impact of each policy scenario on overall
LCOE. This is a spreadsheet tool that is typically used to model key assumptions about a particular business (i.e.
lifetime, revenue, CAPEX, and OPEX) and determine the return on the capital invested. In the context of this study, the
same model can be used in reverse to evaluate the cost of energy associated with a fixed cost of capital.
For each of the scenarios listed in Section 3.1 the impact on the following project cost drivers, relative to a base case
set of conditions, has been estimated:
Page 8DELIVERING 70 BY 30: SAVING MONEY
• WACC – Weighted average cost of capital;
• AEP – Annual energy production;
• Operating life;
• CAPEX – Capital expenditure associated with development and construction;
• OPEX – Operational expenditure associated with the operation of the wind farm.
Details of the adjustments made to each of the input variables are presented in Appendix 1.
The base case used as the starting point of the analysis has been derived from the DCCAE 2017 economic analysis and
is intended to represent a reasonably typical REFIT2 project9. The key parameters of the base case are as follows:
• LCOE of €75.00 per MWh;
• Nine 2 MW wind turbines with 90m hub height and 125m tip height;
• 20-year operating life;
• 7.7 m/s hub height wind speed, with an associated capacity factor of 36.2 per cent, or 57,100 MWh per annum;
• CAPEX and OPEX on a € per MW basis, based on the DCCAE 2017 study, bolstered by industry experience;
• WACC of 6.6 per cent.
To support the overall base case assumptions, Everoze has also undertaken an analysis of recent wind farm projects in
Ireland to evaluate the breakdown of CAPEX across a number of cost line items including turbine supply, civil balance
of plant (CBoP), electrical balance of plant (EBoP), grid connection, development costs (DEVEX), and financing costs.
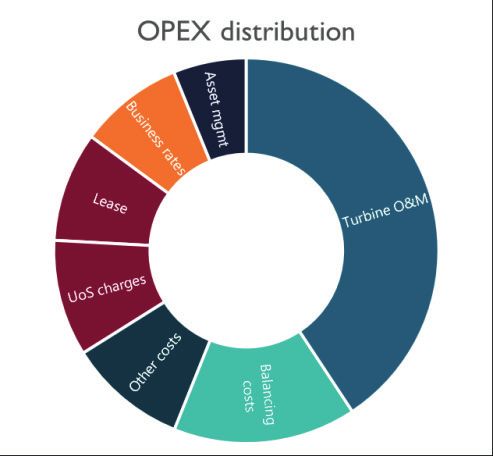
A similar analysis has also been undertaken for OPEX to assess the relative contribution of technical costs (such as
turbine maintenance and asset management), and non-technical costs (such as balancing costs, use of system costs, lease
costs and business rates).
With these CAPEX and OPEX distribution profiles in hand, as shown graphically below, the impact of a change in one
cost component on the overall CAPEX or OPEX allocation can be evaluated. For example, it can clearly be seen that a
10 per cent change in turbine supply cost will have a greater impact on overall CAPEX than a 10 per cent increase in
EBoP cost.
FIGURE 1: CAPEX AND OPEX DISTRIBUTIONS
It must be emphasised that this analysis provides only an assessment of the relative impact of policy scenarios on overall
LCOE for a notional base case site. It is not an attempt to prejudge any derivation of bid price or strike prices that may
be put forward as part of the upcoming RESS auction process. There are many technical and commercial factors that
will influence the bid price that is appropriate for an individual project and this report does not seek to define the
bounds of such factors.
9
Typical REFIT2 project is based on Everoze’s experience acting as technical advisor to REFIT2 wind farm acquisition
and project financing transactions.
Page 9DELIVERING 70 BY 30: SAVING MONEY
PLANNING AND ENVIRONMENT
Everoze has analysed a total of six scenarios that fall under the theme of planning and environment related policy
interventions. The LCOE impact of each scenario is presented graphically in the table below. Subsequent subsections
provide further background on the rationale and approach for each scenario.
Scenario 1a Scenario 1b Scenario 2 Scenario 3a Scenario 3b Scenario 4
Increased
Tip height up Tip height up 25-year life 30-year life Simplified
noise
to 150m to 180m extension extension planning
curtailment
TABLE 2: PLANNING AND ENVIRONMENT PRICE TAG SUMMARY
4.1 SCENARIO 1: TIP HEIGHTS
Turbine tip height, which is the distance from the bottom of the turbine tower to the uppermost limit of the rotor, is
usually explicitly constrained by planning consents granted to wind farms. As modern turbines have grown, so too have
tip heights also increased.
While permitted tip heights in Ireland are increasing, they have only recently begun to exceed a level of around 125m.
In this respect Ireland is a laggard behind other markets across Europe – for example, tip heights in Scandinavian
countries often exceed 200m, a key factor in reducing costs to ~€30/MWh in these countries10.
While there are several valid reasons for limiting tip heights for new developments, such as managing visual impact,
minimising such limitations would enable Ireland’s wind resource to be captured more efficiently and, as a consequence,
at a lower cost.
There is a trend towards permitting of greater tip heights, which will provide benefits in terms of cost of energy, for the
reasons set out below.
4.1.1 Increasing tip heights gives improved wind conditions
Wind speeds close to the ground are lower than wind speeds at higher heights – this is what is termed “wind shear”.
Another property of wind shear is that wind speeds over a given vertical distance are increasingly similar the further
above ground one is. The consequence of these two physical properties is that the energy yield of a wind turbine
generally increases with increased tip height. Depending on the model of turbine a height increase of 20 per cent can
provide a 180 per cent increase in power capacity.
While this effect has an upper limit, since structural considerations mean that unlimited tower height is neither feasible
nor desirable, it is correct to say that wind turbines being installed in Ireland today are at the lower end of the available
hub height range.
In Everoze’s experience, the wind conditions on Irish wind farm sites developed in recent years have been more benign
than the conditions that the chosen turbines are designed for. This “over-engineering” is in part a consequence of tip
height restrictions, which constrain the tower height and prevent the deployment of the turbines in their optimum
configuration. If tip heights could be higher then the turbines could be installed on taller towers, producing additional
energy at minimal cost.
10
https://iwea.com/images/Article_files/10._14.30_Cathrine_Torvestad.pdf
Page 10DELIVERING 70 BY 30: SAVING MONEY
4.1.2 Increasing tip heights allows deployment of the latest technology
The product range of all major turbine manufacturers is subject to ongoing development. A consistent trend across
manufacturers has been towards turbines with larger MW capacity, larger rotor diameters, and higher hub heights.
Deploying higher capacity turbines will increase annual energy output from a given wind farm, and the increase in
energy yield will offset any increase in the turbine cost, resulting in a reduction in cost per MWh.
The latest generation of turbines also tend to have several other beneficial features such as more sophisticated
electrical characteristics to better support the grid, monitoring equipment to eliminate shadow flicker and improved
noise control modes.
Current tip height restrictions that are commonly seen in Ireland will prevent the very latest generation of turbines
from being widely deployed. This may result in a very limited market of turbines for projects to choose from. Using
older turbine models also poses an operational and maintenance risk. Both factors will lead to increased costs for Irish
wind farms.
4.1.3 Modelled scenarios and results
For the purposes of this LCOE modelling study, Everoze has investigated the impact of increasing the tip height from
the base case value of 125m to two higher values that both increase the available wind resource, and permit
deployment of larger turbines. The key inputs to the scenarios considered are summarized in the table below.
TIP HEIGHT TURBINE CAPACITY HUB HEIGHT ROTOR DIAMETER HUB HEIGHT WIND SPEED
125m 2 MW 80 m 90m 7.7 m/s
150m 4.2 MW 91.5 m 117m 7.9 m/s
180m 5.6 MW 105 m 150m 8.1 m/s
TABLE 3: TIP HEIGHT SCENARIO KEY ASSUMPTIONS
The wind speeds for the 150m and 180m scenarios have been derived by applying a power law wind shear profile to
the 125m base case wind speed, assuming a shear exponent (α) of 0.2.
For each of the tip height scenarios, Everoze has estimated annual energy production that could be achieved from a
nine-turbine layout by running a basic wind flow and energy computational model. The model was based on the
assumption of no complex terrain or forestry. Whilst this is unlikely to be representative of a real site, it is a reasonable
approach for assessing the relative impact on LCOE, which is the focus of this study.
In addition to the estimation of energy production, the CAPEX and OPEX assumptions have been adjusted to reflect
expected cost savings, on a € per MW basis, that can be achieved via deployment of larger capacity turbines. Whilst the
absolute cost of a larger turbine will be greater than a smaller machine, there is an economy of scale that will result in
the capital cost of turbines and their foundations reducing on a € per MW basis. Similar economies of scale also apply
to the operational costs associated with maintaining larger turbines.
Result: The results of modelling the tip height scenarios show that significant cost reductions can be
realised by increasing tip height to access better wind resource and to allow larger more cost-efficient
turbine models to be deployed, with LCOE reductions of 12 per cent and 27 per cent from the 150m and
180m scenarios respectively.
4.2 SCENARIO 2: NOISE
Wind farms in Ireland are frequently constructed in proximity to neighbouring dwellings. In order to ensure that people
are not subjected to unacceptable levels of noise from the wind farm, planning consents usually define the acceptable
noise levels at neighbouring properties.
Page 11DELIVERING 70 BY 30: SAVING MONEY
Historically, noise limits for wind farms in Ireland have been based on the limits proposed in the 2006 version of the
Irish Wind Energy Development Guidelines, which were typically 43 dB(A) at night and 45 dB(A) during the day11.
In 2017, the government proposed a ‘Preferred Draft Approach’ (PDA) for the new Wind Energy Development
Guidelines which indicated that there would be much stricter noise limits in the future, equating to a maximum noise
limit of 35-43 dB(A) at all times, day or night, but linked to the background noise that exists during these times:
“…proposing a relative rated noise limit of 5dB(A) above existing background noise within the range of 35 to 43dB(A) for both
day and night, with 43dB(A) being the maximum noise limit permitted”12.
Implementing these stricter limits will increase the need to turn off wind turbines in order to comply with more
onerous noise limits. Based on the noise limits suggested in the PDA, IWEA members have estimated the likely impact
of the proposed noise limits on a series of sample wind farm sites.
The noise curtailment analysis was carried out by modelling ten different wind farms from several different IWEA
members. The types of wind farm assessed were a mix of existing operational sites and pre-planning ‘green field’ wind
farm sites.
Due to the commercial sensitivity of the data gathered, the results were anonymised, and the average curtailment levels
were deduced. For each site, the assessment compared the curtailment levels of a wind farm when the 2006 Wind
Energy Development Guidelines noise criteria were applied to them, and those when the proposed limits in the PDA
were applied.
Across the ten different sites the additional curtailment due to the stricter noise limits in the PDA varied from a low of
1.6 per cent to a high of 20 per cent. The average was 9.5 per cent, so in this analysis, it is assumed that the more
onerous noise limits will typically increase the curtailment from an Irish wind farm by approximately 10 per cent.
Result: Modelling this assumption shows that significant LCOE increases of over 11 per cent would
result from an additional 10 per cent of curtailment.
After this analysis was completed, the Irish Government published the draft Wind Energy Development Guidelines for
consultation13. As expected, the new noise limits aligned in general with those proposed in the PDA at 35-43 dB(A), but
importantly there are other proposals in the methodology for applying these noise limits which would increase the
curtailment levels of a wind farm even further than envisaged in the PDA.
Therefore, the analysis above should be considered a conservative estimate of the impact of the new noise limits
proposed in the new Wind Energy Development Guidelines.
4.3 SCENARIO 3: LIFE EXTENSION
The duration of a wind farms’ operating life is constrained primarily by planning consent and technical considerations.
Planning consents for onshore wind farms in Ireland will include conditions that limit the permitted operational life of
the project. This consented period often commences on first export of electricity from the wind farm and usually
permits an operating period of either 20 or 25 years. Decommissioning of the project is required after the end of this
period. In the past, it was unusual in Ireland to see consent for operating periods longer than 25 years.
In addition to planning constraints, wind turbines are generally designed in accordance with the IEC-61400-1
international design standard. Implicit within this design standard is an assumption of a 20-year operating life and
therefore it can be said that turbines have a “design life” of 20 years beginning upon completion of turbine construction.
The design life of a wind turbine is driven by the frequency and magnitude of repeated structural loads, which are
themselves induced by the wind conditions that the turbine experiences on a given site. This fatigue loading is affected
not only by average wind speed, but also wind turbulence, wind shear, air density and temperature. The operational
behaviour of the turbine is also relevant.
11
https://www.opr.ie/wp-content/uploads/2019/08/2006-Wind-Energy-Development-1.pdf
12
https://www.housing.gov.ie/planning/guidelines/wind-energy/coveney-and-naughten-announce-key-development-
review-wind-energy-development-guidelines
13
https://www.housing.gov.ie/guidelines/wind-energy/public-consultation-revised-wind-energy-development-guidelines
Page 12DELIVERING 70 BY 30: SAVING MONEY
As part of the IEC design standard a series of pre-defined wind condition parameters, or “classes”, are used to design
turbines that are capable of withstanding conditions at the limit of the applicable design class. Thus, a turbine model
may be referred to as a “Class 1A” turbine, or a “Class IIB” turbine.
It is normal for the climatic conditions on a specific site to be evaluated as part of the wind farm development process,
usually via a series of site measurements. It is often the case that some climatic condition parameters are less onerous
than the limits of the applicable design class and this presents a potential opportunity for the operating life of a project
to be extended without compromising the structural integrity of the turbines.
The impact of increasing operating life on the present value of a wind farm is already well known in the wind industry.
Considering how best to extend the life of a wind farm through asset-sweating, refurbishment, re-planting or other
means is of increasing commercial interest. This is particularly true in markets where energy price support mechanisms
are being removed and projects are more exposed to merchant pricing risk.
For the purposes of this LCOE modelling study, Everoze has evaluated the impact of increasing the operating life from a
base case of 20 years to 25 years and 30 years, for which some wind farms in Ireland are now obtaining consent.
Extending the operating life of a wind farm, while technically feasible in principle, is not cost-free as it is likely that
turbine O&M costs will increase in later years to reflect the additional maintenance effort required to keep an ageing
asset operating efficiently. Within the LCOE model Everoze has assumed that turbine O&M costs step up relative to
the base case by 10 per cent in years 21-25 and by 15 per cent in years 26-30.
Result: The results of the modelled scenarios shows that the additional revenue realised from extending
the operating life of a project outweighs the additional O&M costs, with LCOE reductions of 6.2 per
cent and 10 per cent for the 25 and 30-year scenarios respectively.
4.4 SCENARIO 4: SIMPLIFIED PLANNING
Obtaining planning consent for an onshore wind farm is a time-consuming and costly exercise. A robust planning
process is an important part of responsible development, but there is significant potential to streamline the current
system. IWEA has identified the following areas where simplification of the planning process could be achieved:
• Improved spatial planning to identify areas that are suitable for wind energy development on a regional level;
• A clearer and more interactive pre-application SID (Strategic Infrastructure Development) process that
enables fatal flaws to be identified pre-planning;
• Reduced An Bord Pleanála decision timelines; and
• Enable grid connections to be designed and consented in parallel with the main wind farm consent.
Addressing these areas would prevent the planning process from being unnecessarily protracted and would enable the
associated development costs to be reduced.
In addition to a general streamlining of the planning process, the policy choices that IWEA is suggesting would also
reduce the uncertainty in the planning process and enable developers to identify successful projects at an earlier stage.
Weeding out unsuccessful sites earlier will prevent unnecessary cost and would reduce the overall failure rate of the
development process. Since the cost of energy realised from successful projects needs to cover the underlying costs of
development, including some recovery of DEVEX spent on unsuccessful sites, improving the success rate of the
development process would allow a reduction in LCOE.
Result: Based on feedback from members IWEA has estimated that the four policy innovations
described below could collectively give a 28 per cent reduction in DEVEX which in turn would mean a
2.4 per cent reduction in overall CAPEX for a given project. Running this scenario through the cost
model shows an LCOE reduction of 1.5 per cent.
The following sections give a high-level description of the policy innovations proposed by IWEA in relation to the
planning process.
4.4.1 Reduce pre-planning attrition
The spatial planning and identification of suitable areas for wind energy development has, to date, been the
responsibility of local authorities, typically achieved through their County Development Plans or specific Renewable
Energy Strategy documents.
Page 13DELIVERING 70 BY 30: SAVING MONEY
Many revisions or variations to County Development Plans have been made or attempted because of issues arising
from individual planning applications. This has created confusion in national policy and an inconsistent planning
environment across the country. In many cases intervention by the Minister of Housing, Planning and Local
Government has been required to restore alignment between local and national policy.
The Department of Communications, Climate Actions and Environment (DCCAE) is currently preparing a Renewable
Electricity and Policy Development Framework (REPDF) for the guidance of An Bord Pleanála, planning authorities,
other statutory authorities, the general public and persons seeking development consent for largescale onshore
renewable electricity projects.
IWEA believes it is necessary to carry out spatial planning for renewable energy on a national and regional basis, rather
than at the local authority level as has been the case to-date. To complement the REPDF currently being prepared by
DCCAE, IWEA urges that the preparation of Regional Renewable Energy Strategies be accelerated and prioritised by
the three Regional Assemblies.
A regional approach could be used to strategically designate areas within each region for the development of wind
energy. This would help address some of the significant planning contradictions, particularly the inconsistent inter-
county approaches taken to designating areas as suitable for wind energy.
By implementing a robust spatial planning approach and defining “areas of search” within each region that are identified
as suitable for wind development, this will reduce the number of sites that are developed to a planning consent stage
only to fail to obtain consent.
Based on feedback from IWEA members, developers currently assume a development failure rate of 33 per cent – in
other words, one out of every three sites for which they seek planning consent will not proceed to construction.
Implementing a consistent regional planning approach, as described above, is estimated by IWEA members to have the
potential to reduce the failure rate to 15 per cent.
4.4.2 Improve SID success rates
Wind energy projects with a proposed capacity of 50MW or greater must apply to An Bord Pleanála for planning
permission via the Strategic Infrastructure Development (SID) process. The success rate of SID wind farm applications
and decision timeframes have both improved in recent years. However, there remains significant room for
improvement in how the SID application process is structured, particularly with regards to the “pre-determination”
stage.
It can regularly take more than 12 months to determine whether a project can be classed as SID, a necessary step
before an application for planning permission can be even submitted. Many subsequent SID applications have been
refused for reasons that could and should have been identified much earlier in the process. Applicants, planning
authorities, An Bord Pleanála and third parties, all expend significant time and resources on such applications which, if
unsuccessful, do nothing to help deliver strategic national infrastructure.
In IWEA’s view, the process of determining and confirming whether a proposed project constitutes SID should be
greatly simplified. A formal and meaningful pre-application consultation process for SID projects, akin to that in place
for Strategic Housing Development (SHD) applications, would be a sensible way to support the development of
strategic infrastructure projects. Such a process is proving very effective in the SHD (Strategic Housing Development)
process by identifying material issues in early stage discussions and providing applicants an opportunity to address those
issues pre-application.
Based on feedback from IWEA members developers currently see a failure rate of SID applications of around 62 per
cent. With a clearer and more interactive pre-application SID process that enables fatal flaws to be identified pre-
planning, IWEA expects the failure rate at SID application stage could fall to 25 per cent. This would enable costs
associated with unsuitable sites to be minimised.
4.4.3 Reduce ABP decision timelines
An Bord Pleanála currently has a statutory objective to decide or dispose of appeals within 18 weeks. However, where
the Board does not consider it possible or appropriate to reach a decision within 18 weeks (e.g. because of delays
Page 14DELIVERING 70 BY 30: SAVING MONEY
arising from the holding of an oral hearing), it informs the parties of the reasons for this and shall state when it intends
to make the decision.
An IWEA analysis of wind farm appeals decided by An Bord Pleanála between 2017 and mid-2019 determined the
average period that appeals were under consideration by An Bord Pleanála was 66 weeks. An analysis of appeals for
wind farm grid connections decided by An Bord Pleanála between 2018 and mid-2019 found that a decision, on average,
took a further 67 weeks.
These average periods for appeals on wind farms and their associated grid connections are far in excess of the 18-week
statutory objective period, and three times the average period for all appeals decided by An Bord Pleanála in 2018.
IWEA believes that the statutory objective period of 18 weeks for An Bord Pleanála to decide on appeals should
become a statutory decision period. A similar approach was introduced for SHD applications submitted directly to An
Bord Pleanála and the Board has proven its ability to meet these statutory deadlines when assigned the necessary
resources to do so.
4.4.4 Consenting of shallow connection assets
IWEA has identified several issues with the consenting of grid connection works for wind farms, or “shallow connection
assets” as they are otherwise known.
At a high level, the current approach to consenting of wind farms and their connection assets often requires a
sequential approach by first obtaining planning permission for the wind farm, then negotiating a connection offer and
finally obtaining consent for the wind farm grid connection.
Based on the historical performance of local authorities, An Bord Pleanála, ESB Networks and EirGrid, the overall
process can take up to six years. Ongoing development costs are incurred throughout this consenting period.
Streamlining and reducing the time required for completion of the consent process would reduce DEVEX and
therefore the cost of energy.
IWEA aims to increase the proportion of projects that consent their grid connection in parallel with the wind farm
from 20 per cent to 80 per cent, through the following principle policy changes:
1. Enable parallel consenting of wind farms and grid connections by improving strategic development of grid
connection assets; and
2. Streamline the consenting of grid connections, particularly in relation to consent from landowners along public
road corridors.
The key issues underlying these objectives are further summarised below.
1. Parallel consenting of wind farms and grid connections
As a result of changes to long-standing custom and practice in relation to wind farm grid connections, a separate
planning permission application for grid connections is now often required after planning permission for the wind farm
has already been secured.
IWEA estimates that in the case of 80 per cent of wind farm projects in recent years, a separate and subsequent
planning permission was required for the wind farm’s grid connection, after planning permission had already been
secured for the actual wind farm.
Under current policy, projects are not able to apply for a grid connection offer until they have first received planning
for the main facility. Grid connection applications from various projects are then batched together. EirGrid and ESB
Networks choose a connection method for each batch, considering grid policy and creating sub-groups that share
certain assets where such an approach is deemed the most efficient approach.
Based on an IWEA analysis of timelines for wind farm and grid connection consents and grid connection offers, the
average overall timeline for obtaining consent for the wind farm, negotiating a connection offer and obtaining consent
for the wind farm grid connection can run to more than six years, roughly broken down as follows:
• Wind farm consent: The average time for local authorities to decide on wind farm planning applications
stands at 38 weeks. As noted in the preceding section, the average time for An Bord Pleanála to conclude on
wind farm planning appeals is a further 66 weeks. The total average wind farm consent time stands at 104
weeks, or two years.
Page 15You can also read