National Rail Freight Infrastructure Capacity and Investment Study - September 2007
←
→
Page content transcription
If your browser does not render page correctly, please read the page content below
National Rail Freight Infrastructure
                Capacity and Investment Study

prepared for
Association of American Railroads                        September 2007
by
Cambridge Systematics, Inc.

                                        www.camsys.com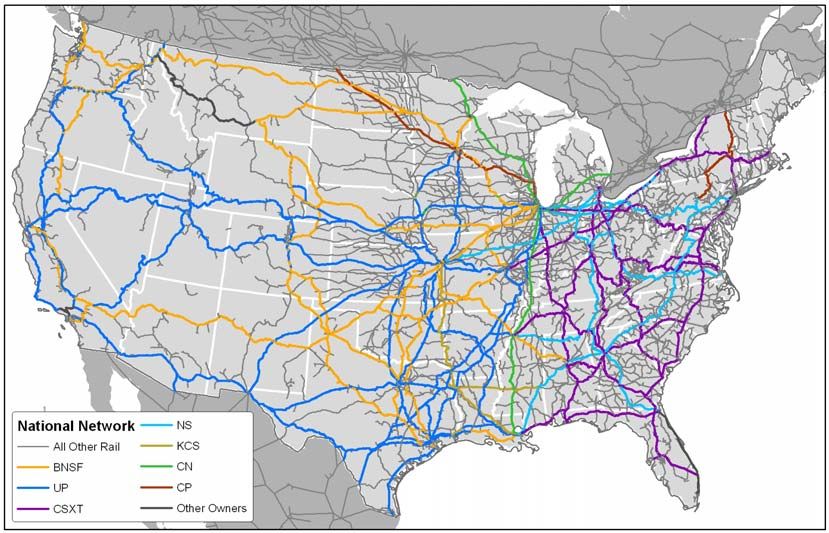
final report

National Rail Freight Infrastructure
Capacity and Investment Study

prepared for

Association of American Railroads

prepared by

Cambridge Systematics, Inc.
100 Cambridge Park Drive, Suite 400
Cambridge, Massachusetts 02140

date

September 2007
National Rail Freight Infrastructure Capacity and Investment Study

Table of Contents
                  Executive Summary .................................................................................................. ES-1

                  1.0    Objective...............................................................................................................1-1

                  2.0    Background ..........................................................................................................2-1

                  3.0    Methodology........................................................................................................3-1

                  4.0    Current Train Volumes and Capacity.............................................................4-1
                         4.1 Primary Corridors ......................................................................................4-1
                         4.2     Current Volumes ........................................................................................4-2
                         4.3     Current Capacity.........................................................................................4-5
                         4.4     Current Volumes Compared to Current Capacity.................................4-8
                         4.5     Current Railroad Investment in Capacity .............................................4-11

                  5.0    Future Train Volumes and Capacity ...............................................................5-1
                         5.1     Future Volumes...........................................................................................5-1
                         5.2     Future Volumes Compared to Current Capacity...................................5-5

                  6.0    Rail Capacity Improvements ............................................................................6-1
                         6.1     Capacity Improvements.............................................................................6-1
                         6.2     Future Volumes Compared to Future Capacity.....................................6-2

                  7.0    Investment Requirements .................................................................................7-1
                         7.1     Cost of Improvements................................................................................7-1
                         7.2     Cost Savings from Productivity Improvements.....................................7-4
                         7.3     Railroad Investment Capacity ..................................................................7-5
                         7.4     Investment Requirements for Class I Railroads .....................................7-6

                  8.0    Conclusions..........................................................................................................8-1

                  A.     National Rail Freight Infrastructure Capacity and Investment Study:
                         Methodology ........................................................................................................A-1
                         A.1 Introduction................................................................................................A-1
                         A.2 Line Capacity Expansion ..........................................................................A-2
                         A.3 Intermodal and Carload Terminals, and Service Facility
                             Capacity Expansion.................................................................................A-19

Cambridge Systematics, Inc.                                                                                                                        i
7876.001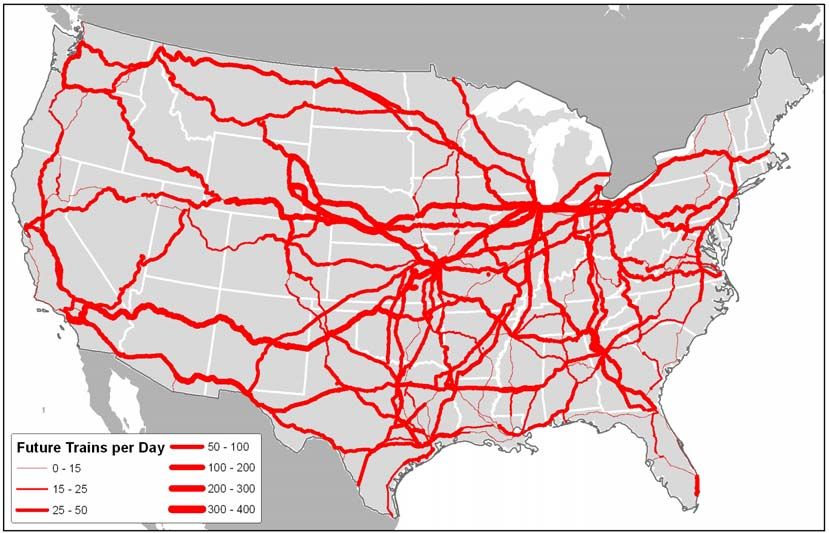
National Rail Freight Infrastructure Capacity and Investment Study

List of Tables
                  Table 4.1 Typical Number of Cars or Intermodal Units by Train
                            Service Type................................................................................................4-3
                  Table 4.2 Average Capacities of Typical Rail-Freight Corridors
                            Trains per Day .............................................................................................4-7
                  Table 4.3 Volume-to-Capacity Ratios and Level of Service (LOS) Grades ........4-8
                  Table 4.4 Primary Rail Corridor Mileage by Current Level of Service
                            Grade Current Volumes and Current Capacity .......................................4-10
                  Table 5.1 Primary Rail Corridor Mileage by Future Level of Service Grade
                            2035 without Improvements ........................................................................5-6
                  Table 6.1 Average Capacities of Typical Rail-Freight Corridors
                            Trains per Day .............................................................................................6-1
                  Table 6.2 Primary Rail Corridor Mileage by Future Level of Service Grade
                            2035 with Improvements .............................................................................6-3
                  Table 7.1 Cost of Rail Freight Infrastructure Improvements
                            Millions of 2007 Dollars ..............................................................................7-2
                  Table 7.2 Average Unit Costs ...................................................................................7-3
                  Table A.1 Empty Return Ratios Used in the STB’s URCS Phase 3 and
                            Waybill Costing Programs All Cars, 2005 Ratios ..................................A-5
                  Table A.2 Average Train Length Number of Cars ...................................................A-6
                  Table A.3 FAF2.2 Commodity Assignment to Rail Service Type for
                            Establishing Forecast Growth Rates ......................................................A-8

Cambridge Systematics, Inc.                                                                                                             iii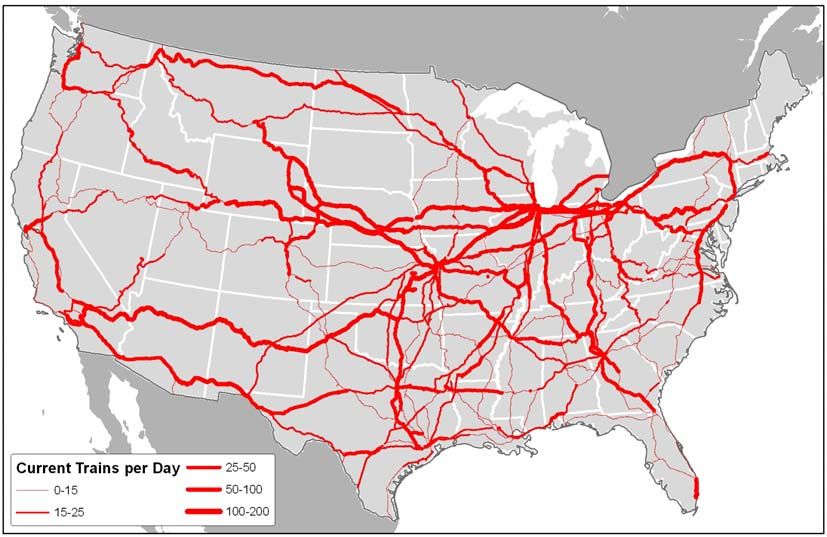
National Rail Freight Infrastructure Capacity and Investment Study

List of Figures
                  Figure 2.1 Vehicle Miles of Travel and Lane Miles 1980 to 2005 ...........................2-2
                  Figure 2.2 Rail Freight Ton-Miles and Track Miles
                             Class I Railroads, 1980 to 2006....................................................................2-3
                  Figure 2.3 Total Logistics Cost Percentage of Gross Domestic Product ....................2-4
                  Figure 2.4 Truck and Rail Market Shares in Ton-Miles 2005 and 2035 .................2-6
                  Figure 4.1 National Rail Freight Network and Primary Rail
                             Freight Corridors .......................................................................................4-1
                  Figure 4.2 Primary Rail Freight Corridors ...............................................................4-2
                  Figure 4.3 Current Corridor Volumes by Primary Rail Freight Corridor
                             2005 Freight Trains and 2007 Passenger Trains per Day...........................4-4
                  Figure 4.4 Current Train Volumes Compared to Current Train Capacity ........4-10
                  Figure 4.5 Class I Railroad Operating Expenditures 2006 ...................................4-11
                  Figure 5.1 Future Corridor Volumes by Primary Rail Freight Corridor
                             2035 Freight Trains and 2007 Passenger Trains per Day...........................5-2
                  Figure 5.2 Growth in Trains per Day from 2005 to 2035 by Primary
                             Rail Corridor ..............................................................................................5-3
                  Figure 5.3 Percentage Growth in Trains per Day from 2005 to 2035 by
                             Primary Rail Corridor...............................................................................5-4
                  Figure 5.4 Future Corridor Volumes Compared to Current Corridor Capacity
                             2035 without Improvements ........................................................................5-5
                  Figure 6.1 Future Train Volumes Compared to Future Train Capacity
                             2035 with Improvements .............................................................................6-3
                  Figure 7.1 Capital Investment and Income
                             Class I Railroads, 1981 to 2006, in Current Dollars ...................................7-5
                  Figure 8.1 Percentage of Rail-Freight Primary Corridor Route Miles by
                             Level of Service Grade in 2005, 2035 without Capacity
                             Improvements, and 2035 with Capacity Improvements......................8-1
                  Figure A.1 National Rail Network and Primary Rail Corridors ...........................A-3
                  Figure A.2 2005 and 2035 Train Volumes Compared to Current
                             Train Capacity.........................................................................................A-13
                  Figure A.3 Future Train Volumes Compared to Future Train Capacity
                             2035 with Improvements ..........................................................................A-15

Cambridge Systematics, Inc.                                                                                                               v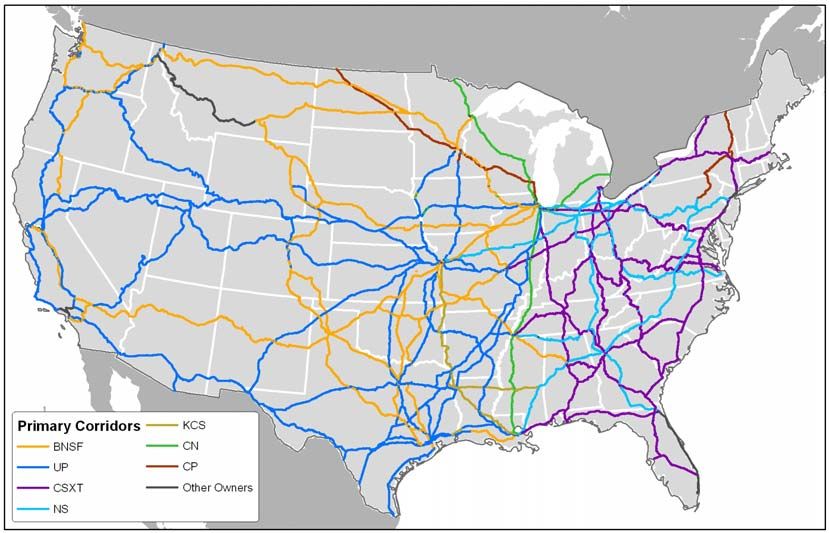
National Rail Freight Infrastructure Capacity and Investment Study

Acknowledgments
                  This study was prepared by Cambridge Systematics, Inc. under contract to the
                  Association of American Railroads. The major authors of the study were
                  Lance R. Grenzeback, David T. Hunt, and Daniel F. Beagan. The key contrib-
                  uting staff were John Lewis, Siddharth A. Pandit, Jessica E. Tump, Thomas C.
                  Messer, and Nathan R. Higgins.
                  The AAR’s steering committee provided invaluable information and advice to
                  the consultant team throughout the study. Their time and effort were very much
                  appreciated.
                  •    BNSF Railway
                       –      Peter J. Rickershauser
                       –      Nathan M. Asplund
                       –      Christopher Bigoness
                  •    CSX Transportation
                       –      Lester (Les) M. Passa
                       –      Lawrence Ratcliffe
                  •    Norfolk Southern
                       –      Daniel Mazur
                       –      Jackie Corletto
                  •    Union Pacific
                       –      John T. Gray
                       –      John H. Ransom
                       –      Eric Wilson
                       –      Simon J. Hjelm
                  •    Association of American Railroads
                       –      Craig F. Rockey, Project Manager
                       –      Frank Hardesty, Deputy Project Manager
                       –      Paul Posey
                       –      Dan Saphire
                  The assistance of the American Short Line and Regional Railroad Association,
                  CN, Canadian Pacific, and Kansas City Southern was also appreciated.

Cambridge Systematics, Inc.                                                                                           vii
National Rail Freight Infrastructure Capacity and Investment Study

Executive Summary
                  This study is an assessment of the long-term capacity expansion needs of the
                  continental U.S. freight railroads. It provides a first approximation of the rail
                  freight infrastructure improvements and investments needed to meet the U.S.
                  Department of Transportation’s (U.S. DOT) projected demand for rail freight
                  transportation in 2035. The U.S. DOT estimates that the demand for rail freight
                  transportation—measured in tonnage—will increase 88 percent by 2035.
                  The study was commissioned by the Association of American Railroads (AAR) at
                  the request of the National Surface Transportation Policy and Revenue Study
                  Commission. The Commission is charged by Congress to develop a plan of
                  improvements to the nation’s surface transportation systems that will meet the
                  needs of the United States for the 21st century.
                  The study focuses on 52,340 miles of primary rail freight corridors, which carry
                  the preponderance of rail freight traffic. 1 These corridors, which constitute about
                  one-third of all continental U.S. rail freight miles, are expected to absorb the bulk
                  of the forecast traffic and nearly all of the investment to expand capacity.
                  The study estimates the need for new tracks, signals, bridges, tunnels, terminals,
                  and service facilities in the primary corridors. The study does not estimate the
                  cost of acquiring additional land, locomotives, and freight cars, or the cost of
                  replacing and updating existing track, facilities, locomotives, and freight cars.
                  The study assumes no shift in modal tonnage shares among rail, truck, and water
                  beyond those projected by the U.S. DOT.
                  The study does not forecast passenger rail demand or estimate future passenger
                  rail capacity needs; however, capacity is provided for the long-distance Amtrak
                  and local commuter passenger rail services that are currently operated over rail
                  freight lines. Additional investment, beyond that projected in this report, will be
                  needed if the freight railroads host increased levels of passenger rail service. The
                  Commission has convened a passenger rail committee that is studying the need
                  for improvements and investments to support passenger rail demand through
                  2035. The findings of that committee will be reported separately.
                  This study estimates that an investment of $148 billion (in 2007 dollars) for infra-
                  structure expansion over the next 28 years is required to keep pace with eco-
                  nomic growth and meet the U.S. DOT’s forecast demand. Of this amount, the
                  Class I freight railroads’ share is projected to be $135 billion and the short line

                  1   Nearly all of these primary corridor miles are owned and operated by the seven Class I freight
                      railroads: BNSF Railway, Canadian National (Grand Trunk Corporation), Canadian Pacific (Soo
                      Line), CSX Transportation, Kansas City Southern, Norfolk Southern, and Union Pacific. There
                      are more than 550 short line and regional freight railroads.

Cambridge Systematics, Inc.                                                                                         ES-1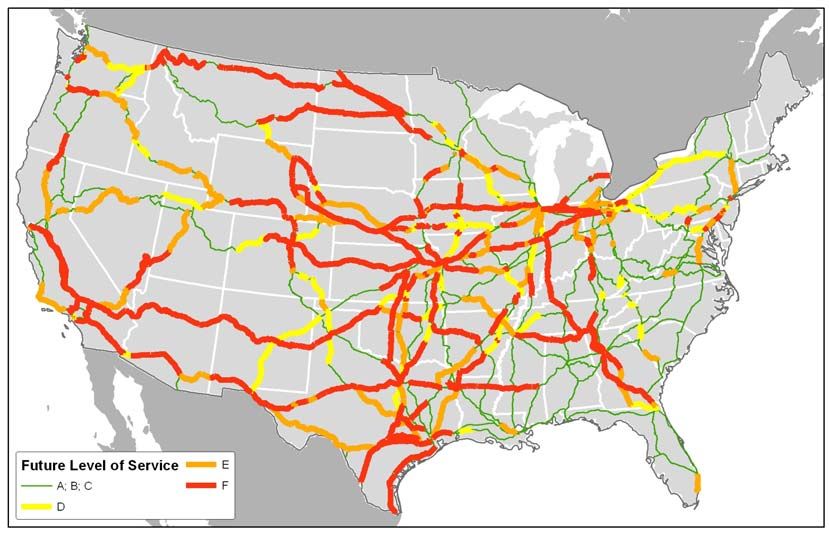
National Rail Freight Infrastructure Capacity and Investment Study

                   and regional freight railroads’ share is projected to be $13 billion. Without this
                   investment, 30 percent of the rail miles in the primary corridors will be operating
                   above capacity by 2035, causing severe congestion that will affect every region of
                   the country and potentially shift freight to an already heavily congested highway
                   system.
                   The investment requirement is driven by three factors: demand, current system
                   capacity, and infrastructure expansion costs. The U.S. DOT estimates that
                   population growth, economic development, and trade will almost double the
                   demand for rail freight transportation by 2035. The projected rate of growth over
                   the next 30 years is not extraordinary, but it comes after two decades of growth
                   in rail freight tonnage that has absorbed much of the excess capacity in the
                   existing rail freight system. Most of the moderate-cost capacity expansions have
                   already been made; future capacity expansions will be purchased at a higher cost
                   because they will require expensive new bridges and tunnels and more track and
                   larger terminals in developed areas.
                   Meeting the U.S. DOT’s forecast demand will require the Class I freight railroads
                   to increase their investment in infrastructure expansion. The Class I railroads
                   anticipate that they will be able to generate approximately $96 billion of their
                   $135 billion share through increased earnings from revenue growth, higher vol-
                   umes, and productivity improvements, while continuing to renew existing infra-
                   structure and equipment. This would leave a balance for the Class I freight
                   railroads of $39 billion or about $1.4 billion per year to be funded from railroad
                   investment tax incentives, public-private partnerships, or other sources.
                   These investment projections assume that the market will support rail freight
                   prices sufficient to sustain long-term capital investments. If regulatory changes
                   or unfunded legislative mandates reduce railroad earnings and productivity,
                   investment and capacity expansion will be slower and the freight railroads will
                   be less able to meet the U.S. DOT’s forecast demand.
                   The findings of this study provide a starting point for assessing future rail freight
                   capacity and investment requirements. The findings outline the improvements
                   and investments required for the railroads to carry the freight tonnage forecast
                   by the U.S. DOT. Additional work is needed to determine how much more
                   capacity and investment would be needed for the railroads to increase their share
                   of freight tonnage and reduce the rate of growth in truck traffic on highways.
                   Finally, the forecasts and improvement estimates in this study do not fully
                   anticipate future changes in markets, technology, regulation, and the business
                   plans of shippers and carriers. Each could significantly reshape freight trans-
                   portation demand, freight flow patterns, and railroad productivity, and, thus,
                   rail freight infrastructure investment needs.
                   In summary, the findings point clearly to the need for more investment in rail
                   freight infrastructure and a national strategy that supports rail capacity expan-
                   sion and investment.

ES-2                                                                             Cambridge Systematics, Inc.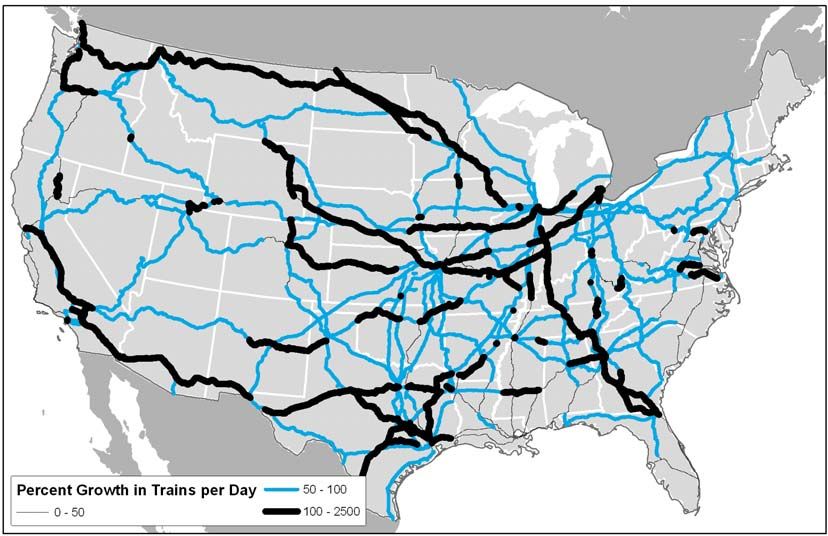
National Rail Freight Infrastructure Capacity and Investment Study

    1.0 Objective
                  The objective of this study is to identify rail freight infrastructure improvements
                  and investments in the continental U.S. rail network that will allow the freight
                  railroads to meet the U.S. Department of Transportation’s (U.S. DOT) projected
                  demand for rail freight transportation in 2035. The U.S. DOT estimates that the
                  demand for rail freight transportation—measured in tonnage—will increase
                  88 percent by 2035. This projected rate of growth over the next 30 years is not
                  extraordinary, but it comes after two decades of growth in rail freight tonnage
                  that has absorbed much of the excess capacity in the existing rail freight system.
                  The study assumes no shift in modal tonnage shares among rail, truck, and water
                  beyond those projected by the U.S. DOT.
                  The study looks at infrastructure improvements that expand the capacity of rail
                  lines, bridges, tunnels, terminals, and service facilities along the 52,340 miles of
                  primary rail corridors within the U.S. owned and operated primarily by the seven
                  Class I railroads—BNSF Railway, Canadian National (Grand Trunk Corporation),
                  Canadian Pacific (Soo Line), CSX Transportation, Kansas City Southern, Norfolk
                  Southern, and Union Pacific. These primary corridors constitute about one-third
                  of all U.S. rail miles and carry the preponderance of rail freight traffic.
                  The investment estimates include capital costs for expansion only; that is, the
                  cost of the new rail lines and support facilities needed to accommodate future
                  demand. The estimates do not include costs to maintain and operate the new rail
                  lines and support facilities; acquire additional locomotives and railcars to pro-
                  vide services; or operate, maintain, and replace existing rail lines and facilities.
                  Finally, the study does not include the costs to rail shippers to accommodate
                  growth in rail traffic volumes at their facilities. The study does include a general
                  estimate of the investment required to bring the weight-bearing capacity of
                  Class I branch lines and short line and regional railroad lines up to current
                  standards.
                  The findings of this study provide a starting point for assessing future rail freight
                  capacity and investment requirements. The findings outline the improvements
                  and investments required for the railroads to carry the freight tonnage forecast
                  by the U.S. DOT. Additional work is needed to determine how much more
                  capacity and investment would be needed for the railroads to increase their share
                  of freight tonnage and reduce the rate of growth in truck traffic on highways.
                  Finally, the forecasts and improvement estimates in this study do not fully
                  anticipate future changes in markets, technology, regulation, and the business
                  plans of shippers and carriers. Each could significantly reshape freight trans-
                  portation demand, freight flow patterns, and railroad productivity, and, thus,
                  rail freight infrastructure investment needs.

Cambridge Systematics, Inc.                                                                                    1-1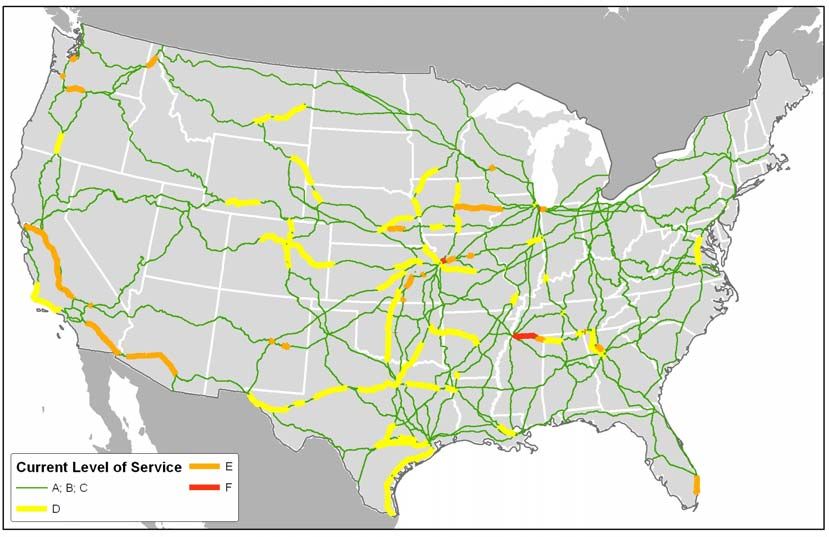
National Rail Freight Infrastructure Capacity and Investment Study

    2.0 Background
                  The study was done at the request of the National Surface Transportation Policy
                  and Revenue Study Commission. The Commission was established by Congress
                  in 2005 to provide a national vision and recommendations that will “preserve
                  and enhance the surface transportation system to meet the needs of the United
                  States for the 21st century.” 2 The Commission is charged with completing a com-
                  prehensive study of the national surface transportation system and the Highway
                  Trust Fund, then developing a conceptual plan with alternative approaches to
                  ensure that the system continues to serve the needs of the United States.
                  Since May 2006, the Commission has met regularly to hear about the challenges
                  facing America’s surface transportation network. The Commissioners have
                  heard testimony from national transportation advocates, policymakers, industry,
                  labor, and the general public. Congress is actively following the activities of the
                  Commission, and the Commission’s report (anticipated in December 2007) is
                  expected to provide information that will be helpful to Congress as it considers
                  reauthorization of the Federal surface transportation programs in 2009.
                  Over the course of its hearings, the Commission has expressed concern about the
                  capacity and future of the nation’s freight transportation systems. Freight trans-
                  portation is vitally important to domestic economic productivity, the interna-
                  tional competitiveness of American businesses, and the economic well-being of
                  all Americans.
                  The demand for transportation is pressing the capacity of the nation’s transpor-
                  tation systems, especially its critical highway and rail freight transportation
                  infrastructure. On the highway system, vehicle-miles of travel grew by 96 per-
                  cent between 1980 and 2005, while lane miles of road increased by only 5.7 per-
                  cent. Figure 2.1, based on Federal Highway Administration (FHWA) statistics,
                  illustrates the widening gap between vehicle-miles of travel and roadway
                  capacity.

                  2   See Section 1909 of the Safe, Accountable, Flexible, Efficient Transportation Equity Act—
                      A Legacy for Users (SAFETEA-LU).

Cambridge Systematics, Inc.                                                                                        2-1
National Rail Freight Infrastructure Capacity and Investment Study
Figure 2.1 Vehicle Miles of Travel and Lane Miles
1980 to 2005
210 Index 1980=100
200 Vehicle Miles of Travel (VMT)
190
180
170
160
150
140
130
120
110 Lane Miles
100
90
1980 1985 1990 1995 2000 2005
Source: Federal Highway Administration, Highway Statistics.
The result has been increasing highway congestion. The Texas Transportation
Institute reports that over the decade between 1993 and 2003, the cost of highway
congestion in the nation’s urban areas increased from $39.4 billion to
$63.1 billion, an increase of 60.2 percent. 3 The U.S. DOT estimates that the cost of
congestion across all modes of transportation could be three times as high—
approaching $200 billion per year—if productivity losses, costs associated with
cargo delays, and other economic impacts are included. These include losses
accruing to auto drivers, freight carriers, businesses, consumers, and the general
public. 4
As the cost of highway congestion has increased, public policy-makers at all lev-
els of government have started looking to the railroads to carry more freight to
relieve truck and highway congestion, and to help conserve energy, reduce
engine emissions, and improve safety. Shippers, too, have started looking to rail-
roads to carry more longer-distance shipments, especially as the costs of truck
fuel and labor have increased.
3 David Schrank and Tim Lomax, The 2005 Urban Mobility Report, Texas Transportation
Institute, May 2005, available at http://mobility.tamu.edu.
4 U.S. Department of Transportation, National Strategy to Reduce Congestion on America’s
Transportation Network, Washington, D.C., March 2007.
See http://www.fightgridlocknow.gov/docs/conginitoverview070301.htm.
2-2 Cambridge Systematics, Inc.National Rail Freight Infrastructure Capacity and Investment Study
However, the growing demand for freight transportation is also pressing the
capacity of the nation’s rail freight system. Ton-miles of rail freight (one ton of
freight moved one mile counts as one ton-mile) carried over the national rail
system have doubled since 1980, and the density of train traffic—measured in
ton-miles per mile of track—has tripled since 1980. Figure 2.2 illustrates the wid-
ening gap between ton-miles of rail travel and track miles. 5
Figure 2.2 Rail Freight Ton-Miles and Track Miles
Class I Railroads, 1980 to 2006
1980 = 100
350 Ton-Miles per Mile of Track
300
250
Ton-Miles
200
150
100
Track Miles
50
0
80 82 84 86 88 90 92 94 96 98 00 02 04 06
Year
Source: AAR and Annual Report Form R-1.
The tightening of system capacity across all modes of freight transportation has
likely contributed to the first notable increase in total logistics cost in over
25 years. Total logistics cost is the cost of managing, moving, and storing goods.
Figure 2.3 shows the total logistics cost as a percentage of the U.S. gross domestic
product (GDP).
5 Association of American Railroads data and Annual Report Form R-1.
Cambridge Systematics, Inc. 2-3National Rail Freight Infrastructure Capacity and Investment Study
Figure 2.3 Total Logistics Cost
Percentage of Gross Domestic Product
18 Percentage of U.S. Gross Domestic Product
16 Administration
14 Transportation
Inventory
12
10
8
6
4
2
0
1977 1979 1981 1983 1985 1987 1989 1991 1993 1995 1997 1999 2001 2003 2005
Year
Source: State of Logistics Report, Council of Supply Chain Management Professionals, 2006.
Logistics costs rose through the 1970s to a high of about 16 percent of GDP in
1980, reflecting rising fuel prices, increasing interest rates, and deteriorating pro-
ductivity across the freight transportation system. Renewed investment in
highways, economic deregulation of the freight transportation industry in the
early 1980s, adoption of new technologies, and lower interest rates drove down
the costs of truck, rail, air, and water freight transportation. The total logistics
cost declined through the 1980s and 1990s to a low of about 8.6 percent of GDP in
2003. Businesses and consumers benefited because lower transportation costs
resulted in lower-cost goods and better access to global markets.
But the total logistics cost is rising again. In 2006, the total logistics cost was
9.9 percent of GDP. 6 The change reflects recent increases in fuel prices and
increases in congestion on the nation’s highways and rail lines and at its interna-
tional trade gateways and ports. Freight shippers and carriers are worried that
the productivity of the nation’s freight systems may continue to drop and that
logistics costs may rise further, undermining future domestic economic produc-
tivity, international competitiveness, and economic growth.
6 Rosalyn A. Wilson, State of Logistics Report, Council of Supply Chain Management
Professionals, 2006 and 2007.
2-4 Cambridge Systematics, Inc.National Rail Freight Infrastructure Capacity and Investment Study
Freight shippers and carriers are especially concerned about the future capacity
and productivity of the freight system because the demand for freight transpor-
tation is projected to nearly double by 2035. The U.S. DOT Freight Analysis
Framework (FAF Version 2.2) estimates that the demand for freight transporta-
tion will grow from 19.3 billion tons today to 37.2 billion tons in 2035, an increase
of about 93 percent. 7
To absorb this growth and maintain their existing shares of the freight transpor-
tation market, the nation’s truck and rail freight systems must increase their
capacity and productivity substantially. Trucks and the highway system must
add capacity to handle 98 percent more tonnage. And railroads must add capac-
ity to handle 88 percent more tonnage. The U.S. DOT estimates assume no shift
in modal tonnage shares among rail and truck beyond those created by structural
changes in the economy (i.e., different growth rates across freight-generating
industries).
The anticipated rates of growth for the U.S. economy and freight transportation
demand are about the same as those experienced over the last 30 years; however,
much of the capacity existing or created over those years has been filled, leaving
the nation with a need to provide new capacity through expanded infrastructure
and improved productivity. 8
Figure 2.4 shows the relative shares of freight—measured in ton-miles—carried
by truck and rail in 2005. 9 If railroads cannot carry their share in 2035, then
freight will be shed to trucks and an already heavily congested highway system.
Conversely, if trucks cannot carry their share in 2035, then freight must be shifted
to rail and the capacity of the rail system expanded even more than currently
forecast.
7 See U.S. Department of Transportation, Freight Analysis Framework, Freight Facts and
Figures at http://www.ops.fhwa.dot.gov/freight/. This study uses the current Freight
Analysis Framework (FAF Version 2.2) forecasts.
8 Global Insight, Inc. forecasts that the U.S. economy will grow at a compound annual
rate of about 2.8 percent over the next 30 years. Source: Global Insight, Inc. in Freight
Demand and Logistics Bottom Line Report prepared by Cambridge Systematics, Inc. for the
American Association of State Highway and Transportation Officials (AASHTO),
(forthcoming, 2007).
9 Ton-miles estimated by Global Insight for the AASHTO Freight Demand and Logistics
Bottom Line Report.
Cambridge Systematics, Inc. 2-5National Rail Freight Infrastructure Capacity and Investment Study
Figure 2.4 Truck and Rail Market Shares in Ton-Miles
2005 and 2035
2035
Additional Rail
Ton-Miles
2005
Current Rail
Ton-Miles
2005
Current Truck
Ton-Miles
2035
Additional Truck
Ton-Miles
Source: Cambridge Systematics, Inc., based on Global Insight, Inc. freight demand forecasts.
In response to these projections and concerns, the Commission asked the
Association of American Railroads (AAR) to assess the capacity of the nation’s
rail system to accommodate the estimated increase in freight-rail traffic. The
AAR, supported by the four largest Class I railroads—the BNSF Railway, CSX
Transportation, the Norfolk Southern Corporation, and the Union Pacific
Railroad—undertook this study to estimate the additional rail freight capacity
and investment required to meet the U.S. DOT forecast.
This study is a hallmark study, the first effort of its kind. The U.S. DOT and the
Federal Highway Administration (FHWA) have developed national infrastruc-
ture needs and cost estimates for the publicly owned highway systems, but no
comparable, long-term, national estimates have been developed for the rail sys-
tem. The railroads are publicly traded or privately owned companies, and the
planning horizons for railroad capital projects typically do not extend out 30
years. And neither the U.S. DOT nor individual state DOTs have comprehensive
rail infrastructure databases suitable for long-term planning. This study is the
first collective assessment by the major freight railroads of their long-term
capacity expansion and investment needs.
2-6 Cambridge Systematics, Inc.National Rail Freight Infrastructure Capacity and Investment Study
3.0 Methodology
This study provides a first approximation of the rail freight infrastructure
improvements and investments in the continental U.S. rail network that will
allow the freight railroads to meet the U.S. DOT’s projected demand for rail
freight transportation in 2035. It addresses two major rail freight infrastructure
elements:
• Line expansion:
– Upgrades to the Class I railroad system mainline tracks and signal control
systems;
– Improvements to significant rail bridges and tunnels; 10
– Upgrades to Class I railroad secondary mainlines and branch lines to
accommodate 286,000-pound freight cars; and
– Upgrades to short line and regional railroad tracks and bridges to accom-
modate 286,000-pound freight cars. 11
• Facility expansion:
– Expansion of carload terminals, intermodal yards, and international gate-
way facilities owned by railroads; and
– Expansion of Class I railroad service and support facilities such as fueling
stations and maintenance facilities.
10 Included in this category are expansions of major bridges and tunnels (or construction
of new parallel bridges and tunnels) to add rail capacity along a corridor, and corridor
overhead clearance projects, which typically involve raising dozens of highway bridges
crossing a rail line to permit the movement of double-stacked intermodal container
trains.
11 Most Class I railroad tracks and bridges have been designed or reconstructed to carry
railcars weighing 286,000 pounds, and some Class I lines accommodate railcars
weighing up to 315,000 pounds. Older rail lines, including some Class I railroad
secondary mainlines and branch lines and about half of the short line and regional
railroad tracks and bridges, were designed and constructed to carry railcars weighing
up to 263,000 pounds. The heavier, “standard,” 286,000-pound cars can be operated
over many lines designed for lighter cars, but usually at very low speeds.
Cambridge Systematics, Inc. 3-1National Rail Freight Infrastructure Capacity and Investment Study
The study includes the cost of designing and constructing these improvements,
but does not include the cost of acquiring real estate to accommodate new rail
lines and terminals. 12 This is consistent with the approach used in national high-
way system needs and investment studies, which do not estimate the cost of
acquiring real estate for widening or adding highways. The study does not
include the cost of capital depreciation or the cost of buying additional locomo-
tives and rail cars to expand service. Railroad maintenance and operating costs
are not included, for either existing or expanded lines and facilities.
The study assumes that capacity is provided for long-distance Amtrak and local
commuter passenger rail services that are currently operated over rail freight
lines, but the study does not forecast the need for new passenger rail services or
the necessary capacity to support passenger rail growth. The Commission has
convened a passenger rail committee that is studying the need for improvements
and investments to support passenger-rail demand through 2035. The findings
of that committee will be reported separately.
This study estimates rail line capacity and investment requirements by:
• Dividing the continental U.S. Class I railroad network into primary corridors;
• Establishing current corridor volume in freight and passenger trains per day
for each primary corridor, based on 2005 Surface Transportation Board
Carload Waybill data, the most recent comprehensive information available;
• Estimating current corridor capacity in trains per day for each primary corri-
dor, based on current information;
• Comparing current corridor volume to current corridor capacity;
• Estimating future corridor volume in trains per day, using U.S. DOT’s
Freight Analysis Framework Version 2.2 forecasts of rail freight demand in
2035 by type of commodity and by the origin and destination locations of
shipments moving within the U.S. and through international land and port
gateways;
• Comparing the future corridor volume to current corridor capacity;
12 Current capital expenditures by the Class I railroads for expansion of lines and
terminals (as reported in Section 4.5) include the cost of acquiring real estate. However,
with the exception of land acquired for new or expanded intermodal terminals, the cost
of real estate acquisition has been a small part of current capital expenditures because
most new rail lines have been constructed within existing railroad-owned rights-of-
way. As the space in existing rights-of-way is used up, the cost of acquiring real estate
for new lines is expected to be a larger percentage of capital expenditures for expan-
sion. The real estate costs will be in addition to the infrastructure costs estimated in this
study.
3-2 Cambridge Systematics, Inc.National Rail Freight Infrastructure Capacity and Investment Study
• Determining the additional capacity needed to accommodate future train vol-
umes at an acceptable level of service reliability;
• Identifying the rail line and signal control system improvements required to
provide the additional capacity; and
• Estimating the costs of the improvements.
The study estimates the need for expansion of Class I railroad carload terminals,
intermodal yards, and railroad-owned international gateway facilities by ana-
lyzing the projected increases in the number of railcars and intermodal units
(containers and truck trailers) handled at major facilities and comparing them to
current handling capacity. Expansion costs are estimated using unit costs per
railcar or intermodal container, or estimated using recent and comparable termi-
nal expansion project costs. Estimates of the cost of expanding service and sup-
port facilities such as fueling stations were provided by the railroads based on
the anticipated changes in the number and type of trains.
Finally, the study estimates the capacity and investment requirements for secon-
dary mainlines, branch lines, and short line and regional railroads by updating
information from a prior study of short line system investment needs commis-
sioned by the American Short Line and Regional Railroad Association. 13
Wherever possible, the analysis is based upon existing and publicly available
data sources. The key sources of data are the following:
• Oak Ridge National Laboratory (ORNL) Center for Transportation Analysis’
Rail Network (Version 5-5) is used to develop a primary corridor network
model and identify the key corridor characteristics such as the number of
tracks and type of signal system;
• The U.S. DOT Surface Transportation Board’s (STB) 2005 Carload Waybill
Sample is used to estimate current corridor volumes based on 2005 loaded-
car movements;
• Data from the Surface Transportation Board’s Uniform Rail Costing System
(URCS) on empty-return ratios by railroad, car type, and car ownership are
used to estimate empty car movements;
• The U.S. DOT’s Freight Analysis Framework (FAF Version 2.2) forecast is
used to establish rail freight traffic growth by type of train service (e.g.,
intermodal train, manifest/carload train, auto train, and bulk train) from
2005 to 2035;
13 Zeta-Tech Associates, Inc., An Estimation of the Investment in Track and Structures Needed
to Handle 286,000-Pound Rail Cars, prepared for the American Short Line and Regional
Railroad Association, May 26, 2000.
Cambridge Systematics, Inc. 3-3National Rail Freight Infrastructure Capacity and Investment Study
• Data from the railroads and the AAR are used to estimate the capacity in
trains per day for archetypical rail corridors representing different combina-
tions of number of tracks and signal types. The capacities of the archetypical
rail corridors are used to identify the improvements needed to accommodate
future train volumes.
• Data from the Class I railroads, the AAR, and published construction indus-
try information are used to estimate the cost of adding tracks, upgrading sig-
nal systems, expanding terminals, and adding rail-support facilities.
Appendix A describes the technical methodology in more detail.
3-4 Cambridge Systematics, Inc.National Rail Freight Infrastructure Capacity and Investment Study
4.0 Current Train Volumes and
Capacity
4.1 PRIMARY CORRIDORS
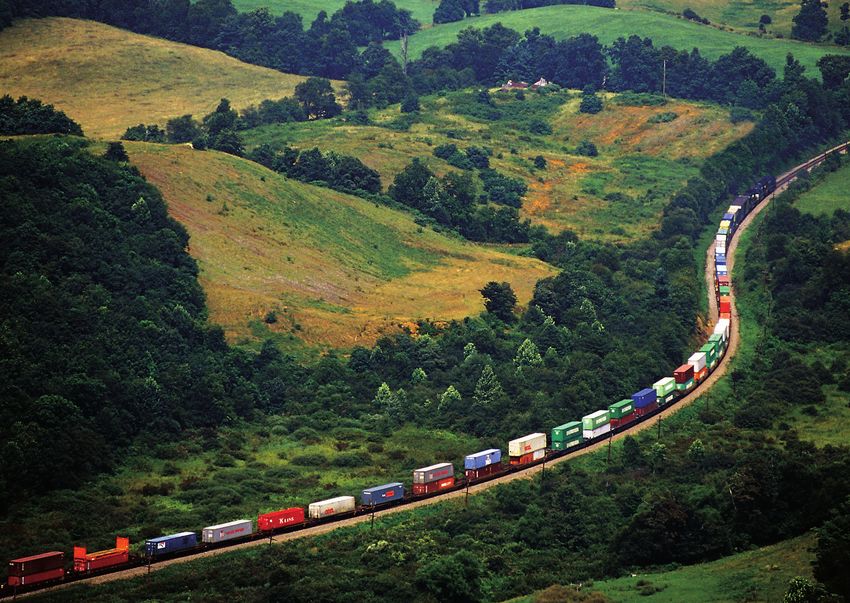
The study focuses on the primary rail corridors within the national rail freight
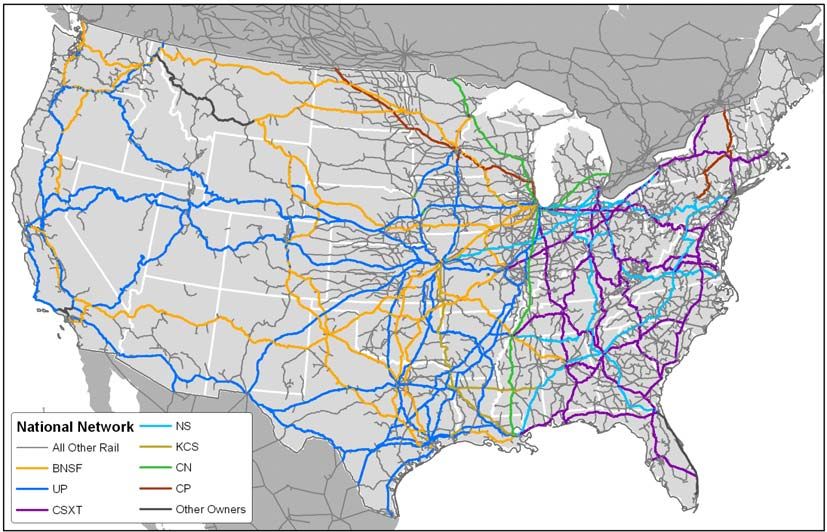
system. Figure 4.1 shows the national rail network. The primary corridors for
each of the seven Class I railroads are shown in color; all other rail lines are
shown in gray.
Figure 4.1 National Rail Freight Network and Primary Rail Freight Corridors
Source: Cambridge Systematics, Inc.
Figure 4.2 shows just the primary corridors used for this study of rail freight
capacity. The primary corridors were designated by the Class I railroads for this
study. The primary corridors represent the higher-volume corridors for rail
freight. The primary corridors total about 52,340 miles of road (or centerline
miles), representing about half of all Class I-operated miles in the U.S. and about
one-third of the 140,810 miles in the U.S. rail freight network. For comparison,
the Interstate Highway System comprises about 47,000 route miles, and the
National Highway System, which adds other major U.S. and state freight high-
ways, comprises about 162,000 route miles.
Cambridge Systematics, Inc. 4-1National Rail Freight Infrastructure Capacity and Investment Study
Figure 4.2 Primary Rail Freight Corridors
Source: Cambridge Systematics, Inc.
4.2 CURRENT VOLUMES
Current corridor volumes in trains per day were established for each primary
corridor using data from the Surface Transportation Board’s 2005 Carload
Waybill Sample. The Waybill Sample is an annual survey of railcar movements
on the national rail network. The survey collects information from a sample of
loaded, revenue-producing railcar movements. The data include information
about the commodity shipped, the type of railcar used, the origin and destination
station of the shipment, any interchanges between railroads, and the names of
railroads handling the shipment. The sample data are statistically expanded to
represent 100 percent of the loaded revenue railcar moves in a year. The Waybill
Sample is used in many regulatory proceedings and is generally considered an
accurate reflection of U.S. railroad shipments. The 2005 Waybill Sample is the
most recent comprehensive data available.
The Waybill Sample does not collect information about empty, non-revenue-
producing railcar movements. These were estimated using information from the
Uniform Rail Costing System (URCS) on empty-return ratios by railroad, car
type, and car ownership. The number of empty, non-revenue-producing railcar
movements were added to the number of loaded, revenue-producing railcar
movements to estimate total railcar movements.
4-2 Cambridge Systematics, Inc.National Rail Freight Infrastructure Capacity and Investment Study
The number of carloads moving on the rail system varies daily, weekly, and sea-
sonally. To select a representative day, the distribution of the number of carload
movements for each day in 2005 was examined and the volume for the 85th per-
centile day was selected for analysis. This approach is consistent with the analy-
sis procedures for highway needs studies.
The carload volumes were then allocated among four types of train service based
on the commodity being carried and the type of operation:
1. Auto Train Service – For assembled automobiles, vans, and trucks moving in
multilevel cars;
2. Bulk Train Service – For grain, coal, and similar bulk commodities moving
in unit trains;
3. Intermodal Train Service – For commodities moving in containers or truck
trailers on flat cars or specialized intermodal cars; and
4. General-Merchandise Train Service – Everything else, including commodi-
ties moved in box cars and tank cars.
The number of trains of each type needed to move the cars were estimated using
information on the typical number of cars hauled by train service type, as sum-
marized in Table 4.1. The number of intermodal trains needed is based on the
number of intermodal units (e.g., container-on-flat-car [COFC] units and trailer-
on-flat-car [TOFC] units). Separate calculations were made for Eastern and
Western Class I railroads because differences in regional geography and topog-
raphy allow Western railroads to operate longer trains. 14
Table 4.1 Typical Number of Cars or Intermodal Units by Train Service Type
Type of Train Service Eastern Railroads Western Railroads
Auto 57.0 63.9
Bulk 86.0 112.4
General Merchandise 82.0 80.7
Intermodal (TOFC/COFC count) 110.7 164.3
Source: Class I railroad data.
14 For details, see Appendix A.
Cambridge Systematics, Inc. 4-3National Rail Freight Infrastructure Capacity and Investment Study
Finally, the number of long-distance Amtrak and local commuter passenger rail
trains operating over the primary rail freight corridors was added to the number
of freight trains to calculate the total number of trains per day per corridor. The
number of passenger trains was estimated from published information on
Amtrak and commuter passenger rail schedules for 2007.
Figure 4.3 maps the current corridor volumes in trains per day for the primary
rail freight corridors. The number of trains per day is indicated by the width of
the corridor line. The thinnest line indicates that a corridor carries up to 15 trains
per day; the widest line indicates that a corridor carries between 100 and 200
trains per day.
Figure 4.3 Current Corridor Volumes by Primary Rail Freight Corridor
2005 Freight Trains and 2007 Passenger Trains per Day
Source: Cambridge Systematics, Inc.
Note: Volumes are for the 85th percentile day.
4-4 Cambridge Systematics, Inc.National Rail Freight Infrastructure Capacity and Investment Study
4.3 CURRENT CAPACITY
To determine whether a corridor is congested, current volume was compared to
current capacity. Three variables were used to estimate the current capacity of
the primary corridors: the number of tracks, the type of control system, and the
mix of train types. 15
• Tracks – Most sections of the national rail freight system are single-tracked
with multiple sidings for trains to meet and pass each other, and a significant
portion of the heaviest-volume corridors are double-tracked. A limited
number of sections have three or four tracks.
• Control System – The type of control system affects capacity by maintaining
a safe spacing between trains meeting and passing on the same track. There
are three major types of signal systems:
– Automatic Block Signaling (ABS) is a signal system that controls when a
train can advance into the next track block. A block is a section of track
with traffic control signals at each end. The length of the block is based
on the length of a typical train and the distance needed to stop the train in
a safe manner. When a train exits a block, the signal changes to yellow,
indicating to the engineer of a following train that the block is now
empty, but that the following train should be prepared to stop before
entering the next block (currently occupied by the train ahead). Auto-
matic block signaling is governed by block occupancy and cannot be
controlled by a railroad dispatcher from a remote location.
– Centralized Traffic Control (CTC) and Traffic Control System (TCS) are
systems that use electrical circuits in the tracks to monitor the location of
trains, allowing railroad dispatchers to control train movements from a
remote location, typically a central dispatching office. CTC and TCS
increase capacity by detecting track occupancy and allowing dispatchers
to safely decrease the spacing between trains because the signal systems
automatically prevent trains from entering sections of track already occu-
pied by other trains.
– No Signal (N/S) and Track Warrant Control (TWC) are basic train con-
trol systems that require the train crew to obtain permission or warrants
15 The capacity of rail corridors is determined by a large number of factors, including the
number of tracks, the frequency and length of sidings, the capacity of the yards and
terminals along a corridor to receive the traffic, the type of control systems, the terrain,
the mix of train types, the power of the locomotives, track speed, and individual
railroad operating practices. Complete, consistent, and current information on all these
factors was not available for the study, so the capacity of the primary corridors was
estimated using only the three dominant factors (e.g., number of tracks, type of signal
system, and mix of train types).
Cambridge Systematics, Inc. 4-5National Rail Freight Infrastructure Capacity and Investment Study
before entering a section of track. Crews receive track warrants by radio,
phone, or electronic transmission from dispatcher. TWC is used on low-
volume track instead of more expensive ABS or CTC/TCS systems.
• Train Types – The mix of train types determines the speed and spacing of
trains on a track. Different types of trains operate at different speeds and
have different braking capabilities. A corridor that serves a single type of
train will usually accommodate more trains per day than a corridor that
serves a mix of train types. Trains of the single type can be operated at simi-
lar speeds and with more uniform spacing between the trains because they
have similar braking capabilities. This increases the total number of trains
that can traverse the corridor per day. When trains of different types—each
with different length, speed, and braking characteristics—use a corridor,
greater spacing is required to ensure safe braking distances. As a result, the
average speed drops, reducing the total number of trains that can traverse the
corridor per day. For the study, trains were grouped into three train-type
groups based on their operating characteristics:
– Train-Type Group 1 – includes merchandise/carload trains and bulk coal
and grain trains. These trains tend to haul heavier, bulkier commodities
such as coal, grain, gravel, and phosphates, and operate at slower speeds.
– Train-Type Group 2 – includes intermodal trains and multilevel auto
carriers hauling assembled automobiles. These trains tend to operate at
higher speeds because they are lighter than merchandise and bulk trains
and are run to more exacting schedules.
– Train-Type Group 3 – includes passenger trains such as Amtrak’s long-
distance trains and local commuter rail trains. Passenger trains operate at
high speeds and on fixed schedules, similar to the speeds and schedules
of intermodal trains. They require close control to ensure safe operation
and stopping distances, especially when operating along corridors car-
rying merchandise trains or a mix of merchandise and intermodal trains.
By law, Amtrak passenger trains operating over rail freight lines must be
given priority; this means that when Amtrak trains meet or overtake
freight trains, the freight trains are shunted to sidings or parallel lines
until the passenger train has passed.
There are eight combinations of number of tracks and type of signal system that
are in common use across the primary corridors today. Table 4.2 lists the combi-
nations, along with five- and six-track corridor types, which are used in this
study to accommodate future demand. The first column lists the number of
tracks, and the second column lists the type of control system. For each combi-
nation of number of tracks and type of control system, the maximum number of
trains that can typically be accommodated is determined by the mix of train
types operating along the corridor. The third column in the table lists the maxi-
mum practical capacity in trains per day that can be accommodated if multiple
train types (e.g., merchandise, bulk, and passenger trains) use the corridor. The
4-6 Cambridge Systematics, Inc.National Rail Freight Infrastructure Capacity and Investment Study
rightmost column lists the maximum practical capacity in trains per day that can be
accommodated if a single train type (e.g., all intermodal trains) uses the corridor.
Table 4.2 Average Capacities of Typical Rail-Freight Corridors
Trains per Day
Trains per Day
Practical Maximum If Practical Maximum If
Multiple Train Types Single Train Type
Number of Tracks Type of Control Use Corridor* Uses Corridor**
1 N/S or TWC 16 20
1 ABS 18 25
2 N/S or TWC 28 35
1 CTC or TCS 30 48
2 ABS 53 80
2 CTC or TCS 75 100
3 CTC or TCS 133 163
4 CTC or TCS 173 230
5 CTC or TCS 248 340
6 CTC or TCS 360 415
Key: N/S-TWC – No Signal/Track Warrant Control.
ABS – Automatic Block Signaling.
CTC-TCS – Centralized Traffic Control/Traffic Control System.
Notes: * For example, a mix of merchandise, intermodal, and passenger trains.
** For example, all intermodal trains.
The table presents average capacities for typical rail freight corridors. The actual capacities of the
corridors were estimated using railroad-specific capacity tables. At the request of the railroads,
these detailed capacity tables were not included in this report to protect confidential railroad busi-
ness information.
Source: Class I railroad data aggregated by Cambridge Systematics, Inc.
Typically, a corridor serving multiple train types will have a lower capacity than
a corridor serving a single train type. For example, a railroad corridor with two
tracks, a centralized traffic control (CTC) system, and a mix of merchandise/bulk
trains, intermodal/auto trains, and passenger trains would typically operate at a
capacity of about 75 trains per day. The same corridor, serving all merchandise
trains, would typically operate at a capacity of about 100 trains per day.
For the study, each primary corridor in the national rail network was assigned a
capacity based its actual number of tracks, type of control system, and mix of
train types. The calculated capacity of each corridor was reviewed with the
railroads. The railroads made adjustments to update network information and
better represent their actual corridor train volumes and capacities.
Cambridge Systematics, Inc. 4-7National Rail Freight Infrastructure Capacity and Investment Study
4.4 CURRENT VOLUMES COMPARED TO CURRENT
CAPACITY
Current corridor volumes were compared to current corridor capacity to assess
congestion levels. This was done by calculating a volume-to-capacity ratio
expressed as a level of service (LOS) grade. The LOS grades are listed in Table 4.3.
Table 4.3 Volume-to-Capacity Ratios and Level of Service (LOS) Grades
LOS Grade Description Volume/Capacity Ratio
A Low to moderate train flows 0.0 to 0.2
with capacity to accommodate
B Below Capacity 0.2 to 0.4
maintenance and recover from
C incidents 0.4 to 0.7
Heavy train flow with moderate
capacity to accommodate 0.7 to 0.8
D Near Capacity
maintenance and recover from
incidents
Very heavy train flow with very
limited capacity to accommo-
E At Capacity 0.8 to 1.0
date maintenance and recover
from incidents
Above Capacity Unstable flows; service break- > 1.00
F
down conditions
Source: Cambridge Systematics, Inc.
Rail corridors operating at LOS A, B, or C are operating below capacity; they
carry train flows with sufficient unused capacity to accommodate maintenance
work and recover quickly from incidents such as weather delays, equipment
failures, and minor accidents. Corridors operating at LOS D are operating near
capacity; they carry heavy train flows with only moderate capacity to accommo-
date maintenance and recover from incidents. Corridors operating at LOS E are
operating at capacity; they carry very heavy train flows and have very limited
capacity to accommodate maintenance and recover from incidents without sub-
stantial service delays. Corridors operating at LOS F are operating above capac-
ity; train flows are unstable, and congestion and service delays are persistent and
substantial. The LOS grades and descriptions correspond generally to the LOS
grades used in highway system capacity and investment requirements studies.
4-8 Cambridge Systematics, Inc.National Rail Freight Infrastructure Capacity and Investment Study
A rail corridor that is operating at a volume-to-capacity ratio of 0.7 (the boundary
between LOS C and LOS D), is operating at 70 percent of its theoretical maxi-
mum capacity. This is considered to be the corridor’s practical capacity because
a portion of the theoretical maximum capacity is lost to maintenance, weather
delays, equipment failures, and other factors. A corridor operating at LOS C will
have stable train flows, ensuring that schedules can be met reliably and safely,
and permitting timely recovery from service disruptions. At LOS D, a corridor
will have stable operations under normal conditions, but service can quickly
become unstable with unplanned and unanticipated disruptions. At volume-to-
capacity ratios significantly greater than 0.8 (e.g., at LOS E or F), train flow rates
and schedule reliability deteriorate and it takes longer and longer to recover
from disruptions. To provide acceptable and competitive service to shippers and
receivers, railroads typically aim to operate rail corridors at LOS C/D or better.
Figure 4.4 maps the volume-to-capacity ratios, expressed as LOS grades, for each
primary rail corridor, based on current train volumes and current capacity. 16 For
legibility, rail corridors operating at LOS A, B and C (below practical capacity)
have been mapped in green. Corridors operating at LOS D (near practical
capacity) have been mapped in yellow, and corridors operating at LOS E (at
practical capacity) have been mapped in orange. Rail corridors operating at
LOS F (above capacity) have been mapped in red.
Analysis of the current levels of service, summarized in Table 4.4, shows that
88 percent of today’s primary corridor mileage is operating below practical
capacity (LOS A/B/C), 12 percent is near or at practical capacity (LOS D/E), and
less than 1 percent is operating above capacity (LOS F).
16 Current volumes are based primarily on shipment volumes reported in the 2005 STB
Carload Waybill Sample. These volumes do not reflect fully recent increases in coal
shipments moving from Western coal fields (e.g., Powder River Basin) to Eastern
utilities nor the recent increases in intermodal containers delivered by water to East
Coast ports and transferred to rail for inland delivery. Current capacity is based on
2007 information.
Cambridge Systematics, Inc. 4-9You can also read