The Long-Term Returns of Obesity Prevention Policies - By Alex Brill April 2013 By Alex Brill, April 2013
←
→
Page content transcription
If your browser does not render page correctly, please read the page content below

The Long-Term Returns
of Obesity Prevention Policies
By Alex Brill
April 2013
                By Alex Brill, April 2013
Executive Summary

This study illustrates the importance for policymakers of long-term budget impact analyses of
preventive health policies, specifically those aimed at obesity prevention. The study recommends that
the Congressional Budget Office (CBO), the agency responsible for estimating costs of proposed federal
legislation, develop the capacity to estimate the costs of these policies over a 75-year horizon.

Background

Obesity rates have doubled among adults in the last twenty years and tripled among children in a single
generation. Evidence suggests that by 2040 roughly half the adult population may be obese. Obesity
increases the risk of type 2 diabetes, high blood pressure, heart disease, certain types of cancer, stroke,
and many other diseases and conditions. These associated conditions carry high financial costs and can
be devastating to quality of life. Health care spending due to obesity is estimated to be as high as $210
billion annually, or 21 percent of total national health care spending. When also accounting for the non-
medical costs of obesity, the overall annual cost is estimated to be $450 billion.

The Institute of Medicine and other scientific bodies have identified evidence-based strategies for
addressing the childhood obesity epidemic. One impediment to pursuing obesity prevention policies at
the federal level lies in how their budgetary impacts are assessed. CBO generally uses a ten-year budget
window, but effective preventive health measures can have long-run budgetary impacts that differ
greatly from their ten-year projections. In fact, very little of the federal savings they induce may be
captured in the first decade, especially if an intervention is geared toward children or young adults and
yields meaningful impacts on health care costs for individuals receiving Medicare decades in the future.

In addition to distorting policymakers’ understanding of the net cost of preventive health policies, a
narrow budget window also fails to distinguish between effective and ineffective interventions. Because
a ten-year window misses most or all of the savings from an effective obesity prevention policy, a ten-
year cost estimate for such a policy would not differ from a ten-year estimate for an ineffective one.

The Study

This study constructs an illustrative model of the long-term budget impact of obesity prevention
policies, accounting for the Medicaid, Medicare, Social Security, and tax effects of preventing obesity.
The model demonstrates the complexities involved in reaching a long-term cost estimate. Using four
obesity prevention policies and programs as examples, the model generates lifetime (i.e., 75-year) per-
capita savings estimates for different types of people. In so doing, it makes it possible to compare the
discrepancy between 75-year and ten-year cost estimates of a policy to prevent obesity.

General Findings

The largest budgetary benefits from obesity prevention are the federal savings within the Medicare and
Medicaid programs that would result from avoiding obesity-related diseases and co-morbidity. Another

                                                     1
benefit to the federal budget of curbing obesity is increased tax revenues. Obese workers earn lower
wages on average than normal-weight workers, and higher wages resulting from obesity prevention
would yield more tax revenue. Healthier workers may also enjoy longer careers and greater productivity,
both of which increase tax revenues.

These cost decreases and tax revenue increases add up to significant federal budget savings over the
long term. On the other side of the ledger, the federal government would have higher entitlement
program costs because people who avoid obesity generally live longer.

Because the greatest amount of benefit, and thus federal savings, is achieved by preventing obesity in
childhood, the study concludes that the most appropriate budget window for preventive health
measures is 75 years. In addition, there is precedent for a 75-year window: a recent CBO study of an
increase in the cigarette tax included a 75-year cost estimate, and CBO, along with the Social Security
and Medicare trustees, routinely provides 75-year projections for those programs.

Illustrative Savings Analyses

The federal budget impact of preventing obesity differs depending on an individual’s income, age, and
gender, among other characteristics. This study examines four obesity prevention programs/policies to
illustrate the net costs for different types of individuals.

                                                                       1. Obesity screenings (represents
                                                                       average taxpayer, age 22 through
                                                                       end of life). Assuming that obesity
                                                                       screenings result in a child
                                                                       avoiding becoming obese
                                                                       throughout his or her life, the
                                                                       indirect lifetime federal savings
                                                                       estimate for an average married
                                                                       female taxpayer who is a
                                                                       secondary earner would be
                                                                       $44,100, and for an average male
                                                                       taxpayer, $113. If obesity
                                                                       screenings were responsible for
helping 1 million children and teens maintain normal weight throughout their lives as average income
earners, estimated federal savings (excluding the cost of the intervention) would range from $113
million (if all boys) to $44.1 billion (if all girls).

2. SCHIP childhood obesity demonstration project (represents average Medicaid enrollee, age 19
through end of life). Assuming the strategies devised through this demonstration result in a child
avoiding becoming obese throughout his or her life, the indirect lifetime federal savings estimate for an
average female Medicaid beneficiary would be $41,500, and for an average male Medicaid beneficiary,
$30,600. If the obesity demo were responsible for 1 million children who are future Medicaid

                                                    2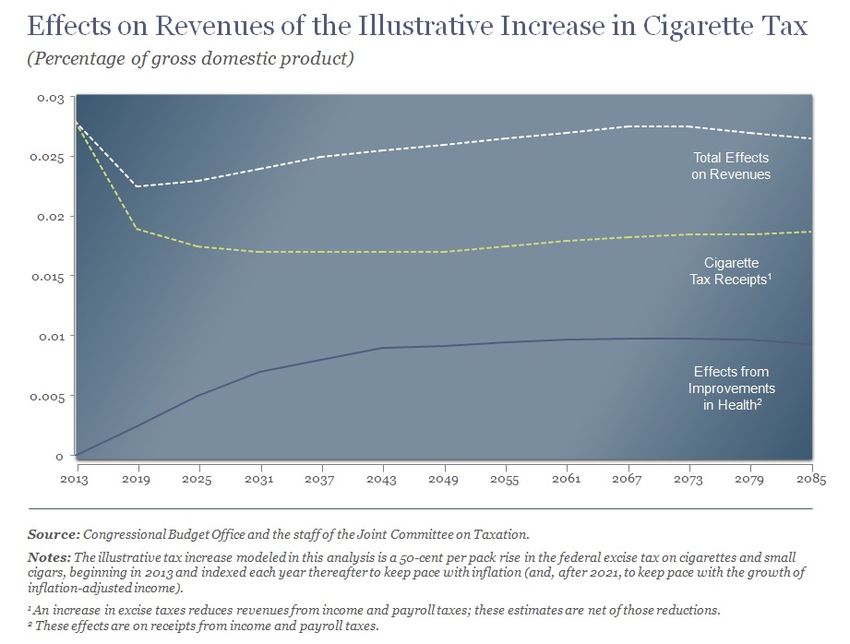
beneficiaries maintaining normal weight throughout their lives, federal savings (excluding the cost of the
intervention) would range from $30.6 billion (if all boys) to $41.5 billion (if all girls).

3. Diabetes Prevention Program (DPP) (represents average participant, age 51 through end of life). For
a 51-year-old female participant, the wage effect of obesity prevention is reduced relative to a younger
woman, making the indirect federal savings estimate $18,400. As there is no statistically significant wage
effect for men, the estimate for a comparable man is $113, the same as a younger man not on Medicaid.
If the DPP helped 1 million people in this age range maintain normal weight, estimated federal savings
over 75 years (excluding the cost of running the DPP) would be $113 million for 1 million male workers
and $18.4 billion for 1 million female workers.

4. Weight-loss drugs in Part D (represents average Medicare beneficiary, age 65 through end of life).
Covering weight-loss drugs under Medicare Part D would only affect Medicare beneficiaries, thus
excluding the wage effect for women. The savings estimate for a female Medicare beneficiary is thus
$11,400. For a male Medicare beneficiary, the savings estimate is again $113. If weight-loss drugs
helped 1 million older adults achieve normal weight, estimated federal savings (excluding drug costs)
would range from $113 million for 1 million men to $11.4 billion for 1 million women.

Next Steps

Given the clear evidence that obesity contributes significantly to increased federal health care costs and
adversely impacts workers’ incomes, policymakers need more thorough budgetary analyses that can
capture the long-term impact of effective obesity prevention policies. Particularly with the budget
constraints lawmakers currently face, it is critical to identify the most effective preventive measures,
and that goal can only be achieved with a longer budget window.

Properly modeled, effective obesity prevention measures will demonstrate their cost-containment
effects outside the ten-year budget window. The next step beyond the illustrative case studies
presented here would be for CBO to develop full-scale 75-year cost estimates that reflect the variation
in health status and income levels.

                                                    3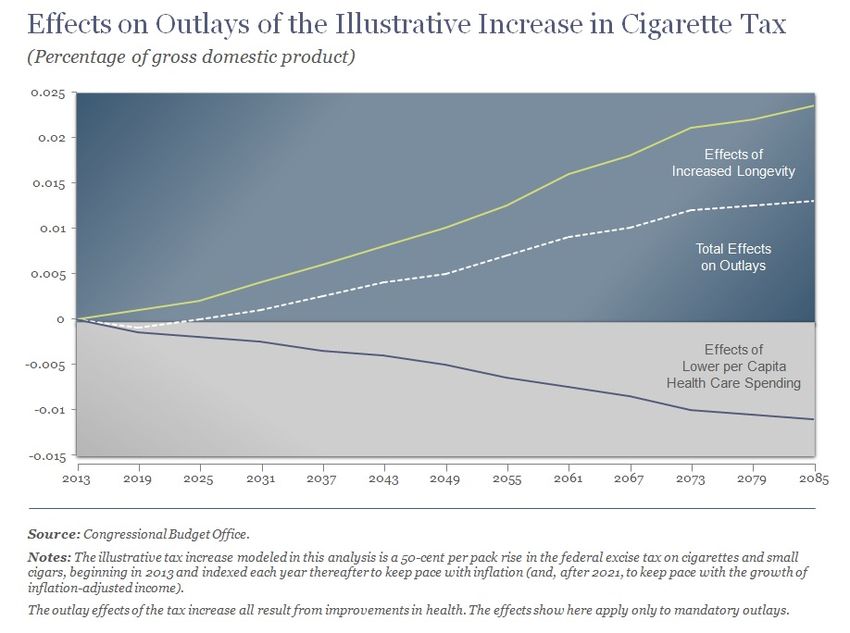
Introduction

Costs associated with obesity threaten the viability of the U.S. health care system and must be
addressed for the sake of the societal and fiscal well-being of the nation. One impediment to pursuing
obesity prevention policies lies in how their budgetary impacts are assessed. With the exception of
Social Security reform proposals, the Congressional Budget Office (CBO) generally provides cost
estimates of proposed federal legislation for only the first ten years. Preventive health policies, such as
those targeting obesity, are often long-term endeavors, which means that the benefits from effectively
designed policies—including savings for federal government health care programs—may not be realized
in just ten years.

Furthermore, an ineffective preventive policy cannot be distinguished from an effective policy with the
same initial cost if the budget horizon is too short. When it comes to obesity prevention, CBO’s standard
ten-year budget window is inadequate for assessing the long-run budgetary impact of various policy
options and distinguishing between and among competing options. In short, the ten-year window
effectively distorts policymakers’ perspective on preventive health policies by focusing on the initial cost
of the interventions and failing to capture the full
scope of the policies’ impact in the long term.
                                                                 Because the greatest amount of
This study illustrates the importance of longer-run
CBO estimates of the budget impact of preventive                benefit, and thus federal savings,
health policies, specifically those aimed at obesity            is achieved by preventing obesity
prevention. It is important to note that this study              in childhood, a 75-year estimate
focuses exclusively on federal budgetary effects and
                                                                 would capture the full scope of
does not address assessments of policies’ cost-
effectiveness. In this, the study takes its cue from               savings, whereas a ten-year
CBO, whose cost estimates are strictly concerned with            estimate would include little or
changes in revenues and outlays that proposed                         none of these savings.
legislation would induce for the federal government.

The study is divided into two parts. Part 1 establishes
the issues surrounding obesity, including the steady rise in obesity, the associated health problems and
costs, and proposed or implemented strategies and policies to reduce obesity’s prevalence. This first
part also provides background on CBO’s cost estimates and discusses the challenges inherent in
estimating the budget impact of preventive health measures. To reinforce the importance of
overcoming these challenges and persevering in making longer-term budget estimates, Part 1 concludes
with examples of preventive measures whose costs in the initial ten years are dramatically offset by
savings in the following years.

If CBO were to offer a longer-term budget estimate for preventive health policies, it would be no small
task, as the costs and overall savings to the federal government are multifaceted. Part 2 delineates the
many components of a broadened framework for cost estimates and incorporates these components in
an illustrative model. This model demonstrates the complexities involved in reaching a long-term cost

                                                     4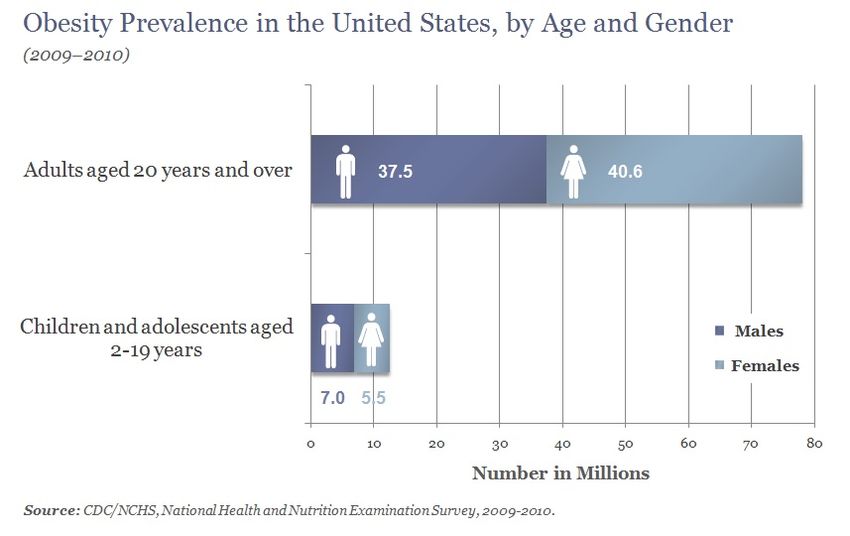
estimate. Equally important, it makes it possible to produce—and quantify the discrepancy between—a
lifetime (i.e., 75-year) and a ten-year cost estimate of a hypothetical policy to prevent obesity. Because
the greatest amount of benefit, and thus federal savings, is achieved by preventing obesity in childhood,
a 75-year estimate would capture the full scope of savings, whereas a ten-year estimate would include
little or none of these savings.

The model presented in this study could serve as a template for CBO in constructing a model of its own
to estimate the long-term budget impact of preventive health policies. With more complete
information, policymakers would be able to consider the merits of proposed preventive health
legislation based on the legislation’s long-run budget impact as well as other standards of measurement,
such as effectiveness, efficiency, and quality of life.

Currently, however, policymaking revolves almost entirely around near-term budget concerns. This is
not without reason, given repeated federal deficits in excess of $1 trillion and an increase in the amount
of outstanding federal debt held by the public as a share of the overall economy (the debt-to-GDP ratio)
from 36 percent in 2007 to an estimated 76 percent in 2013. However, to resolve this critical
macroeconomic fiscal challenge, policymakers need to also focus on long-run spending challenges in
federal entitlement programs—particularly health care programs—and pay careful attention to
preventive health measures.

Part 1: Obesity and the Budget Window

Obesity has been a rapidly growing problem in the United States. Though recent data from the Centers
for Disease Control and Prevention (CDC) indicate some moderation in obesity prevalence in some
states, the situation remains serious.

                                                    5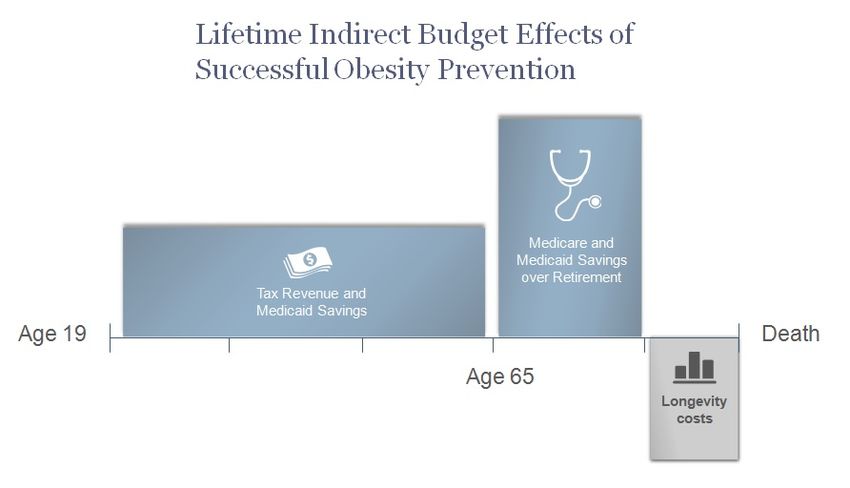
In 2009–2010, over 35 percent of adults were obese, while 17 percent of young people age 2–19 were
obese. This equates to 78 million obese adults and 12.5 million obese children and teenagers (Ogden et
al. 2012). As the above chart illustrates, of obese adults, over 40 million were women, and over 37
million were men. Among children who were obese, girls comprised over 5 million, and boys, 7 million.
Compared to a generation ago, three times as many children and adolescents are obese (CDC 2012a).
Adult obesity has more than doubled in just the last two decades—in 1990, all fifty states had obesity
rates under 15 percent. In 2011, 39 states had obesity rates of 25 percent or more, and 12 of these had
rates of 30 percent or above (CDC 2012b). Recent research that relies in part on the National Health and
Nutrition Examination Surveys concludes that in 2040, 47 percent of men and 51 percent of women in
the United States may be obese (Preston et al. 2012).

In this analysis, obesity is defined by body mass index (BMI), which is calculated as a person’s weight in
kilograms divided by their height in meters squared. Among children, CDC defines obesity as a BMI at or
above the 95th percentile for a specific age and gender
(CDC 2012c). For adults, a BMI of 30 or higher defines a
person as obese (CDC 2012d).
                                                                     Health care spending due to
There are serious health problems associated with                    obesity is estimated to be as
obesity, including increased risk of type 2 diabetes, high
                                                                       high as 21 percent of total
blood pressure, heart disease, certain types of cancer,
gallbladder disease, stroke, osteoarthritis, asthma, and            national health care spending.
depression, among other health issues and diseases (NIH             By 2030, U.S. health care costs
1998 and Dixon 2010).                                                 for obesity are expected to
For example, over 25 million people have diabetes in the       rise by $48 billion–$66 billion.
United States, with annual direct and indirect costs
associated with the disease totaling $174 billion (CDC
2011a). Among diabetic adults, 95 percent have type 2
diabetes (CDC 2012e). And among people with type 2 diabetes, nearly 55 percent are obese, while 85
percent are overweight or obese (CDC 2004).

Cancer is estimated to kill over half a million people and cost over $200 billion annually in the United
States (American Cancer Society 2013), and obesity increases the risk of developing certain types of
cancer. Among men and women newly diagnosed with cancer, 4.4 percent and 7.5 percent of cases,
respectively, are attributable to obesity (Polednak 2008). Certain cancers have much higher rates. For
women, the cancers most attributable to obesity are endometrial and esophageal, with roughly 40
percent of new cases due to obesity. For men, the cancers with the greatest link to obesity are liver and
esophageal—with 32 and 36 percent of new diagnoses, respectively, attributable to obesity (Ibid.).

Nationally, health care spending due to obesity is estimated to be as high as $210 billion (in 2008
dollars), or 21 percent of total national health care spending (Cawley and Meyerhoefer 2012). By 2030,
U.S. health care costs for obesity are expected to rise by $48 billion–$66 billion (Trust for America’s
Health 2012). When also accounting for the non-medical costs of obesity both to individuals, such as

                                                    6
food and clothing expenses, and to employers, such as absenteeism and lost productivity, the overall
annual cost of being obese is estimated to be $450 billion annually (McKinsey & Company 2011).

Given the quality of life concerns, health care costs, and other financial burdens associated with obesity,
the federal government has been increasingly interested in preventing people from becoming obese.
The obesity-related costs specific to the federal government are discussed in greater detail below in the
context of CBO budget estimates. The next section looks more closely at the type of federal preventive
health policies in existence and under consideration.

Federal Policies and Programs for Preventing Obesity

The primary areas of focus for obesity prevention are physical activity, diet, education, and medical
interventions when necessary and appropriate. This section offers an overview of the current state of
obesity prevention at the federal level, looking individually at existing programs, proposed policies and
strategies, and recent legislation containing measures to facilitate obesity prevention. As discussed in
greater detail below, CBO is, by statute, responsible for estimating the federal budget impact of
Congressional proposals. Therefore, although obesity prevention also takes place at the individual,
community, local, and state levels, this section is limited to federal programs and strategies exclusively.

The federal government engages in a wide variety of policy measures aimed at obesity prevention. For
example, a recent study by the Government Accountability Office (GAO) (2012a) found that combined
federal preventive health spending (of which weight loss and obesity prevention programs were a
subset) exceeded $25 billion annually, not including policies contained within Medicare and Medicaid.

Existing programs. The majority of federal efforts to curb obesity are geared toward children.
Longstanding federal programs for children, which incorporate nutrition-specific obesity prevention
components, include Head Start; the National School Breakfast and Lunch Programs; and the Special
Supplemental Program for Women, Infants, and Children (WIC). On the physical activity front, the
Department of Education offers grants through the Carol M. White Physical Education Program (PEP) to
local educational agencies or community-based organizations to run programs designed to help K–12
students meet state physical education standards. In addition, First Lady Michelle Obama’s Let’s Move!
campaign, in conjunction with the White House Task Force on Childhood Obesity, is “dedicated to
solving the problem of obesity within a generation.”

Other programs to improve nutrition and physical activity and reduce obesity are administered at the
state level but funded by the federal government. For example, CDC’s Division of Nutrition, Physical
Activity, and Obesity funds state-based obesity prevention efforts for children and adults in 25 states.
Other federal programs that cover both children and adults include the Department of Agriculture’s
Supplemental Nutrition Assistance Program, which provides financial assistance to low-income people
to purchase food, and Child and Adult Care Food Program (CACFP), which provides healthy meals to low-
income people.

In addition, the Prevention and Public Health Fund (PPHF), established in the Affordable Care Act (ACA),
provides grants to federal agencies, states, and private organizations for a variety of activities related to

                                                      7
preventive health. According to GAO (2012b), fiscal year 2010 PPHF awards targeting obesity totaled
over $50 million, including $35 million for Communities Putting Prevention to Work and $9.1 million for
obesity media activities. In fiscal year 2011, the PPHF awarded $0.7 million for seven contracts
promoting obesity prevention in early childhood and $8.6 million for two contracts for anti-obesity
communication campaigns. Also in fiscal year 2011, nearly $40 million went to Chronic Disease
Prevention and Health Promotion Programs within state health departments.
Finally, the National Diabetes Prevention Program is an existing federal program aimed at preventing
type 2 diabetes—one of the most prevalent and costliest obesity-related diseases (Trust for America’s
Health 2012). According to CDC (2011a), the program “showed that lifestyle intervention to lose weight
and increase physical activity reduced the development of type 2 diabetes by 58% during a 3-year
period. The reduction was even greater, 71%, among adults aged 60 years or older.”
Proposed policies and strategies. The Institute of Medicine (IOM) in 2012 released a comprehensive
strategy for obesity prevention. Driven by the belief that no single policy can prevent obesity, the IOM
report includes recommendations for leaders across the spectrum, including health care and public
health professionals; child care and early childhood education regulators; federal, state, and local
government agencies; urban planners, architects, and developers; and state and local health
departments. Those recommendations aimed at the federal government include federal support for
translating scientific evidence into guidelines for physical activity, the expansion of healthy
vending/concession guidelines to all government-owned and -operated locations, federal funding for a
national social marketing campaign for physical activity and nutrition, and the potential implementation
of a nutrition labeling system for the fronts of food packages.
The IOM’s proposed measures to reduce obesity among children include federal requirements for both
a K–12 food and nutrition curriculum and a K–12 physical education curriculum that includes
benchmarks for progress.
The National Center for Children in Poverty in 2012 made recommendations for obesity prevention in
early childhood. On the federal level, these include expanding WIC and CACFP and reducing existing
barriers to participation, such as correcting the discrepancy between CACFP reimbursement and actual
cost (Banghart 2012).
While the majority of federal obesity prevention programs target childhood obesity, some specific
policies are tailored exclusively to adults and older Americans on Medicare. For example, H.R. 6666,
legislation introduced by Representative Ron Kind (D-WI) during the 112th Congress, would have
allowed for the coverage of prescription drugs for chronic weight management for obese or overweight
Medicaid and Medicare Part D beneficiaries with a weight-related co-morbidity.
Recent legislation containing preventive health measures. In recent Congresses, proposed legislation
incorporating obesity prevention measures include the MEAL Act, the FIT Kids Act, the National Obesity
Prevention Act, the Healthy Lifestyles and Prevention America Act, and the Health Promotion FIRST Act,
among others (Ferguson et al. 2009).
8Several bills that include obesity prevention programs have been enacted into law recently. In February
2009, the Children’s Health Insurance Program Reauthorization Act established the Childhood Obesity
Demonstration Project to provide grants to “eligible entities” to “develop a comprehensive and
systematic model for reducing childhood obesity” (Sec. 401, P.L. 111-3). The ACA included $25 million in
funding for the demonstration, which is being run through CDC. In September 2011, CDC announced the
four project grantees—three research facilities (University of Texas Health Science Center at Houston,
San Diego State University, and Massachusetts State Department of Public Health) and one evaluation
center (University of Houston). The project will conclude in September 2015, whereupon CDC will
publish the findings and recommendations (CDC 2011b).
The ACA also included a provision that requires health insurance providers to fully cover items or
services that the U.S. Preventive Services Task Force (USPSTF) recommends with an “A” or “B” rating.
The USPSTF recommendation for obesity screening by clinicians for adults and children age 6 and older
received a “B” rating. According to the Kaiser Family Foundation (2011), removing cost-sharing for
preventive services will increase the likelihood that people will request them: “While a number of
factors contribute to use of preventive services, out-of-pocket costs in the form of copayments and
deductibles can act as a barrier, keeping even the insured from seeking recommended screenings,
counseling, and immunizations.”
Finally, the Healthy, Hunger-Free Kids Act (also called the Child Nutrition Reauthorization Act), signed
into law in December 2010, reauthorized and provided additional funding to federal child nutrition
programs, expanded eligibility among children for school meal programs, and set nutrition standards for
both school meal programs and food served in schools outside of a meal program (in vending machines,
school stores, and à la carte lines), among other changes.
Surgical interventions. Different types of surgeries, known collectively as bariatric surgery, are available
to help already obese people lose weight. Bariatric surgery has been shown to be effective in decreasing
an individual’s food intake through various means, including gastric bypass, gastric banding, or the
removal of part of the stomach (NIH 2011). A Medicare beneficiary is eligible for bariatric surgery if he or
she has a BMI of 35 or higher, suffers from an obesity-related health issue, and has been unable to lose
weight with other medical treatment (CMS 2013). Medicaid coverage of bariatric surgery is determined
at the state level. In 2010, Medicaid programs in forty-five states offered coverage, with various
restrictions (Lee et al. 2010).
Background on CBO Cost Estimates
As mentioned above, CBO is required by statute to provide cost estimates of proposed legislation. The
law that established CBO—the Congressional Budget and Impoundment Control Act of 1974—set
various tasks for the agency, including the following:
The Director of the Congressional Budget Office shall, to the extent practicable, prepare for each
bill or resolution of a public character reported by any committee of the House of
Representatives or the Senate (except the Committee on Appropriations of each House) . . . an
estimate of the costs which would be incurred in carrying out such bill or resolution in the fiscal
9year in which it is to become effective and in each of the 4 fiscal years following such fiscal year,
together with the basis for each such estimate. . . . (Sec. 402, P.L. 93–344)
The cost estimates that CBO produces compare federal outlays and revenues as they would be under
current law with what they would be if the proposed legislation were enacted. CBO reports the budget
effects in three areas: discretionary spending (e.g.,
defense, education, transportation, etc.), mandatory
spending (e.g., Social Security, Medicaid, Medicare),
Preventive health measures,
and revenues, though estimates of tax policy changes
are performed by the Joint Committee on Taxation such as those designed to
(CBO 2013a). reduce obesity, can have long-
run budgetary consequences
Although the law only requires CBO to provide a five-
year cost estimate, it has become accepted practice that are very different from
for the cost estimates to span ten years. While ten their ten-year impact. In fact,
years may be sufficient for many types of legislation, very little of the federal savings
preventive health measures, such as those designed
they induce may be captured in
to reduce obesity, can have long-run budgetary
consequences that are very different from their ten- the first ten years.
year impact. In fact, very little of the federal savings
they induce may be captured in the first ten years,
especially if the interventions are geared toward children or young adults and yield meaningful impacts
on health care costs for individuals receiving Medicare decades in the future.
In short, for effective obesity prevention and other preventive health measures, the narrowness of
CBO’s focus and methodology yields incomplete cost estimates (O’Grady and Capretta 2012).
Furthermore, such a narrow budget window for long-run policy interventions fails to assist policymakers
in distinguishing between effective and ineffective
interventions—because the ten-year window misses most
Because the ten-year window or all of the savings from an effective obesity prevention
misses most or all of the policy, a ten-year cost estimate for such a policy would not
differ from a ten-year cost estimate for an ineffective one.
savings from an effective
obesity prevention policy, a CBO is already aware of the shortcomings of the ten-year
window for assessing preventive health measures. In a
ten-year cost estimate for
lengthy report on the health and budget effects of raising
such a policy would not differ the cigarette tax, the agency acknowledged, “The
from a ten-year cost estimate budgetary effects of a policy, such as a cigarette tax
for an ineffective one. increase, that changed health behaviors would not be fully
realized within the standard 10-year budget window” (CBO
2012a, p. 56).
10The CBO report on the cigarette tax did calculate a long-term score—through 2085. The chart below
shows the estimated outlays from a $0.50 per-pack tax increase. The difference between the anticipated
outlays in 2023 (when the ten-year budget window would end) and the anticipated outlays in 2085 is
remarkable. In approximate terms, the outlay effect of this tax increase is near $0 over ten years but is
about 0.012 percent of gross domestic product (GDP) per year in the long run, equivalent to about $190
billion a year in today’s economy. This increase in spending can be disaggregated into two distinct
effects: 1) the longevity impact, which increases spending as more individuals stop smoking and live
longer, and 2) the per-capita health care spending effect, which reduces outlays because of an
individual’s improved health status. In the case of smoking, the longevity effect dominates.
While traditional CBO scoring is reported in nominal dollars, this CBO chart reports the outlay effect
relative to GDP. Thus, even at the end of the extended budget window, when total outlays appear to
level off, they are actually increasing at the nominal growth rate of the economy.
The following chart shows CBO’s estimated long-run revenue impact from the $0.50 per-pack tax
increase. As the chart shows, in 2023, direct revenues from the excise tax are not drastically higher than
they are expected to be in 2085, relative to GDP. But over time, the improvement in the health status of
the workforce results in additional hours worked nationally. This increase in the labor supply results in
higher payroll and income taxes. That effect is relatively small within the first ten years, but it eventually
offsets almost half of the outlay effect induced by longevity. Overall, when combined with anticipated
outlays, the total budget impact in 2085 is quite different than it is in the ten-year window.
11Despite CBO’s acknowledgement of the insufficiency of the ten-year budget window for cost estimates
of preventive health measures, the agency notes that there are serious challenges to regularly
estimating preventive health measures’ budget impact. These challenges are discussed next.
Challenges to Estimating Preventive Health Measures’ Budget Impact
Cost estimates of preventive health policies are difficult to determine because a policy’s impact is
usually multifaceted and its effectiveness is difficult to assess. GAO has reported on the limitations
inherent in estimating costs and savings from this type of policy and attributes the difficulty to “the
multiple factors that can affect these estimates, including the need to make assumptions and a lack of
key data . . . as well as a lack of widespread agreement on what constitutes a preventive health activity”
(GAO 2012a, p. 32). Furthermore, while many policies are well-intentioned, the actual federal resources
being spent may include significant “leakages,” dollars being diverted to administrative purposes instead
of actual interventions. In addition, some federal dollars may displace local, state, or private funds that
would have been spent on preventive health had the federal dollars not been provided.
When it comes to preventive measures aimed specifically at obesity, GAO’s general assessment of these
challenges is complicated further by the unique problems obesity presents. CBO articulates the issues
surrounding policies targeting obesity thus:
Unlike smoking, which involves a unique substance that is not healthy in any quantity, obesity is
the end result of several interacting factors that are not all intrinsically unhealthy. One of those
12factors is obviously diet, which can be hard to regulate because many foods are safe to eat in
moderation. Another key factor is lack of exercise, a bad habit that—like a poor diet—can be
difficult for individuals to change and is particularly difficult for policymakers to influence.
Approaches for losing weight reflect those difficulties: A variety of interventions appear to
succeed in the short run, but relatively few participants are able to maintain their weight loss for
a long period of time. Keeping to a lower weight may require longer-lasting, and potentially
more expensive, approaches. (Elmendorf 2009, pp. 4–5)
While some public health advocates may disagree with the intensity of CBO’s claim, there are
undoubtedly certain policies targeting obesity that will not yield long-run improvements in health status.
Yet, other policies can be effective. And as long as the federal government funds preventive health
measures, accurate estimates of their true, long-run budget impact will be essential. Cost estimates
simply must incorporate long-term costs and savings because stopping at ten years yields a distorted
picture of the policies’ budget impact. Those policies that are highly effective over the long run could
potentially result in net savings to the federal government. Conversely, obesity prevention policies that
are poorly designed, poorly targeted, or not effective will rightly have long-run cost estimates far greater
than the cost shown within the ten-year budget window.
Examples of Ten-Year Budget Window’s Inadequacy
The most compelling evidence of the inadequacy of a ten-year budget window is the existence of many
studies that have found preventive health measures to be cost-effective or cost-saving significantly
beyond ten years. This section looks at two such studies on smoking cessation and one on obesity. The
focus of these studies is not the budget window specifically; the applicability of the findings to the
duration of CBO’s budget estimates is incidental.
Lifetime medical costs of obesity. Particularly relevant to the subject at hand is a 2008 study by Duke
University economist Eric A. Finkelstein and colleagues in the journal Obesity. Finkelstein, a well-known
expert on the economics of obesity, and coauthors estimate and compare lifetime medical costs of
obesity from starting ages of 20 and 65. They conclude that “from the perspective of a 20-year-old adult,
the short-term costs of obesity are relatively modest. This results because many of the diseases that
obesity promotes are not prevalent until older ages” (Finkelstein et al. 2008, p. 5).
Given this, there is clearly little immediate savings opportunity from obesity prevention among younger
adults. Because the costs of obesity are largely deferred until individuals’ later years, the real costs (and
thus potential savings) occur in Medicare, even for people who are obese in their younger years. This is
important for two reasons: 1) the federal government ends up being on the hook for much of the
medical costs associated with obesity, and 2) the savings from a government obesity prevention
program targeting youth would not be realized for decades.
Raising the legal smoking age. A study in the journal Health Policy examines the health benefits and
cost savings of raising the legal smoking age in the United States to age 21 (Ahmad 2005). In addition to
the smoking-driven health care costs borne by society (which comprise Medicare, Medicaid, out-of-
13pocket, and private insurance expenditures), the study includes the cost the government incurs in
enforcing compliance of the new minimum age and the cost to sellers of checking purchasers’ IDs.
The study presents total costs at ten, twenty, and fifty years (in constant 2003 dollars). As the author
clarifies, “A simulation period of 50 years was chosen to ensure that much of the lifespan of the
individuals who would be affected by the policy would be included and the gradually accumulating
health benefits of the policy change would be captured” (p. 82). Indeed, at ten years, the policy is
estimated to have societal savings of $10.5 billion, and at twenty years, $39 billion. At fifty years,
societal savings are more than fivefold the twenty-year estimate, at $212 billion.
School-based anti-tobacco education. A study in the journal Preventive Medicine analyzes a national
anti-tobacco education program targeting seventh and eighth graders (Tengs et al. 2001). As in Ahmad
(2005), the medical savings are calculated at the societal level. The authors estimate that the health care
savings induced by a school-based program would be $0.48 billion–$1 billion over 25 years. Notably,
they calculate that the savings over fifty years would be four times greater than over 25 years.
Explaining the reason why savings quadruple when the time period under analysis is doubled, Tengs et
al. write: “Savings occur because those youth influenced by the program in the early part of the century
will have aged sufficiently to reap the long-term health gains from avoiding tobacco use” (p. 564).
While the authors ultimately deem the school-based anti-tobacco education program cost-effective, it is
not cost-saving, as the cost to run the program ends up outstripping the estimated savings. But, had the
analysis stopped at 25 years (or earlier), the long-term benefits would have been largely excluded. For
example—and of particular relevance to the question under discussion in this study regarding the length
of the budget window—the ten-year cost of running the anti-tobacco education program is estimated at
roughly $1.9 billion.
Savings outside the ten-year budget window. While Finkelstein et al. (2008), Ahmad (2005), and Tengs
et al. (2001) are not exclusively focused on government health care costs and are not necessarily
interested in the budget window, their findings, and the findings of many others, point unequivocally to
the inadequacy of only examining ten years of a preventive health policy’s budget effect. In fact,
because the federal government’s responsibility for national health care costs are disproportionately
weighted toward the costs incurred by the elderly, the share of total societal cost borne by the
government increases over the budget window.
This is not to say that a preventive health measure should be assumed by its nature to be either cost-
saving or cost-effective. As health policy experts point out in the New England Journal of Medicine,
“Although some preventive measures do save money, the vast majority reviewed in the health
economics literature do not. Careful analysis of the costs and benefits of specific interventions, rather
than broad generalizations, is critical” (Cohen et al. 2008). It is, in fact, because only some preventive
health measures yield meaningful cost benefits beyond the traditional ten-year budget window that it is
so critical to have a broader time horizon. Given the budget constraints facing lawmakers, it will be
critical to identify the most effective preventive measures, and that goal can only be achieved with a
longer budget window.
14Part 2: Analysis
As Part 1 of this study has established, the need for a longer budget window is clear. However, there are
complexities involved in estimating a preventive health measure’s long-term budget effects in order to
reach a true, long-term cost estimate. Understanding these complexities is the first step in creating a
broadened framework for thinking about an appropriate budget window for preventive health policies.
The next step is incorporating these components into a budgetary model that would yield a more
accurate estimate of the budget impact of these policies.
Broadened Framework for Longer-Term Cost Estimates
This study distinguishes between the costs of a preventive health intervention itself and the costs and
savings the intervention would induce. For simplicity, the intervention is considered the “direct effect”
of the policy, while costs and savings brought about by the policy are called its “indirect effects.” This
section delineates the indirect budgetary effects to the federal government from a policy that succeeds
in reducing the number of obese individuals. It is important to note that, in addition to the long-term
federal savings and increased revenue that a successful obesity prevention policy would induce, a longer
budget window must also include the longer-term costs of obesity prevention—namely, the costs
associated with increased life expectancy. This section first addresses the long-term positive budget
impact, followed by the costs.
Reduced federal health care spending and increased federal revenue. The largest budgetary benefit
from obesity prevention would be the federal savings within the Medicare and Medicaid programs that
would result from avoiding obesity-related diseases and co-morbidity. The reality is that obese patients
are far more expensive to treat than normal-weight patients. There is no mystery about why this is the
case. According to public health experts, “Although pharmaceutical, medical, and surgical interventions
to treat obesity are available, these treatments remain rare. As a result, the costs attributable to obesity
are almost entirely a result of costs generated from treating the diseases that obesity promotes”
(Finkelstein et al. 2009, p. 829). As discussed in Part 1, obesity-related diseases include type 2 diabetes,
heart disease, certain types of cancer, asthma, depression, and gallbladder disease, among others.
A subcategory of Medicare and Medicaid savings would be the reduced spending on obesity-induced
disability. This would also result in savings to Social Security, with fewer people on Social Security
disability insurance or Supplemental Security Income.
Another benefit to the federal budget of curbing obesity is increased tax revenues. In short, obesity
prevention would lead to higher wages, which would yield more tax revenue. This is the case because
obese people on average earn lower wages than normal-weight workers. For women in particular,
academic research has shown obesity to be linked to lower wages. For men, the evidence is not as
certain. There is debate over what causes wage discrepancy between obese and non-obese workers—
whether it is tied to productivity, the result of discrimination, or compensating for health care costs for
employer-sponsored health plans (Bhattacharya and Bundorf 2009). However, in consideration of CBO’s
budget window, only the existence of the discrepancy is relevant because, in essence, lower wages
15mean less tax revenue for the federal government. In addition, healthier workers may also enjoy longer
careers. This effect would be in addition to any wage impact of obesity. For example, a non-obese
worker may be less likely to retire early at 62. Additional years of work will also increase tax revenues.
Last, obesity among workers also reduces productivity, with a total cost of as much as $66 billion per
year (Hammond and Levine 2010). Higher levels of productivity affect CBO’s budget forecasts thus:
Forecasts of productivity growth play a critical role in forecasting potential output, which is
CBO’s estimate of the amount of output that the economy would produce with a high rate of
use of its capital and labor resources. As such, CBO’s forecast of potential output shows how
much the economy can sustainably grow during periods of expansion and determines the
trajectory of gross domestic product (GDP) in the later years of the agency’s 10-year forecasts.
(CBO 2013b, p. 7)
Overall, the revenue effect, whether through increased hourly wages, an increase in labor supply, or
both, will result in additional revenue from income and payroll taxes. This effect was a key component
of the CBO analysis of the long-term impact of increasing the tobacco tax discussed above. As such, it is
certainly a factor that CBO is capable of recognizing and modeling if the agency were to consider the
long-run impact of effective obesity prevention policies.
Increased federal entitlement program spending. On the other side of the ledger, obesity prevention
produces the same indirect “problem” as effective tobacco cessation programs—both increase life
expectancies, and there are costs associated with increased longevity. Namely, when people live longer,
the government spends more on Medicare, Medicaid, and Social Security.
Lifetime indirect budget effects. The following chart offers a visual representation of the long-term
indirect budget effects of preventing obesity, from early adulthood through retirement and death.
Quantifying these costs and savings requires an application of the broadened framework just outlined.
The next section undertakes such an application by constructing a model that illustrates how CBO could
approach a long-term cost estimate of a preventive health policy targeting obesity.
16Modeling Long-Term Indirect Budget Effects of Obesity Prevention
The model constructed for this study uses national averages for the types of indirect costs and savings
delineated above. In current ten-year cost estimates, CBO captures the short-term direct cost of a
preventive health intervention and any indirect effect that occurs within the budget window. If the
intervention is ongoing, estimating its long-term direct cost is simply a matter of extending this cost over
the longer budget window and adjusting for population growth, inflation, and/or real growth, as
appropriate. But to estimate the true long-term budget impact of a policy aimed at curbing obesity, CBO
would need to also incorporate the long-term indirect effects. The model in this study illustrates the
components—positive and negative—that CBO should
consider when modeling these effects.
There are multiple types of models that could be employed The model constructed here
for this analysis, but the model constructed here is intended is intended to be simple to
to be simple to understand, supported by sufficient understand, supported by
empirical evidence, and closely aligned with an approach
sufficient empirical
that CBO could pursue. It is a binary, per-capita model that
estimates the tax and spending impact of preventing an evidence, and closely
individual from becoming obese or helping a person achieve aligned with an approach
and maintain normal weight. Because the model is binary, that CBO could pursue.
meaning that it only captures the effects of a large change in
an individual’s BMI, there may be additional benefits that
are not being captured here from incremental weight loss.
Similarly, the model does not distinguish between obese (BMI>30) and morbidly obese (BMI>40).
Positive long-term indirect effects of obesity prevention. Estimates of increased tax revenue and
reduced health care spending resulting from successful obesity prevention are constructed as follows:
Inputs Affecting Tax Revenue Analysis
• In a review of eleven studies on obesity’s wage effect, Dor et al. (2010) find that obese men on
average are not likely to have lower wages than men of normal weight. For women, however,
obesity does appear to have a negative relationship to wages, with estimates of lost wages
ranging from 1.5 percent up to 15 percent. This model uses an estimate from Baum and Ford
(2004), which finds that obese women’s wages are lower by 6.1 percent. This estimate is
corroborated by the analysis conducted by Dor and colleagues.
• According to the Bureau of Labor Statistics (2013), average wages in 2012 were $35,932 for
women. A female worker at this wage level who earns 6.1 percent more by avoiding obesity
would make on average an additional $2,192 (in 2012 dollars) in annual wages.
• The Tax Policy Center (2013) calculates the average effective marginal tax rate (EMTR) on labor
income to be 22.9 percent. At this rate, annual additional income tax revenue from a woman
avoiding obesity would be approximately $502.
17• Incorporating payroll taxes can present a challenge because they sometimes result in higher
Social Security benefits in retirement. However, for a married person who is a secondary
earner, Social Security benefits are calculated based on the primary earner’s record. Thus,
payroll taxes that secondary earners pay do not result in extra Social Security benefits. For a
male secondary earner who avoids becoming obese, there is no payroll tax effect because
there is no statistically significant
obesity wage effect. For a female
secondary earner, the EMTR for Annual additional income tax revenue
income and payroll taxes is 34.7
$502 per average female worker
percent (TPC 2013), yielding annual
additional federal tax revenue of $761 per average female secondary earner
approximately $761. –$9 per average low-income female worker
$0 per average male worker
• For the lowest quintile of earners,
however, the average EMTR is –0.9
percent. Therefore, for a low-income
female worker who avoids obesity, there is actually a negative federal tax impact from higher
wages. This negative tax effect is the result of the Earned Income Tax Credit (EITC). Depending
on a worker’s income, the EITC can provide a tax subsidy for increased amounts of work. To
account for this effect, this model includes a woman who has one child and earns the federal
poverty level for 2012 ($15,130). A woman in these circumstances who avoids obesity would
earn $946 more per year, with a tax impact of –$9 annually.
Medicaid and Medicare Savings
• In the most widely cited study of payer-specific Federal Medicaid savings
per-capita medical spending attributable to
$663 per Medicaid enrollee per year
obesity, Finkelstein and colleagues (2009)
estimate that, on average, an obese Medicaid
enrollee in 2008 cost $1,021 more than a
normal-weight enrollee. On average, 57 percent of Medicaid spending is attributable to the
federal government. Based on these estimates, in 2012 dollars, an obese person on Medicaid
costs the federal government an extra $663 per year compared to a normal-weight enrollee.
• Finkelstein and colleagues estimate that
an obese Medicare beneficiary in 2008 Medicare savings
cost on average $1,723 ($1,964 in 2012
dollars) more than a normal-weight $1,964 per Medicare beneficiary per year
beneficiary.
o Cawley and Meyerhoefer (2012) find that an obese woman has annual medical
expenditures $3,613 higher than a non-obese woman, while a man has obesity-related
costs of $1,152. In addition, they find that Medicaid spending for obese individuals is
18$3,674 higher than for non-obese individuals. These estimates are significantly greater
than the widely cited Finkelstein et al. (2009) results and are in some respects
preferable because the statistical techniques are superior. However, Cawley and
Meyerhoefer’s findings for men and Medicaid beneficiaries are not statistically
significant due to their large standard errors, and the results are largely driven by the
impact of the most obese patients in the sample. For these reasons and to ensure a
conservative approach, the model constructed here uses Finkelstein et al. (2009)
estimates.
Negative long-term indirect effects of obesity prevention. Estimates of long-term indirect costs of
successful obesity prevention are constructed as follows:
Increased Longevity
• Public health experts estimate that a normal-weight man and woman at age 65 have life
expectancies of 82.53 and 86.15 years, respectively. An analogous obese man and woman
have life expectancies of 80.93 and 84.75 years, respectively (Yang and Hall 2008).
o Other estimates of obesity’s longevity effect include Olshansky et al. (2005), who
conclude that, absent obesity, life expectancy at birth would be higher by 0.3–1.08
years, depending on gender and race. Fontaine et al. (2003) estimate years of life lost to
obesity and find significant variation based on age, gender, race, and BMI. This report
uses the Yang and Hall (2008) estimates of increased life expectancy—1.6 years for a
man and 1.4 years for a woman—because the illustrative model does not consider race.
Social Security Longevity Cost
• According to the Social Security Social Security longevity cost
Administration, the average monthly
$23,616 per average man (1.6 years)
benefit (not specific to a retired worker’s
wages during his or her working life) at the $20,664 per average woman (1.4 years)
beginning of 2012 was $1,230. This means
that the federal government would pay on
average an additional $23,616 for a man and $20,664 for a woman who avoids becoming
obese and lives to the average normal-weight life expectancy.
Medicare Longevity Cost
• During the additional years of life that Medicare longevity cost
result from avoiding obesity, per-
$7,553 per male beneficiary (1.6 years)
beneficiary spending in Medicare would be
lower than it would be for obese $6,745 per female beneficiary (1.4 years)
individuals. Finkelstein et al. (2009)
19estimate that health care spending for an obese Medicare beneficiary exceeds spending for a
normal-weight beneficiary by 36.4 percent.
• Based on this estimate, total federal costs for a male Medicare beneficiary would be $7,553 (in
2012 dollars) during the 1.6 years of increased life expectancy, and for a female beneficiary
during her 1.4 additional years, $6,745 (in 2012 dollars).
Implications for Budget Window Length
The model outlined above has clear implications for the future of CBO cost estimates for preventive
health measures. In short, it indicates that a more meaningful and appropriate budget window for
preventive health measures would be 75 years because it would capture a more accurate picture of the
costs and savings to the federal government over the lifetime of someone who avoids becoming obese.
Supporting this move is the fact that there is precedent for a 75-year window: CBO’s own study of the
cigarette tax described in Part 1 of this report included a 75-year cost estimate. In addition, the Social
Security and Medicare trustees routinely provide 75-year projections for those programs.
As mentioned above, the majority of federal savings from obesity prevention is achieved through
children becoming normal-weight adults and eventually normal-weight retirees. A budget window of a
decade is far too short to capture these savings, but
even a window covering a few decades would miss
significant savings from preventing obesity in children.
A more meaningful and
In addition, as mentioned above, an important benefit appropriate budget window for
of a longer budget window is that it would allow
preventive health measures
policymakers to distinguish between effective and
ineffective preventive health policies. While CBO does would be 75 years because it
incorporate in its cost estimates evidence regarding a would capture a more accurate
policy’s estimated effectiveness, ten years is not picture of the costs and savings
enough time for the savings induced by an effective
to the federal government over
obesity prevention policy to make the policy
distinguishable from an ineffective one. the lifetime of someone who
avoids becoming obese.
On the subject of policymakers weighing whether to
pursue a preventive health policy, Finkelstein et al.
(2010) rightly points out: “The requirement for cost
savings is an extremely high bar for publicly funded health promotion efforts and may ultimately prove
infeasible. This is not to say that efforts should not be made to address obesity, but only that cost
savings may not be the appropriate justification.” In other words, some preventive health measures may
be worth pursuing despite their costs.
As O’Grady and Capretta (2012) explain: “One way of measuring this balance between clinical benefit
and cost is through quality adjusted life years (QALY). The calculation of the QALY measures the amount
of clinical benefit achieved for the dollars spent. In this way it provides within a single data point the
20You can also read