Unhealthy Levels of Air Pollution in 2003 - September 2004 - The Pew ...
←
→
Page content transcription
If your browser does not render page correctly, please read the page content below
Unhealthy Levels of Air
Pollution in 2003

September 2004
Danger in the Air:
Unhealthy Levels of Air Pollution in 2003

              September 2004

                                    Danger in the Air 1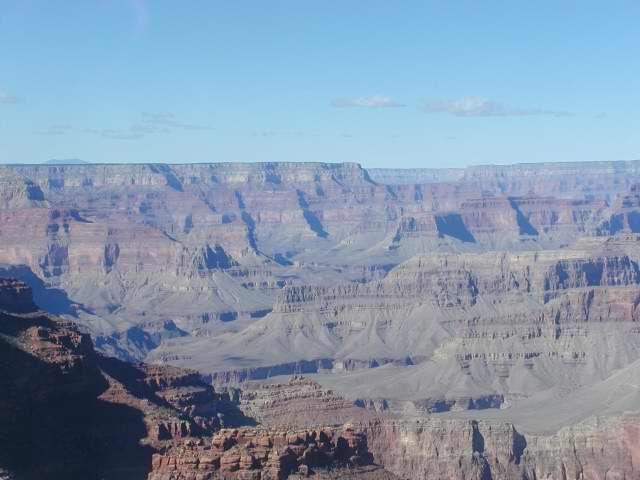
Acknowledgements
Written by Emily Figdor and Lara Chausow of the U.S. Public Interest Research Group (U.S.
PIRG) Education Fund for Clear the Air, a joint project of the Clean Air Task Force, National
Environmental Trust, and U.S. PIRG Education Fund. Lara Chausow compiled the data for the
report. Thanks to Alison Cassady of the U.S. PIRG Education Fund for research and editorial
support.
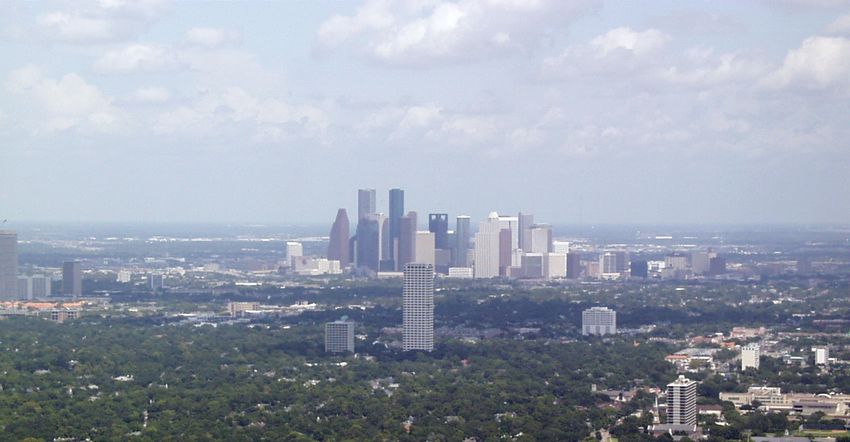
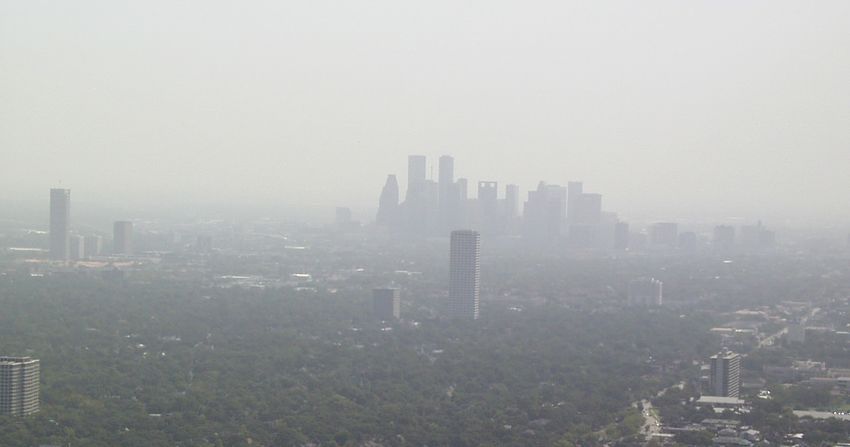
Cover photos of Grand Canyon National Park courtesy of the National Park Service,
www2.nature.nps.gov/air/webcams/parks/grcacam/grca_arc.cfm. Cover photos of the city
skyline courtesy of Galveston-Houston Association for Smog Prevention, www.ghasp.org.
This report was made possible with funding from The Pew Charitable Trusts. The opinions
expressed in this report are those of the author and do not necessarily reflect the views of The
Pew Charitable Trusts.
© 2004, U.S. PIRG Education Fund
The U.S. PIRG Education Fund is the research and policy center for U.S. PIRG. U.S. PIRG is the
national advocacy office of the State PIRGs, which are a nationwide network of nonprofit,
nonpartisan, state-based public interest advocacy organizations.
For additional copies of this report, send $30 (including shipping) to the following address:
U.S. PIRG Education Fund
218 D Street, SE
Washington, DC 20003
(202) 546-9707
www.uspirg.org
Danger in the Air 2Table of Contents
Executive Summary................................................................................................................... 4
Sources of Ozone and Fine Particle Pollution ........................................................................... 6
Ozone ......................................................................................................................................... 6
Fine Particle Pollution ................................................................................................................... 7
Health Effects of Ozone and Fine Particles ............................................................................... 8
Ozone ......................................................................................................................................... 8
Fine Particle Pollution ................................................................................................................... 9
Code Orange, Red, and Purple for Ozone and Fine Particles........................................................... 11
Trends in Ozone and Fine Particle Pollution ........................................................................... 13
Ozone ....................................................................................................................................... 13
Fine Particle Pollution ................................................................................................................. 15
Failing to Meet Health Standards............................................................................................ 16
Ozone ....................................................................................................................................... 16
Fine Particle Pollution ................................................................................................................. 16
Report Findings: 2003 Air Quality........................................................................................... 18
Ozone ....................................................................................................................................... 18
Code Purple, Very Unhealthy Ozone Levels ............................................................................... 22
Fine Particle Pollution ................................................................................................................. 25
Spikes in Fine Particle Pollution ............................................................................................... 27
Code Purple, Very Unhealthy Particle Levels ............................................................................. 30
Preliminary 2004 Ozone Data ...................................................................................................... 31
Bush Administration Rewrites the Rules for Industry ............................................................ 32
Methodology............................................................................................................................ 34
Appendices
Appendix A. Unhealthy Levels of Ozone by State, 2001-2003 ............................................................ 42
Appendix B. Smog Days by State, 2003 .......................................................................................... 43
Appendix C. Smog Days and Exceedances of 8-Hour and 1-Hour Ozone Health Standards in Large
Metropolitan Areas, 2003................................................................................................................ 44
Appendix D. Smog Days and Exceedances of 8-Hour and 1-Hour Ozone Health Standards in Mid-Sized
Metropolitan Areas, 2003................................................................................................................ 46
Appendix E. Smog Days and Exceedances of 8-Hour and 1-Hour Ozone Health Standards in Small
Metropolitan Areas, 2003................................................................................................................ 48
Appendix F. Preliminary 2004 Data on Exceedances of Ozone Health Standards by Metropolitan Area ... 51
Endnotes ................................................................................................................................. 53
Danger in the Air 3Executive Summary
While air quality has improved in the last 684 times on 187 days in 2003. The
three decades, half of all Americans live in Riverside-San Bernardino-Ontario,
counties where air pollution exceeds California metropolitan area was the
national health standards.∗ Most of these most ozone-polluted large city;
places suffer from high levels of ozone Bakersfield, California was the most
and/or particle pollution. Ozone is the ozone-polluted mid-sized city; and
country’s most pervasive air pollutant; Merced, California was the most ozone-
particle pollution is the nation’s deadliest air polluted small city.
pollutant. Coal-fired power plants and
motor vehicles are the largest sources of • Fine particle pollution exceeded the
these pollutants. This report, which is year-round national health standard in
based on a comprehensive survey of 20 states in 2003. Among large cities,
environmental agencies from all 50 states the Riverside-San Bernardino-Ontario,
and the District of Columbia, examines California metropolitan area was most
levels of ozone and fine particle pollution in polluted by year-round particle
cities and towns across the country in 2003 pollution; Dayton, Ohio was most
and finds that air pollution continues to polluted by year-round particle pollution
pose a grave health threat to Americans. among mid-sized cities; and the
Weirton-Steubenville, West Virginia-Ohio
Ground-level ozone, the primary component metropolitan area was most polluted by
of smog, is a severe respiratory irritant that year-round particle pollution among
can aggravate asthma and cause other small cities.
respiratory problems, including permanent
lung damage. Fine particle pollution, or • Fine particle pollution exceeded the 24-
“soot,” can bypass the body’s defenses and hour national health standard 106 times
cause serious respiratory and cardiovascular on 39 days in 13 states in 2003. Of
problems, including heart attacks, lung large cities, the Riverside-San
cancer, and premature deaths. Bernardino-Ontario metropolitan area
was most polluted by spikes in particle
Danger in the Air: Unhealthy Levels of Air pollution; of mid-sized cities, El Paso,
Pollution in 2003 is a compilation of 2003 Texas was most polluted by spikes in
data from the nation’s network of ozone particle pollution; and of small cities,
and fine particle air quality monitors, based Missoula, Montana was most polluted by
on our comprehensive survey of state spikes in particle pollution.
environmental agencies. Key findings
include the following: This report also includes preliminary ozone
data for 19 states and the District of
• Ozone levels in 40 states and the Columbia for 2004, which, like 2003, has
District of Columbia exceeded the 8- been a relatively mild and wet summer.
hour national health standard 4,583 Yet, through the beginning of September
times and the 1-hour health standard 2004, ozone levels have exceeded the 8-
hour health standard 602 times and the 1-
∗
U.S. Environmental Protection Agency, National hour standard 84 times in these areas.
Air Quality and Emissions Trends Report: 2003
Special Studies Edition, September 2003, 8.
Danger in the Air 4Until policymakers require tough cleanup as nonattainment areas and propose
standards for power plant smokestacks, and finalize a strong rule to bring these
Americans will continue to suffer serious areas into compliance with the health
health problems from ozone and fine standards by the end of this decade, as
particle pollution. Instead of taking action required by the Clean Air Act.
to solve this problem, the Bush
administration is helping powerful energy State environmental agencies and other
companies rewrite the rules, weakening policymakers should:
existing protections and making Americans
even more vulnerable to the health effects • Continue to reject the Bush
of harmful pollutants. administration’s “Clear Skies” plan,
which would replace the Clean Air Act’s
Given the extent of our air pollution power plant cleanup programs with far
problem, we need much stronger, not weaker programs.
weaker, clean air protections. The Bush
administration should: • Adopt a comprehensive program to
reduce emissions of smog- and soot-
• Substantially strengthen, accelerate, and forming pollutants, as well as carbon
finalize its proposal to cap smog- and dioxide and mercury, from power plants.
soot-forming pollutants from power
plants in the eastern U.S. to adequately • Ensure that states continue to have the
protect public health and comply with authority to set clean air standards that
the law. are more protective than federal
standards.
• Designate all areas where people
breathe unhealthy levels of fine particles
Danger in the Air 5Sources of Ozone and Fine Particle Pollution
other sources produces 95 percent of all
Ozone NOx emissions (see Figure 1).1 VOCs result
from a wider range of sources, including
Ozone is an odorless, colorless gas. In the motor vehicles, chemical plants, refineries,
upper atmosphere, ozone forms naturally factories, and commercial and consumer
and shields the planet from ultraviolet products (see Figure 2).2 Prevailing winds
radiation. At ground level, however, ozone can carry ozone and the pollutants that
causes serious health problems. form it for hundreds of miles. As a result,
the highest ozone concentrations typically
Ozone is not emitted directly from pollution occur downwind of urban centers in
sources but rather forms when nitrogen suburban areas.3
oxide (NOx) emissions and volatile organic
compounds (VOCs) react with heat and Note that 1999 is the most recent year for
sunlight. Ozone levels in the U.S. typically which complete emissions data are
rise from May to October, when available. While EPA estimates emissions
temperatures are generally higher, sunlight data annually, the agency inventories
is more abundant, and atmospheric sources only every three years. EPA has
conditions can be stagnant. not yet released the 2002 inventoried data.
The combustion of fossil fuels to generate
electricity and power motor vehicles and
Figure 1. Emissions of Nitrogen Figure 2. Emissions of Volatile
Oxides by Source, 1999 Organic Compounds by Source,
1999
5% 9%
23% 29%
17%
22%
44%
33% 18%
Power plants
Highway vehicles (cars, trucks) Highway vehicles (cars, trucks)
Non-road engines (heavy equipment, trains) Non-road engines (heavy equipment, trains)
Other fuel combustion Industrial processes
All other Other
Danger in the Air 6agriculture, and coal and oil combustion
Fine Particle Pollution form coarse particles. Fine particles
generally are created through chemical
Solid particles and liquid droplets in the air processes in the atmosphere. Gases
are referred to as particle pollution. Some emitted from combustion sources, such as
particles are large enough to be seen as power plants and diesel engines, react with
dust or dirt; others are too small to be seen other gases and particles in the atmosphere
with the naked eye, though we see the to form complex toxic particles. The vast
haze that forms when particles obscure city majority of fine particles are formed
skylines or scenic vistas in our national through the reaction of sulfur dioxide (SO2),
parks. The smallest particles are of most NOx, and VOCs with ammonium and other
concern because they are so tiny that they compounds in the atmosphere. Sulfates,
can bypass the body’s natural defenses and which are formed from SO2, are the
lodge deep in the lungs and even pass into dominant form of fine particles east of the
the bloodstream.4 Mississippi.5 Power plants emit 67 percent
of U.S. SO2 emissions (see Figure 3).6
“Coarse” particles are between 2.5 and 10
microns in diameter; “fine” particles are less
than or equal to 2.5 microns in diameter.
For comparison, a single strand of human Figure 3. Sources of Sulfur
hair is about 75 microns in diameter. Dioxide, 1999
Fine particles are a complex mixture
generally composed of sulfate, nitrate, 33%
chloride, ammonium compounds, organic
carbon, elemental carbon, and metals. Fine
particles can remain in the atmosphere for
days to weeks and travel through the 67%
atmosphere far from their source.
Mechanical processes such as construction Power plants Other sources
and demolition, mining operations,
Danger in the Air 7Health Effects of Ozone and Fine Particles
Ozone Development of Asthma
Asthma is the most common chronic
Exposure to even very low levels of ozone disease among children.12 Between 1980
contributes to a wide range of adverse and 1996, the prevalence of asthma among
health effects.7 Ozone is a powerful oxidant children increased by an average of 4.3
that burns our lungs and airways, causing percent per year.13 A recent study of
them to become inflamed, reddened, and schoolchildren in Hartford, Connecticut
swollen. According to the American Lung found that 19 percent had asthma.14 While
Association, nearly half (47 percent) of all it is well documented that ozone triggers
Americans live in places with unhealthy asthma attacks, a recent study provides the
levels of ozone.8 Children, senior citizens, first evidence that ozone may increase
and people with respiratory disease are children’s risk of developing asthma. A
particularly vulnerable to the health effects 2002 study of more than 3,500 children in
of ozone. 12 communities in Southern California
found that children who played three or
Following a lengthy scientific review more sports in high ozone areas were three
process, in 1997 EPA tightened the national times more likely to be diagnosed with
ambient air quality standard for ozone.9 asthma for the first time compared with
Based on extensive evidence of the risks children who did not play sports. Sports
posed by ozone at lower concentrations and had no effect in areas of low ozone
over longer periods of exposure, EPA set concentration. In addition, the amount of
the new standard at 0.08 parts per million time the children spent outside was
(ppm) averaged over an eight-hour period. associated with a higher incidence of
The new “8-hour standard” is more asthma in areas of high ozone but not in
protective than the 1979 “1-hour standard” areas of low ozone.15
of 0.12 ppm averaged over one hour.
Hospital Admissions of Young Children
When EPA tightened the standard, the EPA concluded in 1997 that 10 to 20
agency concluded that, when inhaled even percent of all summertime respiratory-
at very low levels, ozone can cause chest related hospital visits in the Northeast U.S.
pain and cough, aggravate asthma, reduce are associated with ozone pollution.16
lung function, increase emergency room Research suggests that exposure to ozone
visits and hospital admissions for respiratory increases the risk that children under two
problems, and lead to irreversible lung years of age are hospitalized for acute
damage.10 respiratory diseases.17
Since 1997, more than 1,700 additional Birth Defects
studies on the health and environmental A 2002 study by UCLA researchers found
effects of ozone have been published in that women in four Southern California
peer-reviewed journals.11 These studies counties who were exposed to ozone in
point to additional, even more serious their second month of pregnancy had an
health effects associated with exposure to increased risk of giving birth to babies with
ozone, particularly in the following areas:
Danger in the Air 8serious heart defects, including aortic artery
and valve defects.18 California May Strengthen Its
Ozone Standard
Premature Mortality
Studies suggest that exposure to ozone is
associated with increased mortality. California is considering strengthening its air
Repeated ozone exposure, which causes an quality standard for ozone in response to
inflammatory response in the lungs, may mounting evidence that adverse health effects
cause elderly and other sensitive individuals result from ozone levels at or near the current
to become more susceptible to the adverse standard. California’s Children’s Environmental
Health Act requires the state to ensure that all
health effects of particle pollution and in
existing ambient air quality standards adequately
turn lead to premature death.19
protect infants, children, and other potentially
susceptible groups. In June 2004, the staff of
While high ozone concentrations pose the California Air Resources Board and Office of
pervasive health risks and may be even Environmental Health Hazard Assessment
more serious than previously believed, recommended that the state adopt an 8-hour
research demonstrates that declines in ozone standard of 0.070 ppm, not to be
ozone levels can reduce these effects. For exceeded, which would be substantially more
instance, during the 1996 Summer stringent than the federal standard. California’s
Olympics, officials closed downtown Atlanta 1-hour ozone standard of 0.090 ppm, not to be
exceeded, is already tighter than the federal 1-
to traffic and increased public transit, which
hour standard.
reduced ozone levels and significantly
lowered rates of acute care visits and The proposed standard is based on an extensive
hospitalizations for asthma among review of the scientific literature on the health
children.20 effects of exposure to ozone. The staff review
found that for sensitive groups such as children,
seniors, and people with respiratory diseases,
Fine Particle Pollution exposure to ozone concentrations of 0.080 ppm
over several hours leads to decreased lung
Fine particles are so small that they can function and signs of respiratory irritation such
bypass the body’s natural defenses and as coughing, wheezing, and painful breathing.
penetrate some of the most fragile parts of Healthy adults moderately exerting themselves
the lung, causing serious respiratory and for several hours, such as working outside when
cardiovascular problems. The American ozone concentrations are at 0.080 ppm,
experience similar health effects.
Heart Association recently concluded,
“Although exposure to ambient air pollution
California is taking public comments on the staff
poses smaller relative risks for incident report and is scheduled to finalize the new
cardiovascular disease than obesity or standard by the end of 2004.
tobacco smoking, because it is ubiquitous,
the absolute number of people affected is
enormous, and exposure occurs over an
entire lifetime.”21 According to the Source: California Environmental Protection Agency,
Air Resources Board and Office of Environmental
American Lung Association, one quarter of
Health and Hazard Assessment, “Review of the
Americans live in areas with unhealthy California Ambient Air Quality Standard for Ozone:
levels of fine particle pollution.22 A 2004 Volume 1, Public Review Draft,” 21 June 2004.
study by Abt Associates found that fine
particles from U.S. power plants alone
cause 554,000 asthma attacks, 38,200 non-
fatal heart attacks, and 23,600 premature
Danger in the Air 9deaths, including 2,800 from lung cancer, benefits of meeting the standard would be
every year.23 Senior citizens, people with even greater.25
heart and lung diseases, and children are
most vulnerable to particle pollution. Since 1997, scientists have published more
than 2,000 peer-reviewed studies on the
adverse health effects of particle pollution,
Although exposure to ambient air confirming previous studies on the
pollution poses smaller relative risks for relationship between particle pollution and
incident cardiovascular disease than illness and death and shedding light on why
obesity or tobacco smoking, because it particle pollution is so damaging.26 In
is ubiquitous, the absolute number of particular, researchers now believe that
people affected is enormous, and most deaths attributable to particle pollution
exposure occurs over an entire lifetime. result from cardiopulmonary rather than
respiratory disease. Two landmark studies
- American Heart Association
highlight these recent developments as
follows:
After an extensive scientific review process,
Lung Cancer Deaths
in 1997 EPA established the first national
In the largest study to date on the long-
ambient air quality standards for fine
term health effects of air pollution, a 2002
particles. EPA concluded that exposure to
study found that long-term exposure to fine
fine particles is associated with premature
particle pollution increases the risk of dying
death, increased hospital admissions and
from lung cancer and heart disease. Over
emergency room visits, increased
many years, the danger is comparable to
respiratory symptoms and disease, and
the health risks associated with long-term
decreased lung function. Both short-term
exposure to second-hand smoke. The study
(few hours or days) and chronic exposure to
is a follow up to the landmark 1995
particle pollution are associated with illness
American Cancer Society study, which
and death. In order to protect against both
helped to establish the link between long-
short- and long-term exposure, EPA set 24-
term particle exposure and premature
hour and annual standards for fine particles
death. The new study expands the
of 65 micrograms per cubic meter (µg/c3)
previous work by analyzing data from
and 15 µg/c3, respectively.24
500,000 adults who were followed from
1982 to 1998 and lived in all 50 states.
At the time, EPA estimated that meeting the
Cause of death was linked to air pollution
fine particle standards would prevent, on an
levels for cities nationwide, while controlling
annual basis, at least 15,000 premature
for factors such as smoking status and diet.
deaths, 75,000 cases of chronic bronchitis,
The researchers concluded that lung cancer
10,000 hospital admissions for respiratory
deaths increase by 8 percent for every
and cardiovascular diseases, 20,000 cases
increase of 10 micrograms of fine particles
of acute bronchitis, hundreds of thousands
per cubic meter of air. The relationship
of occurrences of aggravated asthma, and
between fine particles and adverse health
3.1 million days when people miss work
effects was linear and without a discernible
because they are suffering from particle-
lower “safe” threshold.27
related symptoms. With more recent
studies linking fine particle exposure to
Heart Disease
premature death, infant mortality, and non-
A 2004 study – also an extension of the
fatal heart attacks, EPA now says that the
1995 American Cancer Society study –
Danger in the Air 10found that long-term fine particle exposure fell markedly following the ban, with
increased the risk of dying from ischemic researchers concluding that “control of
heart disease (heart failure resulting from particulate air pollution in Dublin led to an
decreased oxygen supply to the heart immediate reduction in cardiovascular and
muscle), arrhythmias, heart failure, and respiratory deaths.”31
cardiac arrest. Previous studies linked long-
term fine particle exposure to
cardiopulmonary mortality but not to Code Orange, Red, and Purple
specific diseases.28 Remarkably, EPA
estimates that particle pollution takes an for Ozone and Fine Particles
average of 14 years off the lives of people
who die prematurely from particle Newspaper, television, and radio weather
exposure.29 reports provide information about local air
quality using warnings such as “code red”
With studies indicating that adverse days, which are based on EPA’s Air Quality
cardiovascular and respiratory effects occur Index (AQI). The AQI divides ambient air
even when levels are well below current pollution levels into color categories,
standards, the American Heart Association, including green (good), yellow (moderate),
American Lung Association, and other orange (unhealthy for sensitive groups), red
medical and public health organizations (unhealthy), and purple (very unhealthy),
have called on EPA to strengthen the and describes actions people should take at
national health standards for fine particles.30 each pollution level to protect their health.32
For instance, on code red days for ozone,
As with ozone, evidence suggests that EPA warns everyone to limit outdoor
reducing particle pollution would greatly and activities and sensitive groups (active
rapidly improve public health. For instance, children and adults and people with
air quality in Dublin, Ireland deteriorated in respiratory disease) to avoid outdoor
the 1980s after a switch from oil to coal for activities altogether.
domestic heating. In 1990, the Irish
Government banned the marketing, sale, Tables 1 and 2 provide additional
and distribution of coal within Dublin. information on the AQI for ozone and fine
Respiratory and cardiovascular death rates particles.
Table 1. EPA’s Air Quality Index for Ozone33
8-Hour Ozone
Concentration Level of Health
(parts per million) Concern EPA’s Cautionary Statement
0.000–0.064 Good (Green) None.
Unusually sensitive people should consider limiting prolonged
0.065–0.084 Moderate (Yellow) outdoor exertion.
Unhealthy for sensitive Active children and adults and people with respiratory diseases
0.085–0.104 groups (Orange) such as asthma should limit prolonged outdoor exertion.
Active children and adults and people with respiratory diseases
such as asthma should avoid prolonged outdoor exertion;
everyone else, especially children, should limit prolonged outdoor
0.105–0.124 Unhealthy (Red) exertion.
Active children and adults and people with respiratory diseases
such as asthma should avoid all outdoor exertion; everyone else,
0.125–0.374 Very unhealthy (Purple) especially children, should limit outdoor exertion.
Danger in the Air 11Table 2. EPA’s Air Quality Index for Fine Particles34
24-Hour Fine
Particle
Concentration
(micrograms per Level of Health
cubic meter) Concern EPA’s Cautionary Statement
0.0–15.4 Good (Green) None.
Unusually sensitive people should consider reducing prolonged
15.5–40.4 Moderate (Yellow) or heavy outdoor exertion.
Unhealthy for
sensitive groups People with heart or lung disease, older adults, and children
40.5–65.4 (Orange) should reduce prolonged or heavy outdoor exertion.
People with heart or lung disease, older adults, and children
should avoid prolonged or heavy outdoor exertion. Everyone
65.5–150.4 Unhealthy (Red) else should reduce prolonged or heavy outdoor exertion.
People with heart or lung disease, older adults, and children
Very unhealthy should avoid all physical activity outdoors. Everyone else
150.5–250.4 (Purple) should avoid prolonged or heavy outdoor exertion.
Danger in the Air 12Trends in Ozone and Fine Particle Pollution
1990s, 8-hour ozone levels declined
Ozone nationally by only nine percent, showing a
leveling of progress. The West Coast and
Of the six most common and widespread air the Northeast have improved the most since
pollutants, including nitrogen dioxide, 1990 with decreases of at least 10 percent,
ground-level ozone, sulfur dioxide, but the South and Midwest have
particulate matter, carbon monoxide, and experienced very little change in ozone
lead, we have made the least progress levels, with no net change in the region
reducing ozone.35 Since 1980, 8-hour encompassing Iowa, Kansas, Missouri, and
ozone levels have decreased by 21 percent Nebraska (see Figure 5).37
nationally (see Figure 4).36 However, in the
Figure 4. Trend in 8-Hour Ozone Levels Averaged Across EPA Regions, 1980–200338
Figure 5. Trend in 8-Hour Ozone Levels Averaged Across EPA Regions, 1990–200339
Danger in the Air 13Lower levels of ozone do not necessarily that because this analysis is based on a
mean that we have succeeded in reducing limited number of cities per region, the
air pollution. Heat and sunlight are vital to regional trends cannot be compared directly
convert NOx and VOCs into ozone. As a to the trends in Figure 5. Before adjusting
result, weather conditions play a large role for weather, ozone levels increased in three
in the amount of ground-level ozone on any regions and declined in four regions. When
given day. During cool, wet summers, such weather is taken into account, all regions
as that which occurred in 2003, ozone levels experienced a smaller decline or an increase
tend to be lower. During hot, dry summers, in ozone levels during the 1990s. Region 4,
ozone levels tend to rise, as occurred in which includes Alabama, Florida, Georgia,
2002, which was by far the worst ozone Kentucky, Mississippi, North Carolina, South
season in recent years.40 Carolina, and Tennessee, was most affected
by weather, with a 21 percent decline in
Figure 6 shows ozone trends for 35 cities in ozone levels reduced to a mere 4 percent
the eastern half of the U.S. from 1990 to decrease after taking weather out of the
2003 adjusted for the effects of weather equation.41
compared to the unadjusted trends. Note
Figure 6. Meteorologically Adjusted and Unadjusted Ozone Levels by EPA Region,
1990–200342
Danger in the Air 14standards. Moreover, in the April 2004 final
Fine Particle Pollution draft of its revised monitoring strategy, EPA
proposed reducing the number of both fine
EPA and the states did not establish a fine particle and ozone monitors as part of a
particle-monitoring network until 1999, “common sense initiative.”44 The program
which limits our analysis of recent trends. would reduce particle-monitoring sites by
From 1999 to 2002, annual average fine approximately 35 percent, though the sites
particle levels dropped by 8 percent.43 were only established in the late
1990s. This strategy would undermine EPA
However, as shown in Figure 7, there are and the states’ ability to protect public
significant gaps in the nation’s network of health from unhealthy levels of fine particle
fine particle monitors. Where data are pollution.
unavailable, EPA basically assumes the
areas are complying with the health
Figure 7. Location of Fine Particle Pollution Monitoring Stations, 200445
Danger in the Air 15Failing to Meet Health Standards
EPA establishes health-based air quality ozone nonattainment areas need to follow
standards for the six criteria pollutants, to meet the health standard. Unfortunately,
including ozone and fine particles, and the rule eliminates many of the mandatory
identifies areas that fail to meet the control measures prescribed by Congress in
standards as “nonattainment” areas. 1990. The rule actually weakens existing
Nonattainment areas must take certain cleanup requirements in some of the
steps to clean up their air and meet the nation’s most polluted cities, gives some
standards, as determined by Congress and areas too much time to clean up, and
EPA. requires too few benchmarks be met along
the way. As a result, public health and
environmental groups challenged the weak
rule in federal court in June 2004; the case
Ozone is pending.50
In April 2004, EPA determined that 474
counties violate or contribute to violations
‘Pristine’ Parks Fail to Meet National
of the 8-hour health-based ozone standard.
Health Standards
These counties – from large metropolitan
areas like Los Angeles and Washington, Ozone levels in national parks can rival or
D.C. to suburban and even rural areas like exceed those of the nation’s most polluted cities.
Lake County, Illinois, whose 470 square In April 2004, EPA determined that pollution
miles stretch from the Chicago suburbs to levels in seven national parks and the Cape Cod
Wisconsin, and Christian County, a largely National Seashore fail to meet the 8-hour
agricultural area in southwest Kentucky – national health standard for ozone. The parks
are home to nearly 160 million people.46 include the Great Smoky Mountains National
These nonattainment areas must submit Park in North Carolina and Tennessee, Acadia
plans to EPA in April 2007 as to how they National Park in Maine, Shenandoah National
Park in Virginia, Rocky Mountain National Park in
will meet the ozone standard by 2007-2021,
Colorado, and California’s Yosemite, Sequoia-
depending on the severity of their ozone Kings Canyon, and Joshua Tree National Parks.
pollution.47
In addition, 237 counties – home to 111 Source: National Parks Conservation Association,
million Americans – continue to violate the “Code Red: America’s Five Most Polluted National
1-hour ozone standard.48 Even though the Parks,” June 2004.
1-hour standard is designed to protect
against dangerous spikes in ozone, EPA
plans to revoke the standard in 2005. This
means that some areas of the country Fine Particle Pollution
classified as attaining the 8-hour ozone
standard will still experience unhealthy
EPA is in the process of determining which
short-term levels of ozone yet will not have
areas fail to meet the health-based air
to take action to reduce pollution.49
quality standards for fine particles. In
February 2004, states made their
Also in April 2004 EPA finalized a rule
detailing the steps and timetable 8-hour
Danger in the Air 16recommendations to EPA. In June 2004, 2010-2015, depending on the severity of
EPA released its own recommendations.51 their particle pollution.53
The EPA list is more thorough than the EPA has yet to propose a rule detailing the
states’ lists, encompassing 244 full and steps fine particle nonattainment areas will
partial counties, with a combined population have to take to meet the health standard.54
of 99 million people, as opposed to the EPA’s recent 8-hour ozone implementation
states’ recommendations of 142 full and rule, which falls far short of what is needed
partial counties covering 79 million people.52 to protect public health, should not be the
While the EPA list is more complete, it model the administration follows. EPA
excludes several areas that fail to meet the should propose and finalize a strong rule to
standards. EPA is scheduled to finalize the bring these areas into compliance with the
designations in November 2004, and health standards by the end of the decade,
nonattainment areas are slated to submit as the Clean Air Act requires.
plans to EPA in February 2008 as to how
they will meet the fine particle standard by
Danger in the Air 17Report Findings: 2003 Air Quality
This report examines ozone and fine particle 2002 was a hot and dry summer –
levels in 2003 from the nation’s networks of conditions that are more conducive to
1,197 ozone and 924 fine particle air quality ozone formation – leading to record ozone
monitors, as reported by the states and the levels. However, 8-hour and/or 1-hour
District of Columbia. ozone levels were higher in 2003 than in
2002 in 13 states, including California,
The report looks at exceedances of the 8- Colorado, Florida, Kansas, Louisiana,
hour and 1-hour national health standards Michigan, Mississippi, Missouri, Nevada,
for ozone and the year-round and 24-hour New Mexico, Oklahoma, Texas, and
national health standards for fine particles. Washington. In Colorado, the number of
Because metropolitan areas differ in their exceedances of the 8-hour and 1-hour
number of air quality monitors, we also look health standards increased eight-fold over
at the number of smog and soot days, or 2002; Colorado exceeded the 8-hour
days on which at least one air quality standard eight times in 2002, whereas the
monitor in a given area exceeds the 8-hour state exceeded the standard 60 times in
or 1-hour ozone health standard or the 24- 2003. Colorado ranked fourth in 2003 for
hour fine particle health standard, the number of smog days (22), surpassed
respectively. In order to compare cities of only by California, Texas, and Louisiana.
similar sizes, we divide metropolitan areas
into three categories, including large Appendix A compares ozone exceedances
metropolitan areas with populations above by state from 2001 to 2003. Appendix B
1 million, mid-sized metropolitan areas with details the number of smog days
populations between 250,000 and 1 million, experienced by each state in 2003.
and small metropolitan areas with
populations under 250,000. Bakersfield, California was the nation’s most
ozone-polluted city in 2003, with 116 smog
days. Ozone levels in the city exceeded the
8-hour national health standard 374 times
Ozone and the 1-hour health standard 29 times.
With a population of 660,000, Bakersfield is
Ozone levels exceeded the 8-hour national a mid-sized city.
health standard 4,583 times in 2003. These
high ozone levels occurred in 40 states and Of large metropolitan areas, or those with
the District of Columbia on 187 different populations over 1 million people, Riverside-
days from March to October. In addition, San Bernardino-Ontario (CA), Los-Angeles-
ozone levels exceeded the 1-hour national Long Beach-Santa Ana (CA), Houston-
health standard 684 times in 2003. Ten Baytown-Sugar Land (TX), Sacramento-
states did not record any unhealthy levels of Arden Arcade-Roseville (CA), Dallas-Fort
ozone in 2003, including Alaska, Hawaii, Worth-Arlington (TX), Philadelphia-Camden-
Idaho, Montana, Nebraska, North Dakota, Wilmington (PA-NJ-DE), New York-Northern
Oregon, South Dakota, Vermont, and New Jersey-Long Island (NY-NJ-PA), Kansas
Wyoming. City (MO-KS), Providence-New Bedford-Fall
River (RI-MA), and St. Louis (MO-IL)
Nationally, ozone levels in 2003 were similar suffered the worst ozone problems in 2003
to those in 2000 and 2001. In contrast, (see Table 3). In Riverside-San Bernardino-
Danger in the Air 18Ontario, ozone levels exceeded the 8-hour and ozone exceedances by mid-sized
health standard 675 times and the 1-hour metropolitan area.
health standard 211 times on 103 different
days. The full list of smog days and ozone Merced, California was the most ozone-
exceedances in large metropolitan areas is polluted small city in 2003 (see Table 5).
available in Appendix C. With 54 smog days, Merced far exceeded
any other small city for its ozone pollution.
Among mid-sized cities, or those with In addition to Merced and California’s
populations between 250,000 to 1 million Truckee-Grass Valley, Hanford-Corcoran,
people, California’s Bakersfield, Fresno, Madera, El Centro, Chico, and Phoenix
Visalia-Porterville, Oxnard-Thousand Oaks- Lake-Cedar Ridge metropolitan areas,
Ventura, and Modesto suffered the worst Barnstable Town (MA), Salisbury (NC),
ozone problems in 2003 (see Table 4). Allegan (MI), Gulfport-Biloxi (MS), Traverse
Baton Rouge (LA), Bridgeport-Stamford- City (MI), Watertown-Fort Drum (NY), and
Norwalk (CT), Huntington-Ashland (WV-KY- Wilmington (OH) suffered the worst ozone
OH), Knoxville (TN), New Haven-Milford problems among small cities in 2003. The
(CT), and Youngstown-Warren-Boardman full list of smog days and ozone
(OH-PA) also topped the list. Ozone levels exceedances in small metropolitan areas is
in many of these mid-sized cities rivaled available in Appendix E.
those of the nation’s largest metropolitan
areas. For example, central California’s An additional 141 8-hour and five 1-hour
Visalia-Porterville metropolitan area, with a ozone exceedances occurred at air monitors
population of 368,000, had more smog days not located in metropolitan areas, including
(92) than the Los Angeles-Long Beach- at Yosemite National Park in California,
Santa Ana metropolitan area (88), which Shenandoah National Park in Virginia,
has a population of 12.4 million. See Acadia National Park in Maine, and Seney
Appendix D for the full list of smog days National Wildlife Refuge in Michigan (see
Table 6).
Table 3. 15 Most Ozone-Polluted Large Metropolitan Areas, 2003
Number Exceedances of Exceedances of
of Smog 8-Hour Ozone 1-Hour Ozone
Rank Metropolitan Statistical Area Population Days Health Standard Health Standard
1 Riverside-San Bernardino-Ontario, CA 3,254,821 103 675 211
2 Los Angeles-Long Beach-Santa Ana, CA 12,365,627 88 302 120
3 Houston-Baytown-Sugar Land, TX 4,715,407 47 257 119
4 Sacramento-Arden-Arcade-Roseville, CA 1,796,857 43 141 12
5 Dallas-Fort Worth-Arlington, TX 5,161,544 31 122 6
6 Philadelphia-Camden-Wilmington, PA-NJ-DE 5,687,147 29 64 5
7 New York-Northern New Jersey-Long Island, NY-NJ-PA 18,323,002 21 71 11
8 Kansas City, MO-KS 1,836,038 18 32 0
8 Providence-New Bedford-Fall River, RI-MA 1,582,997 18 21 2
8 St. Louis, MO-IL 2,698,687 18 66 9
11 Cincinnati-Middletown, OH-KY-IN 2,009,632 17 43 2
11 Denver-Aurora, CO 2,179,240 17 48 6
13 Washington-Arlington-Alexandria, DC-VA-MD 4,796,183 16 64 8
14 Atlanta-Sandy Springs-Marietta, GA 4,247,981 13 28 3
14 Chicago-Naperville-Joliet, IL-IN-WI 9,098,316 13 29 0
Danger in the Air 19Table 4. 15 Most Ozone-Polluted Mid-Sized Metropolitan Areas, 2003
Number Exceedances of Exceedances of
of Smog 8-Hour Ozone 1-Hour Ozone
Rank Metropolitan Statistical Area Population Days Health Standard Health Standard
1 Bakersfield, CA 661,645 116 374 29
2 Fresno, CA 799,407 97 283 26
3 Visalia-Porterville, CA 368,021 92 198 3
4 Oxnard-Thousand Oaks-Ventura, CA 753,197 31 61 2
5 Baton Rouge, LA 705,973 21 56 12
6 Modesto, CA 446,997 18 19 0
7 Bridgeport-Stamford-Norwalk, CT 882,567 11 25 11
7 Huntington-Ashland, WV-KY-OH 288,649 11 12 0
7 Knoxville, TN 616,079 11 20 0
7 New Haven-Milford, CT 824,008 11 16 4
7 Youngstown-Warren-Boardman, OH-PA 602,964 11 19 2
12 Beaumont-Port Arthur, TX 385,090 10 23 2
13 Tulsa, OK 859,532 9 14 0
14 Dayton, OH 848,153 8 16 4
14 Fort Collins-Loveland, CO 251,494 8 8 0
Table 5. 21 Most Ozone-Polluted Small Metropolitan Areas, 2003
Number Exceedances of Exceedances of
of Smog 8-Hour Ozone 1-Hour Ozone
Rank Metropolitan Statistical Area Population Days Health Standard Health Standard
1 Merced, CA 210,554 54 54 0
2 Truckee-Grass Valley, CA 92,033 23 31 0
3 Hanford-Corcoran, CA 129,461 15 15 0
4 Madera, CA 123,109 14 14 0
5 El Centro, CA 142,361 11 9 3
6 Barnstable Town, MA 222,230 8 8 0
6 Chico, CA 203,171 8 8 0
6 Salisbury, NC 130,340 8 12 3
9 Allegan, MI 105,665 7 7 0
9 Gulfport-Biloxi, MS 246,190 7 17 0
9 Phoenix Lake-Cedar Ridge, CA 54,501 7 7 0
9 Traverse City, MI 131,342 7 7 0
9 Watertown-Fort Drum, NY 111,738 7 7 0
9 Wilmington, OH 40,543 7 7 0
15 Holland-Grand Haven, MI 238,314 6 6 0
15 Jamestown-Dunkirk-Fredonia, NY 139,750 6 10 2
15 Manitowoc, WI 82,887 6 8 1
15 Niles-Benton Harbor, MI 162,453 6 6 0
15 Redding, CA 163,256 6 6 0
15 Vineland-Millville-Bridgeton, NJ 146,438 6 6 1
15 Yuba City-Marysville, CA 139,149 6 6 0
Danger in the Air 20Table 6. Exceedances of Ozone Health Standards at Parks and Other Areas
Not Located in Metropolitan Areas, 2003
Exceedances of Exceedances of
8-Hour Ozone 1-Hour Ozone
Area Health Standard Health Standard
Ashland, AL 1 0
Jerseydale, CA 27 1
San Andreas, CA 18 0
Yosemite National Park, CA 10 1
Jackson, CA 2 0
Bonifay, FL 1 0
Keosauqua, IA 1 0
Brownstown, IN 1 0
Grayson Lake, KY 1 0
St. James Parish, LA 1 0
Millington, MD 4 1
Acadia National Park, ME 7 0
Huron County, MI 5 0
Scottsville, MI 4 0
Seney National Wildlife Refuge, MI 2 1
Onamia, MN 1 0
Bonne Terre, MO 3 0
Mark Twain State Park, MO 1 0
Granville County, NC 5 0
Reidsville, NC 3 0
Martin County, NC 2 0
Yancey County, NC 1 0
Jackson County, NC 1 0
Essex County, NY 8 0
Arrietta, NY 2 0
Walters, OK 1 0
Tishomingo, OK 1 0
Tioga County, PA 3 0
Greene County, PA 3 0
McBee, SC 1 0
Due West, SC 1 0
Roundtop, TX 2 0
Shenandoah National Park, VA 6 0
Luray, VA 3 0
Wythe County, VA 2 0
Ellison Bay, WI 5 1
Greenbrier County, WV 1 0
Danger in the Air 21Code Purple, Very Unhealthy Ozone Baltimore’s only very unhealthy reading, 43
Levels of the 79 very unhealthy concentrations
occurred in the Riverside-San Bernardino-
Nationwide, ozone levels reached EPA’s Ontario metropolitan area. Another 15
“very unhealthy” range (0.125-0.374 ppm) occurred elsewhere in California, with 14 in
79 times in 2003 (see Table 7). When the Los Angeles-Long Beach-Santa Ana
ozone levels are very unhealthy, EPA warns metropolitan area and one in Bakersfield.
everyone to limit outdoor activities and
sensitive populations, including children, to Air quality monitors in the Houston-
avoid outdoor activities altogether. Baytown-Sugar Land, Texas metropolitan
area recorded six very unhealthy ozone
The Baltimore-Towson, Maryland and exceedances; Columbus, Ohio recorded
Riverside-San Bernardino-Ontario, California four; the Washington-Arlington-Alexandria
metropolitan areas tied for the highest 8- metropolitan area recorded three; and the
hour ozone concentration in 2003 with New York-Northern New Jersey-Long Island
recorded values of 0.153 ppm, or almost metropolitan area had two very unhealthy
double the health standard. While this was readings.
Danger in the Air 22Table 7. Very Unhealthy 8-Hour Ozone Exceedances, 2003
Very Unhealthy
Exceedances of 8-
Hour Ozone
Rank Date Metropolitan Statistical Area Standard (ppm)
1 6/26/03 Baltimore-Towson, MD 0.153
1 8/17/03 Riverside-San Bernardino-Ontario, CA 0.153
3 7/14/03 Los Angeles-Long Beach-Santa Ana, CA 0.152
4 7/13/03 Riverside-San Bernardino-Ontario, CA 0.148
5 7/9/03 Riverside-San Bernardino-Ontario, CA 0.146
5 7/10/03 Riverside-San Bernardino-Ontario, CA 0.146
7 8/17/03 Riverside-San Bernardino-Ontario, CA 0.145
8 7/5/03 Riverside-San Bernardino-Ontario, CA 0.144
9 6/28/03 Riverside-San Bernardino-Ontario, CA 0.142
10 8/24/03 Houston-Baytown-Sugar Land, TX 0.141
10 6/29/03 Riverside-San Bernardino-Ontario, CA 0.141
12 7/10/03 Los Angeles-Long Beach-Santa Ana, CA 0.140
12 7/11/03 Los Angeles-Long Beach-Santa Ana, CA 0.140
12 8/17/03 Riverside-San Bernardino-Ontario, CA 0.140
15 7/5/03 Riverside-San Bernardino-Ontario, CA 0.138
16 7/9/03 Los Angeles-Long Beach-Santa Ana, CA 0.137
16 7/10/03 Riverside-San Bernardino-Ontario, CA 0.137
16 5/28/03 Riverside-San Bernardino-Ontario, CA 0.137
16 8/17/03 Riverside-San Bernardino-Ontario, CA 0.137
16 7/14/03 Riverside-San Bernardino-Ontario, CA 0.137
21 6/26/03 Lancaster, PA 0.135
21 8/31/03 Los Angeles-Long Beach-Santa Ana, CA 0.135
21 7/13/03 Riverside-San Bernardino-Ontario, CA 0.135
21 7/13/03 Riverside-San Bernardino-Ontario, CA 0.135
25 7/13/03 Los Angeles-Long Beach-Santa Ana, CA 0.134
25 7/13/03 Riverside-San Bernardino-Ontario, CA 0.134
27 7/13/03 Los Angeles-Long Beach-Santa Ana, CA 0.133
27 7/17/03 Los Angeles-Long Beach-Santa Ana, CA 0.133
27 7/10/03 Riverside-San Bernardino-Ontario, CA 0.133
27 9/27/03 Riverside-San Bernardino-Ontario, CA 0.133
31 6/28/03 Riverside-San Bernardino-Ontario, CA 0.132
31 7/10/03 Riverside-San Bernardino-Ontario, CA 0.132
33 6/25/03 New York-Northern New Jersey-Long Island, NY-NJ-PA 0.131
33 6/26/03 Philadelphia-Camden-Wilmington, PA-NJ-DE 0.131
35 5/31/03 Dallas-Fort Worth-Arlington, TX 0.130
35 8/23/03 Houston-Baytown-Sugar Land, TX 0.130
35 7/5/03 Riverside-San Bernardino-Ontario, CA 0.130
35 5/28/03 Riverside-San Bernardino-Ontario, CA 0.130
35 7/11/03 Riverside-San Bernardino-Ontario, CA 0.130
35 6/25/03 Washington-Arlington-Alexandria, DC-VA-MD 0.130
41 6/24/03 Columbus, OH 0.129
41 8/22/03 Houston-Baytown-Sugar Land, TX 0.129
41 8/22/03 Houston-Baytown-Sugar Land, TX 0.129
41 6/15/03 Riverside-San Bernardino-Ontario, CA 0.129
Danger in the Air 23Very Unhealthy
Exceedances of 8-
Hour Ozone
Rank Date Metropolitan Statistical Area Standard (ppm)
41 8/17/03 Riverside-San Bernardino-Ontario, CA 0.129
41 8/31/03 Riverside-San Bernardino-Ontario, CA 0.129
47 6/26/03 New York-Northern New Jersey-Long Island, NY-NJ-PA 0.128
47 7/10/03 Riverside-San Bernardino-Ontario, CA 0.128
47 6/15/03 Riverside-San Bernardino-Ontario, CA 0.128
50 5/28/03 Bakersfield, CA 0.127
50 7/10/03 Los Angeles-Long Beach-Santa Ana, CA 0.127
50 7/14/03 Riverside-San Bernardino-Ontario, CA 0.127
50 6/28/03 Riverside-San Bernardino-Ontario, CA 0.127
50 7/8/03 Riverside-San Bernardino-Ontario, CA 0.127
50 6/29/03 Riverside-San Bernardino-Ontario, CA 0.127
56 6/24/03 Columbus, OH 0.126
56 5/29/03 Houston-Baytown-Sugar Land, TX 0.126
56 9/8/03 Houston-Baytown-Sugar Land, TX 0.126
56 7/5/03 Los Angeles-Long Beach-Santa Ana, CA 0.126
56 9/28/03 Los Angeles-Long Beach-Santa Ana, CA 0.126
56 6/25/03 Parkersburg-Marietta, WV-OH 0.126
56 6/14/03 Riverside-San Bernardino-Ontario, CA 0.126
56 7/9/03 Riverside-San Bernardino-Ontario, CA 0.126
56 7/11/03 Riverside-San Bernardino-Ontario, CA 0.126
56 9/14/03 Riverside-San Bernardino-Ontario, CA 0.126
56 6/14/03 Riverside-San Bernardino-Ontario, CA 0.126
56 6/26/03 Washington-Arlington-Alexandria, DC-VA-MD 0.126
68 6/25/03 Bridgeport-Stamford-Norwalk, CT 0.125
68 6/24/03 Columbus, OH 0.125
68 6/24/03 Columbus, OH 0.125
68 8/31/03 Los Angeles-Long Beach-Santa Ana, CA 0.125
68 6/1/03 Los Angeles-Long Beach-Santa Ana, CA 0.125
68 8/17/03 Los Angeles-Long Beach-Santa Ana, CA 0.125
68 9/21/03 Riverside-San Bernardino-Ontario, CA 0.125
68 7/14/03 Riverside-San Bernardino-Ontario, CA 0.125
68 8/17/03 Riverside-San Bernardino-Ontario, CA 0.125
68 6/29/03 Riverside-San Bernardino-Ontario, CA 0.125
68 6/28/03 Riverside-San Bernardino-Ontario, CA 0.125
68 6/25/03 Washington-Arlington-Alexandria, DC-VA-MD 0.125
Note: Each metropolitan area has more than one ozone monitor.
Danger in the Air 24In addition to the Riverside-San Bernardino-
Fine Particle Pollution Ontario metropolitan area, other large
metropolitan areas, or those with
Although particle pollution is not as populations over 1 million people, with the
pervasive as ozone pollution, elevated levels highest year-round particle pollution in 2003
of short-term or year-round particle included Los Angeles-Long Beach-Santa Ana
pollution can have a deadly impact. In (CA), Detroit-Warren-Livonia (MI), New
2003, fine particle monitors in 53 York-Northern New Jersey-Long Island (NY-
metropolitan areas in 20 states exceeded NJ-PA), Pittsburgh (PA), Cleveland-Elyria-
the year-round national health standard. In Mentor (OH), St. Louis (MO-IL), Atlanta-
these areas, fine particle levels were Sandy Springs-Marietta (GA), Indianapolis
chronically high. In addition, fine particle (IN), and Chicago-Naperville-Joliet (IL-IN-
pollution spiked above the 24-hour national WI). See Table 8 for the full list of large
health standard 106 times in 13 states in metropolitan areas that exceeded the
2003. These dangerous, short-term spikes annual health standard for fine particles in
occurred on 39 different days from January 2003.
to December. Unfortunately, research
clearly indicates that current fine particle Among mid-sized cities, or those with
standards fail to adequately protect public populations between 250,000 to 1 million
health, meaning that the problem is even people, Dayton, Ohio experienced the
worse than these data suggest.55 highest year-round particle pollution in 2003
(see Table 9). Also topping the list were
Twenty-four states did not exceed the year- the Bakersfield (CA), El Paso (TX), Fresno
round or short-term fine particle standards; (CA), Visalia-Porterville (CA), Lancaster
these states include Alaska, Arkansas, (PA), York-Hanover (PA), Canton-Massillon
Arizona, Colorado, Florida, Hawaii, Iowa, (OH), New Haven-Milford (CT), and
Idaho, Kansas, Louisiana, Massachusetts, Chattanooga (TN-GA) metropolitan areas.
Maine, Minnesota, Nebraska, New
Hampshire, North Dakota, South Carolina, The Weirton-Steubenville, West Virginia-
South Dakota, Utah, Virginia, Vermont, Ohio metropolitan area suffered the worst
Washington, Wisconsin, and Wyoming. year-round particle pollution among small
cities, or those with populations under
The Riverside-San Bernardino-Ontario, 250,000 people (see Table 10). The other
California metropolitan area suffered the small metropolitan areas with year-round
worst year-round particle pollution of any fine particle pollution above the health
metropolitan area in 2003. The maximum standard in 2003 were Monroe (MI),
average year-round value in the area Hanford-Corcoran (CA), Hagerstown-
exceeded the standard by nearly 10 µg/c3. Martinsburg (MD-WV), Rome (GA), Merced
Long-term exposure to fine particle (CA), Jasper (IN), Johnstown (PA),
pollution at levels well below 15 µg/c3, the Talladega-Sylacauga (AL), Wheeling (WV-
value of the current standard, is associated OH), Lexington-Thomasville (NC), Laurel
with an increased risk of premature death.56 (MS), and Point Pleasant (WV-OH).
Danger in the Air 25Table 8. Large Metropolitan Areas Plagued by Year-Round Particle Pollution, 2003
Maximum Average
Year-Round Fine
Particle Value
(micrograms per
Rank Metropolitan Statistical Area Population cubic meter)
1 Riverside-San Bernardino-Ontario, CA 3,254,821 24.8
2 Los Angeles-Long Beach-Santa Ana, CA 12,365,627 22.1
3 Detroit-Warren-Livonia, MI 4,452,557 21.1
4 New York-Northern New Jersey-Long Island, NY-NJ-PA 18,323,002 20.3
5 Pittsburgh, PA 2,431,087 20.2
6 Cleveland-Elyria-Mentor, OH 2,148,143 18.6
7 St. Louis, MO-IL 2,698,687 18.1
8 Atlanta-Sandy Springs-Marietta, GA 4,247,981 17.6
9 Indianapolis, IN 1,525,104 17.5
10 Chicago-Naperville-Joliet, IL-IN-WI 9,098,316 17.4
11 Cincinnati-Middletown, OH-KY-IN 2,009,632 17.3
12 Baltimore-Towson, MD 2,552,994 16.8
13 Birmingham-Hoover, AL 1,052,238 16.6
13 Philadelphia-Camden-Wilmington, PA-NJ-DE 5,687,147 16.6
15 Columbus, OH 1,612,694 16.4
16 Louisville, KY-IN 1,161,975 15.7
17 San Diego-Carlsbad-San Marcos, CA 2,813,833 15.5
18 Buffalo-Niagara Falls, NY 1,170,111 15.1
Table 9. Mid-Sized Metropolitan Areas Plagued by Year-Round Particle Pollution, 2003
Maximum Average
Year-Round Fine
Particle Value
(micrograms per
Rank Metropolitan Statistical Area Population cubic meter)
1 Dayton, OH 848,153 19.9
2 Bakersfield, CA 661,645 19.7
3 El Paso, TX 679,622 19.5
4 Fresno, CA 799,407 18.5
5 Visalia-Porterville, CA 368,021 18.2
6 Lancaster, PA 470,658 17.6
7 York-Hanover, PA 381,751 17.4
8 Canton-Massillon, OH 406,934 17.1
9 New Haven-Milford, CT 824,008 17.0
10 Chattanooga, TN-GA 476,531 16.5
11 Harrisburg-Carlisle, PA 509,074 16.2
12 Reading, PA 373,638 16.1
12 Charleston, WV 309,635 16.1
14 Knoxville, TN 616,079 16.0
15 Lexington-Fayette, KY 408,326 15.6
16 Huntington-Ashland, WV-KY-OH 288,649 15.5
17 Akron, OH 694,960 15.4
17 Columbus, GA-AL 281,768 15.4
19 Evansville, IN-KY 342,815 15.3
20 Ann Arbor, MI 322,895 15.2
21 Hickory-Morganton-Lenoir, NC 341,851 15.04
22 Allentown-Bethlehem-Easton, PA-NJ 740,395 15.02
Danger in the Air 26Table 10. Small Metropolitan Areas Plagued by Year-Round Particle Pollution, 2003
Maximum Average Year-
Round Fine Particle Value
Rank Metropolitan Statistical Area Population (micrograms per cubic meter)
1 Weirton-Steubenville, WV-OH 132,008 17.7
2 Monroe, MI 145,945 17.0
3 Hanford-Corcoran, CA 129,461 16.3
4 Hagerstown-Martinsburg, MD-WV 222,771 16.2
4 Rome, GA 90,565 16.2
6 Merced, CA 210,554 15.7
6 Jasper, IN 52,511 15.7
8 Johnstown, PA 152,598 15.5
9 Talladega-Sylacauga, AL 80,321 15.4
9 Wheeling, WV-OH 153,172 15.4
11 Lexington-Thomasville, NC 147,246 15.2
12 Laurel, MS 83,107 15.1
12 Point Pleasant, WV-OH 57,026 15.1
Spikes in Fine Particle Pollution
The 24-hour fine particle standard is critical different days. The New York-Northern
to limit spikes in fine particle pollution. New Jersey-Long Island (NY-NJ-PA),
Exposure to the high, short-term levels of Philadelphia-Camden-Wilmington (PA-NJ-
fine particles can result in illness and death, DE), San Diego-Carlsbad-San Marcos (CA),
even when the year-round average is within Detroit-Warren-Livonia (MI), Houston-
the current standard.57 Fine particle Baytown-Sugar Land (TX), Kansas City (MO-
pollution exceeded the 24-hour national KS), Las Vegas-Paradise (NV), Providence-
health standard 106 times on 39 different New Bedford-Fall River (RI-MA), and San
days in 13 states in 2003. Antonio (TX) metropolitan areas also
experienced dangerous spikes in fine
Among the states, California led the nation particle pollution in 2003.
with 42 spikes in fine particle pollution
above the health standard on 16 different Of mid-sized metropolitan areas, El Paso,
days in 2003 (see Table 11). Spikes in Texas suffered four dangerous spikes in
particle pollution occurred on 10 different particle pollution on three different days in
days in Pennsylvania, six days in Montana, 2003 (see Table 13). Nine other mid-sized
five days in Texas, three days in New metropolitan area experienced one day in
Mexico, two days in New York, and on one which fine particle pollution exceeded the
day in each Delaware, Michigan, Missouri, 24-hour health standard in 2003.
Oklahoma, Oregon, and Rhode Island.
Three small metropolitan areas in Montana,
The Riverside-San Bernardino-Ontario (CA), two in Delaware, and one in each New
Los Angeles-Long Beach-Santa Ana (CA), Mexico, California, Oklahoma, and Texas
and Pittsburgh (PA) metropolitan areas suffered dangerous spikes in particle
were the most plagued by spikes in particle pollution in 2003 (see Table 14). Missoula
pollution in 2003 (see Table 12). In the Los topped the list with six spikes in particle
Angeles-Long Beach metropolitan area, pollution above the health standard on four
short-term fine particle levels exceeded the different days.
national health standard 19 times on nine
Danger in the Air 27You can also read