Addiction Strategic Plan - March 2016 - Erie St Clair LHIN
←
→
Page content transcription
If your browser does not render page correctly, please read the page content below

Addiction Strategic Plan
March 2016

1
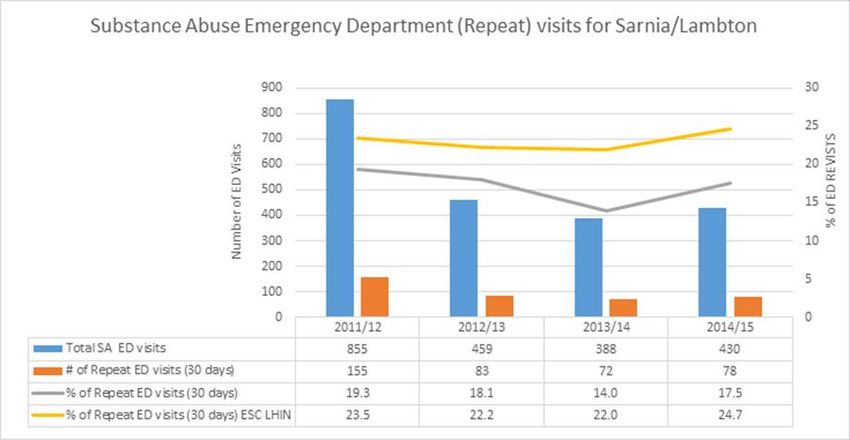
Table of Contents

  INTRODUCTION                                                                  4

  Addiction Strategic Plan Aims                                                 5
  Objectives                                                                    5
  Report Format                                                                 5

  1.       Magnitude of the Problem                                             6

  2.       Provincial Landscape and Erie St. Clair IHSP 4                      20

  2.1.     Ontario’s Mental Health and Addiction Leadership Advisory Council   22
  2.2.     Erie St. Clair LHIN Integrated Health Service Plan 4: Priorities    23

  3.       Engagement - Listening to Our People                                24

  3.1. Survey and Focus Group Findings                                         25
  3.2. Overarching Themes                                                      27
  3.2.1. Access                                                                27
  3.2.2. Wait Times                                                            28
  3.2.3. Treatment Options                                                     29

  4.       Current and Future State                                            30

  4.1.     Current State                                                       30
  4.1.1.      Withdrawal Management Services                                   31
  4.1.2.      Addiction Assessment and Referral, and Counselling               32
  4.1.3.      Residential Problem Gambling Services (PGS)                      34
  4.1.4.      Residential Treatment                                            35
  4.1.5.      Smoking Cessation Treatment in Addiction Agencies                37
  4.1.6.      Methadone Maintenance Treatment                                  38
  4.2.     Tiered Model of Care                                                39
  4.3.     Erie St. Clair Addiction Vision, Principles, and Core Services      40
  4.4.     Future State Discussion                                             41

                                                                               2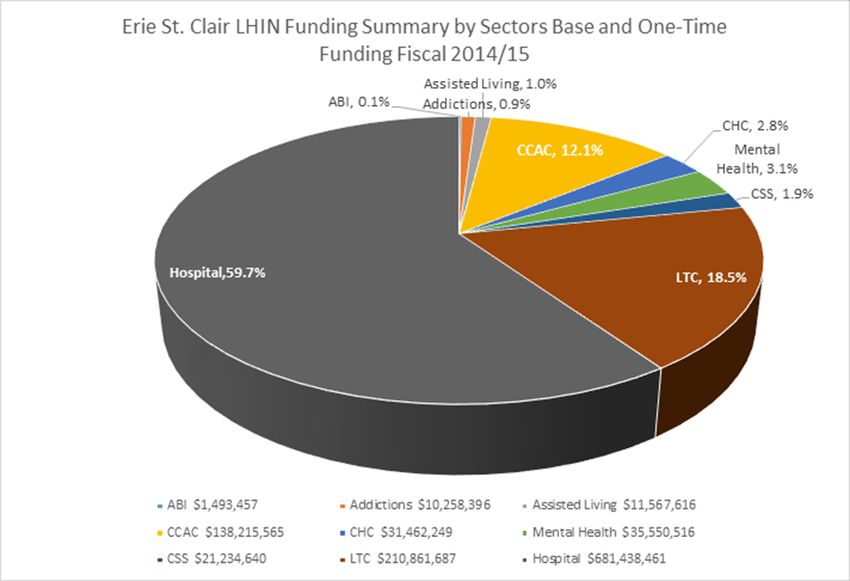
5.       Recommendations                                                    44

5.1.     Coordinated Access, Wait Times, and Enhanced Treatment             45
5.2.     Alignment of the Addictions Strategy and Mental Health Framework   45
5.3.     Special Population Group Recommendations                           45
5.3.1.      Youth/Emerging Adults                                           45
5.3.2.      Complex Needs                                                   46
5.3.3.      Equity                                                          46
5.4.     Performance Reporting and Quality                                  47
5.5.     Addictions and Primary Care                                        47
5.6.     Methadone Maintenance Treatment and Harm Reduction                 47

6.       Next Steps                                                         48

                                                                            3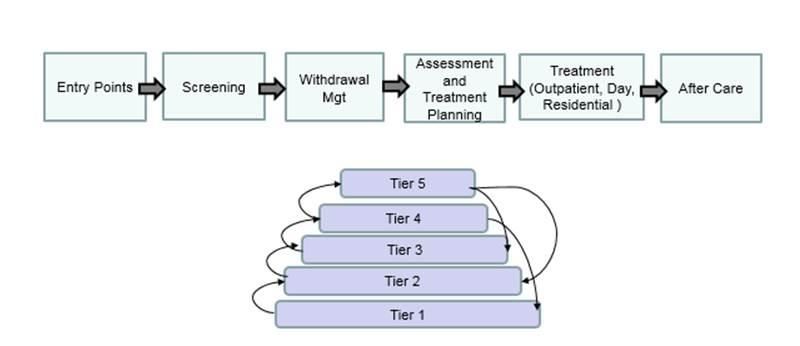
INTRODUCTION
The Erie St. Clair Local Health Integration Network (ESC LHIN) has identified improving
outcomes for people with mental health and addictions as a strategic priority in its Integrated
Health Services Plans (IHSP) 3 and 4. As part of this direction, a mental health strategic plan
was developed in 2012, followed by a multi-year implementation framework in 2013. During the
mental health planning process, key stakeholders and the ESC LHIN determined that a similar
planning approach would be required for the addiction sector. The rationale for not initially
combining the two sectors relates to the overarching need to fully understand the complexity
and different challenges of each population group, service structures, and funding distribution.
In fiscal year 2014-2015, the ESC LHIN embarked on a comprehensive addiction plan for the
region. Planning was guided by an Addiction Advisory Committee comprised of senior leaders
from the hospital and community addiction sectors. Advisory members represent a broad range
of services including:1
Residential and community-based withdrawal management
Residential treatment – drug and alcohol dependency (adults and youth age 16+)
Residential treatment – family members’ co-dependency
Residential treatment and community-based counselling - problem gambling
Community-based counselling – youth, individuals, and families
Addiction assessment and referral
Day programs
Relapse prevention
Recovery support/after care
Concurrent disorders (mental illness and addictions) case management
Residential and outreach for addicted pregnant women/new mothers
Supportive housing
Early on in the planning process, the ESC LHIN and its Addiction Advisory Committee members
acknowledged that not all population groups, services, sectors, and/or treatment approaches
such as prevention, primary care, and methadone maintenance are represented on the
committee. In response, the members recommended gathering information through a
1
See Appendix 1: Erie St. Clair LHIN Addiction Advisory Committee Membership.
4comprehensive and inclusive engagement process as well as a phased planning approach
given the complexity of the review. Throughout the process, the Addiction Advisory Committee
members provided invaluable insight, validation, and guidance.
Addiction Strategic Plan Aims
Creating a vision and guiding principles
Improving access to ensure a seamless experience for the client
Increasing treatment options, utilization, and program retention by matching client needs to
services
Reducing repeat emergency department visits within 30 days for substance misuse
Reducing hospital admission and readmissions related to substance misuse
Increasing coordination and integration between addiction and mental health sectors
Decreasing wait times for addiction services
Focusing on the client, including family members, to ensure positive experiences and
clinical outcomes
Objectives
A community engagement process to inform system improvements
Analysis of prevalence rates and projected future population needs
Analysis of current addiction services including wait times, gaps, and capacity/resource
pressures
Adoption of a health-equity lens focusing on unique population needs, regional disparities,
and challenges
Development of a high-level service inventory
Redesign of the addiction treatment system based on key findings from the current state
analysis, engagement findings, and evidence-based models of care
Recommendations and rationales for proposed system changes
Report Format
This Addictions Strategic Plan is divided into five main sections with further information provided
in the appendices.
Section One: Magnitude of the problem
Section Two: Contextual alignment with provincial mental health and addiction foundational
pillars and the ESC LHIN IHSP 4 priorities
Section Three: Engagement themes and key findings
Section Four: Selected addiction services, the future vision, and care model
Section Five: Recommendations and next steps
51. Magnitude of the Problem
The burden of addictions and mental illness in Ontario is conservatively estimated as being
more than 1.5 times that of all cancers and more than seven times of all infectious diseases.2
The nine health conditions identified in the 2012 Opening Eyes, Opening Minds: The Ontario
Burden of Mental Illness and Addictions Report contributed to a loss of more than 600,000
health-adjusted life years. Five of these conditions have the highest impact: depression, bipolar
disorder, alcohol dependency, social phobia, and schizophrenia. Depression alone accounts for
more than the combined burden of lung, colorectal, breast, and prostate cancers. Alcohol
related disorders account for 88 per cent of all deaths caused by addictions. As well, prolonged
use of alcohol is associated with a number of chronic long-term medical conditions including
cirrhosis of the liver.
Between 1991 and 2007, the number of prescriptions in Ontario for oxycodone drugs increased
by almost 900 per cent. In 2012, Ontario had the highest rate of prescription narcotic use in
Canada.3 Prescription narcotics are often over-prescribed and increasingly recognized as one of
the primary forms of illicit drug use. The estimated social, economic, and health costs for
Ontario resulting from untreated opioid use exceeds $1 billion annually, including costs
associated with law enforcement and use of the criminal justice system, as well as lost
productivity due to morbidity and premature mortality.
The high burden of mental illness and addictions directly relates to the emergence of these
conditions early in life, their prolonged duration, and relatively high prevalence. For example, the
onset of mental illness and addictions typically coincide with adolescence. The Mental Health
Commission of Canada defined this life stage as “emerging adults”, also referred to as
“transitional aged youth” between the ages of 16 to 25. This period of life is characterized by
significant intellectual, social, psychological, and neurological growth and development, as well
as major transitions; e.g., school completion, entry into the labour force, and establishing long-
term relationships. Disruption due to addiction during this critical developmental transition
creates significant personal and social costs.
Addictions and mental illness are chronic and recurrent, meaning people often experience
repeated episodes over many decades. This is exacerbated when no treatment is provided. The
Ministry of Health and Long Term Care (MOHLTC) found that nearly one-third of all Ontarians
seeking addiction and mental health care reported their needs were unmet or partially met. It
2Opening Eyes, Opening Minds: The Ontario Burden of Mental Illness and Addictions Report. 2012, Institute of Clinical Evaluation Sciences,
Public Health Ontario.
3 Ontario’s Narcotics Strategy. Available at: http://www.health.gov.on.ca/en/public/programs/drugs/ons.
6also found that people with addiction and mental health conditions are typically high-users (top
five per cent) of the health care system.4
The magnitude of the problem is illustrated best through the following statistics:
One in five Ontarians will experience a mental illness or addiction issue in their lifetimes
Three to five per cent of Ontarians have a very serious and complex addiction that they will
have to cope with throughout their lives
Three to five per cent of the population will have a problem with gambling. Problem
gamblers tend to be in the 35–54 age range. The literature is showing that young men
(between the ages of 18 and 24) are at the highest risk of developing problems gambling,
yet they are not accessing services5
One in six Ontario high school students meet the criteria for problematic substance use.
Within this cohort, only 1.2 per cent received treatment. This translates to 123,000 students
not getting the help that they needed.6 The Ontario Student Drug Use and Health Survey
found that one in six students in Grades 7 to 12, approximately 159,000 students, engaged
in harmful drinking
Concurrent disorders refer to individuals with a mental health diagnosis as well as a
dependency on substances. Nearly four in 10 (37 per cent) of people with an alcohol abuse
disorder and more than one-half (53 per cent) of those with a substance abuse disorder will
have a mental health disorder at some point in their lives, with the proportions differing by
disorder type in their lifetime:
o 24 per cent of those with anxiety disorder will have a substance use disorder
o 27 per cent of those with major depression will have a substance use disorder
o 56 per cent of those with bipolar disorder will have a substance use disorder
o 47 per cent of those with schizophrenia will have a substance use disorder
The prevalence rate for having an eating disorder and substance use problems ranges from
six per cent to 23 per cent, with bulimia nervosa having the highest rate
In 2014, the MOHLTC identified the “combined” prevalence of mental health and addiction
disorders in Ontario as 16 per cent. At the same time, the ESC region prevalence rate was
18.2 per cent, which translates to 118,667 people
4
Opening Eyes, Opening Minds: The Ontario Burden of Mental Illness and Addictions Report.. 2012, Institute of Clinical Evaluation Sciences,
Public Health Ontario.
5“Strategic Options for Addictions, Mental Health and Problem Gambling.” 2009, MOHLTC. Mental Health and Addictions Unit, Health Policy
and Standards Branch.
6 “2013 Ontario Student Drug Survey.” Centre for Addiction and Mental Health.
7Unfortunately, prevalence data alone is not a good indicator of need because the numbers do
not capture the acuity level associated with either addiction and/or the mental health conditions.
However, there is sufficient evidence showing a high proportion of people have a co-existing
mental health and addiction (MH&A) issue. The literature repeatedly stresses that, in the
absence of a coordinated and integrated treatment system, people are falling between the
cracks of the mental-health and addiction sectors. Health Canada suggests that having two
separate care systems produces less than optimal outcomes for people with co-existing
conditions, resulting in clients feeling stigmatized, facing the additional burden of dealing with
two systems, telling and re-telling their stories, requiring additional transportation, and
undergoing two separate treatment plans.7
Conversely, Dr. Brian Rush, a recognized leader in Ontario’s addiction system, raised warning
flags about an uncritical approach to integrating MH&A services. Based on understanding help-
seeking behavior exhibited by people with concurrent disorders, Rush suggests that the more
important issue is not integration of addiction and mental health systems, rather, the integration
of addictions and mental health treatment with primary care services is required. A more
integrated system should be organized in a way that recognizes the two sectors as valid: many
people served will only receive mental health oriented help (because that is all they need and
want) and many will only receive addiction-oriented help (because that is all they need and
want).8
Improving linkages between sectors is not restricted to MH&A. Other sectors such as primary
care, child welfare, housing, social services, and justice are equally important when serving
vulnerable population groups. One strategy to achieve positive, cross-sectorial outcomes is
through enhancing clinical core competencies, ensuring front-line clinicians are trained as
“concurrent-disordered capable.”
Another tactic is to create cross-sectorial education, care pathways, and partnerships. For
instance, a 2011 report on violence against women, mental health issues, and substance abuse
found that one in three women experienced violence at some point in their adult lives.
Furthermore, one-third of women accessing domestic violence services reported problematic
substance use. An Ontario-based study concluded 40 per cent of mental health and 37 per cent
of addiction service providers reported fair or poor competence levels when addressing client
trauma and violence.9 In sum, the burden and impact of mental health conditions and addictions
on the lives of individuals, family members, and society as a whole, directly and indirectly, is un-
measurable.
7
The Time is Now: A Plan for Enhancing Community-based Mental Health and Addiction Services in the South West LHIN. Whaley and Company.
2011.
8
The Time is Now: A Plan for Enhancing Community-based Mental Health and Addiction Services in the South West LHIN. Whaley and Company.
2011.
9
Report on Violence against Women, Mental Health and Substance Use. Canadian Women’s Foundation. 2011
81.1. Addiction Sector Funding
The Mental Health Commission of Canada estimates the annual cost of mental health and
addictions to be at least $50 billion, representing 2.8 per cent of the gross domestic product
(GDP). In fiscal year 2013-2014, total provincial funding for community MH&A sectors combined
was $1 billion representing approximately two per cent of Ontario’s overall health care
expenditures.10 A further analysis provided by the Mental Health and Addictions Leadership
Advisory Council (2015 annual report) identified that nearly two-thirds of the $1 billion ($634.1
million) went to mental health treatment. Spending for addiction care was $129.6 million or 13
per cent, while problem gambling care was $11.7 million or 1.2 per cent.11
In fiscal year 2014-2015, the ESC LHIN proportion of community health care funds allocated to
the addiction sector was $10.2 million or one per cent of its total budget. Figure 1 shows the
ESC LHIN funding by sector.
Figure 1: ESC LHIN Funding by Sectors, Base and One-Time, 2014-2015 Fiscal Year
10 MOHLTC Data Branch, January 2015.
11 Better Mental Health Means Better Health. 2015 Annual Report of Ontario’s Mental Health & Addictions Leadership Advisory Council.
9Over the past three years, the ESC LHIN has increased addiction sector spending by 9.8 per
cent. While program-level investments have begun, the addiction sector remains underfunded
and is oftentimes referred to as the “poor cousin” of the health care system. At the federal level,
the Mental Health Commission recommends increasing the proportion of health spending for
mental health and addictions by nine per cent over 10 years.12
1.2. Prevalence Rates, Help Seeking, and Projected Population Needs
This section examines various prevalence rates for specific substances, help seeking trends,
and population projections of those in need of addiction treatment compared to actual utilization
of services, and wait times in the ESC LHIN. Additional key indicators include: emergency
department (ED) repeat visits, opioid-related ED visits, hospitalizations, and deaths.
The 2012 Canadian Community Health Survey self-reported rate for heavy drinking among Erie
St. Clair residents aged 12 and older in the past 12 months is 17.9 per cent compared to 16.9
per cent for Ontario as a whole. The definition of “heavy drinking” is five or more drinks on one
occasion at least once a month in the past year. Table 1 shows higher drinking rates for
Chatham-Kent males and Sarnia/Lambton females compared to Ontario.
Table 1: Heavy Drinking Rates, ESC LHIN, Gender Comparison to Ontario, Ages 12+13
Windsor/Essex Chatham-Kent Sarnia/Lambton ESC Total Ontario
Males Females Males Females Males Females Males Females Males Females
24.2% 9.6% 28.9% 9.6% 25.7% 15.0% 25.3% 10.7% 24.4% 9.4%
Similar findings are reflected in the Centre for Addiction and Mental Health (2013) report: Drug
Use among Ontario Students, 1977-2013 with 28.7 per cent of ESC students (Grade 9 – 12)
reporting binge drinking in the past month compared to 25.4 per cent for the province overall.
Alcohol use as a substance of choice has wide ranging implications with problematic behaviours
such as inability to fulfill work/school obligations, difficulties with interpersonal relationships,
drinking and driving, and other risk-taking activities leading to lower lifeexpectancy rates. The
most cost-effective strategy in response to early-stage alcohol problems is a single session of
advice from a primary care physician with follow-up from a nurse.
The 2011-2012 Canadian Community Health Survey self-reported rate for smoking for
individuals aged 12 and older in the past 12 months in ESC is 15.6% compared to Ontario at
14.4%.14 Table 2 shows that individuals in Chatham-Kent and Sarnia/Lambton have higher daily
smoking rates compared to Ontario.
12 Changing Directions, Changing Lives: The Mental Health Strategy for Canada. Mental Health Commission of Canada. 2012.
13 Canadian Community Health Survey 2011/2012 Statistics Canada.
14
Canadian Community Health Survey, Statistics Canada, 2011/2012
10Table 2: Smoking Rate, ESC LHIN, Gender Comparison to Ontario, Ages 12+
Windsor/Essex Chatham-Kent Sarnia/Lambton ESC Total Ontario
Males Females Males Females Males Females Males Females Males Females
15.4% 9.3% 19.9% 21.9% 24.1% 18.9% 17.9% 13.4% 17.2% 11.7%
Research has shown that individuals diagnosed with a substance use disorder or a psychiatric
disorder are two - four times more likely to use tobacco than the general population. More
addiction treatment clients will die from diseases related to tobacco use than from all other
causes combined.15
Erie St. Clair student use of opioid pain relievers, was reported as 11.2 per cent, and cannabis,
25.7 per cent, slightly lower than Ontario, at 13.5 per cent and 29.2 per cent respectively.
Anecdotal information indicates that both substances are commonly used and are a community
concern. Cannabis use within the last year (including one-time use) in Ontario was 11.5 per cent
of the population; in ESC LHIN, it was 9.3 per cent in 2011-2012. Cannabis use within the last
year excluding one-time use, is 10.8 per cent provincially and 8.7 per cent in the ESC LHIN. Any
illicit drug used ever (including one time cannabis) in Ontario is 40.8 per cent and 37.4 per cent
in the ESC LHIN.16
1.3. Help Seeking Trends
In the 2014-2015 fiscal year, 2,283 residents of ESC LHIN contacted ConnexOntario telephone
help lines seeking assistance. The types of calls are grouped into three categories:
82 (3.6 per cent) problem gambling
888 (or 38.9 per cent) drug and alcohol
1,313 (or 57.5 per cent) seeking help for mental health concerns
Figure 2 illustrates that the top three substances for which ESC LHIN residents were seeking
addiction treatment remained relatively consistent over two fiscal years, led by alcohol and then
cannabis, followed by prescription opioids.17
15
Lasser, K., et al. (2000, Nov). Smoking and Mental Illness: A Population-Based Prevalence Study. The Journal of the American Medical
Association, 284 (20(, 2602-2610.
16 Canadian Community Health Survey, Statistics Canada, 2011/2012
17Drug and Alcohol Treatment Information System is a province-wide client-information system that receives reports from addiction agencies
throughout Ontario.
11Figure 2: Percentage of Addiction Clients, Fiscal Years 2013-2014 and 2014-2015,
by Presenting Problem Substances
Figure 3 shows just over half of all Erie St. Clair residents remained within our region for
treatment. The remaining proportion are served throughout Ontario. Addiction providers and
ConnexOntario validated this trend as long standing and not unsual given the sensitivity and
stigma associated with seeking addiction treatment.18
Figure 3: Percentage of Erie St. Clair Residents Referred for Addiction Treatment to
Other LHIN Locations, Fiscal Year 2014-2015
18ConnexOntario is a government funded provincial telephone hotline providing free and confidential health service information regarding
drug, alcohol, problem gambling and mental health services available in each LHIN region throughout Ontario.
121.4. Projected Population in Need of Addiction Treatment in Erie St. Clair Region
Predictive modelling is based on a prevalence rate that 13 per cent of a given population will
have a substance use issue. Within the 13 per cent, it is assumed that 20 per cent of those
require immediate treatment.19 Table 3 illustrates that in fiscal year 2013-2014, 16,094 people in
the Erie St. Clair region would have benefited from addiction treatment.
Table 3: Total Population by Geographical Area by Prevalence Rate and Predicted Need
Addiction
Population, Prevalence rate: Predicted Population in
Area 2011 Census 13% of A = Need of Treatment
(A) (B) (B x 20% = C)
Windsor/Essex 388,785 50,542 10,108
Chatham-Kent 104,080 13,530 2,706
Sarnia/Lambton 126,190 16,405 3,280
Total Erie St. Clair 619,055 80,477 16,094
During this same time period, 8,042 individuals received addiction treatment. This translates to
approximately one-half of all potential clients needing treatment actually received services. The
literature shows similar outcomes—the World Health Organization estimates 50 per cent to 65
per cent of individuals requiring addiction or mental health services actually receive them.
There are various reasons for unmet need in Erie St. Clair that are discussed in greater detail
in the engagement section of this report.
1.5. Emergency Department Repeat (within 30 days) Visits for Substance Abuse
Another method of assessing need is by examining ED repeat visits. Across the province, all 14
LHINs are measured and ranked by ED visits (within 30 days) for mental health conditions and
substance use. While overlap among MH&A conditions is recognized, these indicators are
interpreted as a measure of unmet needs as well as:
1) Lack of available treatment options
2) Lack of coordination/collaboration between hospitals and community providers
3) Cohort of treatment resistant and difficult to engage individuals
Figure 4 illustrates that for ED repeat visits, ESC LHIN ranked eighth in the province in fiscal
year 2014-2015. It is noteworthy that significant variances occur on a quarterly basis and by
county as shown in the following Figures.
19 Centre for Addiction & Mental Health, B. Rush (1990). Urbanoski et al (2007) Wild et al (2014)
13Figure 4: LHIN Ranking, Repeat ED Visits (within 30 days) for Substance Abuse,
2014-2015 Fiscal Year
The Windsor area repeat ED visit volumes consistently are the highest in our region (Figure 5a).
The ESC Transitional Stability Centre (TSC), designed to provide support for high ED users
suffering from mental health or addiction issues, is anticipated to have a positive and long-
lasting impact once the model is fully implemented.
Figure 5a: Windsor/Essex ED Repeat Visits for Substance Abuse, 2011 – 2015
14As shown in Figure 5b, ED repeat volumes vary significantly in the county and generally are
quite low. Please note, visits less than 5 will appear as zero.
Figure 5b: Leamington District Memorial Hospital ED Repeat Visits for Substance Abuse,
2011 – 2015
Improvements in ED (repeat) visits within 30 days for Chatham-Kent (Figure 6a) are attributed
to:
Vertical integration with Canadian Mental Health Association Lambton-Kent (2013-2014)
and Chatham-Kent Community Health Centre (CHC) in 2015-2016
Flagging high MH&A ED users, signalling a clinical team wrap-around consult. From a
primary care lens, high ED users with co-existing MH&A conditions without a family
physician may be referred to Health Links
Existing primary care practices in Chatham-Kent and Sarnia/Lambton are referring patients
who present with substance use issues to the Rapid Assessment Intervention Treatment
(RAIT) Team. This team is multi-discipinary and mobile, providing consulation in the client’s
home within 72 hours. The RAIT team was funded by the ESC LHIN as a promising practice
in 2014-2015. While the initatiave is still growing, data demonstates postive impacts overall
on ED utilization as well as on fostering a shared-care relationship between primary care
and MH&A health service providers
15Figure 6a: Chatham-Kent ED Repeat Visits for Substance Abuse, 2011 – 2015
As shown in Figure 6b, ED visits and repeat visits are lower compared to Figure 6a, generating
what appears to be a higher percentage of repeat visits. Expressed differently, a small cohort of
individuals are responsible for driving the repeat visits at the Sydenham Campus. This indicates
an opportunity for Health Links to positively impact this metric.
Figure 6b: Chatham-Kent Health Alliance, Sydenham Site ED Repeat Visits for Substance
Abuse, 2011 – 2015
16Improvements in Sarnia/Lambton (Figure 9) are associated with the implementation of a
community-based withdrawal management service (WMS). Prior to this investment, residents
from Sarnia/Lambton in need of WMS had no choice but to access services located in Windsor
or London. From a process perspective, a redesign of the addiction and mental health crisis
response at the Bluewater Health ED is credited for lowering repeat visits for adults.
Figure 7a: Sarnia/Lambton ED Repeat Visits for Substance Abuse, 2011 – 2015
As shown in Figure 7b, ED repeat volumes vary significantly in the county and generally are
quite low. Please note, visits less than 5 will appear as zero.
Figure 7b: Bluewater Health CEEH Site ED Repeat Visits for Substance Abuse,
2011 – 2015
171.6. Opioid Related ED Visits, Hospitalizations, and Deaths
In February 2012, the MOHLTC discontinued the formula of the narcotic Oxycontin, changing it
to Oxyneo. As a means of tracking geographic and system impact, the MOHLTC partnered with
the 14 LHINs and public health units. Key findings related to ED visits and hospital admissions
remained consistent with a slight increase beginning in the summer of 2012. Increases in “other”
types of substance misuse such as fentanyl, hydro-morphine, and heroin were noted.
During the summer of 2015, the three Public Health Units located in the ESC region analyzed
the year-over-year rate of opioid-related ED visits, hospital admissions, and deaths over a 10-
year time span. Key findings are presented below.
1.6.1. Windsor/Essex ED Visits and Hospitalizations Related to Opioid Use20
From 2003 to 2013, the rate of opioid-related ED visits increased steadily in Windsor/Essex
as well as in Ontario as a whole. By 2013, Windsor/Essex males recorded nearly twice the
number of visits (118.9 per 100,000) as Ontario males overall (67.2 per 100,000). For
Windsor/Essex females, the rate was 74 per 100,000 compared to 52 per 100,000 for the
entire provincial female population. The Windsor Essex County Health Unit conducted an
age analysis showing in 2013 Windsor/Essex residents aged 20 – 44 had 199.6 ED visits
per 100,000 people, almost double the 105.9 rate for Ontarians in this age cohort. The next
age category, 45 – 64, also demonstrated higher usage in Windsor/Essex, 82.7 per
100,000, compared to 53.7 for Ontario
A similar trend surfaced for Windsor/Essex residents admitted to hospital in 2013 for opioid-
related conditions, with higher rates for the 45 – 64 age group, 21.8 per 100,000, compared
to 14.5 for Ontario. Windsor/Essex females in 2013 had 50 per cent higher opioid-related
ED rates at 18.7 compared to all Ontario females at 12.3 per 100,000. Windsor/Essex males
were also higher opioid-related ED users than their provincial counterparts with 16.6 and
12.3 respectively
1.6.2. Sarnia/Lambton: ED Visits and Hospitalizations Related to Opioid Use21
In 2003 and 2004, there were fewer than 40 opioid-related ED visits in Sarnia/Lambton. By
2011 and 2013, Sarnia/Lambton residents aged 20 – 29 were three times more likely than
their provincial counterparts to visit the ED for an opioid-related issue. Opioid-related ED
visits by age group for Sarnia/Lambton are as follows: 20 – 29 (201); 30 – 39 (90); 40 – 49
20
Opioid Misuse in Windsor-Essex County. August 2015 Windsor-Essex County Health Unit Data source National Ambulatory Care Reporting
System and Discharge Abstract Database. ICD 10 CA codes F110 - 119.
21Health Indicator Summary: Opioid Misuse. August 2015. Lambton Health Unit. Data source National Ambulatory Care Reporting System and
Discharge Abstract Database. ICD 10 CA codes F110 – 119and T402 (poisoning by other opioids).
18(72) and the very young, aged 10 – 19, (54). Sarnia/Lambton males were more likely than
females to visit the ED with opioid-related conditions
The average number of opioid-related hospital admissions among Sarnia/Lambton residents
nearly tripled from seven per year between 2002 and 2009 to 19 annually between 2010
and 2013. Between 2011 and 2013, the rate of admission was slightly higher for
Sarnia/Lambton at 15.2 per 100,000 versus 12 per 100,000 for Ontario
1.6.3. Chatham-Kent ED Visits and Hospitalizations Related to Opioid Use22
From 2004 to 2013, the rates of Chatham-Kent opioid-related ED visits more than doubled,
from 59 to 138 per 100,000. Rates were higher among males than females. In 2013, males
had an opioid-related ED visit rate nearly three times higher than their provincial
counterparts. Analysis by age shows visits among 20 – 29 year olds accounted for nearly
half of all Chatham-Kent opioid-related ED visits from 2012 to 2014, with 500 per 100,000.
Rates were significantly higher for Chatham-Kent males and females aged 30 – 39
compared to Ontario. However, the number of admission rate for
Chatham-Kent was surprisingly comparable to Ontario at 12 per 100,000.
1.6.4. Deaths Due to Acute Opioid Toxicity by County and Ontario23
Table 4 shows the number of deaths due to opioid toxicity in Windsor/Essex, Sarnia/Lambton,
and Ontario. Chatham-Kent Public Health analysis did not include a year by year breakdown,
and is therefore not included in the chart below.
Table 4: Number of Opioid-Toxicity Deaths, Windsor/Essex, Sarnia/Lambton, and Ontario
Region 2007 2008 2009 2010 2011 2012 2013 Total
Windsor/ 15 14 19 20 30 28 33 159
Essex
Sarnia/Appendix 2 provides county specific, clinical profiles of high users of the ED for substance
abuse.
2. Provincial Landscape and Erie St. Clair IHSP 4
In 2011, the provincial government announced a comprehensive 10-year MH&A strategy,
focusing the first three years on children and youth. Years four through 10 will focus on adults
and addictions. As a framework, all future MH&A funding must align with the following five pillar
categories:
1. Promote Resiliency and Well-Being in Ontarians:
Expand resiliency programs for at-risk youth, peer support populations, opioid initiatives
2. Ensure Early Identification and Intervention:
Linkages with primary care, target youth, and concurrent disorders
3. Expand Housing, Employment Supports, and Diversion and Transitions From the
Justice System:
Examples include housing, police/crisis, social rehabilitation and safe beds
4. Right Service, Right Time, Right Place:
Strengthen service enhancements. Invest in services for transitional-age youth, e.g.
ACCESS Open Minds. Invest in local high-needs, complex population groups
5. Fund Based on Need and Quality:
The MOHLTC and LHINs will develop and deliver a new funding model that links
population needs, quality improvements, and integration to service delivery
In 2015, the MOHLTC reviewed the 14 LHINs MH&A base investments for the past two fiscal
years based on the above five pillar categories. The analysis revealed Pillar 4 as receiving the
largest proportion (22 per cent) of allocations, specifically service delivery enhancements. It was
followed by housing at 20 per cent and mobile crisis - police supports at 12 per cent.
Comparatively, enhancing existing service capacity is consistent with the ESC LHIN MH&A
investment approach for the past three years. As a sector, MH&A is underfunded—enhancing
capacity has been a necessary priority for all LHINs.
20Coupled with the above analysis, five areas were identified as “missed opportunities”:
1. MH&A promotion as a core service in the continuum
2. Supports for youth at risk
3. Workplace wellness
4. Literacy for MH&A
5. Population health approach, targeting groups most at risk; e.g., Indigenous people 24
The 14 LHINs met in the fall of 2015 to determine cross-LHIN opportunities with the greatest
potential for advancing the five strategic pillars. Three objectives, listed below, surfaced with
concrete actions and examples of current LHIN initiatives. For ESC, the Fast Access to
Community Experts (FACE) initiative, RAIT Team, TSC, and transitional housing for women and
children are cited.
Table 5: Mental Health and Addiction Leadership Council Objectives
OBJECTIVE 1
Ensure accessible and appropriate primary care for those experiencing MH&A conditions
Actions:
1. Ensure that people with MH&A conditions can access a primary care provider
2. Support primary care providers in early identification and intervention
3. Integration of MH&A into primary care reform strategies
Current LHIN Initiatives: MH&A primary care services and day programs, RAIT, Quick
Response Treatment Programs, Early Psychosis Intervention Programs, MH&A Nurses in
Schools, crisis withdrawal management/stabilization programs, community
mobilization/connectivity tables
OBJECTIVE 2
Ensure better coordinated, centralized, and integrated access points for MH&A services
Actions:
1. Decrease wait times for MH&A assessment, counselling, and intervention
2. Ensure coordination for people who require services in multiple streams
Current LHIN Initiatives: 24/7 coordinated access programs, telemedicine services, FACE,
coordinated access points for supportive housing, integrated eating disorders program, after-
care programs
24 Forthe purpose of succinctness, reference to Indigenous communities is intended to be inclusive of First Nations, Métis, Inuit, and urban
populations. It is recognized that each group has a distinct culture, ceremonies, protocols, language, and community structures. The use of the
term Indigenous for the above groups does not imply or denigrate the distinct characteristics, needs, or challenges of each group. Throughout
the document, these terms are used interchangeably, including Aboriginal, as this is the wording used in the original source documents.
21Objective 3
Ensure availability of supportive housing options for key populations
Actions:
1. Increase volume of flexible services for people residing in supportive housing units
Current LHIN Initiatives: TSC, Extraordinary Needs Program, rent supplement programs,
transitional housing for women and children, high-support housing for complex groups/low
barriers, Housing First Intensive Case Management Models
Key enablers to support the three objectives include:
Common basket of services
Consistent data capture systems and tools
Partnerships and inter-ministerial relationships
In addition, measurements were reviewed, including identifying future potential metrics in
partnership with Health Quality Ontario (HQO) and the Institute for Clinical Evaluative Sciences
(ICES).
Existing measures:
MOHLTC-LHIN Performance Agreement: Repeat ED visits (within 30 days) for mental
health and substance abuse conditions
Historical: number of clients seen, units of service (visits)
Future potential measures:
Average number of days between referral application and initial assessment completed
Average number of days between initial assessment completed and service initiation
Doctor visit within seven days of hospital discharge for mental illness or an addiction
(HQO)
Readmission rates for mental illness or an addiction (HQO)
Use of physical restraints in acute mental health care (HQO)
Suicide rates (HQO)
Perception of Care (client experience)
Wait times
2.1. Ontario’s Mental Health and Addiction Leadership Advisory Council
In November 2014, the MOHLTC Minister, Dr. Eric Hoskins, announced the creation of the
Mental Health and Addictions Leadership Advisory Council supported by a secretariat. The
Advisory Council’s five key deliverables include:
221. Strategic planning: System-level priority setting, problem identification, and work planning
2. Advice on Provincial investments: Government MH&A investments
3. Implementation of the Strategy: External oversight and accountability of key strategic
initiatives
4. Tracking progress and public reporting: Annual progress reports (with ICES and HQO)
5. Advice on MH&A initiatives: Meaningful advice to government on MH&A issues/initiatives
The Advisory Council is supported by five working groups:
1. Community Funding Reform
2. Youth Addiction
3. System Alignment and Capacity
4. Prevention, Promotion, and Early Intervention
5. Supportive Housing
The Advisory Council’s 2015 Annual Report, Better Mental Health Means Better Health, states
that, as a parallel process, the “Ministry of Health and Long-Term Care is working on a
dedicated Aboriginal mental health and addictions engagement process with First Nations,
urban Aboriginal, and Métis partners.”25 These engagements are intended to build on, support
and create linkages with important work already underway across Ontario. By the end of 2016,
Indigenous partners will have completed their locally designed engagement processes to
identify where and how they can build on existing initiatives, what culturally appropriate services
are needed, and what opportunities exist for enhanced cross-sector collaboration.
The provincial landscape clearly demonstrates that people with MH&A are a priority. Nationally,
Prime Minister Justin Trudeau named “emerging adults” as a priority population group. This
commitment was solidified when he appointed himself Youth Minister.
2.2. Erie St. Clair LHIN Integrated Health Service Plan 4: Priorities
In 2016, the ESC LHIN completed the IHSP 4. Coinciding with the IHSP development, the 14
LHIN Chief Executive Officers developed a foundational framework for improving the health
care system.
25
Better Mental Health Means Better Health 2015. Annual Report of Ontario’s Mental Health & Addictions
Leadership Advisory Council.
23Table 6: LHIN CEO Overarching Pillars and ESC LHIN IHSP Priorities
LHIN CEO Overarching Pillars Erie St. Clair LHIN IHSP: Priorities
Transform the patient experience through a Better access to health care
relentless focus on quality
Build and foster integrated networks of care Better coordination of services
Tackle health inequities by focusing on More support for people at home
population health
Drive innovative and sustainable service More focus on health promotion and illness
delivery prevention
More cost-effective care
Over and over, across all LHINs, the themes of better access, coordination/integration, and
measurable quality care and health equity are consistently echoed.
3. Engagement - Listening to Our People
The purpose of the addiction engagement process was to gain a better understanding about
needs, gaps, and barriers to accessing services, as well as tangible suggestions on how the
system could be improved. Guiding questions included:
1. From your perspective, what is positive about addiction services in our region?
2. What are the gaps or issues, and how should these be addressed to improve services?
3. How well does the screening and assessment system work?
4. What would reduce wait times?
5. From your experience, what services are important to support family members?
6. Do you have any other advice to help improve the addiction system in the ESC LHIN?
The engagement occurred over a one year period and included consultation with existing
networks, committees, and leadership tables. Table 7 provides a high-level snap shot of
engagement activities.
24Table 7: Engagement Activities Snap Shot
Approach Description
Surveys 2,500 hard copies were distributed with a response rate of 455 or
(hard copies and online) 18.2%. An additional 217 responses from the online survey made
for a total of 672 or a 26.8% overall response rate.
Focus Groups 250 individuals provided feedback through focus groups and
And Interviews with interviews on:
Subject Matter Experts Unique population groups’ barriers in accessing and receiving
See Appendix 3 treatment; e.g., language, culture, distance/transportation
Needs, gaps, and recommendations for improvement
Numerous individuals with lived experience (clients and family
members) stepped forward throughout the engagement
process sharing their personal stories, struggles, and
successes
Health Service Provider 31 service providers from across the region:
Addiction Planning Day Identified geographical gaps, needs and barriers
See Appendix 4
Identified areas that are working well by county
Confirmed key assumptions and rationales for system change
Critically reviewed data collection methods and reporting
Provided support for adopting a tiered model of care
3.1. Survey and Focus Group Findings
The addiction survey was designed to gather and separate information by specific cohorts,
including individuals who self-identified as someone with lived experience, family member, and
service providers, and as Francophone or Indigenous. Due to the sensitive nature of addictions
an electronic survey was posted on the ESC LHIN web site. Availability of the survey was
communicated through addiction providers, the media, and the ESC LHIN Communications
Team. More than 900 people provided feedback through surveys, focus groups, and key
informant interviews. Table 8 highlights the demographics of the survey respondents.
25Table 8: Survey Respondents Demographic Highlights
Urban Rural Windsor/ Chatham- Sarnia/ Francophones Indigenous
Essex Kent Lambton
59% 32% 33% 30% 33.% 45 individuals 65 individuals
Note: Not all respondents answered these questions, therefore the totals do not equal 100%
The survey respondents, urban/rural and by county percentage, align well with Erie St. Clair
region population distribution. Unfortunately, the small sample size who self-identified as being
Francophone or Indigenous cannot be deemed as representative of two unique population
groups. Table 9 shows the age range of the survey respondents.
Table 9: Age Range of Survey Respondents
24 and younger 25- 4 35-44 45-54 55-64 65 and older
66 180 153 134 88 32
Note: Due to incomplete fields, responses do not total 672.
A significant number of respondents did not complete the age field resulting in the young and
older adults sample size being very small. Table 10 shows the composition of survey
respondents.
Table 10: Composition of Survey Respondents
Response Total = 508 Percentage
Sought treatment 310 46.13 %
Family member of a person with addiction 116 17.26 %
Service provider 72 10.71 %
Person seeking treatment 67 9.97 %
Friend of a person with an addiction 36 5.36 %
Note: Due to incomplete fields, responses do not total 672
Appendix 5 provides summaries from the survey. Table 11 shows the types of focus groups by
number of participants.
26Table 11: Focus Group Types
Focus Groups Number of Participants
N=250
Addiction Front Line Health Service Providers (LHIN wide) 31
Youth/Regional Children’s Centre 40
Harm-Reduction Providers and Methadone Clients 26
Alcoholics Anonymous (AA) 25
Family Members 33
Francophone (clients and family members) 17
Primary Care / Methadone Physicians / Psychiatrists 27
Police, Drug Court, Probation 10
Problem Gambling Providers 14
Ontario Works Addiction Providers, Affordable Housing Providers 27
and Clients
3.2. Overarching Themes
The majority of feedback, regardless of methodology, came from people with lived experiences,
service providers, and family members. Three overarching themes emerged:
1. Access into the addiction system is the single greatest challenge
2. Wait times are a barrier
3. Lack of treatment options result in significant gaps in the addiction continuum of care
3.2.1. Access
Inability to navigate and access the addiction system is
“Assessment and referral does
the greatest issue. Lack of awareness among service
not work, it is broken and
providers, family physicians, psychiatrists, and the
contributes to system
general public about the existence of an entry point,
bottlenecks, wait times and
namely addiction assessment and referral services,
unnecessary redundancy” –
was overwhelmingly consistent throughout the region.
Service provider
The majority (46 per cent) of survey respondents with
lived experience contacted a residential treatment program directly, followed by 33 per cent who
approached their family doctor/nurse practitioner, and 23 per cent who went directly to hospital.
Other responses included: police, employee assistance program, homeless shelter, Alcoholics
Anonymous (AA), Narcotics Anonymous (NA), Detox, local Health Unit, ConnexOntario,
Canadian Mental Health Association, methadone clinics, and family counsellors.26
26
Respondents were able to choose more than one option, therefore totals do not equal 100 per cent.
27Across Ontario, addiction assessment and referral (A&R) originated as a standardized program
that functions as the formal point of entry. A&R includes matching client needs to specific and
available treatment services throughout Ontario. The literature stresses effective treatment
outcomes are predicated on how well services are received and how reflective they are of
individual client needs. From the service provider planning day, dissatisfaction was expressed
with the time period between withdrawal management and being assessed and matched for
treatment as a critical window of opportunity.
“Persons coming out of Detox Coupled with access, the undercurrent theme of stigma
should be given immediate was raised at every engagement. Public education,
options – abstinence/ awareness, and prevention while not funded by the
methadone / suboxone / LHINs, were expressed as critical components that go
residential / community hand-in-hand with the front end of the system. Similarly,
counselling” –Physician greater collaboration, coordination, and overall
partnership across sectors were noted as tactical
strategies to address stigma and promotion of an entry point into the addiction system.
Transitions between service sectors are problematic with no clear pathways. Lack of
transportation is another challenge, intertwined with access. This issue was particularly striking
for Indigenous community members and rural residents who expressed being unable to attend
peer support groups such as AA, Methadone Anonymous (MA), and NA. Similarly, lack of
childcare restricted access for many women. As well, language and cultural challenges coincide
with access barriers for various disadvantaged population groups.
3.2.2. Wait Times
Wait times vary across services and the ESC LHIN. “Need more options with
People waiting for treatment ranged from waiting for shorter wait times and
assessment and referral, residential treatment, or answers. We were desperate.
counselling in the community. Unacceptable wait times When an addict says they are
and lack of options are intertwined. Repeatedly, willing to get help, being told
dissatisfaction and urgency to fix the system were two months wait is
verbalized throughout the engagement process. unacceptable” – Mother
Overwhelmingly, people are frustrated with waiting for a
There must be some connection
between services....provide service for a condition that is life threatening. The lack
bridge support, case of safety nets between service points was articulated
management, or system well by Erie St. Clair addiction service providers.
navigation” – Service provider
28Examples of specialized addiction services not available in the Erie St. Clair region include
those for:
Males 16 and older prescribed methadone and requesting residential treatment
Youth under the age of 16 seeking residential treatment (harm reduction or complete
abstinence)
Most individuals with complex neurobehavioural conditions such as fetal alcohol
syndrome, acquired brain injury (ABI) and addictions, dual diagnosis27 and addictions,
and/or borderline personality disorders
High-risk, unstable polysubstance users who require medically supervised, Level 3
withdrawal management
Wait times were not expressed as a barrier for individuals accessing methadone treatment.
Consultation with physicians in Windsor/Essex specializing in addictions expressed that there
are two systems and rarely are individuals referred from A&R. Conversely, in the other two
communities within the Erie St. Clair region, methadone is included as a treatment option and
communicated to clients by A&R providers. Clearly, a consistent approach throughout the Erie
St. Clair region is needed with respect to A&R and drug replacement therapy.
The engagement process illuminated that peer support such as AA, NA, MA, and Al-Anon do
not have wait times and are underutilized as a viable treatment option that functions in
partnership alongside the formal addiction service system. An example of the formal addiction
treatment system and self-help coming together is the creation of Mothers on Methadone, a
grass-roots group that was initiated by the Bluewater Methadone Clinic clients in partnership
with Bluewater Health.
Examples of other treatment services in Erie St. Clair with minimal to no wait times include
counselling for problem gambling, residential treatment provided by Brentwood Recovery Home,
after-care support groups provided by Westover Treatment Centre, and the two WMS.
3.2.3. Treatment Options
Lack of treatment options such as community-based “MAKE IT EASIER, FASTER &
counselling available in the evening, weekends, or in a
MORE TREATMENT OPTIONS!”
day-program structure was echoed throughout the
engagement process. Family members, spouses, and
children impacted by addictions require greater support and treatment options as part of the
continuum of care. Service providers indicated that people are referred, by default, to
Residential Treatment by employee assistance programs (EAP) or A&R because flexible,
27
Dual Diagnosis refers to an individual having a developmental disability and psychiatric condition.
29community counselling supports are not available. Lack of treatment options was cited for each
of the following population groups:
Culturally appropriate healing services for Indigenous People
Treatment for Francophones in French
Lesbian, Gay, Bi-sexual, Transgendered, Two-Spirited, and Queer (LGBTTQ)
Shift Workers and white collar professionals - after hours flexibility
Parents who require child care, including pregnant women
Chronic alcoholics who are homeless or living in a precarious environment: explore low
barrier, housing first – guided alcohol consumption program
Older adults with different life experiences and co-existing medical/health conditions
Complex neurological clients, also frequently
referred to as the “hard to service” “Better hours for counselling
services – I couldn’t get to an
Youth/adults requiring harm-reduction counselling
appointment because of
Newcomers (see Appendix 6)
working 10 hours a day / six
People with concurrent disorders (mental illness
days a week. Evening services
and addictions)
are greatly needed.” – Person
People with chronic pain and addictions (current
with lived experience
services model is consultation-based)
Appendix 3 provides engagement themes, including qualitative feedback.
4. Current and Future State
Section Four provides a brief summary of selected addiction services, capacity, resources, wait
times, and funding. It concludes with guiding principles, a vision statement, identification of core
addiction services and a proposed high-level future state model.
4.1. Current State
The scope of currently funded addiction treatment services includes structured and unstructured
interventions or clinical modalities. This section profiles the following selected services:
Withdrawal management services (residential and community)
Assessment and referral, and community-based counselling
Problem gambling, residential
Methadone maintenance treatment
Residential treatment services
Smoking Cessation
Appendix 7 provides a descriptive service inventory.
304.1.1. Withdrawal Management Services
Withdrawal Management Services (WMS) help individuals through an acute phase of
detoxification from alcohol and/or other substances. Withdrawal management can occur in a
residential bedded service or in a community based orientation. Community-based WMS
provides support for individuals who remain in their home or in a day program structure. In the
ESC LHIN, a city of Windsor site offers residential (bedded) WMS, which is provided on a 24/7
basis for males and females age 16+ with 27 dedicated WMS beds of which seven beds are
used for observation. Medical supports for this service include an addiction medicine certified
physician (methadone) and access to a psychiatrist. Community-based WMS is not currently
available in Windsor/Essex or Chatham-Kent. In the future, bedded residential services will be
available in Sarnia/Lambton through a LHIN directed initiative. Currently, Bluewater Health, in
Sarnia/Lambton provides guided community-based, WMS in the client’s home and in a day-
program format.
The evidence of literature reviews observe that many people can successfully withdraw from
alcohol and drugs at home, without going to a bedded centre if they have the right supports.
Establishment of community-based WMS as an option for Windsor/Essex and Chatham-Kent
residents should be explored further as a more cost-effective, client-centred, responsive
treatment option. Table 12 shows the 2014-2015 fiscal year data for both WMS programs in
ESC LHIN.28
Table 12: Withdrawal Management Data, Erie St. Clair LHIN, 2014-2015 Fiscal Year
Provider Total # of unique FTEs LHIN Cost Per Wait
individuals Funding Client time
served
Hôtel-Dieu Grace 1,673 13 $1,086,335 $649 none
Healthcare
(residential)
Bluewater Health 226 7.2 $667,629 $2,954 none
(community and day
programs)
In fiscal year 2014-2015, 1,899 individuals were served. Of note, it is not unusual for cohorts of
the population to access bedded WMS frequently. Given this observation, a deeper clinical
analysis should be undertaken to better understand if
other treatment options could serve this population “Programs need to go from
group more effectively. Detox to treatment with NO lag
time”- Person with Lived
Funding for both WMS programs represents 17 per Experience
cent of the total ESC LHIN addiction allocations. (See
Figure 12.)
28 All service data was extracted from the 2015-2016 CAPS submission.
31Residents of Chatham-Kent access bedded WMS in Windsor or outside the Erie St. Clair region
in London (Centre of Hope). Regional transportation to access WMS is provided by Westover
Treatment Centre. In fiscal year 2014-2015, 53 people from the ESC region were transported to
WMS by 61 volunteers (Westover Alumni and self-help program). People access this service by
calling Westover’s 24/7 help-line. In fiscal year 2014-2015, 920 calls were received (838
anonymous and 82 self-identified). Of interest, it is observed that, the transportation/phone help-
line service is reported as community WMS encounters. This observation is a good example of
how easily data quality and reporting discrepancies can occur resulting in misinterpretation (The
issue exists because there is no Ministry reporting category that accurately matches
transportation to access MH&A services).
4.1.2. Addiction Assessment and Referral, and Counselling
Assessment and Referral (A&R) is conducted using standardized tools that measure the
severity of the addiction and link individuals to appropriate services based on need. Referrals for
addiction counselling, residential services including MMT, are initiated through A&R. Referrals
are not restricted by LHIN borders (as shown in Figure 3). Services accurately matched with
client needs result in greater treatment completion rates and better post-treatment outcomes.
The literature stresses that as a point of entry, assessment and referral is a critical component
within a high functioning, comprehensive continuum of care. Provincially, a new assessment
and short screening tool (known as GAINs) has been introduced as a mandatory requirement
for A&R.
In the Erie St. Clair region, A&R are co-located with the WMS site in Windsor. In Chatham-Kent
and Sarnia/Lambton, however, A&R is part of the broader counselling team. Until recently, A&R
was statistical captured and reported separately from counselling treatment. This means that
the number of individuals receiving an assessment and referral are now combined with the
number of people receiving counselling. This observation is problematic given that one-half (49
per cent) of all Erie St. Clair residents seeking addiction assistance are ultimately referred for
treatment in other LHINs, as shown in Figure 3. From a system perspective, the statistical
bundling of these two services negatively impacts reporting, accountability, and most
importantly, the ability to monitor true treatment capacity, access and effectiveness. Table 13
compares A&R separately vs. A&R combined with counselling data from fiscal years 2013-2014
and 2014-2015 as an illustration.
Table 13: Assessment, Referral, and Counselling, Fiscal Years 2013-2014 and 2014-2015
13-14 Assessment and Referral 14-15
(MIS Quarterly Reports A&R and Counselling)
Facility FTEs Individuals Budget FTEs Individuals Actual
Served ($) Served ($)
HDGH 2 452 118,994 2.7 751 238,236
CKHA 2 687 160,000 5.32 554 530,686
BWH 4.3 965 607,076 4 304 476,122
32You can also read