RENEWABLE ENERGY BENEFITS - LEVERAGING LOCAL CAPACITY FOR OFFSHORE WIND
←
→
Page content transcription
If your browser does not render page correctly, please read the page content below
RENEWABLE
ENERGY BENEFITS
LEVERAGING LOCAL CAPACITY
FOR OFFSHORE WIND
© IRENA 2018
Unless otherwise stated, material in this publication may be freely used, shared, copied,
reproduced, printed and/or stored, provided that appropriate acknowledgement is given of
IRENA as the source and copyright holder. Material in this publication that is attributed to third
parties may be subject to separate terms of use and restrictions. Appropriate permissions
from these third parties may need to be secured before any use of such material.

ISBN 978-92-9260-063-1

This publication should be cited as: IRENA (2018), Renewable Energy Benefits: Leveraging
Local Capacity for Offshore Wind, IRENA, Abu Dhabi.

PHOTO CREDITS
Page 24, 26, 31, 33, 35, 37, 42 and 44, Ørsted Wind Power
Other images are from Shutterstock.
ABOUT IRENA

The International Renewable Energy Agency (IRENA) is an intergovernmental organisation that supports
countries in their transition to a sustainable energy future, and serves as the principal platform for
international co-operation, a centre of excellence, and a repository of policy, technology, resource and
financial knowledge on renewable energy. IRENA promotes the widespread adoption and sustainable use of
all forms of renewable energy, including bioenergy, geothermal, hydropower, ocean, solar and wind energy,
in the pursuit of sustainable development, energy access, energy security and low-carbon economic growth
and prosperity. www.irena.org

ACKNOWLEDGEMENTS

This report was developed under the guidance of Rabia Ferroukhi (IRENA) and authored by Celia Garcia-
Baños, Diala Hawila, Michael Renner, and Abdullah Abou Ali (IRENA), with the support of Deloitte Advisory
S.L.
The report benefited from contributions by Iván Pineda, Tom Remy (WindEurope), Andreas Wagner
(Stiftung Offshore-Windenergie), Bautista Rodríguez Sánchez (EDP Renováveis), Jon Dugstad, Sjur Eigil
Bratland and David Ottesen (Norwegian Energy Partners), Arslan Khalid (consultant), Emanuele Bianco
(IRENA) and leading companies from private sector.

DISCLAIMER

This publication and the material herein are provided “as is”. All reasonable precautions have been taken
by IRENA to verify the reliability of the material in this publication. However, neither IRENA nor any of
its officials, agents, data or other third-party content providers provides a warranty of any kind, either
expressed or implied, and they accept no responsibility or liability for any consequence of use of the
publication or material herein.
The information contained herein does not necessarily represent the views of the Members of IRENA. The
mention of specific companies or certain projects or products does not imply that they are endorsed or
recommended by IRENA in preference to others of a similar nature that are not mentioned. The designations
employed and the presentation of material herein do not imply the expression of any opinion on the part
of IRENA concerning the legal status of any region, country, territory, city or area or of its authorities, or
concerning the delimitation of frontiers or boundaries.
RENEWABLE ENERGY BENEFITS
LEVERAGING LOCAL CAPACITY FOR OFFSHORE WIND

         TABLE OF CONTENT

		KEY FACTS . . . . . . . . . . . . . . . . . . . . . . . . . . . . . . . . . . . . . . . . . . . . . . . .           6

		INTRODUCTION . . . . . . . . . . . . . . . . . . . . . . . . . . . . . . . . . . . . . . . . . . . .                8

1.   		 TRENDS IN THE OFFSHORE WIND ENERGY SECTOR                                                                    10

2. 		    POTENTIAL FOR VALUE CREATION FROM THE
         DEPLOYMENT OF OFFSHORE WIND                                                                                 13

		2.1          Jobs in offshore wind. . . . . . . . . . . . . . . . . . . . . . . . . . . . . . . . . . . . . .  13

         2.2   Potential for synergies with offshore oil and gas . . . . . . . . . . . . . . . . . . .  17

3 . 		   REQUIREMENTS FOR OFFSHORE WIND DEVELOPMENT                                                                  20

         3.1   Project planning. . . . . . . . . . . . . . . . . . . . . . . . . . . . . . . . . . . . . . . . . . 20

         3.2   Procurement . . . . . . . . . . . . . . . . . . . . . . . . . . . . . . . . . . . . . . . . . . . .  23

         3.3   Manufacturing. . . . . . . . . . . . . . . . . . . . . . . . . . . . . . . . . . . . . . . . . . .  25

         3.4   Transport. . . . . . . . . . . . . . . . . . . . . . . . . . . . . . . . . . . . . . . . . . . . . . . 28

         3.5   Installation and grid connection. . . . . . . . . . . . . . . . . . . . . . . . . . . . . . . 30

         3.6   Operation and maintenance . . . . . . . . . . . . . . . . . . . . . . . . . . . . . . . . .  32

         3.7   Decommissioning . . . . . . . . . . . . . . . . . . . . . . . . . . . . . . . . . . . . . . . .  35

4. 		    CONCLUSIONS                                                                                                 38

		ANNEX A - COMPONENTS OF AN OFFSHORE WIND FARM                                                             . . . .  40

		REFERENCES . . . . . . . . . . . . . . . . . . . . . . . . . . . . . . . . . . . . . . . . . . . . . .             43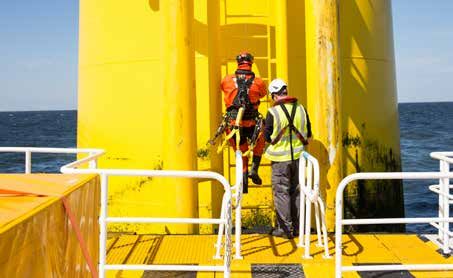
LIST OF FIGURES, TABLES AND BOXES

Figure 1.1		Trend in the global weighted average total costs of installed offshore wind capacity,
             (2010-17)..................................................................................................................................................................10
Figure 1.2                 Main components of an offshore wind farm ........................................................................................... 12
Figure 2.1 	Estimated cumulative capacity, investments and employment in wind, 2017, 2030
             and 2050................................................................................................................................................................. 13
Figure 2.2                 Value chain of offshore wind..........................................................................................................................14
Figure 2.3 	Distribution of human resources required along the value chain for the development
             of a 500 MW offshore wind farm ............................................................................................................... 15
Figure 2.4                 Cost breakdown of an offshore wind farm reaching final investment decision in 2020.......16
Figure 3.1 	Distribution of human resources required for the project planning
             of a 500 MW offshore wind farm, by occupation ................................................................................ 22
Figure 3.2                 Materials needed to develop a 500 MW offshore wind farm (tonnes) .......................................23
Figure 3.3                 Distribution of human resources required for the procurement
                           of a 500 MW offshore wind farm, by occupation ................................................................................25
Figure 3.4 	Distribution of human resources required to manufacture the main components
             of a 500 MW offshore wind farm, by occupation................................................................................. 27
Figure 3.5 	Distribution of human resources required to transport the components
             of a 500 MW offshore wind farm, by occupation.................................................................................30
Figure 3.6                 Distribution of human resources required to install and connect
                           a 500 MW offshore wind farm, by occupation...................................................................................... 32
Figure 3.7		Distribution of human resources required to operate and maintain
             a 500 MWoffshore wind farm, by occupation........................................................................................ 35
Figure 3.8 	Distribution of human resources required to decommission
             a 500 MW offshore wind farm, by occupation...................................................................................... 37
Figure A.1 	Fixed-bottom foundations used in the offshore wind industry..................................................... 40
Figure A.2 	Offshore wind floating foundation.............................................................................................................. 41

Table 3.1                  Human resources required for the project planning of a 500 MW offshore wind
                           farm (person-days) and breakdown by activity ....................................................................................21
Table 3.2                  Human resources required for the procurement of a 500 MW offshore wind
                           farm (person-days) and breakdown by activity ...................................................................................24
Table 3.3                  Human resources required to manufacture the main components of a 500 MW
                           offshore wind farm (person-days) and breakdown by main component .................................26
Table 3.4                  Materials needed to manufacture the main components of a 8 MW offshore wind
                           turbine (tonnes)...................................................................................................................................................28
Table 3.5                  Human resources required to install and connect of a 500 MW offshore wind farm
                           (person-days) and breakdown by activity................................................................................................31
Table 3.6                  Human resources required to operate and maintain a 500 MW offshore wind farm
                           (person-days per year) and breakdown by activity ...........................................................................33
Table 3.7                  Distribution of human resources required to decommission a 500 MW
                           offshore wind farm, by activity.....................................................................................................................36

Box           i.1 	IRENA’s work on renewable energy benefits............................................................................................ 8
Box           1.1 	The design of policies to support offshore wind energy..................................................................... 11
Box           1.2 	Developments in the main components of offshore wind projects............................................... 12
Box           2.1 	Synergies between offshore oil and gas and offshore wind in the installation phase............18
Box           2.2          Policies and measures to facilitate re-skilling of oil and gas workforce
                           for offshore wind industry...............................................................................................................................19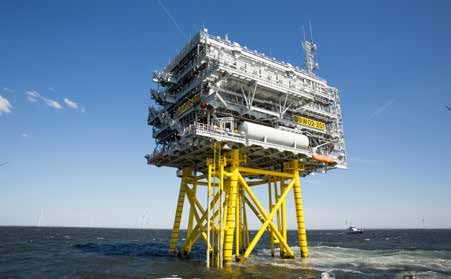
KEY FACTS
    OFFSHORE WIND

6
RENEWABLE ENERGY BENEFITS

»   The cumulative installed capacity of offshore wind energy rose from
    67 megawatts (MW) in 2000 to around 20 gigawatts (GW) in 2017. IRENA expects
    continued growth to 128 GW by 2030 and 521 GW by 2050. Cumulative investments
    in offshore wind are projected to reach USD 350 billion by 2030 and USD 1.47 trillion
    by 2050.

»   Along the way, ample opportunities arise for local value creation. Local income
    generation and job creation in the sector can be maximised by leveraging existing
    economic activities and building domestic supply chains. In particular, offshore wind
    energy can benefit from the many synergies in skills and occupational patterns that
    it shares with the offshore oil and gas sector.

»   The interaction of the offshore wind energy industry with other economic sectors
    generates additional revenue, both through supply chain activities and through
    induced demand for goods and services.

»   IRENA estimates that the wind sector employed 1.1 million people in 2017. Most of
    these jobs are in the larger and more mature onshore segment. By 2050, the wind
    sector can potentially create up to 2 million jobs.

»   In total, the development of a typical 500 MW offshore wind farm requires around
    2.1 million person-days of work.

»   The labour requirements vary across the value chain, with a heavy concentration
    in manufacturing and procurement (59 percent of the total). The manufacturing of
    equipment offers the bulk of job opportunities in the sector.

»   Countries that do not have a sufficient capacity to manufacture equipment locally
    can derive jobs and other benefits in segments of the value chain that are easier to
    localise. For example, O&M accounts for 24 percent of total labour requirements;
    installation and grid connection represents another 11 percent of the total.

»   In order to avoid skills gaps, educational and training programmes need to be
    attuned to the emerging needs in the offshore wind industry. Training and skill-
    building form an important part of efforts to generate capable local supply chains.

»   Maximising local value creation depends on successfully leveraging existing
    expertise and capacities in other industries that can provide expertise, raw
    materials and intermediate products. In particular, steel, copper, lead and
    fiberglass are heavily used for the development of an offshore wind project.

»   To strengthen the industrial capability of domestic firms, policy measures and
    interventions are needed that contribute to increased competitiveness. Measures
    include industrial upgrading programmes, supplier development programmes,
    promotion of joint ventures, development of industrial clusters and investment
    promotion schemes.

                                                                                            7
INTRODUCTION
Renewable energy and energy efficiency 15 percent increase. As for jobs, the transition could
technologies, with their increasing maturity and greatly boost overall employment in the energy sector
cost-competitiveness, can help bring economic and and the shift to renewables would create more jobs
environmental objectives into closer alignment. The than are lost in the fossil fuel industry. The same
energy transition can only be considered within the pathway would result in the loss of 7.4 million jobs in
framework of the broader socio-economic system fossil fuels by 2050, but 19.0 million new jobs would be
and changes in the energy sector have impacts created in renewable energy, energy efficiency, and
throughout the broader economy. Achieving the grid enhancement and energy flexibility, for a net gain
energy transition would have significant socio- of 11.6 million jobs (IRENA, 2018a).
economic impacts. The latest analysis by the At the regional level, the outcome of the energy
International Renewable Energy Agency (IRENA) transition depends on regional ambition as well
shows that accelerating the deployment of renewable as regional socio-economic structures. Despite
energy and energy efficiency as required to move fluctuations in GDP and employment, welfare will
towards a more sustainable development path (the improve significantly in all regions. However, as is
REmap Case),1 generates a number of benefits in terms the case with any economic transition, there will be
of gross domestic product (GDP), human welfare and regions and countries that fare better than others
employment relative to the Reference Case2. due to diverging structures, capacities and dynamics.
At the global level, the energy transition generates Policy makers can help to make the transition process
a 1 percent increase in GDP by 2050, compared to a just one by supporting the transition in the context
the Reference Case. The socio-economic benefits go of energy access, adopting social protection measures
well beyond GDP improvements, including marked for people dependent on declining industries
social and environmental benefits, or welfare, with a (including fossil fuels) and initiating economic
Box i.1 IRENA’s work on renewable energy benefits
This study is the latest edition in a series that analyses the opportunities for value creation through the
deployment of renewable energy technologies, that started with large-scale solar photovoltaics and onshore
wind (2017). The series is part of a body of work by IRENA that began in 2011 that analyses the socio-economic
benefits of renewable energy. It includes the Renewable Energy and Jobs: Annual Review (published yearly
since 2014), the Global Energy Transformation: A roadmap to 2050 (2018), the Perspectives of the Energy
Transition (2017), and Renewable Energy Benefits: Measuring the Economics (2016), among others.
These and other reports can be downloaded from www.irena.org/Publications.
2011 2012 2013 2014 2015 2016 2017 2018
IRENA
IRENA woRkINg pApER
Renewable Energy
International Renewable Energy Agency
Jobs & Access Renewable Energy and Jobs
A SERIES OF CASE STUDIES
Renewable Energy and Jobs Annual Review 2015
Burkina FasovBiomass
Renewable Energy and Jobs Annual Review 2014
Renewable
PROJECT PROFILE
FAFASO (“Foyers Améliorés au Faso” i.e., improved stoves in Burkina Faso) is a Dutch-German Energy Partner-
ship Energising Development (GIZ-EnDEV) project that commenced in 2006 and is supported by co-financing
Energy Jobs: from the Dutch Foreign Ministry (DGIS) and the German Ministry of International Cooperation (BMZ).
FAFASO covers all of Burkina Faso, with a focus on the biggest towns, Ouagadougou and Bobo Dioulasso, as well
as the South-western and Eastern regions. The project helps to disseminate improved cookstoves (ICS) that save
35–80% of wood or charcoal compared to the traditional three-stone-fire. In 2006–2011, about 180 000 ICS were
sold to households, institutions and productive units.
Most of the stoves disseminated are mobile, metal household stoves that are 35–45% more efficient. For poorer
StAtUS, PROSPECtS & POlICIES households, a mobile ceramic stove is also available and saves 40% fuel.
In addition, FAFASO offers big mobile metal stoves for restaurants and school canteens (saving around 60%) as
well as mud stoves for traditional beer brewing (saving about 80%).
BIOfUElS AND gRID-CONNECtED The overall objective was to train ICS producers and help them sell the stoves commercially, so that dissemination
would continue even in the absence of subsidies.
ElECtRICIty gENERAtION The project entails marketing (large-scale efforts via TV and radio, small-scale cooking demonstrations, sales
events, etc.), introduction of an ICS quality label, and efforts to strengthen the commercial supply chain.
Renewable Energy
JOBS AND TRAINING
Two thirds of the overall budget of USD 3.2 million (up to late 2011) has gone into training and marketing efforts;
Jobs & Access
fixed costs for project personnel, etc. account for one third.
A typical training session involves an average of 30 trainees. By the end of 2010, FAFASO had trained a total
of 729 people — 285 metal smiths, 264 masons, and 180 potters. The numbers expanded dramatically in 2009,
when the project began to train masons and potters. In 2010, when very few potters were trained, the numbers
were smaller.
These numbers cannot be considered to constitute new jobs. Rather, the individuals concerned are experienced
craftsmen. The training offers them higher qualifications and an opportunity for a sustained role for themselves
in the market. Many of the metal smiths and masons do employ apprentices.
Most of the potters are women in rural areas, whose main occupation remains work in the field and the household.
But they acquire knowledge that helps them generate additional income (and cope with competition from plastic
products). Pottery is caste-bound work dominated by certain families that are unlikely to employ apprentices.
As part of the training, all producers are taught to calculate the prices for the stoves, putting them in a better
position in markets.
SUPPLY CHAIN
Upstream Linkages
2015
The stoves are produced domestically, in a decentralised, small-scale fashion. In general, the materials used
are indigenous. Previously imported scrap metal is now locally procured, but this does not necessarily indicate
December 2013
increased demand and jobs. MAY 2014
June 2012
RENEWABLE
ENERGY
BENEFITS:
MEASURING THE
ECONOMICS
1
I RENA’s REmap 2030 and 2050 IRENA’s global roadmap for scaling up renewables, known a s REmap. The roadmap, suggests that renewables can make up 60
percent or more of many countries’ total final energy consumption (TFEC). Further details are available at www.irena.org/remap
2
The Reference Case is based on current and planned policies including Nationally Determined Contributions (NDCs).
8
RENEWABLE ENERGY BENEFITS

diversification investments. In addition, supporting                        to support informed decisions in policy-making to
initiatives that help build and strengthen domestic                         maximise value creation from the development of a
supply chains capable of responding to new economic                         domestic offshore wind industry while leveraging
opportunities is crucial to achieve a successful global                     existing industries, and contribute to a just energy
energy transition.                                                          transition.

This study analyses the potential of the offshore wind                      The scope of the study is global; therefore, the data
industry to participate in the energy transition through                    presented in the report were obtained through surveys
the opportunities it offers for local value creation for                    and interviews with internationally recognised experts
countries that choose to develop the technology. The                        and from desktop research that gathered information
report starts with an overview of trends and drivers in                     published by leading companies and specialised
the sector (Section 1). It then analyses the potential for                  institutions in the offshore wind industry. A significant
value creation in terms of jobs and income along the                        number of leading stakeholders were interviewed and/
segments of the value chain with a focus on synergies                       or responded to questionnaires on the requirements
with the offshore oil and gas sector (Section 2).                           to develop an offshore wind industry. They included
Section 3 goes into the activities in each segment of                       project developers, component manufacturers,
the value chain to analyse requirements for developing                      service providers, energy authorities and national and
a sector focusing on human resources, skills and                            global associations for wind and renewable energy.
materials. The objective is to provide policy makers                        The study also draws on public reports of wind
with an understanding of what is required to develop                        energy companies, including annual reports, technical
a local industry and the existing capabilities that                         specifications and equipment handbooks, and public
can be leveraged or potentially developed to do so.                         price lists. 3
Finally, a set of recommendations are presented

3
    Public information from the following institutions has been taken into consideration in the elaboration of the assessment: Adwen, E.ON, EDF,
     EDP Renováveis, Elia, Energinet, ENTSO-E, Exide, General Electric, Global Wind Energy Council, Iberdrola, MHI Vestas, National Grid, Ørsted
     A/S (previously DONG), RWE, Siemens-Gamesa, SIF, SP Energy Networks, SPE Group, SSE, Statkraft, Statnett, Stattoil, Stiftung Offshore-
     Windenergie, Vattenfall, WindEnergie e.V. and WindEurope.
                                                                                                                                                    9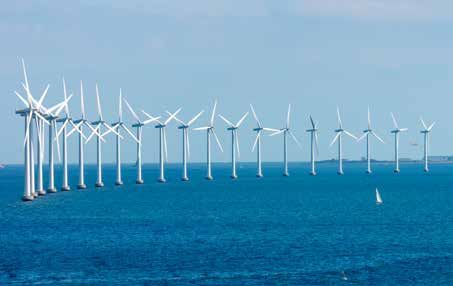
1.   TRENDS IN THE OFFSHORE WI ND ENERGY SECTOR

          1. TRENDS IN THE OFFSHORE WIND ENERGY SECTOR

          In the last two decades, the installed capacity                      advanced technology started to be used. After
          of offshore wind energy rose steadily increasing                     that year, projects became larger and the industry
          from 67 megawatts (MW) in 2000 to almost                             standardised the use of new wind turbines and
          20 gigawatts (GW) in 2017 (IRENA, 2018d). Higher                     optimised manufacturing processes, giving
          annual increases in the last three years have been                   developers the chance to offset some of the cost
          driven by falling costs, targeted policies, and                      increases related to siting projects further from shore
          technological advancement.                                           and in deeper waters. The global weighted average
          The total installed cost of offshore wind decreased                  installed costs decreased by 22 percent, from
          by about 13 percent between 2010 and 2011 after                      USD 5 452 per kilowatt (kW) in 2013 to
          which it climbed by almost 44 percent reaching                       USD 4 239 in 2016 (Figure 1.1) (IRENA, 2018c). It
          a peak in 2013 (Figure 1.1) as projects moved                        should be noted that the cost depends heavily on
          farther from shore into deeper waters and more                       the distance to shore and the water depth.

          Figure 1.1                    Trend in the global weighted average total costs of installed offshore wind
                                        capacity, (2010-17)
                                                               Total installed cost
                                         7 000

                                        6 000

                                        5 000
                          2016 USD/kW

                                        4 000

                                        3 000

                                        2 000

                                        1 000

                                            0
                                                 2010   2011    2012   2013   2014   2015   2016    2017

          Source: IRENA (2018c).

10
RENEWABLE ENERGY BENEFITS
The falling cost of technology was reflected in in Denmark (by almost 25 percent) and in the
the price of electricity generated by offshore Netherlands (by almost 30 percent). In 2017,
wind, driven by policies such as auctions. Several Germany held its first auction for offshore wind
policy options exist to drive the sector such as where developers showed high confidence in the
administratively set tariffs, technology-specific
industry. Out of the four winning projects, three
quotas or auctions (IRENA, 2018e). Offshore
(1 380 MW out of the total 1 490 MW) offered a
wind auctions are adopted in a growing number
strike price of EUR 0/MWh meaning that they did not
of countries, including China, Denmark, France,
Germany, Japan, the Netherlands and the United request any support on top of wholesale electricity
Kingdom. In 2016 alone, the generating prices of prices (IRENA, 2017a). These developments were
auctioned offshore wind projects fell by 22 percent mainly driven by a supportive auction design that
(BNEF, 2016). Prices decreased substantially instilled investor confidence (Box 1.1).
Box 1.1 The design of policies to support offshore wind energy
Policy instruments, such as auctions, can be designed in a way to increase investor confidence
resulting in lowered prices, among other potential objectives that could be achieved:
Site-specific auctions can help reduce investor risks and transaction costs. They reduce project
developers’ risks and facilitate obtaining necessary permits and documentation by centralising this
task to the government. In addition, qualification requirements tend to be less stringent in site-
specific auctions, since sites are pre-determined and bidders only need to prove their technical
and financial capability to deliver the project. Indeed, site-specific auctions have been the norm
for offshore wind auctions in China, Denmark, Germany, Japan, the Netherlands and the United
States. Pre-selecting a site typically implies that the installed capacity and grid interconnections are
determined beforehand, allowing policy makers and project developers to concentrate their efforts
on the particular challenges and features of the chosen site.
How winners are selected can affect the resulting price. Most countries, including Denmark, the
Netherlands, the United Kingdom, and the United States, have adopted a minimum-price criterion
to select the winner. In Japan, however, a weighted score considering multiple aspects was used,
highlighting other important policy objectives besides attaining the minimum price possible.
The contract design and sellers’ liabilities affect investor interest. The price outcome is heavily
impacted by: the date of project delivery; structure of the contract, including the remuneration
profile of the developer; and the penalties and liabilities involved. One very important factor that
contributed to the low bids in the German offshore auction is the date of project delivery, which is
not until 2024–25 for most of the projects. Projects commissioned in later years are expected to
incur lower technology costs, as turbine and construction costs decline and technology advances
(e.g., bigger and more corrosion-resistant turbines). In contrast, projects awarded in the United
Kingdom are expected to come online between 2017 and 2019, leaving little time for costs to fall.
Source: IRENA, 2017a.
11Technological advancement and innovation Together, these developments are making offshore
driving the sector include bigger turbines, wind competitive on a large scale (IRENA, 2016c).
enhanced construction know-how, experimental In addition, some developments in the sector
technologies such as floating platform solutions, have also contributed to falling technology costs
continuous improvements in foundation design and electricity prices and they include a growing
and installation methods (Box 1.2). Developments and competitive supply chain, cross-industry
in access, operation and system integration collaboration, and economies of scale (IRENA,
have also permitted moves into deeper waters, 2016a). Meanwhile, the investment climate for long-
further from shore, to reach larger sites with term infrastructure projects has been favourable in
better wind resources. recent years, expanding access to finance.
Box 1.2 Developments in the main components of offshore wind projects
The main components of an offshore wind farm are the turbine (including rotor, nacelle, tower and
cabling), the turbine foundation, and the onshore and offshore substations (Figure 1.2). See Annex A
for a more detailed description.
The most essential developments in the offshore wind energy sector are related to the foundation,
typically needed to support the turbine in offshore waters. In recent years, the development of floating
turbines for deeper water (more than 50 meters deep) has eliminated the need for a foundation,
allowed developers to tap into areas with the largest wind potential and overcome constraints
related to depth, while benefitting from less invasive activity on the seabed during installation. More
details on floating foundations can be found in Annex A.
Figure 1.2 Main components of an offshore wind farm
Direct-drive conversion
Nacelle Blades
Hub
Tower
Offshore substation Onshore substation
Foundation Connecting cables
Source: Siemens, n.d.
Considering the most recent trends and the latest can be seen as a very promising technology with
developments in the sector, offshore wind energy potential for creating local value.
122. POTENTIAL FOR VALUE CREATION FROM THE DEPLOYMENT
RENEWABLE
OF OFFSHORE
ENERGY WIND
BENEFITS
2. P OTENTIAL FOR VALUE CREATION FROM THE DEPLOYMENT OF
OFFSHORE WIND
In IRENA’s REmap 2050 scenario, total wind in the sector of about USD 350 billion by 2030 and
installed capacity is expected to reach 2 906 GW USD 1.47 trillion by 2050 (IRENA 2018a). These
by 2030 and 5 476 GW by 2050 with cumulative developments can present ample opportunities
investments in the sector of about USD 4.34 trillion for local value creation in countries deploying
by 2030 and USD 11.96 trillion by 2050. Out of offshore wind, with considerable benefits such
the total, the deployment of offshore wind is as jobs and income, depending on the
expected to reach 128 GW by 2030 and extent of which activities are carried out
521 GW by 2050 with cumulative investments domestically.
2.1. Jobs in offshore wind
The wind sector currently supports 1.1 million 2050. Designing policies to maximise the local
jobs, and could support more than 2.2 million benefits from the deployment of offshore
jobs in 2030 and up to 2 million jobs in 2050 wind requires an analysis of where the jobs
(Figure 2.1) (IRENA, 2018a). In offshore wind, are created along the different segments of
many of the newly created jobs could be the value chain. This section analyses jobs in
filled by labour previously employed in the offshore wind: their concentration in the value
fossil fuel sector. Figure 2.1 presents the chain and the potential of the offshore wind
estimated cumulative capacity, investments sector to welcome labour affected by the energy
and employment in wind, in 2017, 2030 and transition.
Figure 2.1 Estimated cumulative capacity, investments and employment in wind, 2017,
2030 and 2050
5 476 Cumulative
installed capacity
(GW)
2 905
Jobs (millions)
514
2
1.1 2.2 $
11.96 Cumulative investment
0.107 4.34
(USD trillion)
2017 2030 2050
Note: Investment in 2017 is annual, not cumulative.
Source: Based on IRENA, 2018a; IRENA, 2018b; Frankfurt School-UNEP Centre/BNEF, 2018.
132. POTENTIAL FOR VALUE CREATION FROM THE DEPLOYMENT OF OFFSHORE WIND
The analysis of the distribution of jobs along the It is estimated that a total of 2.1 million
different segments of the value chain focuses on person-days is needed to develop an offshore
its core segments: project planning, procurement, wind farm of 500 MW. This is an estimate of direct
manufacturing, transport, installation and grid jobs and does not include indirect or induced jobs,
connection, operation and maintenance (O&M), derived from the economic activity of the offshore
and decommissioning (Figure 2.2).4 wind farm.
Figure 2.2 Value chain of offshore wind
For a 500 MW offshore wind farm
TOTAL
2.1 Million
person- days Project Planning
Grid Operation and Decommis-
Procurement Manufacturing Transport Installation
Connection Maintenance sioning
Consulting
Administrative Activities
Education
Support
Services Policy Making
Financing
Research and Development
4
O ther activities from various sectors that support deployment (support services) include financial services, insurance, consulting, education and training, research,
development and innovation, policy making, and administrative activities. Many of these activities can be developed locally, but analysis of the support services is
beyond the scope of this study.
14RENEWABLE ENERGY BENEFITS
As illustrated in Figure 2.3, labour requirements equipment offers the bulk of job opportunities in
vary across the value chain. There is a heavy the sector, countries that do not opt to manufacture
concentration in manufacturing and procurement equipment locally can benefit from considerable
(59 percent of the total), O&M (24 percent),5 as well opportunity for job creation in other segments that
as installation and grid connection (11 percent). are always localised, such as O&M and installation
This shows that although the manufacturing of and maintenance.
Figure 2.3 D
istribution of human resources required along the value chain for the
development of a 500 MW offshore wind farm
5% 1%
Project planning
Decommissioning
11 % 0.1 %
Installation and
Transport
59%
grid connection Manufacturing and
24 % procurement
Operation and
maintenance
TOTAL
2.1 Million
person-days
An assessment of the types of jobs created in order The breakdown of costs in offshore wind projects
to provide policy makers with an understanding of provides an indication of where value can be
the human resources and skills required to produce, created. Figure 2.4 shows the cost breakdown
install and decommission offshore wind plants is of a 500 MW offshore wind farm in Scotland
presented in Section 3. reaching final investment decision in 2020 using
In addition to job creation, value is created through 8 MW turbines, on jacket foundations, in
economic activities in the sector. Those are related 45m water depth, 40 km from shore (total cost
to the procurement of materials, the installation estimated at EUR 5.4 billion) (Scottish Enterprise,
of turbines, O&M activities, among others. 2017).
5
The number of person-days required for the first year of O&M is estimated to be 25 070. The total represents the cumulative person-days over 25 years of project
lifetime, assuming average labour productivity improvements of 2 percent a year (Rutovitz, Dominish, and Downes, 2015).
152. POTENTIAL FOR VALUE CREATION FROM THE DEPLOYMENT OF OFFSHORE WIND
Figure 2.4 Cost breakdown of an offshore wind farm reaching final investment decision
in 2020
4% 3%
Decommissioning Development and project
11 % management
Installation and commissioning
17 %
Balance of plant
Country: Scotland
Capacity: 500 MW
Turbine Power Rating: 8 MW
Water Depth: 45 m
Distance from Shore: 40 km
Foundation Type: Jacket
25 %
Turbine 40 %
Operation, maintenance
and service
Source: Scottish Enterprise, 2017.
As shown in figure 2.4, the bulk of the cost This breakdown differs from that of onshore wind
goes into O&M. Although the percent of total costs, where the cost of wind turbines represents
cost that goes into O&M varies greatly among between 66 and 84 percent of the total cost
countries, according to the cost of labour, the (IRENA, 2017b). This is due to the additional balancing
example of Scotland can be used to demonstrate costs of foundations and cables and substations,
the potential for value creation in this segment the expense of operating offshore and designing
of the value chain in countries with similar requirements for the harsh marine environment.
conditions, such as European countries. The Whether departing from a locally established oil
second largest cost component is the turbines, and gas industry or an economy relying on energy
and this also depends on the level of access to imports, the potential to generate income and create
equipment of countries and how far they need jobs from the deployment of offshore wind will
to be imported in cases where they are. The depend on the extent to which the local industry can
figure also shows great potential for value leverage existing economic activities and create new
creation in the balance of plant (supply of ones. As the world transitions from a fossil-fuel based
cables, foundations, and offshore and onshore energy sector to one that relies on renewables, there
substations) and in installation and grid are many synergies that can be leveraged with the
connection (Scottish Enterprise, 2017). offshore oils and gas sector.
16RENEWABLE ENERGY BENEFITS
2.2 Potential for synergies with offshore oil and gas
The global energy system must undergo a deep support the building of foundations and towers
transformation to evolve from its present reliance for offshore wind farms (Hülsen, 2012).
on fossil fuels to a focus on renewable energy. The As the offshore wind energy sector grows, it
share of renewable energy must rise from around offers greater opportunities for individuals
18 percent of total final energy consumption and businesses from the offshore oil and gas
(in 2015) to around two-thirds by 2050 sector in different segments of the offshore
(IRENA, 2018a). wind value chain (IRENA, 2017b; knowRES,
This transformation will come about as 2016; Scottish Enterprise, 2017):
investments shift from fossil fuels to renewables Project planning. Large surveying
(as well as to greater energy efficiency), companies from the oil and gas sector
with wide implications for the economy,
are already offering a full range of services
including employment. IRENA’s latest macro-
covering environmental, geophysical and
econometric modelling suggests that the energy
geotechnical surveying and even offshore
transformation required to meet the
installation. Moreover, oil and gas companies
decarbonisation and climate mitigation goals
are already offering skills in managing complex
set out in the Paris Agreement would result in
projects offshore given the similarities between
the loss of around 7.4 million jobs in the fossil
the two sectors in the marine environment,
fuel sector by 2050, compared with business
the common challenges of working in a harsh
as usual. But in terms of sheer numbers, this
environment and the resulting implications
loss is more than offset by a gain of jobs in the
for health and safety, for instance. In fact,
renewable energy sector, which are projected
a number of companies with a background
to rise from close to 10.3 million in 2017 to
in oil and gas have already carried out work
28.8 million in 2050 (IRENA, 2018a).
in offshore wind, including DNV-GL, ODE,
Fossil fuel sector job loss is already an established and TNEI.
fact. In 2015 and 2016, the loss of more than
Manufacturing. Synergies with the oil and
440 000 jobs was reported in the oil and gas
gas sector relate to the manufacturing
industry worldwide, mainly due to low oil prices
of support structures. Expertise in designing and
and oversupply (Jones, 2017), rising automation in
manufacturing support structures in offshore
extraction, overcapacity, industry consolidation,
oil and gas is highly relevant, especially at more
and regional shifts in the power sector. At least
challenging deep water sites.
some sets of skills and occupational know-how
from the offshore oil and gas sector may be Installation and grid connection.
applicable to careers in offshore wind, enabling Many synergies exist in these areas
some laid-off workers to find new jobs. In some and they relate to the turbine foundations, array
cases, it will be an easy re-skilling and tailoring cables, substation structures, steelwork, and
existing skills process while in others, there installation in terms of equipment and services
will be some need for new and specific skills (Box 2.1). Some oil and gas companies have won
(CBI, 2012). Similarly, In Germany, the know-how offshore wind installation work (e.g., 3sun, Ecosse
of former shipyard workers has been leveraged to Subsea and ROVOP) leveraging on existing skills.
172. POTENTIAL FOR VALUE CREATION FROM THE DEPLOYMENT OF OFFSHORE WIND
Box 2.1 Synergies between offshore oil and gas and offshore wind in the
installation phase
Synergies in installation and grid connection between the two industries include:
Foundations. The construction and decommissioning of the foundations of an offshore wind farm are
comparable to those of an oil or gas platform, and therefore some of the expertise can be leveraged.
Traditional oil and gas manufacturers such as Bladt, EEW, Sif and Smulders have made the transition
to offshore wind. Foundation supply offers a good opportunity for increasing local content in some
markets, and a new entrant from oil and gas would be welcomed if it has sufficient infrastructure and
a good manufacturing track-record.
Array cables. Although array cable requirements slightly differ between sectors, most oil and gas
suppliers are capable of supplying offshore wind projects without significant investment. Lower tier
cable components (connectors, terminations, hang-offs and cable protection) have strong synergies
with the oil and gas sector. For instance, JDR Cables, previously a supplier to the oil and gas sector,
has become the number one array cable supplier for offshore wind projects in Europe.
Substation structures. There is significant synergy between offshore wind substations and oil and gas
platforms and accommodation modules. Substation contracts are often outsourced with developers
seeking partners with strong energy transmission or offshore marine engineering credentials. Oil
and gas suppliers can be ideal, given their understanding of the prevailing contracting models for
these types of structures and their strong track-record in a more mature sector. In fact, several large
international companies with a presence in oil and gas have been successfully supplying offshore
wind with foundations (in addition to topside structures and architectural components). These
include Bladt, Heerema, HSM Offshore and Sembmarine SLP.
Steelwork. Although offshore wind structures have different load strength requirements, leading
to differences in for example welding requirements, there is a high degree of synergy in the types
of fabrication used in both sectors with many common standards and certifications. Additional
opportunities for oil and gas suppliers include the manufacture and supply of ancillary equipment
such as flanges, cable pull and protection equipment and access systems. Oil and gas companies
such as Hutchison Engineering have been successful in winning work and in many cases, these
steel companies are active in several sectors, including civil engineering, defence and industrial
equipment and in many countries.. As such, supporting secondary steelworks is a good entry
point for companies looking to enter the sector although investment in skilled labour for specific
manufacturing requirements is likely to be the element with the longest lead-time.
Cable installation. Oil and gas suppliers have a solid track-record in cable installation and many have
successfully diversified into offshore wind such as Canyon Offshore for trenching works, DeepOcean,
Van Oord and VMBS. In addition, cable manufacturers such as Nexans and Prysmian operate in both
sectors and have the capability to install cables. However, it should be noted that cable installation is
a highly specialised and competitive market and some companies (e.g., Reef Subsea, SubOcean and
Technip Offshore Wind) have experienced financial difficulties or decided to exit from the offshore
wind sector. New entrants must become familiar with the pull-in of cables and the much larger
geographical installation areas involved.
Sources: IRENA, 2017b; knowRES, 2016; Scottish Enterprise, 2017.
18RENEWABLE ENERGY BENEFITS
Operation and maintenance. Oil and gas inspection services (e.g., Briggs Marine, 3Sun,
suppliers have considerable experience Hughes Sub Surface Engineering, Sea Energy
in maintaining assets offshore and synergies in and Sub C).
terms of planned maintenance, defect detection,
The synergies between sectors can only be
and asset repair are very strong. Moreover,
exploited with targeted policies and measures.
oil and gas offshore safety standards and
With adequate dedicated retraining policies to
maintenance practices are highly transferrable to
offshore wind and the skills required to carry out properly anticipate the required labour shift, the
underwater inspection, maintenance and repair renewable energy sector could absorb part of the
could potentially be transferred after minimal surplus workforce. Some managerial expertise,
re-training, given a highly skilled workforce soft skills and technical knowledge is in principle
and existence of a comprehensive training transferable and highly valued in the offshore
infrastructure. In fact, many oil and gas suppliers wind and other marine energy sectors (Box 2.2).
have successfully provided maintenance and
Box 2.2 Policies and measures to facilitate re-skilling of oil and gas workforce for the
offshore wind industry
The recent glut in fossil fuel prices has prompted governments and the industry to take measures to
soften the impact of sector fluctuations on the labour force.. One among them has been to launch
re-skilling programmes for the oil and gas workforce looking for opportunities in the booming
renewable energy sector. Scotland, for instance, established the GBP 12 million Transition Training
Fund to offer training opportunities to workers affected by the downturn to work in industries that
include renewables and low-carbon technologies. Several training providers in and around Scotland
are utilizing the Fund to offer training courses. Maersk Training, for example, provided oil and gas
workforce with essential safety and technical competencies required to target new roles in the wind
energy sector. Upon completion of the training, the provider also supports candidates to secure
employment opportunities utilizing its extensive industry connections.
Recognising the transferability of skills between the two sectors, industry players have also taken
steps in this direction. For example, 3sun group recruited more than 100 new technicians with the
relevant electrical, mechanical and inspection qualifications to service GBP 6 million worth of new
and extended offshore and onshore wind farm contracts. 3sun targeted local oil and gas workers
experiencing difficulties finding work; new recruits train at the 3sun academy for work in the
construction, installation and inspection of wind turbines.
Source: Transition Training Fund, n.d.; 3sun Group, n.d.
193. REQUIREMENTS FOR OFFSHORE WIND DEVELOPMENT
3. REQUIREMENTS FOR OFFSHORE WIND DEVELOPMENT
To design effective policies to support value activities related to it added EUR 36.1 billion
creation through the development of a domestic to the European Union’s GDP in 2016. Over 60
offshore wind industry, a deep and detailed percent (EUR 22.3 billion) was the direct result of
understanding of the requirements for labour, activities within the onshore and offshore wind
skills, materials and equipment is needed across energy industry, including developers, turbine and
the value chain. The analysis presented here component manufacturers, service providers and
estimates the direct person-days required to offshore wind energy substructures. The remaining
develop an offshore wind project. It should revenue (around 40 percent) was generated from
be noted, however, that indirect and induced the interaction of the wind energy industry with
effects are not included, and so the value other economic sectors. In fact, every EUR 1 000
of domestic activities goes well beyond invested in wind energy was estimated to generate
the estimates presented. According to WindEurope, EUR 250 in other economic sectors in the region
for example, the wind energy industry and (Deloitte and WindEurope, 2017).
3.1 Project planning
Activities in the project planning phase include site evaluate erosion, sedimentation, geological and
selection, environmental impact assessments, 6 wave dynamics. The engineering design stage
technical feasibility studies (including coastal, covers the technical aspects of the mechanical
wind and seabed assessments), financial and electrical systems, the civil engineering work
feasibility studies, engineering design and and infrastructure, the construction plan, and
project development. First, the resource potential the O&M model. Finally, the project development
of a site is measured and the environmental consists of administrative tasks, such as obtaining
and social impacts of the development are marine permits, licenses and approvals from
assessed in order to select the best site. Then, different authorities; managing regulatory issues;
a feasibility study is undertaken and includes negotiating and securing financing and insurance
different technical aspects such as of the coastal, contracts; contracting engineering companies;
wind and seabed characteristics is required to and managing the procurement processes.
Site selection Feasibility studies Engineering design Project development
6
To evaluate the impacts on the species living in the area, benthic (species in seabed and sediments), pelagic
(species living in the sea waters), ornithological (native birds and migration routes) and sea mammal (cetacean)
environmental surveys must be carried out.
20RENEWABLE ENERGY BENEFITS
Planning a 500 MW offshore wind about a 17 percent (4 008 person-days). Altogether,
farm requires an estimated 23 828 person- the technical assessments account for about
days of labour. Table 3.1 presents a breakdown 38 percent of the total (adding up to 9 073 person-
of the total labour force needed in project days), the seabed analysis being the most labour-
planning by activity. Project development activity intensive one. This is followed by the environmental
accounts for about 34 percent of the total impact assessment which reaches a share of
(8 012 person-days), while engineering design for 11 percent of the labour force in project planning.
Table 3.1 Human resources required for the project planning of a 500 MW offshore wind
farm (person-days) and breakdown by activity
TYPE OF Environmental Technical assessments Access
Site Financial Project Engineering Total by
HUMAN impact to grid
selection feasibility development design occupation
RESOURCE assessments Coastal Wind Seabed assessment
Ship crew - 1 830 1 296 1 350 3 456 - - - - 7 932
Legal, energy
regulation and 13 - - - - 16 32 4 006 668 4 735
taxation experts
Energy, electric,
electronic,
mechanical,
7 - - - 346 32 - - 2 004 2 389
telecom and
computer
engineers
Financial analyst - 152 - - - - 16 2 003 - 2 171
Logistic experts - - - - - - - 2 003 - 2 003
Geotechnical
7 - 432 135 692 - - - - 1 266
experts
Drilling system
- - - - 691 - - - - 691
operators
Civil engineers
(foundations 7 - - - - - - - 668 675
experts)
Naval engineers - - - - - - - - 668 668
Environmental,
sociological,
marine/biology 7 609 - - - - - - - 616
experts and
fishers
Technicians - - - 540 - - - - - 540
Physicists and
weather data 7 - - 135 - - - - - 142
experts
Total 48 2 591 1 728 2 160 5 185 48 48 8 012 4 008
23 828
)%as( (0.2%) (10.9%) (7.3%) (9.1%) (21.7%) (0.2%) (0.2%) (33.6%) (16.8%)
213. REQUIREMENTS FOR OFFSHORE WIND DEVELOPMENT
As for the skills needed (represented in Figure 3.1), are also required, accounting for 3 percent of the
the highest share – 33 percent of the total consists total (675 and 668 person-days, respectively).
of ship crew for the boats required during the Financial analysts and logistic experts required
onshore, offshore and coastal surveys (7 932 person- account for about 9 and 8 percent of the total,
days). Additionally, around 20 percent of the total respectively. This is mostly needed during the
(4 735 person-days) falls in the ‘legal, energy project development phase, when it is decided
regulation and taxation experts’ category, whether to procure manufactured components
indicating the importance of knowledge of the domestically (if available) or to import them from
offshore and local context. foreign suppliers. The cost of technology and
Expertise for such activities is often transferred enabling conditions created by policies that support
from completed projects, primarily in Europe. local manufacturing, such as taxes on imports or
However, with the appropriate education and local content requirements, affect this decision.
training, both the planning and permitting phases Physicists, including experts with wind data
could potentially offer considerable opportunities knowledge, and geotechnical experts together
for local employment. make up for around 6 percent of the total
Specialised engineers in different fields, (142 and 1 266 person-days, respectively). This
including energy, electric, electronic, mechanical, expertise can be hired from abroad or skills can
telecommunications and computer engineers be developed domestically through education and
account for 10 percent of the total (2 389 person- training policies designed to meet the future skills
days). Other engineers with civil and naval expertise needed in the sector.
Figure 3.1 Distribution of human resources required for the project planning of a 500 MW
offshore wind farm, by occupation
2% 1%
Environmental, sociological, Physicists and weather
marine/biology experts and fishers data experts
3%
3% Technicians
33 %
Naval engineers
3%
Ship crew
Civil engineers
3% (foundations experts)
TOTAL
Drilling system operators
5%
Geotechnical
23 828person-days
experts
20 %
8% Legal, energy regulation,
Logistic experts real estate and
taxation experts
9% 10 %
Financial analyst
Energy, electric,
electronic, mechanical, telecom
and computer engineers
22RENEWABLE ENERGY BENEFITS
Project planning requires equipment Technical information is crucial to identify
to measure wind resources at the site tidal and wave characteristics and climatic
selected, such as anemometers and wind features at the site (such as the topography of the
vanes along with wind energy simulators and seabed, soil characteristics and information on
programmes to measure wind speeds and marine life) that might affect a project’s structural
directions and to predict wind behaviour.7 Sonar and operational requirements or impose limitations
systems, seismic airguns, hydrophones and video on it. Information about offshore rights, protected
cameras are used to map the seabed. Computers, natural sea zones, bird migratory routes, impact
radars and software to run simulations and produce on marine life and endangered species, policies
feasibility analysis are also required. Vessels (both and regulations related to support schemes
regular fishers’ vessels and special vessels prepared for renewable energy, and grid connection is
to carry out geophysical analysis) are also often necessary to determine whether to proceed with
used. the development of an offshore wind farm.
3.2 Procurement
Offshore wind projects require equipment, and product specifications, tailored to the harsh
intermediary products and raw materials that conditions they will face: deep water, high salinity,
could be procured domestically for maximum value wave impacts, etc. Procuring such inputs requires
creation. Materials used for the manufacturing and extensive work in developing specifications
installation of an offshore farm are determined by and assessing the local availability of materials.
taking into account factors such asa resistance Figure 3.2 illustrates the quantities of materials
to corrosion, strength of material, and weight needed to develop a 500 MW offshore wind farm.8
Figure 3.2 Materials needed to develop a 500 MW offshore wind farm (tonnes)
201 241 tonnes
Low alloy and
electrical steel 190 656 tonnes
Copper
149 115 tonnes
71 033 tonnes
Lead
Steel
(grey cast 47 391 tonnes
iron)
insulation 27 066 tonnes
XLPE
6615 tonnes
Polyproylene
Fiberglass
2394 tonnes
High-alloy
Chromium
steel
504 tonnes
Pre-stressed
concrete 302 tonnes
NdFeB
material
Note: NdFeB material (also known as neodymium magnet, NIB or Neo magnet), is a permanent magnet made from an alloy of neodymium, iron
and boron.
7
Through its Global Atlas, IRENA in collaboration with the Danish Risø National Laboratory (DTU) now displays a global wind map that covers both continental areas and up to 30 km offshore.
8
Materials used in an offshore wind farm vary vastly across projects. Total amounts differ depending on the models, the distance to the shore or the depth of the seabed. For this analysis, the
offshore wind farm considered includes averaged weights for 63 direct-drive 8 MW turbines, 160 m diameter blades and 120 m height towers supported over a steel monopile foundation. Cables
are included assuming 35 000 tonnes of inner array (33 kV) and 600 000 tonnes for export cables (132 kV). Onshore and offshore substations were not considered for the purpose of the analysis.
Based on Birkeland (2011), Siemens (n.d.), The Crown Estate (n.d.), Dillinger Hütte GTS (n.d.) and Kaiser and Snyder (2012).
23You can also read