SHOULD HYBRID VEHICLES BE SUBSIDIZED? - VIRGINIA MCCONNE LL AND TOM TURREN TINE - JULY 2010 - RESOURCES FOR THE ...
←
→
Page content transcription
If your browser does not render page correctly, please read the page content below
July 2010

BACKGROUNDER
               Should Hybrid
               Vehicles Be
               Subsidized?

               Virginia McConnell and Tom Turrentine

               1616 P St. NW
               Washington, DC 20036
               202-328-5000 www.rff.org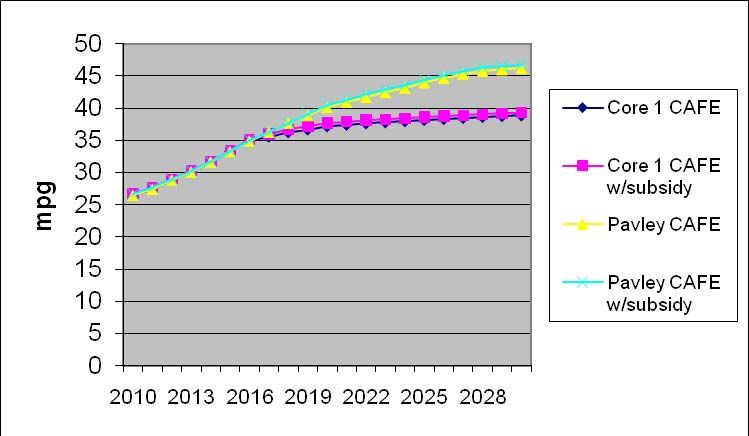
Contents

I. Executive Summary ............................................................................................................ 1

II. Hybrid Vehicles: Overview ............................................................................................... 5
     A. Background .................................................................................................................... 5
     B. HEVs .............................................................................................................................. 6
     C. PHEVs and BEVs......................................................................................................... 11
     D. Battery Costs ................................................................................................................ 16
     E. The Problem of Import Dependence for Battery Materials .......................................... 18
     F. Current and Past Policies for HEVs, PHEVs and BEVs .............................................. 18

III. The National Energy Modeling System, Transportation, and Hybrid Vehicles ...... 20
     A. How NEMS Treats Hybrid Vehicles ........................................................................... 21

IV. Alternative Policies for Hybrid Vehicles ...................................................................... 23
     A. Arguments for Separate Policies Targeting Hybrid Vehicles ...................................... 24
     B. Subsidy Policies ........................................................................................................... 25
     C. Other Policies ............................................................................................................... 26
     D. Evidence of the Effectiveness of Hybrid Policies ........................................................ 27
     E. Policies Modeled in NEMS .......................................................................................... 28
     F. Estimating the Costs of Hybrid Policies ....................................................................... 29

V. Changes in NEMS Assumptions for Policy Analysis .................................................... 33
     A. Subsidy Policies ........................................................................................................... 33
     B. Alternative Cost Assumptions for Batteries and System Costs ................................... 36
     C. Combinations of Policies ............................................................................................. 39

VI. Results of the NEMS Runs............................................................................................. 39
     A. Results of the Hybrid Subsidy Runs ............................................................................ 40
     B. Results of the Optimistic Battery Costs and Combination Policies ............................. 51
     C. Combination Policy Results ......................................................................................... 55
     D. Summary of Costs and Cost-Effectiveness .................................................................. 55
VII. Discussion and Conclusions ......................................................................................... 61 References .............................................................................................................................. 65 Appendix ................................................................................................................................ 70
Resources for the Future                                                         McConnell and Turrentine

                        Should Hybrid Vehicles Be Subsidized?
                               Virginia McConnell and Tom Turrentine∗

I. Executive Summary
        Hybrid-electric vehicles (HEVs) have been sold in the United States since the first Honda
Insight of 1999. Growth in hybrid sales has been relatively slow, with the current hybrid market
at about 2.5 percent of all new-car sales. Plug-in hybrid-electric vehicles (PHEVs) and battery
electric vehicles (BEVs) will soon be introduced to the market in the United States. The extent to
which these more fuel-efficient vehicles are able to penetrate the vehicle market and contribute
to the goals of reducing oil use and greenhouse gas (GHG) emissions will depend on technology
and market outcomes as well as policies pursued by government in coming years.

       This part of the overall energy policy analysis focuses on the potential role of HEVs,
PHEVs, and BEVs in reducing oil use and GHG emissions in the U.S. Different technology
outcomes and policies targeting hybrid vehicles are considered, using NEMS-RFF1 to model
policy outcomes. Costs of each of the policies include full welfare costs and are determined
outside of the model.

        Subsidies are among the major policy tools for increasing the share of hybrid vehicles in
the fleet. Here, we analyze a subsidy to consumers for the purchase of hybrid vehicles: the
greater the fuel efficiency of the hybrid over a conventional vehicle of similar size, the greater
the subsidy. We find that the interaction between a subsidy policy and other policies can be quite

∗McConnell, Senior Fellow, Resources for the Future. Turrentine, Center for Transportation Studies, University of
California, Davis.
This background paper is one in a series developed as part of the Resources for the Future and National Energy
Policy Institute project entitled “Toward a New National Energy Policy: Assessing the Options.” This project was
made possible through the support of the George Kaiser Family Foundation.
© 2010 Resources for the Future. All rights reserved. No portion of this paper may be reproduced without
permission of the authors.
Background papers are research materials circulated by their authors for purposes of information and discussion.
They have not necessarily undergone formal peer review.

1The National Energy Modeling System (NEMS) is a computer-based, energy-economy market equilibrium
modeling system for the United States developed by the U.S. Department of Energy (DOE). NEMS-RFF is a version
of NEMS developed by Resources for the Future (RFF) in cooperation with OnLocation, Inc.

                                                         1
Resources for the Future McConnell and Turrentine
important, and subsidies on hybrids should be evaluated in the context of other policies in place
or being considered.
A range of policies designed to reduce oil consumption and GHG emissions from the
transportation sector are addressed elsewhere in the RFF-NEPI study. These policies, which
include oil taxes, gasoline taxes, and feebates, have varying effects on both the rate and timing of
hybrid vehicle penetration. For example, the high gasoline tax that is modeled influences
consumer and producer decisions about the purchase of alternative fuel vehicles. Under this
policy, sales of all hybrids are projected to increase from 23 percent of new-car sales to 30
percent by 2030.
For a number of reasons, it may be efficient to develop policies that separately target
hybrid vehicles. These reasons include the effects of scale economies in the production of
hybrids, costs incurred by first adopters that are higher than those incurred by later adopters (on
both the consumer and the producer side), insufficient incentives for research and development,
and the effects of learning in such technology development areas as electric drive trains and
batteries.
Subsidies for HEVs have been the most common type of policy for promoting hybrid
vehicles to date. Current subsidies for HEVs (from the 2005 Energy Policy Act) are based
roughly on fuel economy and provide up to $3,400 per vehicle; but these phase out after 60,000
vehicles per manufacturer are sold and the HEV subsidy is set to expire completely at the end of
2010. The focus of federal subsidies is shifting toward PHEVs and BEVs that are expected on
the market at the end of 2010. Under recent legislation these vehicles (but not HEVs) will be
eligible for up to $7,500 per vehicle in federal subsidy, depending on battery size. Subsidies are
also available for battery development and production, in the form of direct subsidies and loan
guarantees.
We examine hybrid subsidy policies here, both alone and in combination with other
policies. Subsidies that are directly on the price of the vehicle, rather than in the form of a tax
rebate, tend to be most effective (based on evidence from an analysis of current subsidy
policies). We examine a subsidy on HEVs and PHEVs that is based on gallons of fuel used per
mile, or fuel intensity. The amount of the subsidy received differs by vehicle size class and is
based on the difference in fuel intensity between the conventional vehicle and the hybrid vehicle.
The subsidies start at about $3,000–$4,000 per vehicle, varying with the size of the vehicle and
the fuel efficiency of the hybrid version over the conventional.
2Resources for the Future McConnell and Turrentine
Separate size categories is the approach used by the U.S. Environmental Protection
Agency and the National Highway Traffic Safety Administration (NHTSA) to set corporate
average fuel economy (CAFE) rules, so that is the approach we use in this analysis. This
approach can be efficient in that it will reward fuel efficiency improvements across all segments
of the vehicle market, including for the biggest, most fuel-inefficient cars, which may offer the
greatest opportunities for fuel savings.
The subsidy of hybrid vehicles results in an increase in the share of hybrids, with HEVs
the most affected. However, despite the greater penetration of these vehicles, there is very little
effect on fleet fuel economy, overall energy use, or vehicle-miles traveled (VMT). This is
because the CAFE standards, even in the base case, that correspond to the current NHTSA and
EPA regulations, are quite strict and will not be easily met by the manufacturers. Because the
standards are binding, the subsidy results in the sale of more hybrid vehicles and manufacturers
can do less with conventional vehicles to meet those standards. One perspective is that the
subsidy is then unnecessary because it does nothing to reduce energy use or GHG emissions –
the CAFE standards are already achieving the intended reductions. An alternative view is that
there may in fact be an important role for subsidies because they make it easier to meet a strict
and increasing standard that may be very difficult to enforce, especially if gas prices remain
relatively low. Hybrid subsidies can reduce the overall costs of meeting CAFE standards and
may, therefore, be an important policy to consider along with CAFE standards.
We then consider the case where the costs of batteries and of hybrid systems are much
lower than the baseline NEMS assumptions. The battery and system costs fall to roughly half of
what they are in the NEMs baseline. These are quite optimistic assumptions about battery costs
but are consistent with what some analysts believe about future technology opportunities.
When battery costs are lower, we find that the share of hybrid vehicles in the fleet is
much larger. But, as with the subsidy, this simply makes it easier for manufacturers to meet the
binding CAFE standards, and there is very little effect on energy use. In fact, because hybrid
vehicles are less expensive, energy use from light-duty vehicles actually rises very slightly
compared to our base case. VMT also increases very slightly.
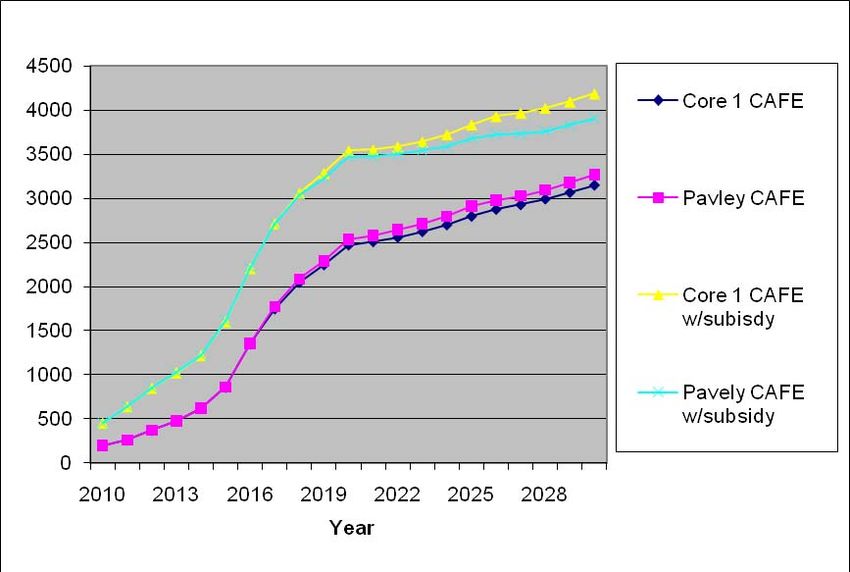
In our final set of analyses, we consider combined policies. First, we look at the subsidy
for hybrids combined with a stricter CAFE standard over the entire time period up to 2030. Fuel
economy is higher, as expected, and energy use is lower than the base Core 1 as well. With better
fuel economy, we would expect to see a slight rebound effect, and VMTs are slightly greater.
The strict CAFE standard pushes the limits of technology, at least according to the technologies
3Resources for the Future McConnell and Turrentine
assumed in the NEMS model, and the standards cannot be met, even with the subsidy.2 The
subsidy results in few additional hybrids because the Model assumes there are more cost-
effective technologies for the conventional vehicles as fuel economy levels are pushed to the
limit.
We also examine a policy combining optimistic assumptions about battery costs, a high
gasoline tax, and the subsidy for hybrid vehicles. This set of policies results in a significant shift
toward hybrid vehicles of all types. The light-duty vehicle stock has much higher fuel economy,
and energy use falls by quite a bit, but this appears to be due primarily to the high gasoline tax.
Finally, we review issues that may limit the conclusions we can make in examining
hybrid policies using DOE’s NEMS. One issue is that compliance with CAFE standards is not
fully modeled. The manufacturers have no way to attempt to sell more hybrids by varying their
prices to meet CAFE. The only way to introduce more hybrids as a way to meet CAFE is to
change the consumer demand side of the model to ensure that consumers buy more of them. We
keep the consumer coefficients the same through different runs of the model. We do not model
how manufacturers will respond to CAFE requirements or how consumers will respond to
greater information about and experience with a larger hybrid fleet. These are important aspects
of how both fuel economy and subsidy policies will play out over time.
Another related issue is that NEMS assumes that the CAFE standards are not changed in
response to any of the policies or assumptions introduced. In setting CAFE standards, NHTSA is
now using an economic feasibility test (NHTSA 2009). If battery costs were to fall, as we model
in one of our analyses, and the standards became easier to meet, it is possible that NHTSA would
move to tighten the standard under the current rule.3 We have not attempted to build this type of
change into the analysis.
2The Department of Energy’s NEMS-RFF model used for the analyses assumes a set of technologies that are
available to the manufacturers. There are likely to be additional new technologies developed in the coming years.
Some analysts argue that the NEMS-RFF model is conservative in its forecast for this reason.
3 The Energy Independence and Security Act of 2007.
4Resources for the Future McConnell and Turrentine
II. Hybrid Vehicles: Overview
A. Background
Hybrid-electric vehicles (HEVs) have begun to transform automobile design and fuel
economy in the United States in recent years. Plug-in hybrid-electric vehicles (PHEVs) and pure
battery electric vehicles (BEVs) are related automotive technologies that have not yet made it to
market but have received renewed attention in the wake of high oil prices and concern both for
energy security and for global warming.4
BEV technology has been around for more than 100 years; it competed with the gasoline
and diesel internal combustion engine (ICE) and the steam engine in the first decades of the 20th
century, eventually losing out to the superior energy storage of liquid fuels from petroleum—
gasoline and diesel. The shortcoming of electric vehicles is the limited energy density of
electricity stored in chemical batteries. Compared to the high-energy density of liquid fuels for
combustion, the ease and speed of refilling liquid from fuel pumps, and the long life of
combustion engines, batteries are bulky, heavy, expensive, and slow to charge, and they contain
limited energy and wear out sooner than the vehicle, resulting in an expensive replacement cost
to the owner. The other technical parts of an electric drive train, the motor, and regenerative
braking systems, are more efficient, simpler, easier to control, and more powerful than ICEs.
However, a number of problems result from the use of ICE gasoline- and diesel-fueled
vehicles. These vehicles emit pollutants, resulting from combustion and fuel evaporation, which
are released at fueling stations and from vehicles and become trapped in urban air basins. These
pollutants can become concentrated in road corridors, creating serious health hazards, especially
to children, the elderly, and people with lung ailments. Regulations over the last 30 years to
reduce these emissions have resulted in a current ICE fleet that is much cleaner, though the size
of the fleet and the increasing rate of vehicle-miles traveled (VMTs) means that emissions of
local air pollutants from vehicles are still a problem in the United States. Diesel engines and
diesel fuels have only begun to be regulated to the same stringency as gasoline engines to reduce
local pollutant emissions; thus, they remain a serious problem, especially for particulate
emissions.
4 See Turrentine et al. (2006) for more on the potential for hybrid vehicles.
5Resources for the Future McConnell and Turrentine
Reliance on petroleum fuels for vehicles has additional serious climate and fuel security
impacts. Carbon dioxide (CO2) is a primary byproduct of combusting petroleum-based fuels;
climate scientists have identified CO2 as a serious greenhouse gas (GHG). Transportation
accounts for 27 percent of GHGs in the United States (U.S. EPA 2006). In addition, the
increasing share of imported oil in the United States and the continued political instability in
many of the oil-exporting countries, has led many to argue that it is in the interests of the United
States to reduce oil consumption significantly (Brown and Huntington 2010). The transportation
sector is particularly affected because petroleum is the source of more than 95 percent of
transportation fuels (U.S. Department of Energy [DOE] 2010).
Electricity for vehicles is one approach to reducing reliance on petroleum. HEVs generate
electricity during operation, which then can be used to reduce the use of gasoline during various
parts of the driving cycles. PHEVs have the potential to reduce the use of petroleum even more,
though how much more and at what cost are still questions that must be addressed. PHEVs draw
on electricity from the grid, which can be produced from a variety of feedstocks. And although
currently existing electricity production accounts for the biggest percentage of GHGs worldwide,
potential low-carbon sources of electricity, such as wind, solar, biofuels, geothermal, nuclear,
and hydroelectric, are available. Evidence suggests that the lifecycle reductions in GHGs from
moving toward PHEVs are likely to depend critically on the sources of electricity (Samaras and
Meisterling 2008).
A range of issues are critical to explore when considering public policies targeting
gasoline–electric hybrids and PHEVs. These include the potential for new battery development
and for reductions in production costs over time, the potential for import dependence on battery
materials in the future, and preferences on the part of the public for various types of hybrid and
electric vehicles. We discuss these and other issues to provide an overview of the technologies
and their challenges.
B. HEVs
HEVs made a heralded entry into the auto market in the late 1990s, with the introduction
of the Honda Insight and the Toyota Prius. Hybrids are designed to increase the efficiency and
lower the emissions of gasoline and diesel ICEs. The Honda Insight is a small, two-seat, very
aerodynamic and lightweight vehicle. The vehicle was capable of traveling 70 miles per gallon
(mpg) of gasoline. The hybrid aspect of its design was the ability of the vehicle to recapture
energy lost in idling, braking, coasting, and in downhill mode as well as engine downsizing. The
energy was captured through a generator, stored in a small battery, and returned to the wheels by
6Resources for the Future McConnell and Turrentine
a small electric motor that assisted the gasoline engine. This hybrid design improved fuel
economy by 25 percent or more (Burke et al. 2002, Table S-4).
The Toyota Prius is a five-seat sedan, marketed by Toyota as a car that does everything
described above and more. With a larger battery and motor, the Prius can, for short periods and
at low power demands, drive the vehicle entirely on electricity from the battery. At times of
moderate power demand or low battery charge, the vehicle uses the gasoline engine; and at times
of high power demands and adequate battery charge, it uses both the gasoline engine and the
electric motor. A set of computer programs, the control system, makes second-by-second
decisions about how much power is needed according to foot pedal pressure, grade, and
headwind. This design of hybrid can offer a 40 percent improvement in fuel economy over a
conventional ICE of the same size (Schafer et al. 2009, 122; Burke et al. 2002, Table S-4), with
the potential for reductions as high as 70 percent (Cheah et al 2007). However, although
incredibly efficient, hybrids rely 100 percent on liquid or gaseous fuels and, more likely than not,
on gasoline or diesel. Their batteries are not large enough to bother plugging into the grid for
storing electricity.
A third category of hybrid vehicles, sometimes called micro-hybrids, are ICE vehicles
that use electricity for stop–start devices to avoid idling losses. Micro-hybrid technologies are
less costly to implement and are likely to sweep through vehicle designs in the next decade.
Some manufacturers, such as Renault, have already said that they will put micro-hybrid
technologies in all models, in response to carbon-per-kilometer goals in Europe.
i. HEV Sales in the United States
Total Prius sales in the United States represent close to 10 percent of total Toyota sales in
the United States, with about 180,000 sold in 2008 Worldwide, cumulative Prius sales are now
over 1 million vehicles, and in 2009 it was the best-selling vehicle in Japan.
Although dominant in sales, the Prius is not the only hybrid in the current vehicle market.
A number of manufacturers have produced hybrid versions of particular model types starting
around 2005. Figure 1 shows total hybrid sales by year for the major hybrid models from 2001 to
2008, including the Prius, the Civic, the Escape, the Highlander, and the Camry. In 2009, Ford
introduced the Fusion Hybrid, GM the Chevy Malibu Hybrid, and Honda the newly designed
four-passenger Honda Insight.
As Figure 1 shows, sales reached peak levels in 2007 and were lower in 2008, probably
due in large part to the recession that began early that year. In the last year or two, hybrids have
7Resources for the Future McConnell and Turrentine
composed up to 2–3 percent of sales in the United States, with much higher market penetration
in some regional markets, such as Portland, Los Angeles, Seattle, and San Francisco.5 Hybrid
sales as a percentage of total sales had been down slightly since the beginning of 2009, but set a
record for sales at 3.55 percent of total vehicles sold in July, during the “Cash for Clunkers”
stimulus program.
Figure 1. Hybrid Sales by Year for Major Hybrid Models
350000
300000
250000 C ivic Hybrid
E s cape Hybrid
200000
Highlander Hybrid
150000 C amry Hybrid
100000 P rius
Model
50000
0
2001 2002 2003 2004 2005 2006 2007 2008
Figure 2 shows annual sales of hybrid vehicles by model alongside their conventional
gasoline vehicle counterparts. Among hybrid models, a clear upward trend in sales is evident
only for the Prius. Two factors that are likely to have influenced hybrid sales are the prices of
hybrid vehicles compared to those of conventional vehicles and the price of gasoline. Subsidies
have been available for light-duty HEVs since the Energy Policy Act of 2005 made available a
federal income tax credit for any qualifying vehicle placed in service after December 31, 2005.
The credit ranges from $250 to $3,150, depending on the vehicle model and its fuel efficiency.
This credit begins to phase out after the manufacturer sells 60,000 light-duty HEVs. The credits
phased out for the Prius in 2007 and are being phased out in 2009 for most of the other hybrid
models. These HEV subsidies phase out altogether in April 2010.
5 Kahn (2008) found hybrid buyers
8Resources for the Future McConnell and Turrentine
Figure 2. Sales of Hybrid and Conventional Models, by Year
450000 2001
400000 2002
350000
2003
300000
250000 2004
200000 2005
150000
100000 2006
50000 2007
0 2008
c
er
ry
s
id
pe
id
id
vi
id
iu
br
m
br
nd
br
br
Ci
Pr
ca
Ca
Hy
Hy
Hy
Hy
la
Es
gh
c
er
ry
pe
vi
Hi
m
nd
Ci
ca
Ca
la
Es
gh
Hi
Source: Automotive News Annual Sales data, accessed 2010.
Note: Data are missing for some years of Camry sales for the 2002–2005 model years.
ii. Hybrid Prices and Fuel Economy Relative to Conventional Gasoline Vehicles
To get an idea of the relative costs of the current hybrids compared to conventional
vehicles, we collected data on vehicle prices and fuel economy for models that have both a
gasoline and a hybrid counterpart. For the consumer, the hybrid offers reduced fuel costs and less
frequent refueling. Of course, the value to the consumer varies according to the cost of gasoline.
Table 1 shows the prices of the two vehicles with similar options and their certified fuel
economy (from Edmunds, 2009 .6 We tried to obtain prices for the two types of vehicles with
similar features, which was sometimes difficult. We use a $3.00/gallon price for gasoline in all
cases, but the value of the hybrid version will increase with the price of gasoline. We used both a
3-year time frame and a 13-year time frame—the average life of vehicles in the United States—
for consumers to consider fuel economy. Clearly, if consumers consider fuel economy for only
three years, none of the hybrid models is cost-effective. With the full government subsidy for
HEVs of just over $3,000, the cost with the subsidy and net of fuel savings looks more
6 The median of the city and highway driving estimates for fuel economy was used for the conventional vehicles.
9Resources for the Future McConnell and Turrentine
economical. However, most of the subsidies on these vehicles are either no longer in effect or are
quite small.
Notably, the Chevy Silverado Hybrid results in the most energy savings of all of the
vehicles in the table. The Silverado Hybrid was the first full hybrid truck to enter the market and
was first sold in the 2009 model year. It has the greatest fuel savings because the conventional
version has such low fuel economy and the percentage improvement in fuel savings with the
hybrid model is more than 35 percent. The far right column of Table 1 shows the dollar value of
the total gallons of gasoline saved with the hybrid version over the conventional. Thus, the most
fuel-inefficient vehicles offer the greatest opportunity for savings; this is a key point to keep in
mind when assessing energy-reducing policies, and we return to it below. Also, even with the
rather extreme assumption of three years of fuel savings discounted at 15 percent, the hybrid
version of the Silverado comes close to paying back the difference in price without any subsidy.
However, sales of the Silverado Hybrid over the last year since it first came on the market have
been very modest.
Table 1. Examples of Price and Fuel Economy of Same-Model Conventional and Hybrid
Vehicles, 2010 Model Years
Conventional Difference in costs between conventional
gas vehicles Hybrid vehicles and hybrid models
Fuel
economy Fuel economy
savings at savings at
$3.00/gallon, $3.00/gallon
Price over 3 over 13
Price mpg Price mpg difference yearsa,b,c yearsb,c
Honda Civic $20,000 29 $24,800 42 $4,800 $1,289 $3,779
Ford Escape $25,000 24 $29,750 33 $4,750 $1,372 $4,024
Ford Fusion $22,650 25 $27,270 35 $4,620 $1,380 $4,047
Toyota $22,650 26 $26,150 34 $3,500 $1,093 $3,204
Camry
Chevrolet $36,000 15 $41,000 21 $5,000 $2,300 $6,744
Silverado
a
A three-year period of accounting for fuel savings is assumed in the National Energy Modeling System.
b
The discount rate was assumed to be 5 percent.
c
Miles driven per year are from Davis et al. (2008).
Sales of hybrid vehicles are also likely to vary with gasoline prices. Figure 3 shows
hybrid sales and gasoline prices by month during 2007 and 2008. Gasoline prices were
multiplied by 10 to allow easier comparison to hybrid sales (in thousands). Gasoline prices were
10Resources for the Future McConnell and Turrentine
trending upward over this period, but with some months of decline. The hybrid sales seem to
increase with rising gasoline prices and fall when gas prices are falling or constant. The
exception is the later period, after April 2008, when sales of hybrids declined dramatically even
while gas prices were continuing to rise. This is probably due to the recessionary pressures that
resulted in a sharp decline in all auto sales.
Figure 3. Price of Gasoline and Sales of Hybrid Vehicles by Month, 2007 and 2008
50
45
40
35
30
25
20
15
10
5
0
May
May
March
March
November
November
January
January
June
June
April
April
August
August
February
February
September
October
December
September
October
December
July
July
2007 2008
Gasoline prices *10 US Hybrid Sales (000s)
Source: Hybrid sales data are from Green Car Congress (2010); gasoline prices are from EIA, 2010
Note: Gasoline prices are in US$ per gallon multiplied by 10.
C. PHEVs and BEVs
Like HEVs, PHEVs are a combination of electric and liquid fueling systems. The PHEV
is similar to today’s HEVs but with a much larger battery and the capability to be plugged into
the electrical grid to store and supply grid electricity for power to the wheels. PHEVs do use
gasoline or diesel for some portion of their power needs, depending on the vehicle design or
travel patterns of the user.
11Resources for the Future McConnell and Turrentine
PHEVs do not have a single design, but offer a range of technology options that combine
aspects of pure BEVs and HEVs. Already, manufacturers and researchers have showcased a
variety of PHEVs, with some designs that are more like BEVs and some that are modest
modifications of existing HEVs. The PHEV always has both an ICE powered by a fuel—like
gasoline, diesel, or biofuel—and at least one electric motor. Electricity for the motor is primarily
stored in chemical batteries that are recharged from the grid or, in some designs, also by
electricity generated from the ICE. In some designs, power for the wheels comes only from the
electric motor. In other designs, the power for the electric motor is combined with power from
the ICE.
At the heart of each PHEV design is the integration of four systems: the engine; drive
trains, which integrate the electric drive and internal combustion power source; the battery
system, emphasizing large or modest energy storage and power capabilities; and the control
system, computer-guided programs that direct the complex relationships between the electric and
internal combustion systems and also manage the battery system.
The first PHEV to come to the market is likely to be one made by GM, the Chevy Volt, a
much talked about 40-mile series design, that GM calls an extended range electric vehicle, not a
PHEV, to emphasize that its design is nearly that of a BEV and to set it apart in the market from
the Toyota PHEV, a modest PHEV 10, to be introduced in limited numbers in 2009. Ford will
also introduce a limited number of PHEVs, and is negotiating with the U.S. government over
quantities to be supported by funds from the U.S. Department of Energy (DOE).
BEVs, in contrast to both HEVs and PHEVs, obtain all of their power from the electricity
grid. They must be recharged every 30–120 miles, depending on the battery size, a process that
can take hours and requires a parking spot with a high-powered electrical outlet. Also, according
to their weight and maximum miles (range) between recharges, BEVs require larger, and thus
more expensive, batteries than dual-fueled PHEVs. BEVs find their logical market niche in
urban and suburban situations where drivers have moderate, daily driving needs that fit the
vehicle’s driving range, or in which BEV owners have access to an ICE, an HEV or a PHEV for
longer-distance travel.
i. Importance of the Battery
A long list of battery chemistries have been tested in the past for BEVs, but the leading
technology for BEVs and PHEVs are lithium ion (Li-ion) batteries, now dominant in the
electronics industry for phones, cameras, and laptops (Axsen et al. 2008; Anderman 2010). Of
12Resources for the Future McConnell and Turrentine
course, the battery needed for vehicles is much larger and more complex and is designed to last
longer and sustain more abuse than those used in consumer electronics.
Batteries for vehicles are built up by three levels of integration: individual battery cells ,
which are grouped into modules (like the 12-volt six cellstarter battery in a nonhybrid car), and
then grouped into complete battery packs for use in vehicles. Currently, there are no mass
produced Li-ion cells of the proper size or design for BEVs or PHEVs, much less ready-made
modules or packs for PHEVs, although that day is nearing. All of the batteries for such vehicles
are either made of many small consumer cells (the Tesla Electric Roadster battery pack is said to
have more than 6,800 Li-ion cells) or, if using large cells, are still in limited, experimental packs
(like those for the Chevy Volt).
HEVs have much smaller batteries than BEVs or PHEVs, often in the range of 0.5–1.5
kilowatt-hours (kWh), which are used to store and deliver electricity to and from the electric
motors for short periods, often seconds or minutes. The batteries are charge sustained during
vehicle operation, maintaining their batteries at a narrow range of a high proportion of their
charge capacity (usually 60–80 percent). HEV batteries are optimized for high power density,
meaning the ability to deliver high power over short periods of time. The battery must be able to
endure millions of these shallow cycles over the life of the vehicle. These batteries cost more per
unit of energy stored and less per unit of power to manufacture than pure BEV batteries.
In contrast, pure BEVs have much larger battery packs, shaped primarily by the size,
weight, and driving range of the vehicle. Typical BEV batteries can range from 16 kWh for
citymicro cars with 50 miles of range (Mitsubishi MiEV) to 35 or more kWh for a small two-
seater with 150 miles of range (BMW Mini-E). BEV batteries are charged from the grid, and
usually at high-power outlets, either Level Two, 220-Volt, 30-amp outlets (for example, in the
United States), which can take several hours, or Level Three, three-phase (industrial grid areas in
United States only), fast-charging outlets, which can take 15 to 60 minutes to charge a depleted
battery. BEVs are outfitted with enough battery capacity to drive a specified range, for example
40–100 miles, until the vehicle battery is depleted; afterwards, they must be parked and
recharged. In technical parlance, BEVs use a charge-depleting mode, essentially draining their
batteries, usually going from 100 percent to something like 20–30 percent (Burke et al, 2002;
Axsen et al., 2008). These are called deep discharge cycles, and BEV batteries must be able to
endure thousands of such daily or semidaily deep discharges and additional shallow cycles over
the lifetime of the vehicle. Given that the BEV depends on its battery for all of its energy needs,
BEV batteries are optimized to hold a lot of electrical energy, what is called high energy density,
to store the most energy per volume and weight. Because this battery is so large, it has plenty of
13Resources for the Future McConnell and Turrentine
power for rapid acceleration and high speed, although such driving events do deplete the battery
sooner than slower speeds and more modest driving habits.
PHEV batteries, drive train, and battery control architectures combine both charge-
depleting and charge-sustaining control modes, and in that order. PHEVs begin operation, at the
start of a trip, as a charge-depleting vehicle and, once the battery reaches a low state of charge,
shift to charge-sustaining mode until they are parked and recharged. There are also distinct
strategies to control the discharge of a PHEV battery during the initial charge-sustaining mode.
Blended strategies combine electricity and internal combustion power as needed during the
charge-depleting mode; series strategies (like that of the GM Volt) rely only on the battery
during the depleting mode, shifting to charge-sustaining once the battery reaches a low state of
charge, at which time the combustion engine is fired up to recharge the batteries. Regardless of
these differences, PHEV batteries must combine attributes of high energy density batteries for
charge depletion and then, at a low state of charge, provide high power density for charge-
sustaining operation over long distances. PHEV batteries must also sustain more deep discharges
in their lifetime than EVs, as well as millions of shallow discharges. This is a unique demand on
batteries, and a challenge for vehicle battery designers.
Battery pack energy capacity is typically measured in kWh, and power density in kW.
But a more pertinent way to measure battery capacity for PHEVs—particularly for the buyer— is
in terms of all-electric range (AER) capability. In other words, if the only source of power to the
drive train in charge-depleting mode is the battery, how long could the vehicle drive on the
battery alone? Typically PHEVs are described as having 10 miles of AER or 20 miles of AER;
the shorthand for such vehicles is then PHEV 10, or PHEV 20, respectively.
This is straightforward for series PHEVs, but complex for blended PHEVs. For example,
in a series design PHEV 20, the electricity is depleted in the first 20 miles, at which point the
combustion engine comes on to charge the battery or power the wheels. In a blended design, the
AER capacity is combined with the use of liquid fuels to produce an mpg boosted range. For
example, in one possible blended control strategy, a blended PHEV 20 will blend its 20 miles of
electricity with 20 miles of gasoline to produce 40 miles of boosted mpg in the charge-depleting
mode.
This difference is important in the market as well as in terms of its impact on fuel use and
emissions. A series PHEV 20 driven 20 miles each day and charged each night would
hypothetically never use any gasoline. Depending on its control strategy, a blended PHEV 20
might use gasoline for 50 percent of its miles. However, if each is driven 40 miles each day, and
14Resources for the Future McConnell and Turrentine
each is charged only once that day, a series PHEV 20 and blended PHEV 20 will use the same
amount of gas and electricity. Therefore, a series vehicle seller will boast that its AER runs
“gasoline-free 20 miles,” whereas a blended PHEV 20 seller will boast of high gasoline fuel
economy for the first 40 miles. Of course, in reality, the distribution of miles driven varies
greatly from day to day, from week to week, and from household to household. Therefore, the
market has room for both types of designs.
ii. Links to Electric Power
In contrast to HEVs or BEVs, PHEV drivers have the choice to refuel with liquid fuels or
electricity for much of their driving; the frequency and amount of electricity used is shaped by
the relative prices of the two fuels, lifestyle, driving patterns, opportunities to recharge, and the
AER or blended range of their vehicle. Therefore, compared to BEVs or HEVs, the benefits of
PHEVs as a means to reduce CO2 emissions or the need for petroleum is dependent on the
behavior of the driver and the particular technology they have chosen as well as the electricity
source.
PHEVs make available a whole new refueling system for the consumer—the electric
grid. BEVs will almost certainly demand medium (220-volt) and high (three-phase 220- and 440-
volt) fast charging. However, PHEVs—at least small-battery PHEV 10s and 20s, given their dual
fuel aspect—will not require high-power charging, and in most cases may work well with low-
power, 110-volt outlets for charging. This makes the provision of charging infrastructure for
small-battery PHEVs less of a challenge, and indeed opens many possible recharging locations
for much lower cost at homes, businesses, campsites, parking garages, and shopping areas.
The recharging of PHEVs is a new load on the power company. As with any new load,
this implies new demands on the power system, from the point of charging all the way to the
generation of power and management of the grid. A good deal of uncertainty remains about how
widespread use of PHEVs will interact with the grid (Hadley and Tsvetkova, 2008; Greenemeier,
2009). The most frequently imagined scenarios are as follows.
• PHEV and BEV users charge their vehicles at night when most power companies have
excess capacity. Promoters of this scenario call this idea “filling the trough.” The
advantage here for the user is not only that the vehicle is charged at night, when the
vehicle is parked at home, but that nighttime electricity can be cheaper in some regions
with low use of night time grid. The advantage for the power company is a new source of
revenue at night, when demand is lower and electricity is cheaper to provide. This
improves the use of power generation investments. From a societal standpoint, this is also
15Resources for the Future McConnell and Turrentine
the best use of the system, as it makes the best use of existing infrastructure. However,
there is one clear disadvantage in many areas of the country: nighttime power is
generated from baseload sources and, in many areas, the base is from coal-fired
electricity; such power generation tends to have high GHG emissions.
• Drivers may, instead, elect to plug in their vehicles during periods of high-energy use,
thus straining the grid. This means, for example, that users might charge during the
afternoons in hot climates, when household and commercial air conditioning is heavily
used. If even a small number of PHEV or EV owners were to charge at these times, the
increased load could be a problem. Although the cost of electricity is potentially the
highest at these times, it may still be less than the future cost of gasoline, so consumers
may be motivated to charge at these high-demand times, straining the electricity system.
Therefore, the provisioning of electricity to PHEV owners creates a number of risks and
opportunities for power companies to improve their business case or, in the worst case, create an
unwanted demand on the grid. Fortunately, in both cases, the deployment and development of
the PHEV market will happen slowly, over decades rather than years. Thus, the provision of
power and charging systems and the management of this new load will have time to evolve. In
particular, the utility industrys moving toward what it calls the Smart Grid, a system in which
load is managed through new information systems. The PHEV holds some potential to be a
positive aspect of that new Smart Grid, as a flexible load that can be controlled.
D. Battery Costs
Battery costs are a central challenge to the widespread development and
commercialization of BEVs and PHEVs, especially PHEVs with larger batteries, and BEVs that
are larger vehicles or have significant range. Size is paramount, but chemistry, design, purpose,
durability, shape, and the final cost also are important. We have noted earlier the design tradeoffs
between batteries with higher power density and batteries with higher energy density. High
power batteries are generally more expensive per kWh (a measure of energy capacity). This
means that, for a given energy storage capacity, HEV power batteries cost more per capacity
than BEV batteries. However, HEV batteries are generally small, 0.5–1.5 kWh, whereas BEV
batteries are larger, with 15–40 kWh of capacity (National Renewable Energy Laboratory 2006.).
We discuss here primarily the cost of Li-ion batteries. Nickel metal hydride (NiMH)
batteries, which have worked well for HEVs, will be replaced in the near future by Li-ion
batteries, as they have throughout the portable consumer battery industry. Li-ion batteries for
16Resources for the Future McConnell and Turrentine
HEVs are expected, in the next few years, to be cheaper, lighter, smaller, and more durable than
current Li-ion batteries. Lithium is not an expensive metal compared to the metals used in other
batteries, but might cost more in the future as demand increases. Some Li-ion batteries use
expensive metals such as nickel, cobalt, manganese, or copper. Finally, some materials, designed
specifically for automotive Li-ion batteries, can be more expensive to meet the standards of
safety, durability, weight, and power density wanted in automotive applications. For example,
nanomaterials, used in some new Li-ion batteries, improve the performance of batteries but add
to the complexity, cost, and difficulty of manufacturing.
The wholesale price of batteries paid by vehicle makers is not public knowledge, but
estimates are available. Generally, three components should be considered in estimating the price
of a battery system: the price of the battery cell, the assembly of the pack, and the price of the
accompanying electronics and cooling systems. Consumer Li-ion battery cells are currently
around $200–$300 per kWh; automotive Li-ion batteries will cost more because of higher
standards for abuse tolerance and longevity.
All of these technologies require significant increases in manufacturing investments and
costs. For the Prius, Toyota had to develop an entirely new supply chain for parts. In particular,
the battery required the formation of a whole new company—Panasonic EV—that would
develop a reliable supply of NiMH batteries of specific and robust design, sufficient size, and of
sufficient longevity to last the life of the vehicle. During the early years of the Prius, many
analysts and rival automotive companies concluded that the Prius was not and could not be
profitable. Honda’s design was thought to be simpler and less costly, especially as used in the
Honda Civic Hybrid. That did not include the research and development (R&D) or the
investment in manufacturing. All the true numbers are, of course, secrets of Toyota, which says
it is committed to eventually changing all of its vehicles to hybrids.
Currently, the cost of batteries is the most important consideration in sizing the battery.
Most manufacturers are considering AERs in the 10- to 40-mile size range.. Current estimates of
battery pack costs are in the low thousands for PHEV 10s, ranging up to the high teens for PHEV
40s (NRC 2010). Despite considerable optimism about meeting performance and endurance
goals for PHEV batteries, there is a good deal of uncertainty about how quickly battery costs will
decline over the long term (NRC 2010, Nelson et al. 2009; Baker et al 2010). Currently Li-ion
unit battery costs are quite high, and it is not clear how technology and market forces will
converge to reduce costs in the future. This could be a particularly important issue for the larger
PHEVs, such as the PHEV 40s that require large battery packs. In fact, some recent analytical
papers conclude that short-range PHEVs with small batteries have a better chance in the market.
17Resources for the Future McConnell and Turrentine
In the analysis of benefits and costs of different scenarios below, we address the issue of
battery cost uncertainty by using two different sets of forecast battery and system costs.
E. The Problem of Import Dependence for Battery Materials
A number of risks associated with a large increase in the use of Li-ion batteries need to
be considered. Cobalt is needed for some Li-ion ion batteries, and neodymium for motors, but
sources of both are relatively scarce. Currently, the best sources for these inputs are located in
countries that are relatively unstable politically. For example, raw cobalt comes primarily from
copper mining in the Democratic Republic of the Congo and Zambia (Sandalow 2009, Chapter
6). It will be important to monitor both the economic and political conditions in the future as
policies push toward new technologies and their widespread adoption. We need to be careful that
we don’t trade one security problem for another.
F. Current and Past Policies for HEVs, PHEVs and BEVs
Current and future production and sales of HEVs, PHEVs, and BEVs are, and will
continue to be, affected by a number of broad transportation policies, such as corporate average
fuel economy (CAFE) regulation, local and federal air pollution control programs, and federal
and state subsidy programs. New CAFE regulations authorized by the Obama administration in
spring 2009, the first changes in the CAFE rules for fuel efficiency since the 1980s for cars,
require significant improvements for each manufacturer in fleet fuel efficiency by 2016. These
requirements are described and analyzed for their effects on the fleet and on hybrid vehicle
penetration elsewhere in this study (Small 2010)). We examine in this report, in the policies
section (Section V) below, the effect of subsidies of hybrid vehicles in the presence of strict fuel
economy standards. A number of subsidy and loan policies have been implemented to date, and
we review those here.
Tax credits to individuals for the purchase of advanced vehicles. Specific income tax
credits were made available for HEVs as part of the Energy Policy Act of 2005 to individuals
purchasing qualified light-duty HEVs placed in service after December 31, 2005. The credit
ranges from $250 to $3,150, depending on the vehicle model. This credit begins to phase out
after each manufacturer sells 60,000 light-duty HEVs. For the second and third quarters after the
quarter in which the 60,000th vehicle is sold, 50 percent of the credit is available. For the fourth
and fifth quarters, 25 percent of the credit is available. No credit is allowed after the fifth quarter.
These HEV credits are set to expire in 2010. A heavy-duty HEV tax credit of up to $18,000 was
18Resources for the Future McConnell and Turrentine
available for the purchase of vehicles weighing more than 8,500 pounds, gross vehicle weight
rating (GVWR)7; this credit expired at the end of 2009.
The stimulus package passed in spring 2009 added a special income tax credit for PHEVs
and BEVs. To qualify, a vehicle must draw propulsion from a traction battery that has at least 4
kWh of capacity, uses an external source of energy to recharge the battery, has a GVWR of up to
14,000 pounds, and meets specified emissions standards. The base amount of the PHEV or BEV
credit is $2,500, plus another $417 for each kWh of battery capacity in excess of 4 kWh, with a
maximum subsidy of $7,500 per vehicle with weight less than 10,000 GVWR. This maximum
amount increases to $10,000 for vehicles weighing more than 10,000 pounds but not more than
14,000 GVWR. The subsidy will start to phase out after 200,000 vehicles have been produced by
each manufacturer. The subsidy tax credit is authorized until the end of 2014 (U.S. House of
Representatives 2009).
This tax credit offers a large incentive directed specifically to PHEVs and BEVs. The
magnitude of the credit is much larger than the incentive was for HEVs (which is now expiring)
and the number of vehicles eligible is also much larger. The PHEV and BEV technologies are
more expensive, and the battery cost hurdle is high, as described in the battery section above. We
analyze these different subsidies in more detail below.
Tax credits to manufacturers. The stimulus bill provides $1.7 billion in tax credits of
up to 30 percent to manufacturers for advanced energy investments, including advanced vehicle
production. Tax credits also are directed to businesses involved in infrastructure needs for
PHEVs and EVs. For refueling operations, tax credits of $54 million are available and, for the
deployment of plug-in infrastructure and vehicles, tax credits of $400 million are available.
Direct loan program for fuel-efficient vehicle development. As part of the Energy
Independence and Security Act (EISA) of 2007, a direct loan package of up to $25 billion is
available to manufacturers for the development and deployment of advanced technology vehicles
and their components made in the United States. These grants and direct loans are not for R&D,
but for the costs of reequipping, expanding, or establishing manufacturing facilities in the United
States. These loans, though authorized by the earlier legislation, are only now starting to be given
out. In June 2009, the first three were given to Ford, Nissan, and Tesla motors.
7 Standard pick-up trucks and vans weigh less than 8,500 pounds, so this credit is for large commercial trucks.
19Resources for the Future McConnell and Turrentine
Loan guarantee program. The Energy Policy Act of 2005 established a $4 billion loan
guarantee program designed to encourage the development and commercialization of innovative
green technologies. Loan guarantees are available to selected economically viable projects,
including those for advanced fuels and vehicles.
State subsidy programs. Many states have also put their own HEV, PHEV, and EV
incentives and regulations in place. In California, the Alternative Fuel Vehicle Rebate Program
has allocated $1.8 million to provide rebates of up to $5,000 to consumers who purchase or lease
eligible zero-emissions vehicles and PHEVs between May 2007 and March 2009. In a number of
states, low-emissions vehicles, such as HEVs, are exempt from the requirements of high-
occupancy vehicle (HOV) lanes. In addition, some cities exempt advanced technology vehicles
from parking fees, including at streetside parking meters.
In California, the Zero Emission Vehicle (ZEV) Production Requirement specifies that
large vehicle manufacturers must produce and deliver for sale a minimum percentage of zero-
emissions vehicles each model year, starting at 10 percent in 2005–2008 and increasing to 16
percent by 2018 (AFDC 2010). California announced the inclusion of PHEVs in Phase Three
(2012–2014) of its ZEV Program. A new category was formulated—Enhanced Advanced
Technology Partial Zero Emission Vehicles, also called Silver Plus. This category allows for
some new flexibility in meeting the ZEV requirements in 2012, substituting a higher number of
PHEVs for a substantial portion of ZEV vehicles. At least 11 other states, including New York,
have adopted California’s program, so the number of vehicles required will be multiplied by
these other states.
III. The National Energy Modeling System, Transportation, and Hybrid Vehicles
The National Energy Modeling System (NEMS) includes a model of the transportation
sector that is fully integrated with the overall energy and economic components of the model.
The model represents different vehicle sizes and types (car and truck), and a range of different
fuel and advanced technologies. Technologies represented in the most recent version of the
model include HEVs and PHEVs. EVs and fuel cell vehicles are included but with little detail on
costs or emissions reductions. The transportation model includes two major actors: (a)
manufacturers, which select technologies that are cost-effective or that are necessary to meet fuel
economy standards and, therefore, determine the vehicle prices and fuel economy, and (b)
consumers, who choose among vehicles based on their prices, fuel economy, and other features.
Manufacturers determine vehicle technologies and their prices, and consumers determine the
20Resources for the Future McConnell and Turrentine
share of vehicle types. Total vehicle sales are determined in the macroeconomic component of
the model.
A. How NEMS Treats Hybrid Vehicles
• HEVs are treated as separate vehicles in the model. They are assumed to be full hybrids
with 45 percent higher fuel economy than their conventional gasoline counterparts
(vehicles vary by manufacturer and size—see below). For example, if a midsize
American gasoline car gets 29 mpg, then the hybrid car of the same size would get 42
mpg.
• Two types of PHEVs are included in the recent versions of NEMS: PHEV 10s and PHEV
40s. PHEV fuel economy is assumed to be 60 percent and 90 percent better than that of
the conventional gasoline counterparts for the PHEV 10s and PHEV 40s, respectively.
For example, if a gasoline compact gets 30 mpg, then a compact PHEV 40 would get 57
mpg. The PHEVs are assumed to be driven 58 percent of the time on electricity and 42
percent of the time on gasoline. In gasoline mode, they get the same fuel efficiency as
HEVs, and in electricity mode, they are assumed to get the equivalent of about 200 mpg.
• Major elements of the stimulus package passed by the Obama administration in spring
2009 are included in the model. For example, the subsidy for PHEV vehicles is included,
so it is part of the baseline runs of NEMS below. However, the loan guarantee programs
are not included in NEMS.
• As for conventional vehicles, NEMS includes 12 different size categories of hybrids, 6
for cars and 6 for trucks. For cars, the size categories include minicompact, subcompact,
midsize, large, and two-seater. The size categories for trucks are small pickup, large
pickup, small van, large van, small utility, and large utility. The size categories for the
advanced technology vehicles, such as HEVs and PHEVs, are assumed to first enter the
market on different dates, which are specified as inputs to the model. The specifications
for the entry dates are shown in Table 2. Some of these are varied in the runs we present
below. We assume in some cases that certain hybrids are introduced at earlier times.
• Choices about hybrid vehicles are included in the model in two ways.
On the manufacturers’ side: The costs of production and fuel economy of different
vehicle types, including hybrids, are determined by manufacturer choices. Manufacturers
are assumed in the model to consider fuel economy improvements only for the first three
years of vehicle life, and to use a 15 percent discount rate. The manufacturers will keep
21You can also read