THE ITALIAN PERFORMANCE PLAN - for Air Navigation Services Reference Period 1 2012-2014 - Enac
←
→
Page content transcription
If your browser does not render page correctly, please read the page content below
THE ITALIAN
PERFORMANCE PLAN
for Air Navigation Services

    Reference Period 1
        2012-2014
National Performance Plan – Italy

                                   Document Approval

The National Performance Plan for Reference Period 1 has been prepared by the Ente Nazionale
per l’Aviazione Civile (ENAC) in accordance with the Single European Sky Performance Scheme
Regulation (EC) No. 691/2010 and the data submitted by ENAV SpA and derived by its business
plan.

The Ministero per le Infrastrutture ed i Trasporti, as the Ministry responsible for Civil Aviation,
agrees to the adoption of the Italian National Performance Plan for Air Navigation Services.

ENAC has been authorised to sign and transmit to the European Commission the Italian National
Performance Plan with letter 00001985/USCITA dated 5 May 2011.

                                                  2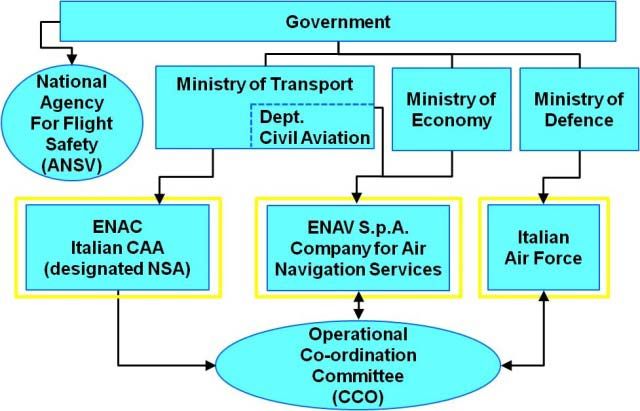
National Performance Plan – Italy

Executive Summary

This documents is the Italian Performance Plan (IPP) for en route Air Navigations Services.

The Italian Performance Plan covers the first Reference Period (RP1: 2012-2014) and it is
developed at National level, in compliance with the provisions of the Commission Regulation n.
691 of 29 July 2010. The Plan follows the template reported in Annex II of the EC Reg. n.619/2010.

ENAC, the Italian Civil Aviation Authority, has been designated as National Supervisory Authority
and it is responsible for the preparation of the Plan. The plan is agreed by the Ministry of Transport
and Infrastructures.

The accountable entities for the achievement of the declared targets are:
   • ENAC, the Italian CAA;
   • ENAV, the Company for Air Navigation Services;
   • ITAF, the Italian Air Force.

The Plan reports the performance target to which Italy its committed in achieving. Performance
targets refer to the Key Performance Areas of capacity and cost efficiency for en route service. For
the Key Performance Areas of environment and safety, for RP1 specific indicators will be
monitored.

A synopsis of the targets Italy is committed to achieve and the related a is reported in the table
below:
                                                                                             National targets
       KPA                                      KPI                                                                                                              National thresholds
                                                                                  2012            2013            2014

                              1. Effectiveness of safety management             Monitoring      Monitoring      Monitoring                                              n.a.
                              2. Application of severity classification
                               2.1 Separation Minima Infringement               Monitoring      Monitoring      Monitoring                                              n.a.
     (a) Safety                       2.2 Runway Incursions                     Monitoring      Monitoring      Monitoring                                              n.a.
                         2.3 ATM special technical events (ATM Specific
                                   Occurrence in ESARR 2)                       Monitoring      Monitoring      Monitoring                                              n.a.

                                 3. Implementation of Just Culture              Monitoring      Monitoring      Monitoring                                              n.a.
                                                                                                                             Italy deems appropriate the alarm threshold being triggered by the fluctuation

                                                                                                                             reported in the STATFOR MTF for each year, or its variation over 1% tolerance
    (b) Capacity             En-route ATFM delay (minutes per flight)              0.14            0.14            0.12
                                                                                                                             (+/- 1%) with reference to the HIGH and LOW traffic growth as assumed from

                                                                                                                             the baseline proposed by STATFOR, whichever smaller.
  (c) Environment                      FEP Implementation                       Monitoring      Monitoring      Monitoring                                              n.a.
                                                                                                                             1) For what concerns economic aspects, the threshold takes into consideration
                                                                                                                             all those events which cannot be controlled by the State but that might have a
                                                                                                                             relevant impact on the target (in terms of costs and/or revenues). The
                                                                                                                             proposed additional threshold aims at taking into account the local specifities
                                                                                                                             of Italy.
                                                                                                                             2) For what concerns traffic, the exceptional situation that is interesting the
                       Determined en-route unit rate (2009 prices in national
 (d) Cost-efficiency                                                             € 70,31         € 68,21         € 65,96     Mediterranean area is demonstrating that an alert threshold of 10% on traffic is
                                            currency)
                                                                                                                             too high for Italy because its effects could be devastating for the financial
                                                                                                                             stability of the providers that would lead to significant and dangerous
                                                                                                                             detrimental effects on the level of safety and quality of the service offered.
                                                                                                                             Therefore, as local alert threshold on traffic, Italy will activate the process for a
                                                                                                                             possible target revision for any variation higher than 4,5% on the forecasted
                                                                                                                             level of traffic (flights or SU).

                                                      Table A - Italy’s national targets and thresholds for RP1

For the scope of the IPP, all issues related to airport and terminal area are subject to NSA
monitoring (during RP1 not national target are defined in these domain).

                                                                                                 3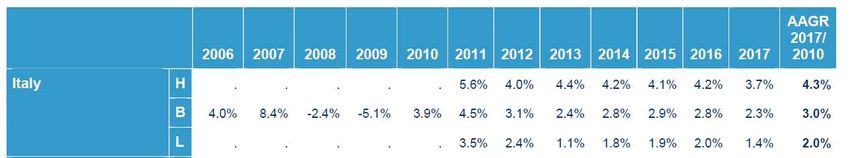
National Performance Plan – Italy

Italy foresees to apply only one incentive scheme on capacity to ENAV, in addition to the risk
sharing mechanism foreseen by the EC Reg. n. 691/2010.

For what concerns capacity, Italy in recognition of the link between the high standards of quality of
service provided and given the excellent level of operating performance already achieved and
expected in the coming years by ENAV, will recognize to ENAV a bonus (at 1% of the determined
costs) for each of the years in which the declared capacity target is achieved.

In the same way, if ENAV performances in terms of capacity will go beyond the European capacity
target (0,5 minutes average ATFM delay per en-route flight), Italy will apply a penalty of 1% of the
determined costs (in nominal terms) for each of the years within RP1.

At the time when the plan is being prepared, ENAC is preparing a specific plan to monitor the
correct implementation of the performance plan and the adherence of the evolution of the National
and European KPIs to the profile described in the plan.

The ENAC oversight philosophy is based on the principle of the minimum interference with the
normal activity of Stakeholders, and therefore the utilization to the maximum extent possible of the
reports they prepare for their normal activity.

ENAC is well aware that this is the first implementation of regulation 691/2010, and therefore the
oversight policy and practices are to be considered as “first attempt”, and could be changed during
the period itself.

                                                   4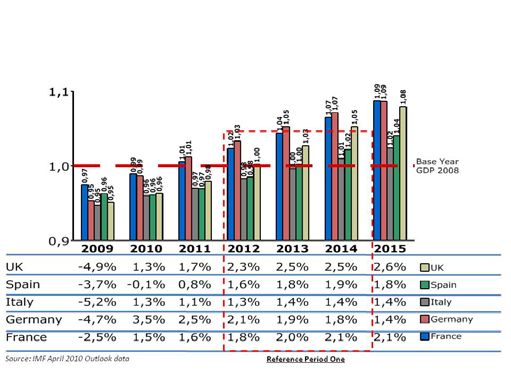
National Performance Plan – Italy

INDEX

       Executive Summary………………………………………………………………….……...3

1. INTRODUCTION ......................................................................................................... 11

1.1.      The situation ...................................................................................................................................... 11

1.2.      Overall assumptions for Reference Period 1 .................................................................................. 12

1.3.      Stakeholder consultation .................................................................................................................. 17

2. NATIONAL PERFORMANCE TARGETS AND ALERT THRESHOLDS ................... 17

2.1       Performance targets and alert thresholds for RP1 ........................................................................ 17
       (a)    Safety targets and thresholds ...................................................................................................... 18
       (b)    Capacity target and threshold ...................................................................................................... 19
       (c)    Environment target and threshold ............................................................................................... 24
       (d)    Cost-efficiency target and threshold ............................................................................................ 25

2.2    Consistency with EU-wide targets ................................................................................................... 26
    (a)   Safety ........................................................................................................................................... 26
    (b)   Capacity ....................................................................................................................................... 27
    (c)   Environment ................................................................................................................................. 28
    (d)   Cost-efficiency ............................................................................................................................. 28
  1) En route SU Forecast .......................................................................................................................... 28
  2) Determined en route ANS costs in nominal terms............................................................................... 31
  3) Determined en route ANS costs in real terms ..................................................................................... 33
  4) Real en route determined unit rate ...................................................................................................... 34
  5) Terminal ANS costs ............................................................................................................................. 35
    (e)   Interdependencies between targets ............................................................................................ 36

2.3       Carry-overs from the years before RP1 ........................................................................................... 36

2.4       Parameters for risk sharing and incentives .................................................................................... 37
       (a)    Safety ........................................................................................................................................... 37
       (b)    Capacity ....................................................................................................................................... 37
       (c)    Environment ................................................................................................................................. 38
       (d)    Cost-efficiency ............................................................................................................................. 38

3. CONTRIBUTION OF EACH ACCOUNTABLE ENTITY ............................................. 40

3.1       ENAV share in the national targets and individual binding performance targets ...................... 40
       (a)   Safety ........................................................................................................................................... 40
       (b)   Capacity ....................................................................................................................................... 51
       (c)   Environment ................................................................................................................................. 56
       (d)   Cost-efficiency ............................................................................................................................. 56

3.2       ITAF contribution to the national targets ........................................................................................ 67

3.3       ENAC share in the national targets and individual binding performance targets ...................... 70
                                                                                5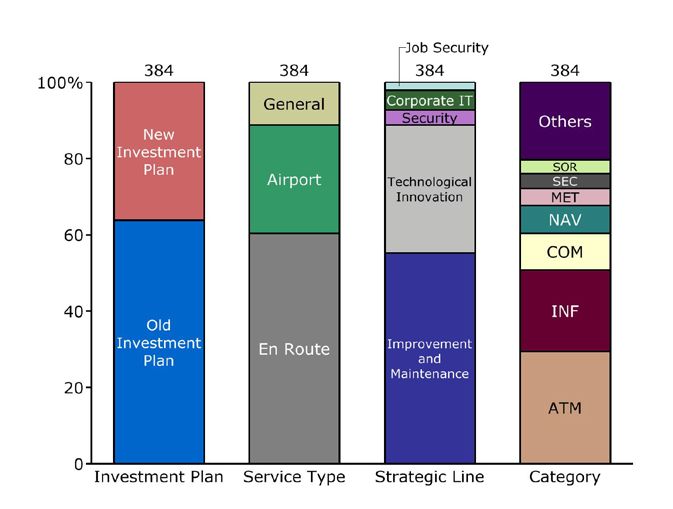
National Performance Plan – Italy

3.4    Incentive mechanisms to be applied on ENAV to encourage targets to be met over the
reference period ............................................................................................................................................. 70

4. CIVIL-MILITARY DIMENSION OF THE PLAN ........................................................... 72

1.4.       Performance of the FUA application ............................................................................................... 72

5. ANALYSIS OF SENSITIVITY AND COMPARISON WITH THE PREVIOUS
PERFORMANCE PLAN .................................................................................................... 72

5.1        Sensitivity to external assumptions ................................................................................................ 72

5.2        Comparison with previous performance plan ................................................................................ 72

6. IMPLEMENTATION OF THE PERFORMANCE PLAN .............................................. 73

Index of Tables

Table 1 – Accountable entities for the Performance Plan .............................................................. 16
Table 2 - Italy’s national targets and thresholds for RP1 ............................................................... 18
Table 3 - EU safety indicators for monitoring in RP1 .................................................................... 19
Table 4 - Italy’s en route capacity target for RP1 ........................................................................... 21
Table 5 - En route capacity target – details at national level .......................................................... 21
Table 6 - Actual and forecast air traffic movements in Italy. .......................................................... 23
Table 7 – KPI ATFM Arrival Delays ............................................................................................... 24
Table 8 - Italy’s en route cost-efficiency target for RP1 ................................................................. 25
Table 9 - Total en route ATFM delay breakdown/reference value ................................................ 28
Table 10 - En route service units forecast used for the calculation of the Italian en route cost-
efficiency target ............................................................................................................................. 29
Table 11 - En route service units forecast provided by STATFOR in February and May 2011 ...... 29
Table 12 - National determined en route costs – breakdown per entity (in nominal terms in national
currency) ....................................................................................................................................... 32
Table 13 - National determined en route costs – Breakdown by nature (in nominal terms in national
currency) ....................................................................................................................................... 33
Table 14 – IMF Inflation rates for Italy ........................................................................................... 33
Table 15 - National determined en route costs – total in real 2009 terms ...................................... 34
Table 16 - National real en route determined unit rate (in EUR2009) ............................................ 34
Table 17 - The composition of the National DUR ......................................................................... 35
Table 18 - National costs for terminal ANS – Breakdown per entity (in nominal terms in national
currency) ....................................................................................................................................... 35
Table 19 - Carry-overs from the years before RP1 - under (-) and over (+) –recoveries (in nominal
terms in national currency) ............................................................................................................ 36
Table 20 - Carry-overs from the years before RP1 as modified by CRCO and shown in the new
reporting tables ............................................................................................................................. 37
Table 21 – Capacity bonus and penalty ........................................................................................ 38
Table 22 – Safety indicators for the provision of Air Traffic Services ............................................. 43
Table 23 – Safety targets for the provision of Air Traffic Services ................................................. 43

                                                                               6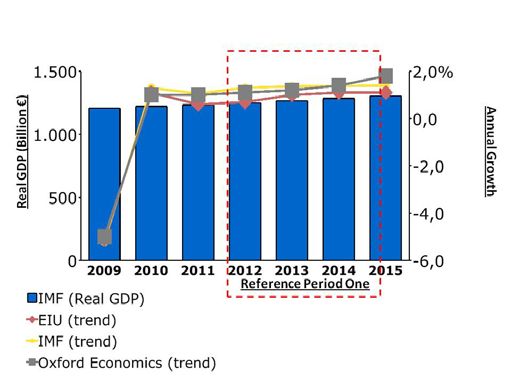
National Performance Plan – Italy

Table 24 – AIR Separation Minima Infringment ............................................................................. 44
Table 25 – Ground (Runway Incursion)......................................................................................... 44
Table 26 – ATM Specific Occurrences .......................................................................................... 45
Table 27 - Synopsis of the full suite of Safety KPI ......................................................................... 46
Table 28 - KPI S1 Effectiveness of Safety Management (EoSM) .................................................. 46
Table 29 - KPI S2 Application of the Severity Classification of the Risk Analysis Tool .................. 46
Table 30 - KPI S3 Just Culture ...................................................................................................... 46
Table 31 - KPI S4 Separation Minima Infringement....................................................................... 47
Table 32 - KPI S5 Runway Incursions ........................................................................................... 47
Table 33 - KPI S6 ATM Specific Occurrences ............................................................................... 47
Table 34 – Government targets set for high risk events extended from 2012 on ........................... 48
Table 35 – ENAV risk bearing events scheme .............................................................................. 48
Table 36 – Warning values (W1-W2) for FN.................................................................................. 48
Table 37 – Warning values (W1-W2) for Runway Incursions “C” and ASP .................................... 49
Table 38 – Fuori norma explanation .............................................................................................. 50
Table 39 – Rate of closure ............................................................................................................ 51
Table 40 – En route capacity target – Breakdown at national level ............................................... 54
Table 41 – ATFM en route delay per assisted flight. ..................................................................... 54
Table 42 – Brindisi ACC - Contribution to the National capacity target .......................................... 55
Table 43 – Milano ACC - Contribution to the National capacity target ........................................... 55
Table 44 – Padova ACC - Contribution to the National capacity target.......................................... 56
Table 45 – Roma ACC - Contribution to the National capacity target ............................................ 56
Table 46 – ENAV – comparison between 2009 and 2010 actual determined costs ....................... 57
Table 47 – ENAV – comparison between 2010 forecast and 2010 actual costs ............................ 57
Table 48 – ENAV+ITAF+EUROCONTROL – comparison between 2010 forecast and 2010 actual
costs ............................................................................................................................................. 57
Table 49 – ENAV – forecasted costs for 2011-2014...................................................................... 58
Table 50 – ENAV - Determined en route ANS costs by nature (in nominal terms in national
currency) ....................................................................................................................................... 58
Table 51 – ENAV - Determined en route ANS costs by service (in nominal terms in national
currency) ....................................................................................................................................... 58
Table 52 – ENAV – Comparison forecasted cost reduction compared with budget costs .............. 59
Table 53 – ENAV - Complementary information on the cost of capital en route (in nominal terms in
national currency) ......................................................................................................................... 59
Table 54 – ENAV - Terminal ANS costs in national currency ........................................................ 60
Table 55 – ENAV - Terminal ANS chargeable costs in national currency ...................................... 60
Table 56 – ENAV– Comparison between 2010 actual and 2010 forecast terminal costs ............... 60
Table 57 – ENAV - Annual investments (contract) in nominal terms in national currency for en route
and terminal ANS .......................................................................................................................... 63
Table 58 – ENAV - Description of the main investments impacting RP1 (in nominal terms in
national currency) ......................................................................................................................... 65
Table 59 – ENAV - Other investments (contract) in nominal terms in national currency for en route
and terminal ANS .......................................................................................................................... 66
Table 60 – ENAV - Description of other investments impacting RP1 (in nominal terms in national
currency) ....................................................................................................................................... 66
Table 61 – ENAV – Cost efficiency targets for RP1....................................................................... 67
Table 62 – ITAF – en route costs in the period 2009-2014 by nature ............................................ 69
Table 63 – ITAF – en route costs in the period 2009-2014 by services ......................................... 69

                                                                          7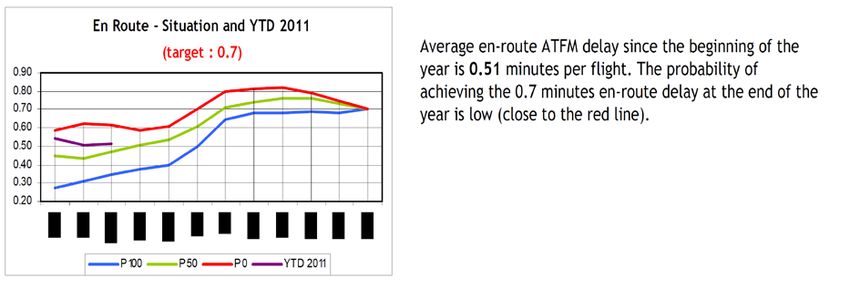
National Performance Plan – Italy
Table 64 – ITAF – terminal costs in the period 2010-2014 by nature............................................. 69
Table 65 – ENAC – En route costs for RP1................................................................................... 70
Table 66 – Incentive schemes applied on ENAV at national level for RP1 .................................... 71
Index of Figures
Figure 1- Representation of the Italian accountable entities hierarchical structure........................ 11
Figure 2 - Real GDP trend in RP1 ................................................................................................ 14
Figure 3 – Italy Real GDP trend in RP1 (IMF – EIU – Oxford Economics forecasts)..................... 14
Figure 4- Representation of the Italian airspace ........................................................................... 20
Figure 5- Representation of the ACC Area of responsibility for ATS provision .............................. 21
Figure 6- Movements forecast in Italy........................................................................................... 22
Figure 7- ENAV Safety Culture Footprint ...................................................................................... 41
Figure 8 - ENAV’s Maturity Score................................................................................................. 41
Figure 9 - SMS Maturity ............................................................................................................... 42
Figure 10- AIR Separation Minima Infringment ............................................................................. 44
Figure 11 - Ground (Runway Incursion) ....................................................................................... 44
Figure 12- ATM Specific Occurrences .......................................................................................... 45
Figure 13- Government targets set for high risk events extended from 2012 on ........................... 48
Figure 14- ENAV Risk bearing event for FN ................................................................................. 49
Figure 15- ENAV Risk bearing event scheme for Runway Incursions “C” and ASP ...................... 49
Figure 16- En Route – Situation and YTD 2011 ........................................................................... 52
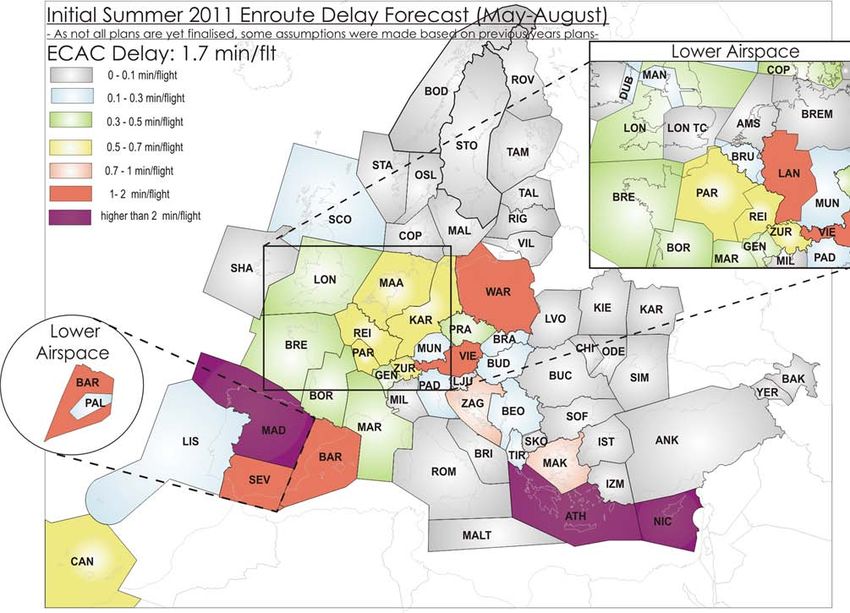
Figure 17- Initial summer 2011 en route delay forecast: May-August ........................................... 53
Figure 18- KPI En route ATFM delay............................................................................................ 55
Figure 19 – ENAV Investments in Reference Period One (2012-2014) ........................................ 62
Figure 20 – ENAV Top 6 Investment Programme in Reference Period One (2012-2014)............. 63
Figure 21 – ENAV Top 6 Investment Programme in Reference Period One (2012-2014)- relation
with the European Master Plan .................................................................................................... 64
8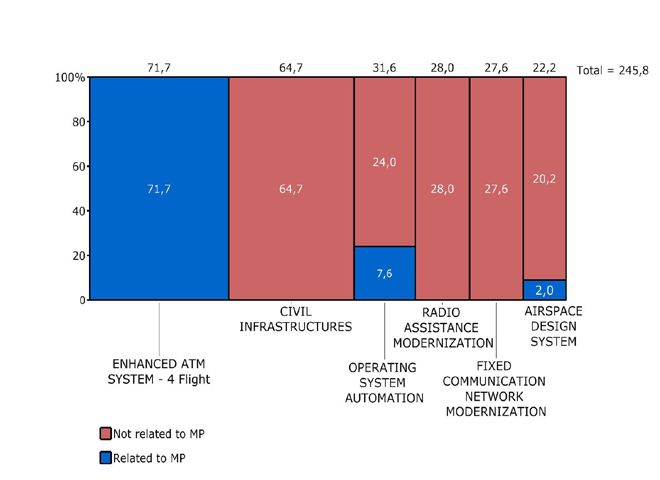
National Performance Plan – Italy

LIST OF ACRONYMS
ACC           Area Control Center
AFIS          Aerodrome Flight Information Services
ANSP          Air Navigation Service Provider
ANSV          Agenzia Nazionale per la Sicurezza del Volo
APP           Approach
ASM           Airspace Management
AST           Annual Summary Template
ATC           Air Traffic Control
ATFM          Air Traffic Flow Management
ATM           Air Traffic Management
ATS           Air Traffic Services
BOT           Buoni Ordinari del Tesoro (State Bond)
CAA           Civil Aviation Authority
CANSO         Civil Aviation Services Organisation
CFMU          Central Flow Management Unit
COM           Communication
CNS           Communications, Navigation, Surveillance
CTOT          Calculated Take-Off Time
DNM           Directorate Network Management
DPR           Decreto del Presidente della Repubblica
DUR           Determined Unit Rate
EAM/GUI       ESARR Advisory Material / Guidance Material
EC            European Commission
ECAC          European Civil Aviation Conference
ECB           European Central Bank
e-EMOR        Electronic ENAC Mandatory Occurrence Reporting
EIU           Economist Intelligent Unit
ENAC          Ente Nazionale Aviazione Civile
ENAV          Italian Company for Air Navigation Services
EOBT          Estimated Off-Block Time
ESARR         EUROCONTROL Safety Regulatory Requirement
EU            European Union
EUROCONTROL   European Organisation for the Safety of Air Navigation
FEP           Flight Efficiency Plan
FIR           Flight Information Region
FN            Fuori Norma (Out-of-the-Book Separation)
GAT           General Air Traffic
GDP           Gross Domestic Product
IATA          International Air Transport Association
IFR           Instrument Flight Rules
IMF           International Monetary Fund
IPP           Italian Performance Plan
ITAF          Italian Air Force
KPA           Key Performance Area
KPI           Key Performance Indicator
LSSIP         Local Single Sky ImPlementation
MET           Meteorological Services
MTF           Medium Term Forecast
NAV           Navigation Services
NPP           National Performance Plan
NSA           National Supervisory Authority
OAT           Operational Air Traffic
RAT           Risk Analysis Tool
ROE           Return on Equity
RP            Reference Period
SES           Single European Sky
                                                   9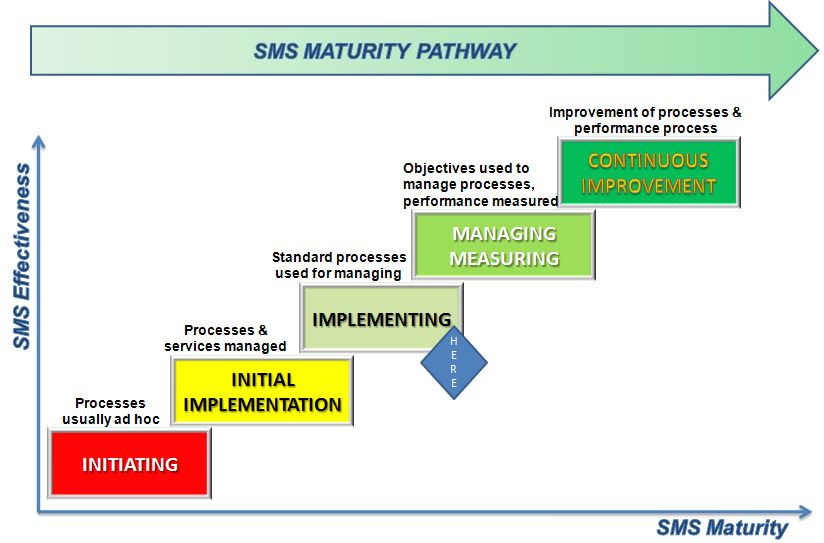
National Performance Plan – Italy

SESAR     Single European Sky ATM Research
SMS       Safety Management System
STATFOR   Air Traffic Statistics and Forecasts
SU        Service Unit
SUR       Surveillance
TLS       Target Level of Safety
UN        United Nations

                                                 10
National Performance Plan – Italy
1. INTRODUCTION
1.1. The situation
The Italian Performance Plan covers the first Reference Period (RP1: 2012-2014) with focus on
en-route Air Navigations Services and it is developed at National level, in compliance with the
provisions of the Commission Regulation n. 691 of 29 July 2010. The Plan follows the template
reported in Annex II of the EC Reg. n.619/2010.
ENAC, the Italian Civil Aviation Authority, has been designated as National Supervisory Authority
and it is responsible for the preparation of the Plan.
The plan is agreed by the Ministero dei Trasporti e delle Infrastrutture.
The accountable entities for the achievement of the declared targets are:
• ENAC, the Italian CAA;
• ENAV, the Company for Air Navigation Services;
• ITAF, the Italian Air Force.
Figure 1- Representation of the Italian accountable entities hierarchical structure
The Plan encompasses the three Italian FIRs, with the exception of the airspace South of Sicily
where Malta provides Air Traffic Services.
In addition Italy has agreement with bordering countries for the rectification of borders for
operational reasons. The extent of those cross-border agreements does not have relevant impact
on the average traffic.
The en-route service is provided by four ACCs, namely Brindisi, Milano, Padova, Roma.
Italy confirms its decision of deferring to the next Reference Period (RP2) the terminal from the
application of the Performance Scheme.
11National Performance Plan – Italy
1.2. Overall assumptions for Reference Period 1
The global Airline Industry recorded, until 2008 a period of high growth interrupted only by few
significant shocks such as 9/11 attacks to World Trade Center and the “dot com” stock market
bubble.
In 2008/2009, an economical crisis strongly affected the world. This crisis together with the
strong increase in oil price (that registered a peak of 147 $ per barrel in 2008 , had a direct
impact on the Airline Industry that globally lost, as a consequence, 25,9 billion dollars in
revenues in the period 2008/2009. This performance has been even worse than the one
registered in 2001/2002 after 9/11 attacks. In that period, the Airlines Industry globally lost 24,3
billion dollars in revenues.
Almost all main economic KPIs indicate a two-speed recovery after the 2009 crisis. In
advanced economies the growth rate is lower than the emerging countries:
• According to IMF Gross Domestic Product increased vs. previous year of 5,0%
worldwide and 1,7% in EU.
• Industrial production had an improvement vs. 2009 of 7,8% and 6,9% for OECD and
EU countries 1.
• Unemployment in EU is still high.
• Investment has increased from 21,7% in percentage of GDP in 2009 to 22,9% in 2010 2.
• Oil prices (in average) raised from 62$ per barrel in 2009 to 79$ in 2010. Currently it
jumped up to 111$ per barrel.
In 2010, the economy registered a first recovery from the crisis and this was reflected in the Air
Traffic Industry. As the matter of fact, both passengers and freight volumes have shown a
growth, although the positive trend was negatively impacted by volcanic ash cloud crisis. In
particular, passengers grew, in 2010, by 7% and freight volumes by 18%.
Air transport industry, as from IATA, ended 2010 “with improved profitability but low margins”:
• Industry net profits estimated in 16US$ billion, both influenced by the passenger (7,1%)
and cargo (18,1%) demand.
• The weakest recovery has been registered in Europe (1,4US$ billion vs. 7,6US$ billion
in Asia-Pacific and 4,7US$ billion in North America regions).
Overall European flight (ECAC area) growth in 2010 was 0,9%, close to the 2006 volume traffic
level, with significant differences between the various market segments 3. In particular:
• Traditional scheduled: -1,1%.
• Low cost carriers: +6,9%.
• Charter: -3,1%.
• Business aviation: +5,6%.
• All cargo: +2,7%.
In 2010 Italian airports have shown recovery 4:
1
Source: OECD – Organisation for Economic Co-operation and Development
2
Source: IMF – International Monetary Fund
3
Source: EUROCONTROL - STATFOR Interactive Dashboard
12National Performance Plan – Italy
• Both in movements (+1,3%) and passengers (+7,0%, equal to +9,1 million).
• Cargo volumes raised up to +18%.
With regards to the main Italian airports:
• Most of 6 main Italian airports 5 confirm recovery from 2009, in terms of movements and
passengers.
• Malpensa up to +3,3% (mvmts) and +8,0% (pax).
• Roma Fiumicino main airport had +1,5% in terms of movements and +7,5% increase in
terms of passengers (+2,5 million more than 2009).
For what concerns Service Units (SU), the year 2010 saw a general recovery for almost all the
European ANSPs but values have not returned to pre-crisis one.
After the end of the volcanic ash problem, the Service Unit volumes have returned to positive
growth (+3.3% 2010 vs. 2009).
However, it should be noted that in 2010, SU trends are not homogeneous in the five largest
European providers 6: while Italy has recorded the best performance with a +5.9%, there were
decreases of -4.4% for Great Britain and -0.9% for France, an increase of +3.4% for Spain and
+3.2% for Germany. Among emerging EUROCONTROL countries, Turkey recorded a +10.4%.
For what concerns the Italian economic situation, it reflects the actual European context and
confirms a slight recovery from 2009 crisis 7:
• Estimated data of 1,3% GDP percentage change (vs. 2009) provides evidence of a
slow growth.
• Italian industrial production increased by 2,3 % compared to the same period in 2009.
• IV quarter 2010 unemployed rate was 8,7% from 8,6% IV quarter 2009.
This Performance Plan includes a view of slow economical recovery in Europe during the RP1
(2012-2014). In particular, the expectation for GDP growth in Italy and the other main European
countries are :
4
Source: Assaeroporti
5
The six main airports are Catania Fontanarossa, Milano Linate, Milano Malpensa, Napoli Capodichino, Roma Fiumicino
and Venezia Tessera.
6
Source: EUROCONTROL.
7
Source: ISTAT – National Institute of Statistics in Italy. Industrial production data are corrected with calendar.
13National Performance Plan – Italy
Figure 2 - Real GDP trend in RP1
Figure 3 – Italy Real GDP trend in RP1 (IMF – EIU – Oxford Economics forecasts)
On one hand, the positive GDP trend expected by analysts such as International Monetary Fund,
Economist Intelligence Unit and Oxford Economics and shown in the above table is supposed to
drive growth in ANS service during Reference Period One (2012-2014).
On the other hand, the profitability of the industry is expected to reduce because of the uncertainty
resulting from the crisis and the growing oil and jet kerosene prices.
Another relevant factor to be considered is the socio-political crisis taking place in the North Africa
Region. In particular, this Area represents an important market for Italy (10% of flight movements
and 18% of Service Units).
In March 2011, overall traffic to Egypt stabilized at 25% below 2010 volumes and overall traffic to
Tunisia at 30% below 2010. Moreover on 17 March was imposed a “No-fly zone” over the territory
of Libya that is still in force.
14National Performance Plan – Italy
For what concerns the air transport industry forecasts, IATA cuts its estimate for airline industry
profits (net post-tax) in 2011 from US$ 9.1 billion to US$ 8.6 billion, a 46% reduction from the US$
16 billion of profit estimated last year.
This downgrade is due to the recent increase in oil and jet kerosene prices. In line with market
forecasts, IATA assumes an average crude oil price of US$ 96 a barrel this year, significantly
higher than IATA previous forecast of US$ 84 a barrel.
Regional differences will remain during 2011 with a particular contrast between weak European
home markets and still strong traffic originating from the so-called ‘emerging’ markets. Asia-Pacific
airlines are expected to continue to be the most profitable.
Due to the robust demand for air transport and the strengthening of business confidence, IATA
forecasts growth in passenger markets of 5.6% in 2011, and growth of 6.1% in air cargo. Overall
this generates an expansion of 5.7% in tonne kilometers flown, not far from the expected 6%
expansion in capacity.
Finally, for what concerns inflation rate forecast for Italy, in the Reference Period One (2012-2014),
it is expected to be fairly stable around 2% according to the IMF April 2011 Outlook.
Status of Italy Aviation Safety
Italy is updating the State Safety Program (SSP) in accordance with the standards contained in
ICAO Annexes 6, 11 and 14. The updated version of SSP will be published within 2011.
As far as ATM is concerned, Italy is aligned to the European SES regulation. All Civil ANSP are
certified and no derogation to the requirement of the Safety Management System has been
granted.
The safety statistics are supported by a robust reporting.
Investigation of accidents and serious incidents are performed by the Agenzia Nazionale Sicurezza
Volo.
According to the Common Requirements each service provider performs an internal investigation
for each incident which happens within the airspace volume where it is designated, or to the
systems used for the service provision.
The severity of ATM related incidents is assessed using the TOKAI tool by ENAV S.p.A. Data are
collected to contribute to the Annual Summary template. Since the certification of ENAV S.p.A
(June 2007) no adverse trend in incidents have been observed.
ITAF runs its own reporting system and has developed an investigation and assessment function
which reaches equivalent levels of compliance to the EU requirements. Events regarding civil
aviation are regularly transmitted to ENAC.
15National Performance Plan – Italy
ENAC performs a state-of-the-art safety oversight of Air Navigation Service Provision, in
accordance with the requirements of EC Regulation n. 1315/2007.
Other general aspects
ENAV S.p.A is the Company designated by the Italian State for Air Navigation Service Provision to
General Air Traffic (GAT) in Italy.
Every 3 years ENAV signs a programme and service contract with the Ministry of Finance and
Economy, Ministry of Transportation and Infrastructure and the Ministry of Defense. This contract
regulates the main operational and economical relations between the Company and the State.
In accordance with the European Community Regulation 550/2004, article 7, paragraph 5, the
Italian Air Force is authorized to provide ATS, CNS and MET Services to General Air Traffic (GAT)
without certification.
Air Traffic Services (ATS) are provided by ITAF or ENAV S.p.A. within the Air Space respectively
assigned by National Law (DPR 484/81). ENAV provides MET services to those airports where it
provides ATS.
At the moment, no change is expected in this scenario during the first Reference Period.
Entities / Performance areas Safety Environment Capacity Cost-Efficiency
8
ENAC Yes N.A. N.A. Yes
ENAV S.p.A Yes Yes Yes Yes
9 10
ITAF N.A . N.A. N.A. Yes
Table 1 – Accountable entities for the Performance Plan
ITAF, the Italian Air Force, is the ANSP authorised by Italian State to provide services without
certification pursuant article 7, comma 5, of SPR. In particular, for en route it provides MET and
APP Services for GAT. The role of ITAF for terminal is going to be reduced alongside the number
of military airports.
According to EC Reg. 1794/2006 (as amended by Reg. 1191/2010) ITAF is subject to cost risk but
not to traffic risk. ITAF has a mainly rigid structure of costs, because: the cost of military staff is
determined by the State as for all other military personnel by a specific law, its assets are also
used for military purposes and operational configurations are driven by defence needs.
At the same time the opening and or closure of new Air Traffic Service units manned by ITAF is
always done through Ministerial decrees or other legislative acts.
8
Not subject to traffic risk.
9
ITAF contributes to the monitoring of safety performance through regular reporting to ENAC of ATM related events.
10
Not subject to traffic risk.
16National Performance Plan – Italy
1.3. Stakeholder consultation
Italy has had three consultation meetings: one with the User representatives and two with the
Trade Unions representatives.
For all the details and consultation material, please refer to the Annex D.
2. NATIONAL PERFORMANCE TARGETS AND ALERT THRESHOLDS
This section presents, for each KPA, the KPIs and associated targets adopted at national level; in
this part are also illustrated the KPIs subject only to monitoring activities under the NSA control.
2.1 Performance targets and alert thresholds for RP1
For the first reference period, Italy will adopt targets which refer only to the KPIs of en route
capacity and cost-efficiency.
For the KPAs of Safety it is foreseen the monitoring of the three leading indicators and the three
lagging indicators, as per EC regulation n.691/2010.
For the Environment KPA, Italy does not foresee target for RP1, in line with EC regulation
n.691/2010.
For the Capacity KPA, Italy does not foresee Airport and Terminal Area Capacity Target: for RP1,
in line with EC regulation n.691/2010, it is foreseen the monitoring of the three KPIs (ATFM Arrival
Delay, Taxi-out additional time and Adherence to ATFM slot) as per mentioned EC Performance
Scheme Regulation.
The targets for capacity and cost-efficiency are set for the entire reference period and annual
values are provided.
For the KPA of cost-efficiency, Italy has defined the following national thresholds:
• For what concerns economic aspects, the threshold takes into consideration all those
events which cannot be controlled by the State but that might have a relevant impact on
the target (in terms of costs and/or revenues). The proposed additional threshold aims at
taking into account the local specificities of Italy.
• For what concerns traffic, the exceptional situation that is interesting the Mediterranean
area is demonstrating that an alert threshold of 10% on traffic is too high for Italy because
its effects could be devastating for the financial stability of the providers that would lead to
significant and dangerous detrimental effects on the level of safety and quality of the
service offered. Therefore, as local alert threshold on traffic, Italy will activate the process
for a possible target revision for any variation higher than 4,5% on the forecasted level of
traffic (flights or SU).
For the capacity KPA, Italy deems appropriate the alarm threshold being triggered by the
fluctuation reported in the STATFOR MTF for each year, or its variation over 1% tolerance (+/- 1%)
17National Performance Plan – Italy
with reference to the HIGH and LOW traffic growth as assumed from the baseline proposed by
STATFOR, whichever smaller.
Table 2 below presents the national targets and thresholds for RP1.
National targets
KPA KPI National thresholds
2012 2013 2014
1. Effectiveness of safety management Monitoring Monitoring Monitoring n.a.
2. Application of severity classification
2.1 Separation Minima Infringement Monitoring Monitoring Monitoring n.a.
(a) Safety 2.2 Runway Incursions Monitoring Monitoring Monitoring n.a.
2.3 ATM special technical events (ATM Specific
Occurrence in ESARR 2) Monitoring Monitoring Monitoring n.a.
3. Implementation of Just Culture Monitoring Monitoring Monitoring n.a.
Italy deems appropriate the alarm threshold being triggered by the fluctuation
reported in the STATFOR MTF for each year, or its variation over 1% tolerance
(b) Capacity En-route ATFM delay (minutes per flight) 0.14 0.14 0.12
(+/- 1%) with reference to the HIGH and LOW traffic growth as assumed from
the baseline proposed by STATFOR, whichever smaller.
(c) Environment FEP Implementation Monitoring Monitoring Monitoring n.a.
1) For what concerns economic aspects, the threshold takes into consideration
all those events which cannot be controlled by the State but that might have a
relevant impact on the target (in terms of costs and/or revenues). The
proposed additional threshold aims at taking into account the local specifities
of Italy.
2) For what concerns traffic, the exceptional situation that is interesting the
Determined en-route unit rate (2009 prices in national
(d) Cost-efficiency € 70,31 € 68,21 € 65,96 Mediterranean area is demonstrating that an alert threshold of 10% on traffic is
currency)
too high for Italy because its effects could be devastating for the financial
stability of the providers that would lead to significant and dangerous
detrimental effects on the level of safety and quality of the service offered.
Therefore, as local alert threshold on traffic, Italy will activate the process for a
possible target revision for any variation higher than 4,5% on the forecasted
level of traffic (flights or SU).
Table 2 - Italy’s national targets and thresholds for RP1
For the scope of the IPP, all issues related to airport and terminal area are subject to NSA
monitoring (during RP1 not national target are defined in these domain).
For each KPA, details are provided in the following sections.
(a) Safety targets and thresholds
The Performance Regulation of the Single European Sky requires all EU Member States to
develop National Performance Plans, setting out their performance targets for the near future.
For what concerns safety performance within the Italian airspace as a contribution to the Italian
National Performance Plan, currently Italy does not set quantitative Target Level of Safety (TLS)
for ANSPs and has not set any national performance targets or thresholds for safety in RP1; there
is no EU requirement to do so.
The EU is establishing 3 safety KPI that can be characterized as “leading” indicators and 3 KPI as
“lagging” indicators to harmonize reporting and classification of Safety Events.
18National Performance Plan – Italy
SAFETY
During RP1 States to monitor and publish the following safety KPIs.
1. Effectiveness of safety management
2. Application of severity classification
2.1 Separation Minima Infringement
2.2 Runway Incursions
2.3 ATM special technical events (ATM Specific Occurrence in ESARR 2)
3. Implementation of Just Culture
Table 3 - EU safety indicators for monitoring in RP1
Having Italy not proposed to adopt any optional targets for the safety KPIs that have been defined
for RP1, Italian ANSPs will provide to ENAC for monitoring and publishing performance data
against these indicators as required.
(b) Capacity target and threshold
The (EC) Regulation No 691/10 lays down a performance scheme for air navigation services and
network functions. In accordance with it the following issues have to be taken into account:
- the establishment and implementation of key performance indicators and of the
performance targets requires the appropriate consistency with the safety objectives and
standards laid down in Regulation (EC) No 216/2008 of the European Parliament and of the
Council of 20 February 2008 on common rules in the field of civil aviation and establishing a
European Aviation Safety Agency, and repealing Council Directive 91/670/EEC, Regulation
(EC) No 1592/2002 and Directive 2004/36/EC, and its implementing rules together with the
measures taken by the European Union to achieve and maintain these objectives;
- the implementation of binding performance targets supported by incentives that can be of
financial nature requires appropriate links with Commission Regulation (EC) No 1794/2006,
of 6 December 2006 laying down a common charging scheme for air navigation services;
- pursuant to Article 11 of Regulation (EC) No 549/2004, Regulation (EC) No 691/2010
should apply to the air traffic management network functions referred to in Article 6 of
Regulation (EC) No 551/2004 of the European Parliament and of the Council through an
appropriate amendment of this Regulation;
- for the purpose of target setting, to each key performance area shall correspond 11 one or a
limited number of key performance indicators. The performance of air navigation services
shall be assessed by means of binding targets for each key performance indicator;
- the key performance indicators 12 should be selected for being specific and measurable and
allowing the allocation of responsibility for achieving the performance targets;
- the associated targets should be achievable, realistic, and timely and aim at effectively
steering the sustainable performance of air navigation services;
11
The key performance indicators shall not be changed in the course of a reference period.
12
‘Key performance indicators’ are the performance indicators used to identify performance targets. ‘Performance
indicators’ are the indicators used to monitor performance, identify benchmarks and reviewing.
19National Performance Plan – Italy
- during the reference 13 periods an effective performance monitoring process should be put
in place to ensure that the evolution of performance allows meeting the targets and if
necessary introducing appropriate measures;
- for the first reference period (RP1) the mandatory Key Performance Indicator of Capacity
(Capacity KPI), shall be the en route ATFM delay (for all reasons) per flight 14, calculated as
the difference between the take-off time requested by the aircraft operator in the last
submitted flight plan and the calculated take-off time allocated by the central unit of ATFM;
- at the end of the RP1 (2014), the established EU-wide Capacity Performance Target is 0.5
minute for en route flight 15;
- until the end of 2011 the Provisional Council has determined the EU-wide target for the
ANSPs which is referred to the summer season (May-October) and is limited to the en route
air traffic. Specifically the average en route delay per flight equals to a 1 minute of delay per
assisted flight;
- the Capacity Performance Indicator at a national level, includes all IFR flights and covers en
route ATFM delay causes within Italian Airspace where the ATM (ATC, ASM and ATFCM
services) is provided by ENAV through their ACC 16;
this chapter specifies the en route capacity target that Italy is committed to achieve during the first
period of the Performance Scheme (RP1 2012/2014), being consistent with the general objectives
arising from the Single Sky legislation.
Figure 4- Representation of the Italian airspace
13
The first reference period (RP1) for the performance scheme covers the calendar years 2012-2014. The same
reference period shall apply to the European Union wide performance targets and the national or functional airspace
blocks performance plans and targets. The indicator, both at European or National level, is calculated for the whole
calendar year. The second reference period (RP2) for the performance scheme covers the calendar years 2015-2020.
4 The indicator, at a European level, includes all IFR flights within the European airspace and covers the ATFM delay
causes.
15
European Commission Decision EC/121/11 – 21 February 2011 which identifies the European Union-wide
performance targets and critical thresholds for the provision of air navigation services for the years 2012-2014
16
For the purpose of target setting, this Regulation shall apply to the air navigation services provided by air traffic service
providers designated in accordance with Article 8 of Regulation (EC) No 550/2004 of the European Parliament and of the
Council and by providers of meteorological services, if designated in accordance with Article 9 of that Regulation; in Italy,
according to art. 691bis of the Navigation Act ENAV S.p.A. is the ANS Provider designated.
20National Performance Plan – Italy
Figure 5- Representation of the ACC Area of responsibility for ATS provision
Italy accepts the requested level of contribution to the achievement of adopted European Union
Wide capacity targets and agrees on the performance targets suggested by EUROCONTROL and
reported in the Italian Local Single Sky Implementation Plan (LSSIP) 2011-2015.
The national performance targets of en route delay “all ATFM reasons” are 0.14, 0.14 and 0.12 per
en route controlled flights for years 2012, 2013, 2014 respectively.
2012 2012
2014
Capacity KPI Intermediate Intermediate
Target
Value Value
Minutes of en-route ATFM delay per flight 0.14 0.14 0.12
Table 4 - Italy’s en route capacity target for RP1
The values reported in Table 3 are the same as those evaluated by the "EUROCONTROL -
Directorate of Network Management” being the potential reference values deemed necessary to
achieve the European Capacity target. These targets are defined to provide the proper balance
between the needs of both the airspace users and the air navigation service provider designated
by the Italian State, taking into account the overriding and paramount safety objectives. Details are
provided below (see table 5).
2009A 2010A 2011F 2012F 2013F 2014T
En-route ATFM delay prior to RP1 (en-route ATFM delay
0,02* 0,01** 0,18
minutes per flight)
Reference value from the capacity planning process of
EUROCONTROL (en-route ATFM delay minutes per flight) 0,14 0,14 0,12
% n/n-1 -22% 0% -14%
National capacity target (en-route ATFM delay in minutes
per flight) 0,14 0,14 0,12
% n/n-1 -22% 0% -14%
Difference between the target and the reference value 0,00 0,00 0,00
*Source Eurcontrol/CFMU – Processed by ENAV/AOP “Annual Report 2010 ”. Data regarding the Summer Season.
**Source Eurcontrol/CFMU – Processed by ENAV/AOP “Annual Report 2010 ”. Data regarding the Summer Season.
Table 5 - En route capacity target – details at national level
For what concerns the alert threshold, associated with the EU-wide targets at a European level is
represented by the deviation in a calendar year by, at least, 10% of the actual traffic recorded by
the PRB with respect to the traffic forecasts in ECAC Area.
21National Performance Plan – Italy
Taking into account:
the overriding and paramount safety objectives;
the effort sustained by ENAV S.p.A to ensure the high level of quality in air navigation
services provided in their area of responsibility;
the inevitability and incompressibility of specific costs which ENAV S.p.A. is subject to (the
first of them is aimed to ensure the highest level of safety, and then to wages, to train the
operational staff, to maintain their appropriate competence, to operate - at least - the
minimum configurations for each Control Center, to maintain the ATM and CSN
infrastructure, to develop and modernize the new systems, to operate the airport and
terminal areas of competence, etc);
the expected grown in traffic in 2011 (+4.5%) in 2012 (+3.1%) in 2013 (+2.4%) and 2014
(+2.8%); and
the variation in EUROCONTROL/STATFOR traffic forecast (a spread around the baseline
value in the expected air traffic grown is also foreseen. It ranges from -1.3% [Low traffic] to
+2.4% [High traffic], as peak levels during the RP1);
the alarm threshold deviation set at a European level by (EC) Regulation CE 691/2010 17 -
which also considers the tradeoff between operations and plans of the neighboring States - is
not being used nor considered appropriate at a national level.
Source: STATFOR (MEDIUM TERM FORECAST ed. Feb. 2011)
Figure 6- Movements forecast in Italy.
Given that:
− it is mandatory to respect the paramount safety objectives established for the capacity
performance area;
− the traffic forecasts, consistent with the requirements listed in the Implementing Rule of the
Performance Scheme used by EUROCONTROL - Directorate of Network Manager - to predict
the "reference values for ACC delay SES II, are based on a medium-long term (STATFOR
Medium Traffic Forecast - MTF);
− such traffic forecasts may be partially overcome (e.g. due to special events or phenomena that
may affect the performance of air traffic and which were not envisaged at the time of publication
of the MTF) or would require a revision (as proposed by both the STATFOR Traffic Forecast
Short - STF and Monitoring and Forecast – FM documents);
− the airport capacity is a potential bottleneck of the whole ATM system, in fact EUROCONTROL
notes that the reliability of STATFOR forecasts depends on the airports’ capacity values (that
17
Art. 18.3. “Member States, at national or functional airspace block level, may decide to adopt alert
thresholds different from the ones referred to in Article 9(3), in order to take account of local circumstances
and specificities”.
22National Performance Plan – Italy
are not subject to performance targets for the RP1 and are not, by and large, under the
responsibility of the ANSP who are, vice versa, subjected to the en route capacity target);
− the assumption of the most pessimistic scenario (the worst credible case) delivers a very narrow
variation of air traffic in the Italian air space;
− the results coming out from the comparison between the actual and the forecasted air traffic
movements (high and low forecast values included) in the years 2008-2010 showed that the
actual values were always very close to the extreme edges of the uncertainty window (either
high or low, according to the period - see table below 6). This scenario is likely to happen again
during the RP1 timeframe;
− the most significant digit of the capacity performance target requested to the Italian State
(expressed by minutes of all Reasons ATFM delay per en route flight) is the hundredth of
minute that’s to give evidence of the outstanding performance level achieved and hardly
comparable with the majority of European States;
− the ATM technology investments are either directly or indirectly functional to the achievement of
targets related to safety and capacity performance levels;
Italy deems appropriate the alarm threshold being triggered by the fluctuation reported in the
STATFOR MTF for each year, or its variation over 1% tolerance (+/- 1%) with reference to the
HIGH and LOW traffic growth as assumed from the baseline proposed by STATFOR, whichever
smaller.
Italy – Air Traffic Variation Actual vs Forecast Actual Growth
Low High
Dec08-Jan09 vs. Dec07-Jan08 -14.3% -15.9% -1.8
Forecast yr. 2010 issued in 2009 -3.7% -4.9% 12.3%
Forecast yr. 2009 issued in May 2009 -6.1% -9.6% -1.3%
May-Aug 2009 vs. May-Aug 2008 -4.9% -12.0% -2.3%
Feb-Apr 2010 vs Feb-Apr 2009 0.0% 0.2% 4.8%
Aug-Nov 2010 vs. Aug-Nov 2009 6.0% 2.8% 7.5%
Source: Eurocontrol STATFOR Short-term Forecast (2008-2010 documents). Processed by ENAV/AOP.
Table 6 - Actual and forecast air traffic movements in Italy.
If the air traffic variation exceeds such threshold values, established with reference to each yearly
value, the effects generated both in terms of en route ATFM delays and costs supported by ENAV
S.p.A. will follow a similar process to the ones already established for the same scope at a
European level.
Whenever the variation of the air traffic exceeds the defined threshold values, the appropriate
tradeoff between the objectives set out in the capacity and costs performance areas and the
airspace users’ needs will be evaluated, with compliance to the paramount and overriding
objectives about safety.
Capacity - Terminal and Airports
For the first reference period (2012-2014 RP1), the Performance Scheme (EC Regulation 691/10),
differently from the en route phase of flight, does not set any capacity targets for the airport and
terminal area, nor any obligations for the terminal phase of flight are defined at national and/or FAB
level.
23You can also read