Employment, Vocational Education and Training and Social Policies in Italy - European Parliament
←
→
Page content transcription
If your browser does not render page correctly, please read the page content below
STUDY
Requested by the EMPL committee

      Employment, Vocational
     Education and Training and
        Social Policies in Italy
     A review of employment, VET and social policies

           Policy Department for Economic, Scientific and Quality of Life Policies
                         Directorate-General for Internal Policies
                       Authors: SAMEK LODOVICI M., CREPALDI C.,
                         ORLANDO N., NICO G., ROMANIELLO D.                          EN
                               PE 631.050 - February 2019
Employment, Vocational
Education and Training and
   Social Policies in Italy
A review of employment, VET and social policies

       Abstract
       This document presents recent developments in the social,
       employment and VET situation and policies in Italy. The report
       provides an assessment of the recent evolution of key economic,
       social, and labour market trends in Italy, and an overview of
       current employment, VET and social policies.
       The document was prepared by Policy Department A at the
       request of the European Parliament’s Committee on
       Employment and Social Affairs.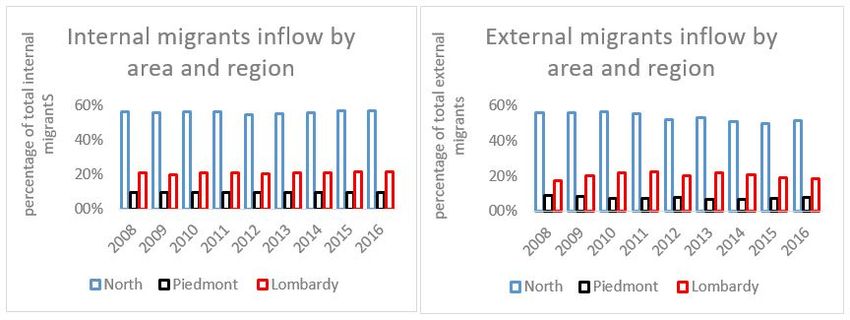
This document was requested by the European Parliament's Committee on Employment and
Social Affairs.

AUTHORS
Manuela SAMEK LODOVICI, Chiara CREPALDI and Nicola ORLANDO, IRS-Istituto per la Ricerca Sociale
Gianluigi NICO, University of Rome Tor Vergata, Faculty of Economics
Davide ROMANIELLO, University of Rome Tre, Faculty of Economics

ADMINISTRATOR RESPONSIBLE
Aoife KENNEDY

EDITORIAL ASSISTANT
Roberto BIANCHINI

LINGUISTIC VERSIONS
Original: EN

ABOUT THE EDITOR
Policy departments provide in-house and external expertise to support EP committees and other
parliamentary bodies in shaping legislation and exercising democratic scrutiny over EU internal
policies.

To contact the Policy Department or to subscribe for updates, please write to:
Policy Department for Economic, Scientific and Quality of Life Policies
European Parliament
L-2929 - Brussels
Email: Poldep-Economy-Science@ep.europa.eu

Manuscript completed: October 2018
Date of publication: February 2019
© European Union, 2019

This document is available on the internet at:
http://www.europarl.europa.eu/supporting-analyses

DISCLAIMER AND COPYRIGHT
The opinions expressed in this document are the sole responsibility of the authors and do not
necessarily represent the official position of the European Parliament.
Reproduction and translation for non-commercial purposes are authorised, provided the source is
acknowledged and the European Parliament is given prior notice and sent a copy.
For citation purposes, the study should be referenced as: Samek Lodovici, M, Crepaldi, C., Orlando, N.,
Nico, G., Romaniello, D., Employment, VET and Social Policies in Italy, Study for the Committee on
Employment and Social Affairs, Policy Department for Economic, Scientific and Quality of Life Policies,
European Parliament, Luxembourg, 2019.
© Cover image used under licence from Shutterstock.com

Employment, VET and Social Policies in Italy

CONTENTS

LIST OF ABBREVIATIONS                                                                                        5
LIST OF BOXES                                                                                                6
LIST OF FIGURES                                                                                              6
LIST OF TABLES                                                                                               7
EXECUTIVE SUMMARY                                                                                            8
    RECENT DEVELOPMENTS IN EMPLOYMENT AND SOCIAL INCLUSION                                                 10
   1.1.      The macroeconomic context                                                                      10
   1.2.      The social context                                                                             11
   1.3.      The labour market                                                                              14
   1.4.      Vulnerable groups in the labour markets                                                        20
             1.4.1. Young people                                                                            20
             1.4.2. Migrants                                                                                24
             1.4.3. Women                                                                                   27
   1.5.      Vocational education and training: key features                                                29
    RECENT DEVELOPMENTS IN THE ITALIAN LABOUR MARKET AND VET POLICIES                                      30
   2.1.      Recent developments in labour market reforms                                                   30
             2.1.1. Overview of recent labour market reforms in Italy: the Jobs Act reform                  31
             2.1.2. Measures enacted since 2015                                                             34
             2.1.3. Initial indications of the Conte government                                             36
   2.2.      Recent developments in VET policies                                                            36
             2.2.1. Organisation and responsibilities in the implementation of VET programmes               36
             2.2.2. Overview of recent or proposed reforms in VET                                           38
    RECENT DEVELOPMENTS IN SOCIAL POLICIES                                                                 41
   3.1.      Social protection                                                                              41
   3.2.      The fight against poverty                                                                      41
             3.2.1. Family and children policies                                                            41
             3.2.2. Policies for the non-self-sufficient elderly and the disabled                           42
             3.2.3. Policies for the protection of migrants                                                 42
             3.2.4. Pensions                                                                                43
             3.2.5. Expenditure for social policies                                                         43
    LABOUR MARKET AND SOCIAL DEVELOPMENTS IN LOMBARDY AND PIEDMONT                                         44
   4.1.      The social context in the regions of Lombardy and Piedmont                                     44
   4.2.      Labour market conditions in Lombardy and Piedmont                                              46

PE 631.050                                            3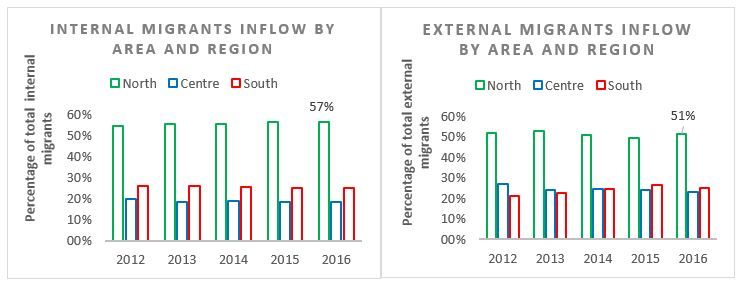
IPOL | Policy Department for Economic, Scientific and Quality of Life Policies

   4.3.     Overview of recent labour market interventions and VET in Lombardy and Piedmont    48
   4.4.     Overview of recent social policy developments in Lombardy and Piedmont             50
            4.4.1. Lombardy                                                                    50
            4.4.2. Piedmont                                                                    50
   4.5.     The role of the ESF in Lombardy and Piedmont                                       51
REFERENCES                                                                                     57
ANNEX                                                                                          59

                                                       4                                PE 631.050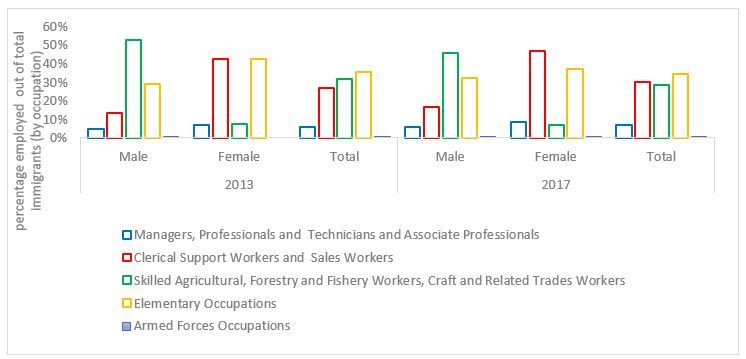
Employment, VET and Social Policies in Italy

LIST OF ABBREVIATIONS
 ANPAL       National Agency for Active Labour Market Policies

 ASDI        Assegno di Disoccupazione (Unemployment grant)

 ASPI        Assicurazione Sociale per l’Impiego (Social insurance for employment)

 ATO         Accredited training organisations

 CEDEFOP     European Centre for the Development of Vocational Training

 CIE         Centro di identificazione ed espulsione (Repatriation centre)

 CSR         Country Specific Recommendation

 CVT         Continuing vocational training

 EPL         Employment Protection Legislation Index

 EU28        European Union, 28 countries

 GDP         Gross domestic product

 IeFP        Istruzione e Formazione Professionale (Vocational Education and Training)

 ILO         International Labour Organization

 IMF         International Monetary Fund

 IMU         Imposta Municipale Propria (Municipal property tax)

 ISCED       International Standard Classification of Education

 ISEE        Indicatore di situazione economica equivalente (Indicator of household economic
             conditions)

 ISTAT       Istituto Nazionale di Statistica (National Institute of Statistics)

 NASPI       Nuova assicurazione sociale per l’Impiego (New social insurance for employment)

 NGO         Non-governmental organisation

 OECD        Organization for Economic Cooperation and Development

 PASS        Network of social protection and social inclusion

 PPP         Purchase power parity

 REI         Reddito di Inclusione (Inclusion income)

 SIA         Support for Active Inclusion

 UNESCO      United Nations Educational, Scientific and Cultural Organization

 VAT         Value added tax

 VET         Vocational education and training

PE 631.050                                     5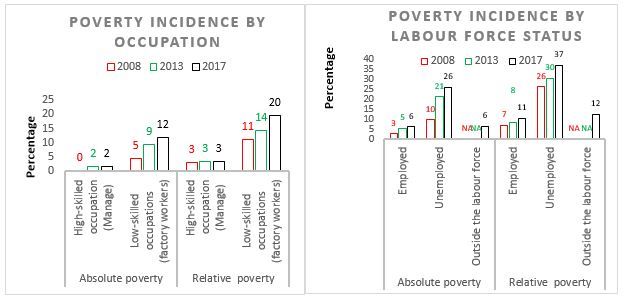
IPOL | Policy Department for Economic, Scientific and Quality of Life Policies

LIST OF BOXES
Box 1. Youth Educational attainment                                                                22
Box 2. Main provisions of the Jobs Act (L.183/2014) and its related implementing decrees           32

LIST OF FIGURES
Figure 1: GDP growth (PPP 2011 international USD). Years: 2000-2023 (from 2019, IMF projections) 10
Figure 2: Relative and absolute poverty in Italy and main geographical areas (2008, 2013 and 2017) 12
Figure 3: Poverty profile by age and education (percentage of total population)                    12
Figure 4: Poverty profile by occupation and labour force status (percentage of total population)   13
Figure 5: Italy male and female population (percentage of total population) by age group (2017)    15
Figure 6: Jobs gap with respect to the pre-crisis trajectory of employment                         16
Figure 7: Employment rates in Italy by sex, geographical area and age in 2013 and 2017             17
Figure 8: Incidence of fixed-term employees by geographical area in 2013 and 2017                  17
Figure 9: Incidence of part-time workers by geographical area in 2013 and 2017                     18
Figure 10: Unemployment rate (15+) in Italy, in EU28; by geographical area of Italy (2013-2017)    19
Figure 11: Unemployment rate 15-29 in Italy by geographical area and sex (2013 and 2017)           20
Figure 12: Incidence of part-time and fixed-term employees (15-24 and 25-34) in 2013 and 2017      21
Figure 13: NEET rate in Italy and EU by sex (2013 and 2017)                                        21
Figure 14: NEET rate in Italy and EU by level of education attained (2013 and 2017)                22
Figure 15. Percentage early leavers age 18-24 from education and training over total youth (18-24) 23
Figure 16: Inflow and outflow migration levels to and from Italy (2008-2016)                       24
Figure 17: Internal and external immigration inflow by geographical area and region (2012-2016)    25
Figure 18: Employment rate of immigrants in Italy, by sex and geographical area (2013 and 2017)    25
Figure 19: Employed immigrants by level of education attained (2013 and 2017)                      26
Figure 20. Employed immigrants by type of occupation and sex (2013 and 2017)                       27
Figure 21: Incidence of fixed-term and open-ended contracts by sex (2013 and 2017)                 28
Figure 22: Wage income by sex (left scale) and gender wage gap (right scale) in 2017               28
Figure 23: Adults’ participation in VET in Italy and EU by sex in 2013 and 2017                    29
Figure 24: Participation in VET in Italy by age in 2013 and 2017                                   29
Figure 25: Participation in VET in Italy by occupation group in 2013 and 2017                      30
Figure 26: Relative poverty in Italy, Piedmont and Lombardy (2014-2017)                            44
Figure 27: Distribution of labour income in Lombardy and Piedmont in 2017                          45
Figure 28: Internal and external immigration inflow by geographical area and region (2012-2016)    46
Figure 29: Employment rate (15+), by region and sex; employment rate (15-24)                       47

                                                       6                                    PE 631.050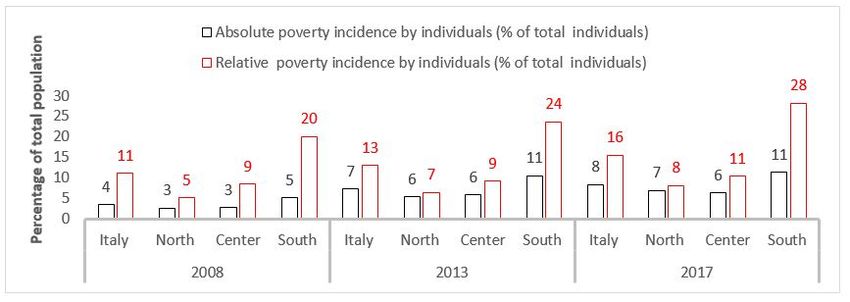
Employment, VET and Social Policies in Italy

Figure 30: Incidence of fixed-term employees in the regions of Piedmont and Lombardy                      47
Figure 31: Real monthly wage paid to employees (constant 2010 price)                                      48
Figure 32: Per capita GDP - in Italy, EU28, world; Italy’s pre-crisis path and IMF projections (2019-23) 59
Figure 33: General government spending (% total GDP) and ratio to general revenue                         59
Figure 34: Map of Italian regions (NUTS 2)                                                                60

LIST OF TABLES
Table 1: Number of hours per year spent in formal, non-formal VET in Italy and EU by age cohort           39
Table 2: Expenditure for social policies in Italy 2012-2016                                               43
Table 3: ESF 2014-2020 Thematic Objectives and Investment priorities in the Lombardy region               53
Table 4: ESF 2014-2020 planned budget and allocations at 31.12.2017 in Lombardy                           54
Table 5: ESF 2014-2020 Thematic Objectives and Investment priorities in Piedmont                          55
Table 6: ESF 2014-2020 planned budget and allocations at 31.12.2017 in Piedmont                           56

PE 631.050                                         7
IPOL | Policy Department for Economic, Scientific and Quality of Life Policies

EXECUTIVE SUMMARY
Italy has been one of the EU Member States worst hit by the 2008 crisis. However, over the past 5 years,
Italy’s output growth has reversed its negative trend, albeit at a slower pace compared to the EU28
average: from 2013 to 2018, annual average gross domestic product (GDP) grew by 0.4 percentage
points, compared to 1.8 percentage points for the EU28.
Since 2014, the employment level has started to increase, climbing back to the 2007 pre-crisis level.
From 2014 to 2017, 250,000 jobs per year on average were created in the Italian labour market, almost
closing the jobs gap relative to 2007. However, reaching the pre-crisis number of jobs may not be
enough to return to pre-recession employment rates, as new labour forces are expected to enter the
labour market. In 2017, the employment rate (20-64) stood at 62.3 per cent, up from the 59.7 per cent
in 2013, but still 0.6 percentage points lower than the 2008 rate (62.9), and very far from the EU2020
national targets of 67-69 per cent.
Italy’s employment-to-population ratio also shows wide regional, gender and age gaps. Regional gaps
in employment rates (15+) between southern and northern areas of Italy have widened significantly
since 2000, even if they have stabilised in the past few years. Since 2013, gender gaps in employment
rates (15-64) have also stabilised, but continue to be greater than the EU28 average (19.0 percentage
points in Italy, 11 percentage points in EU28). Age gaps in employment rates, on the other hand, are
widening over time. The youth employment rate (15–24) stood at 17.1 per cent in 2017, compared to
47.7 per cent for adults (25+) and compared to a youth employment rate of 34.8 per cent in the
EU28 (2017).
Besides the weak labour market recovery from the point of view of job creation, the Italian labour
market is also characterised by increasing precariousness and instability of employment, with
increasing use of fixed-term contracts in terms of both incidence and levels. Weak economic growth
has also increased the risks faced by individuals of becoming poor. The absolute poverty incidence
by individuals increased from 3.6 per cent of the total individuals in 2008 to 8.4 per cent in 2017. The
highest rates of poverty are in southern regions and among the young generation, as well as among
people in unemployment and people who, although working, are employed in low-skilled jobs.
Labour market outcomes in the Regions of Lombardy and Piedmont have constantly improved over
recent years and are above the corresponding national averages. Despite the two regions showing a
better performance in terms of employment creation compared to the national average, increasing
labour market precariousness remains a cause for concern.
The last five years have been characterised by a number of measures to support the implementation
of important labour market and social policy reforms enacted since 2011. These improve the
flexibility of the labour market and job creation, and extend social assistance and social
protection coverage.
Since 2014, a number of measures have been enacted under the so-called Jobs Act reform
(Renzi government). The stated goal of the Jobs Act reform was twofold. On the one hand, the reform
aimed to encourage jobs growth by making labour input cheaper. On the other hand, it aimed to make
permanent open-ended contracts more appealing to employers, through the introduction of
increasing-protection employment contracts (contratto a tutele crescenti). These are new, open-ended
contracts with lower dismissal costs and reduced legal uncertainty compared to previous ones.
Another important development was the extension of social protection to self-employed workers
without employees. Overall, the measures enacted aimed to promote a combination of labour market
flexibility and security for workers. A partial reversal of the Jobs Act provisions was carried out by the

                                                       8                                       PE 631.050
Employment, VET and Social Policies in Italy Conte government in 2018 with the so-called Dignity Decree (Decreto Dignità), which restricted the use of fixed-term contracts and increased the costs of dismissals. The vocational education and training system in Italy was also profoundly revised under the so-called Good School reform (Riforma della Buona Scuola). The Good School reform also includes initiatives to simplify short-term and apprenticeship contracts to align them better with labour market needs. A combination of vocational education and training measures and employment measures have been implemented and promoted in the regions of Lombardy and Piedmont, to support better labour market outcomes compared to the Italian average. Turning to social policies, in 2016, overall expenditure on social protection amounted to 29.7 per cent of GDP. The largest shares were allocated to pensions (48.7 per cent) and to health-care (23.1 per cent), while only 6.9 per cent went to unemployment and social exclusion, 6.3 per cent to family, maternity, and children, and 5.8 per cent to invalidity. Since 2016, the fight against poverty has started to figure prominently on the Italian political agenda, following an alarming increase in poverty rates and levels. EU Structural Funds have supported the setting up of the necessary infrastructure in terms of services and operators. The 2016 Stability Law and the subsequent decree introduced the Support for Active Inclusion (SIA). This measure paved the way for the new REI (inclusion income), implemented in December 2017. The target group of eligible beneficiaries was widened on 1 July 2018. However, due to the lack of resources the new measure is not sufficient to cover all those living in absolute poverty, and the monetary transfer to families is still very small. Although this measure is not yet a true minimum income, as in other more advanced European countries, the overall structure has been set up. The new measure is funded through a Poverty Fund with a budget of approximately EUR 2 billion for 2018, which should increase to 2.7 billion in 2020. Notwithstanding these improvements, the main weakness of the Italian welfare system remains unchanged. There are still too many fragmented measures to support individual and household incomes, with large differences in coverage across population groups and territorial levels, with only some regions and municipalities providing additional measures to the national ones, and a large number of individuals and households left without protection, especially among young people. The new Conte government (2018) is discussing replacing the REI with a new universal measure, the so-called citizens’ income (Reddito di cittadinanza), to provide people living in absolute poverty with higher benefits compared to those provided by the REI. The estimated resources needed for its full implementation are approximately EUR 17 billion. However, in the current negotiations on the budget law the amount dedicated to Reddito di Cittadinanza is much lower, EUR 9 billion (of which EUR 2.6 to be drawn from the resources already allocated for the REI). PE 631.050 9
IPOL | Policy Department for Economic, Scientific and Quality of Life Policies
RECENT DEVELOPMENTS IN EMPLOYMENT AND SOCIAL
INCLUSION
1.1. The macroeconomic context
During the decade after the economic and financial crisis of 2008-2009, Italy experienced a decline in
its output growth. Output growth per capita 1 dropped by approximately 6.1 percentage points in 2009,
recovering after 2013 although remaining on a slow growth trend throughout 2018 (IMF data). Over
the period 2013-2018, Italy’s GDP growth averaged 0.4 per cent per year, much lower than the EU28
average (1.8 per cent, according to IMF data) 2. According to IMF projections, average output growth is
expected to be 0.9 percentage points over the next five years.
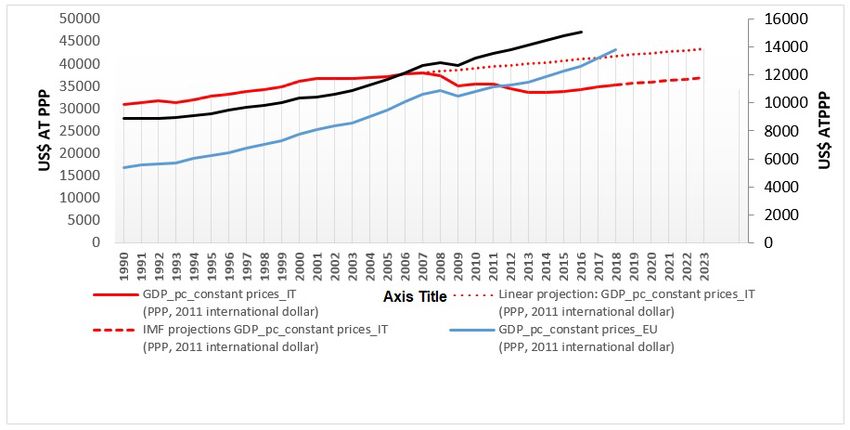
Figure 1: GDP growth (PPP 2011 international USD). Years: 2000-2023 (from 2019,
IMF projections)
Source: Author’s elaboration based on IMF DATA, World Economic Outlook Database.
The poor economic performance of the Italian economy appears to be driven largely by weak
aggregate demand, leading to very low inflation rates. A number of macroeconomic policies have had
an adverse effect on Italy’s economic growth in the past five years. In particular, the so-called spending
review (Decree Law 95/2012) and the pension reform (Decree Law 201/2011), both of them
implemented under the Monti government. A number of additional policy interventions were also
implemented to increase tax revenue. Higher municipal taxes on property were introduced in 2011
through the so-called IMU (Imposta Municipale Propria – Law. 214/2011); in 2013, value added tax (VAT)
was increased from 21 per cent to 22 per cent (Decree Law 76/2013) and in 2011, major tax revenue
1
GDP per capita is measured in constant purchasing power parity (PPP) international $ in order to allow for cross-country comparison
among strongly heterogeneous countries in terms of development.
2
Furthermore, the weak economic growth of the past 5 years will most likely be insufficient to recover the lost ground during the crisis
period. While both the level of GDP per capita of the world economy and the EU28 have surpassed the corresponding pre-crisis level (see
Figure 2), in 2018 Italy’s level of per capita GDP is still lower and only back to the 1999 level. According to International Monetary Fund
(IMF) projections, in 2023 the level of per capita GDP will still be below the pre-crisis level in 2007 by about 1.219 US international dollars
(see Figure 32 in the Annex).
10 PE 631.050Employment, VET and Social Policies in Italy
interventions were also implemented through an increase in the excise duty on fuel, repeated in 2013
and 2017 (Decree Law 183/2011, Decree Law 124/2013 and Decree Law 50/2017).
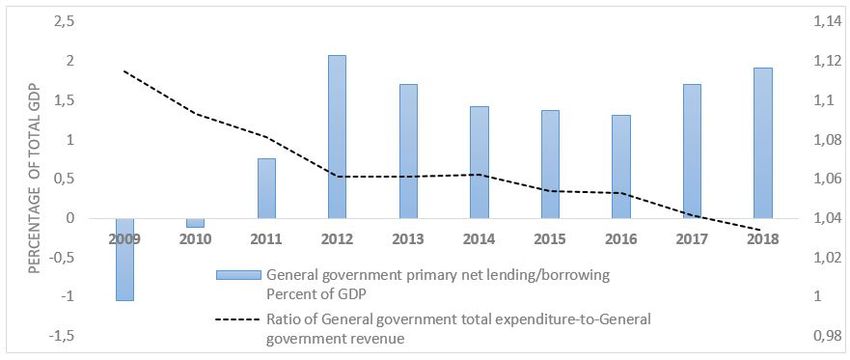
The implementation of the above-mentioned fiscal and expenditure measures allowed Italy’s
general government deficit – gross of passive interests – to converge towards the EU Maastricht
parameters: Italy’s government budget deficit decreased by approximately two percentage points,
going from −3.7 in 2011 to −1.5 in 2018 (IMF data). On the other hand, these policies have reduced
private income and reduced consumer and business confidence, as well as reducing labour
demand in the public sector. Finally, the austerity package implemented has caused long-lasting
deflation and continued weakness in the Italian economy (see Figure 33 in the Annex).
Suggested QUESTIONS for DISCUSSION
• Are macroeconomic policies adequately supporting sustained economic growth? What
types of investments are needed to support growth and what measures are in place to
support investment?
• What are the main constraints on expansionary macroeconomic policies? What measures
are in place to tackle the high Italian public debt-to-GDP ratio?
• What are the main macroeconomic challenges facing Italy?
1.2. The social context
For almost a decade, Italy’s poor economic growth has led to a substantial increase in the
incidence of poverty, causing situations of severe material deprivation. Both absolute poverty
(measured as the proportion of households or individuals with an income below the subsistence level)
and relative poverty (measured in terms of a cut-off point in relation to the overall distribution of
income, e.g., 60 per cent of the median value) have increased over time, while inequality has
stabilised (Istat data, 2018).
The absolute poverty incidence by individuals has increased by 4.8 percentage points, from 3.6 per
cent of total individuals in 2008 to 8.4 per cent in 2017, recording its highest incidence in more than
two decades (Istat, 2018).
The incidence of poverty in Italy is of particular concern and is mainly concentrated in southern
Italy. The average absolute poverty incidence in Italy has been largely driven by a drastic increase in
the South, recording its highest absolute value of 11.4 percentage points in 2017 (Istat data, 2018). Even
more alarming is the drastic increase in the relative poverty incidence. Despite a general increase in
relative poverty in all Italian geographical areas, people living in the southern regions are relatively
more disadvantaged than their peers living in the northern and central regions. In the South, the
relative poverty incidence increased from 20.1 per cent in 2008 to 28.2 per cent in 2017, implying that
an increasing proportion of the Italian population residing in the South is receiving an income below
60 per cent of the median income (Istat data, 2018).
PE 631.050 11IPOL | Policy Department for Economic, Scientific and Quality of Life Policies
Figure 2: Relative and absolute poverty in Italy and in the main geographical areas of Italy
(2008, 2013 and 2017) 3
Source: Istat data 2018.
The poverty profile by age, sex, type of occupation/labour force status and level of education
attained shows an alarming concentration of poverty particularly among young people, and
people with a low level of educational attainment. In 2017, relative and absolute poverty was
particularly severe among young males in the age cohort 18-35, and mainly concentrated among
people with low educational levels.
Figure 3: Poverty profile by age and education (percentage of total population)
Source: Istat data 2018.
The absolute and relative poverty gaps between young people aged 18-34 and adults (35-64)
has widened over time, reaching their highest gaps of 2.3 and 4.5 percentage points in 2017. In
a similar vein, better-educated people show lower relative poverty and absolute poverty rates,
compared to people who have low levels of education (ISCED 4 from 0 to 3). For instance, according to
3
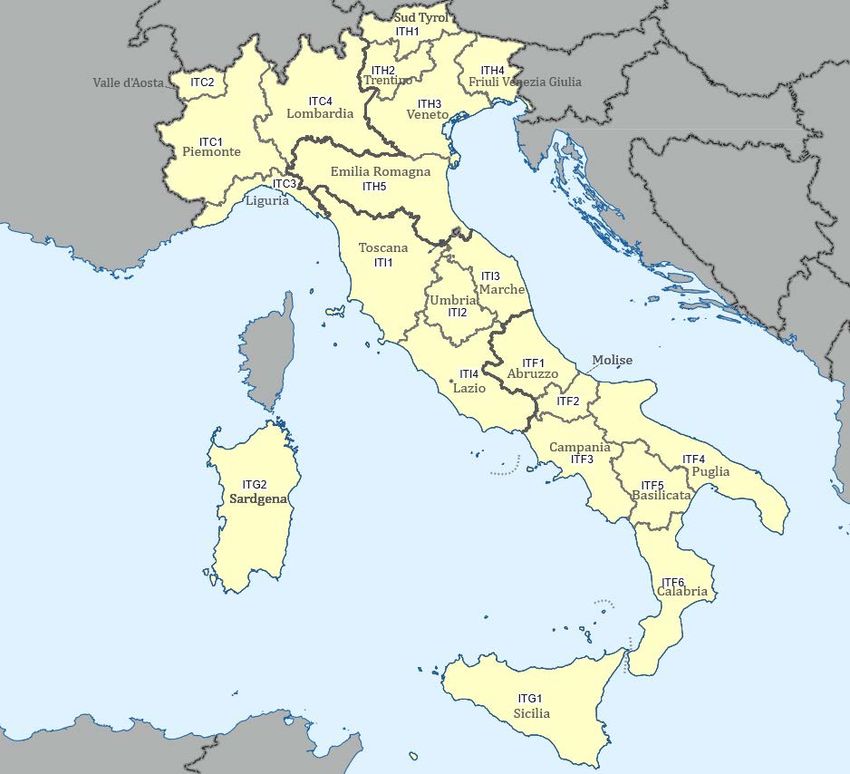
Italian Northern regions: Aosta Valley, Liguria, Lombardy, Piedmont, Emilia Romagna, Friuli Venezia Giulia, Trentino- Sud Tyrol, Veneto;
Centre regions: Lazio, Marche, Tuscany, Umbria; Southern regions: Abruzzo, Molise, Campania, Apulia, Basilicata, Calabria, Sicily, Sardinia.
(see Map of Italian regions (NUTS 2 level) in annex.
4
The International Standard Classification of Education (ISCED) is a statistical framework for organising information on education and is
maintained by the United Nations Educational, Scientific and Cultural Organization (UNESCO). The ISCED organises the level of education
into six levels, which are 0: Pre-primary education; 1: Primary education or first stage of basic education; 2: Lower secondary education or
second stage of basic education; 3: Upper secondary education; 4: Post-secondary non-tertiary education; 5: First stage of tertiary
education; and 6: Second stage of tertiary education.
12 PE 631.050Employment, VET and Social Policies in Italy
data from Istat, in 2017 the absolute poverty incidence among people who attained at most lower
secondary education (ISCED 0-3) was almost three times higher than the corresponding poverty rates
of those who attained post-secondary and tertiary education (ISCED from 4 to 6).
Figure 4: Poverty profile by occupation and labour force status (percentage of total
population)
Source: Istat data 2018.
Other population groups exposed to the risk of poverty are low-skilled workers and the
unemployed. While relative poverty has remained virtually unchanged among high-skilled workers in
managerial positions (from 3.2 per cent in 2008 to 3.4 per cent in 2017), low-skilled manual workers
recorded the highest incidence of relative poverty in 2017. The latter stood at almost 20 per cent in
2017, up from 11.2 per cent in 2008. The relative and absolute poverty incidence is also particularly
severe among the unemployed, reaching 26 per cent and 37 per cent respectively in 2017. Since 2008,
the absolute poverty incidence among the unemployed increased sharply by 16.4 percentage points,
thus making the provision of unemployment benefits a necessary goal (Istat data, 2018).
Weak economic growth, coupled with the lack of job opportunities and increased rates of
unemployment, has magnified the risks faced by individuals of becoming poor. Over the past 5 years,
a number of policy interventions to fight poverty have been implemented in Italy (see Section 4), but
they have been inadequate and insufficient overall given the magnitude and intensification of the
number of people living in absolute poverty.
High poverty rates tend to be accompanied by stabilising inequality. Income inequality in Italy, as
measured by the Gini coefficient and based on disposable income (Eurostat data, 2018), is relatively
high compared to the EU28 (0.331 and 0.308 in 2016, latest available year for the EU28, but has
stabilised over time (from 32.8 in 2013 to 32.8 in 2017). Despite an low overall Gini coefficient, in
2017 the average labour income of the 20 per cent of the population at the bottom 5 of the
5
This corresponds to the 20 % of the total employed population with the lowest income, or similarly, to the 20 % of the population whose
labour income is smaller or equal to the first cut-off value of 20 %.
PE 631.050 13IPOL | Policy Department for Economic, Scientific and Quality of Life Policies
(labour) income distribution was more than three times lower than the labour income of the
richest 20 per cent of the population 6 (see Table 1, in the Annex).
Income distribution in Italy has not substantially varied in the last decade (Table 2 in the Annex), with
the top 20 per cent of the population getting 31.7 per cent of all labour income, and the lower-income
population groups (the bottom 20 per cent) only getting 9.6 per cent of all labour income 7.
Suggested QUESTIONS for DISCUSSION
• What measures are envisaged to tackle poverty among young NEETs and single parents?
• What territorial measures are envisaged to tackle the territorial specificities of social
exclusion in Italy, e.g., large families and children in Southern Italy, migrants in northern
Italy and in the large cities?
• What efforts can be made in terms of policy implementation to combat poverty in the
southern regions of Italy?
• How can micro and macro-economic policies support the fight against poverty and
inequality in Italy?
• What are the main social challenges facing Italy in the coming years?
1.3. The labour market
Demographic trends are an important driver of labour supply, together with the population’s
participation decisions. In Italy, as in most EU countries, the population age-sex structure shows a
typical ‘constrictive’ 8 population pyramid (Figure 5 below), with an ageing and shrinking population.
Italy’s constrictive population structure mirrors a low fertility rate and a higher (than the world’s
average) life expectancy rate. According to Eurostat data, the combination of a low fertility rate and a
relative high life expectancy rate has resulted in a small percentage of people in the younger age
cohorts and a relatively high proportion of people in the older age cohorts (55 and over).
Over the period 2016-2050, Italy’s demographic structure is expected to change further. According
to Eurostat projections (Eurostat population projection, data repository 2018), the share of the
working-age population (15-64) is projected to decrease by 10 percentage points, from approximately
64 per cent in 2018 to 54 per cent in 2050. These expected changes are likely to result in a worsening
of the old-age dependency ratio (the proportion of people aged 65 and above over the total working-
age population and in a reduction of labour supply) if not compensated for by higher labour
participation rates and immigration inflows. The 2018 old-age dependency ratio of approximately
32 per cent is expected to almost double over the next 30 years, reflecting Italy’s low fertility rate
(Eurostat, 2018).
6
This corresponds to the fifth group, the one representing the fifth quintile or, similarly, the 20 % of population with the highest income:
an income greater than the fourth cut-off value of 80 %.
7
Authors’ calculation based on Istat microdata from LFS2017.
8
‘Constrictive’ population pyramids are typically found in countries with higher levels of social and economic development and present a
smaller percentage of people in the younger age cohorts. By contrast, less developed countries show ‘expansive’ population pyramids
characterised by high fertility rates and lower than average life expectancies, resulting in an overall high concentration of people in the
younger age cohorts.
14 PE 631.050Employment, VET and Social Policies in Italy
Figure 5: Italy male and female population (percentage of total population) by age
groups (2017)
Source: Authors’ elaboration based on Eurostat, population projections 2018.
https://ec.europa.eu/eurostat/data/database
As for labour demand, the depth and duration of the recession have resulted in a severe deterioration
of Italy’s labour market, with declining employment levels and increasing unemployment.
Since 2014, the downward trend in employment levels has been reversed with the creation of
250,000 jobs per year on average, over the period 2014-2017 (Istat data, 2018).
In 2017, the Italian National Statistical Office estimated a total of nearly 23 million people in
employment (+15). Italy’s jobs gap relative to 2007 has almost closed (Figure 6), indicating that it took
nearly a full decade after the start of the recession for employment to return to close to its pre-recession
level. Despite employment levels almost returning to pre-crisis levels, the overall number of employed
people is still below the 2007 level: a total of 128,000 jobs still have to be created in order to return
to 2007 levels of employment 9. However, this does not mean that the Italian economy is at full
employment. Given that every year, new people are expected to enter the labour market, simply
reaching the pre-crisis number of jobs may not be sufficient. Looking at the pre-crisis trajectory of the
employment levels and the projected levels of employment over the next five years, a total of
2.9 million jobs need to be recovered in order to return to the pre-crisis employment rate. Before
the crisis, average employment creation in Italy amounted to approximately 166,000 jobs per year, over
the period 2000-2007, whereas an average of 138,000 jobs per year have been lost during the period
2008-2013. Even more alarming is the fact that, according to the International Labour Organization
(ILO) 2010 projections, it is expected there will be a widening of the jobs gap 10 from the pre-crisis
trajectory, as the ILO estimates a contraction in the level of employment over the next five years.
9
This is calculated as the difference between the 2007 pre-crisis level of employment and the 2017 level of employment.
10
The jobs gap is calculated as the difference between the pre-crisis employment trajectory – estimated through a time trend regression
over the period 1997-2008 – and the short and medium-run ILO projections over the period 2018-2023.
PE 631.050 15IPOL | Policy Department for Economic, Scientific and Quality of Life Policies
Figure 6: Jobs gap with respect to the pre-crisis trajectory of employment
Source: Authors’ calculation based on Istat (2018) and ILOSTAT.
In 2017, the employment-to-population ratio (20-64) stood at 62.3 per cent, up from the 59.7 per cent
in 2013, but still 0.6 percentage points lower than the 2008 rate (62.9), and very far from the EU2020
national targets of 67-69 per cent (Istat data, 2018).
Italy’s employment-to-population ratio also shows wide regional, gender and age gaps.
Regional gaps in employment rates (15+) between southern and northern regions have significantly
widened since 2000, although they have stabilised over recent years (from 2013 to 2017). In 2017, the
employment rate in the South was 34.3 per cent, an increase of 1.3 percentage points compared to the
2013 rate. Regional gaps however remain a major concern: the employment rate in southern regions
was 15.9 percentage points lower than the corresponding rate in northern regions, a difference that
continued to widen, albeit slowly (0.3 percentage points) even in the years of recovery since 2013 (Istat,
Labour Force Survey data, 2018).
Gender gaps in employment rates (15+) have stabilised since 2013, although in Italy the female
employment rate is still very low compared to the EU average. In 2017, Italy’s employment rate for
women stood at 35.8 per cent, up from the 34.4 per cent in 2013, compared to 46.3 in 2013 and 49 in
2017 in the EU28 respectively. Despite the increase, there are still wide gender disparities. Compared
to men, women face greater difficulty in accessing and remaining in the labour market, with the male
employment rate being 17.4 percentage points higher than the female one in 2017. At EU28 level, the
male employment rate (15+) was 11.4 percentage points higher than the corresponding female
employment rate in 2017 (Istat data, 2018).
Age gaps in employment rates continue to widen over time. The youth employment rate (15-24)
stood at 17.1 per cent in 2017, compared to 34.8 in the EU28. By contrast, the adult employment rate
(25+) in Italy stood at 47.7 per cent in 2017, while in the same year the adult employment rate (25+) in
the EU28 was 57.4. An immediate measure of the relative disadvantage that young people face in the
labour market is the ratio adult-to-youth employment rate. On average, in 2017 adults were 2.7 times
more likely to be employed compared to young people in Italy, whereas the ratio of adult-to-youth
employment rate in the EU28 was 1.7 in 2017 (Eurostat data, 2018).
16 PE 631.050Employment, VET and Social Policies in Italy A detailed analysis of young people and women in the labour market is given in Sections 1.4.1 and 1.4.3. Figure 7: Employment rates in Italy by sex, geographical areas and age in 2013 and 2017 Source: Istat data 2018. Over recent years, Italy has undergone a profound process of structural reform aimed at increasing labour market flexibility. Overall, this has resulted in further precariousness in the Italian labour market. According to Istat data (2018), since 2013, the use of fixed-term contracts has increased both in terms of incidence and levels. Compared to the 2013 level, the number of fixed-term employees increased by 525,000 in 2017, and the incidence of employees under fixed-term arrangements increased by 2.2 percentage points in Italy, reaching 15.4 per cent, whereas the increase in the EU28 was 0.7 percentage points (from 13.6 in 2013 to 14.3 in 2017). Fixed-term jobs are particularly widespread in southern Italy, where their incidence reached 19.3 per cent in 2017 compared to 13.7 per cent in northern Italy (Figure 8). Figure 8: Incidence of fixed-term employees by geographical areas in 2013 and 2017 Source: Istat data 2018. PE 631.050 17
IPOL | Policy Department for Economic, Scientific and Quality of Life Policies

The incidence of part-time workers, i.e. workers who work fewer than 35 hours per week, has also
increased relative to 2013. The 2017 share of part-time workers out of total workers stood at almost
19 per cent, up from 17.9 per cent in 2013, and similar to the EU28 average (19.4 in 2017). According to
OECD (2018) data, almost 76 per cent of all part-time workers in Italy declared themselves to be
involuntary part-time workers. Despite a general upward trend in part-time work in all geographical
areas of Italy, the incidence of part-time jobs is higher in the northern and central regions, while
southern regions recorded a lower incidence in relative terms in 2017.
Figure 9: Incidence of part-time workers by geographical areas in 2013 and 2017

Source: Istat data 2018.

Turning to unemployment, in 2017 there were 2,906 million unemployed people in Italy (Istat data,
2018). The unemployment rate reached 11.2 per cent in 2017, below the crisis peak of 12.1 per cent in
2013, but still much higher (5.1 percentage points) than the unemployment rate recorded before the
crisis in 2007 (6.1 per cent) and 4.3 percentage points higher than the EU average (7.6 per cent in 2017).
Women are more likely than men to be unemployed (Istat data, 2018). Despite a slight decrease
since 2014, the female unemployment rate reached 12.3 per cent in 2017, 2 percentage points higher
than that of men (10.3 per cent in 2017).
Regional differences in economic growth are also reflected in the labour market: people residing
in southern regions face a higher probability of being unemployed. An immediate measure of
the relative disadvantage that people residing in the South face in the labour market is the ratio of
south-to-north unemployment rate. On average, people living in the South are almost three times
more likely to be unemployed compared to people living in the North (Istat data, 2018).

                                                       18                                      PE 631.050
Employment, VET and Social Policies in Italy
Figure 10: Unemployment rate (15+) in Italy and the EU28 from 2013 to 2017 (left side graph);
Unemployment rate (15+) among geographical areas in Italy (right side graph)
Source: Istat data 2018 and Eurostat.
Since 2014, Italy has started to recover the jobs lost during the crisis. Nonetheless, unemployment
continues to be a pervasive phenomenon and requires effective job creation policies and measures.
Long-term unemployment represents a key policy challenge for Italy, especially because of the
economic and social costs associated with a long period of labour market detachment, which may lead
to discouragement and lower labour market participation.
According to data from the Italian National Statistical Office (Istat, 2018), the incidence of the long
term unemployed 11 was 45.8 per cent in 2008, it peaked at 61.5 per cent of total unemployment in
2014, to slowly decline to 58.8 per cent in 2017. Marked differences exist across regions, both in the
incidence of long-term unemployed and in terms of duration: compared to people residing in the
northern regions, the incidence of long-term unemployed tends to be nearly 1.3 times higher in
southern regions (50.4 per cent in the North and 65.8 per cent in the South). Unemployed people living
in the South tending to remain outside the labour market for about 11 months longer than people
living in the North 12 (data for 2017).
Suggested QUESTIONS for DISCUSSION
• What are the main factors behind the high rates of unemployment and inactivity in Italy?
• What are the main labour market challenges Italy is going to face in incoming years?
• What measures are envisaged to support employment creation? Are recent developments
in employment polices adequate to support employment and reduce unemployment and
inactivity, especially in Southern regions?
• What measures are planned to curb the increasing trend towards precarious forms of
employment?
11
The long-term unemployed are defined as people who have been looking for a job for one year or more over total unemployed people.
12
Data extracted from the 2017 Italian labour force survey.
PE 631.050 19IPOL | Policy Department for Economic, Scientific and Quality of Life Policies
1.4. Vulnerable groups in the labour markets
1.4.1. Young people
Despite a widespread improvement in the educational attainment of younger generations (see
Box 1 on page 22), Italy is currently facing an unprecedented youth employment crisis, with nearly
729,000 young people (15-34 years old) unemployed in 2017. High and rising unemployment rates
coupled with the length of time it takes to find employment have resulted in many young people
giving up the search or migrating abroad. The inclusion in the unemployment count of the
discouraged would add an estimated 14.4 percentage points to the youth unemployment rate
(15-34) in 2017 (Istat data, 2018).
In Italy, the youth unemployment rate of the 15-29 age cohort stood at 26.7 per cent in 2017, still higher
than the 15.3 per cent of 2008. Youth detachment from the labour market is higher for young women
than for young men (28.6 per cent of the total female labour force 15-29 in 2017, compared to
25.3 per cent for young men) and higher in southern regions, in line with the overall trend in the Italian
labour market (Istat data, 2018).
The slight reduction in the youth unemployment rate over the past 5 years was accompanied by a
negligible increase in the share of youth in employment (from 29.1 per cent in 2013 to 30.3 in 2017),
with large regional differences. According to Istat data (2018) The employment rate in the North
is much higher than in southern Italy (38.4 per cent in the North and 20.7 in the South).
Figure 11: Unemployment rate 15-29 in Italy by geographical areas and sex (2013 and 2017)
Source: Istat data 2018.
The weak position of young people in the Italian labour market is also shown by the concentration
of young workers in atypical forms of work, notably part-time and fixed-term jobs. The incidence
of fixed-term employees has continued to grow, reaching a share of 58 per cent of total employees
15-24 13 and 27 per cent of total employees 25-34 in 2017. The same applies to part-time, where the
incidence in total young employees increased from 22 per cent in 2013 to 24 per cent in 2017. Labour
market precariousness can also be seen by looking at the trend in the share of underemployed youth,
13
The selected age cohorts are for these indicators are not aligned to the ones selected for previous analysis due to missing data in the
national repository.
20 PE 631.050Employment, VET and Social Policies in Italy which increased in 2017 by 1 percentage point from its 2013 rate (from 3 to 4 per cent), partially offset by a reduction in the share of involuntarily part-time from 79.9 in 2013 to 77.1 in 2017 (Istat data, 2018). Figure 12: Incidence of part-time and fixed-terms employees (15-24 and 25-34) in 2013 and 2017 Source: Istat data 2018. The detachment from the labour market for many young potential entrants has resulted in an increasing number of young people becoming discouraged and abandoning the job search, especially among young women. The share of young NEET (young people not in Education, Employment or Training) dramatically increased after the onset of the economic crisis by 3.8 percentage points from 2008 to 2016. From 2014 to 2017 the NEET rate rose at a more modest pace, before decreasing to 24.1 per cent in 2017, still approximately 10 percentage points higher than the EU28 average (Eurostat data, 2018). Figure 13: NEET rate in Italy and EU by sex (2013 and 2017) Source: Eurostat data. PE 631.050 21
IPOL | Policy Department for Economic, Scientific and Quality of Life Policies

The greatest proportion of NEET is concentrated among those with low educational attainment
(ISCED 0-2), whereas it tends to be stable and very low overall among those with tertiary education.
On average, over the period 2013-2017 the share of young NEET (15-29) with at most lower secondary
education was almost four times higher than the corresponding share of young people with tertiary
education (Eurostat data, 2018).
Figure 14: NEET rate in Italy and EU by level of education attained (2013 and 2017)

Source: Eurostat data.

Box 1. Youth Educational attainment
Italy has made considerable progress in its educational system, and improved the level of educational
attainment across generations. However, some weaknesses remain – namely the low rates of tertiary
education attainment also in the younger generations, and the high rates of early school leaving.
Young people are more likely than adults to attain higher educational levels. According to Eurostat
data, in 2017 the share of young people aged 20-29 who attained a level of education higher than lower
secondary is 1.3 times greater than that of adults (35-64).
Despite an overall improvement in educational attainment across generations, the share of young
people (25-29) who attained tertiary education is still below the EU average. In 2017, the proportion
of youth (15-29) who attained tertiary education was 26.8 per cent in Italy compared to the EU28
average of 38 per cent. On the other hand, the share of youth with the lowest educational attainment
(ISCED 0-2) declined from 24.5 in 2013 to 21.9 in 2017, but remained above the EU28 average by
6.4 percentage points. As in other countries, young females 20-29 are better educated than their male
peers and the gap is widening: according to Eurostat figures, 32.9 per cent of young females aged 20-29
attained tertiary education in 2017, compared to only 21 per cent of young males in the same
age cohort.

                                                       22                                   PE 631.050
Employment, VET and Social Policies in Italy
Country Male Female Total Male Female Total
Educational attainment 2013 2017
Percentage of young people who attained at Italy 27.5 21.4 24.5 24 19 22
most lower-secondary education (less than
primary, primary and lower secondary
education (levels 0-2) EU28 19.3 15.2 17.3 17.2 14 15.5
Percentage of young people who attained Italy 17.8 28.8 23.3 21 32.9 26.8
tertiary education (levels 5-8) EU28 30.4 41 35 32.8 43.5 38
Source: Eurostat data.
Early school leaving is still one of the main challenges faced by the Italian education system (Figure 15
below). The EU 2020 target of reducing the rate of early school leaving in EU countries below 10 per
cent by 2020 has not yet been achieved in Italy. Over the period 2013-2017, the percentage of early
school leavers aged 18-24, although declining, has remained systematically higher than the
corresponding EU average. In 2017, the share of young people who left formal or informal education –
after attaining at most lower secondary education – was at 14 per cent in Italy, still 3.4 percentage
points above the EU28 average and far above the EU target of 10 per cent. Young women make up a
smaller proportion of early school leavers than their male peers (5.5 pps lower).
Figure 15: Percentage of early leavers age 18-24 from education and training over total youth 18-24
Source: Eurostat data 2018.
Suggested QUESTIONS for DISCUSSION
• What are the main needs and challenges for the labour market integration of young
people in Italy?
• Are the national employment polices implemented in Italy adequate to combat the high
youth NEET rates, particularly in southern regions?
• What measures are in place to curb the increasing trend towards precarious forms of
youth employment?
PE 631.050 23IPOL | Policy Department for Economic, Scientific and Quality of Life Policies
1.4.2. Migrants
Migrants and ethnic minorities (e.g., the Roma) are another population group particularly affected
by poverty and social exclusion.
Despite weak economic growth, the net migration flow, measured as the difference between
immigrants and emigrants, remains positive in Italy, although declining. The ratio of immigrants to
emigrants recorded its lowest figure of 2 in 2016, indicating that for every two people entering Italy,
one emigrates, with a sharp downwards trend since 2010.
According to Istat data (2018), despite a deceleration in annual migrant inflows, Italy’s largest share of
immigrants in 2016 (latest data available) is from extra EU27 countries (approximately 36 per cent of
total immigrants to Italy), followed by immigrants from African countries (27 per cent of total
immigrants) and EU27 countries (25 per cent of total immigrants).
Figure 16: Inflow and outflow migration levels to and from Italy (2008-2016)
Source: Istat data 2018.
The share of Italian emigrants – over total emigrants from Italy – has increased sharply over the
past 5 years, from 64 per cent in 2008 to 73 per cent in 2016. The drastic increase in the shares and
levels of Italian emigrants – the latter increased from 39 thousand Italian emigrants in 2008 to
114 thousand Italian emigrants in 2016 – is likely to be an effect of weak economic growth and the lack
of employment opportunities in Italy (Istat data 2018).
Large regional differences in standards of living, especially between the North and the South of Italy,
has had an impact on the outflow and inflow of migration. In 2016, approximately 57 per cent of total
immigrants moved from other areas of Italy, particularly from the South to the North. The proportion
of external immigrants (foreign-born) moving to the North stood at 51 per cent of total external
immigrants in Italy (2016).
24 PE 631.050Employment, VET and Social Policies in Italy Figure 17: Internal and external immigration inflow by geographical areas and regions (2012-2016) Source: Istat data 2018. The participation of immigrants in the Italian labour market has continued to grow over time. The employment rate (15-64) of immigrants is higher than the corresponding national employment rate, with nearly 61 per cent of total immigrants of working age in employment (2017). In 2017, the employment rate of foreign-born migrants was higher for males than for females (72.4 and 50.2 per cent respectively), and was mainly concentrated in the northern and central areas of Italy, thus confirming the attractiveness of and greater job availability in these areas. In 2017, the employment rate of foreign-born migrants stood at 60 per cent in northern and central Italy, while the corresponding employment rate in southern Italy was nearly 54 per cent (Istat data 2018). Figure 18: Employment rate of immigrants in Italy, by sex and geographical areas (2013 and 2017) Source: Istat data 2018. PE 631.050 25
IPOL | Policy Department for Economic, Scientific and Quality of Life Policies

In 2017, the foreign-born unemployment rate was above the national unemployment rate
because of greater participation of foreign-born migrants in the labour market. Compared to
2013, the foreign-born unemployment rate decreased in 2017 but remained higher than the
corresponding national unemployment rate, at 14.3 per cent of the total labour force of foreign-born
migrants. Foreign-born women face a higher probability of being unemployed than foreign-born
males, while the highest rate of unemployment for foreign-born workers was in southern Italy
(2017).
In 2017, Italy accounted for 2.4 million immigrants in employment. The composition of the foreign-
born workforce tends to be characterised by a high incidence of people with low educational levels
(50 per cent of total foreign-born in employment in 2017), while the labour market participation of
foreign-born with tertiary education was relatively low (12 per cent in 2017).
Figure 19: Employed immigrants by level of education attained (2013 and 2017)

Source: Istat data 2018.

Over the past 5 years, the incidence of immigrant workers has increased in the agricultural sector
from 4.6 per cent in 2013 to 6.1 per cent in 2017, while it has fallen in both construction and
manufacturing, by roughly three percentage points, from 2013 to 2017. The share of foreign-born
workers also increased in the accommodation activities sector, e.g., hotels and restaurants, from
18 per cent in 2013 to 22 per cent in 2017 (Istat data 2018).
Migrant workers continue to be over-represented among low-skilled manual and non-manual
occupations, as well as in precarious jobs (Figure 20). The incidence of immigrants in managerial and
professional occupations, typically higher-skilled occupations, accounted for only 7 per cent in 2017
(up from 6 per cent in 2013) while they represented the highest incidence among low-skilled
elementary occupations (35 per cent in 2017). The participation of foreign-born women in the labour
market is particularly high in sales activities (47 per cent in 2017).

                                                       26                                  PE 631.050
Employment, VET and Social Policies in Italy
Figure 20: Employed immigrants by type of occupation and sex (2013 and 2017)
Source: Istat 2018.
In the past 5 years, in line with the general trend in the Italian labour market, the incidence of
migrant employees working under fixed-term arrangements has increased drastically, going
from 15.4 per cent in 2013 to nearly 20 per cent in 2017. The increase in the use of fixed-term
contracts has affected foreign-born men more than women: in 2013 the proportion of foreign-born
males working under fixed-term arrangements stood at 17 per cent of total foreign-born employees,
but increased sharply to almost 23 per cent in 2017 (Istat data, 2018).
Suggested QUESTIONS for DISCUSSION
• What are the main needs and challenges related to migration flows and policies?
• What measures are in place to support the labour and social integration of migrant
workers?
• How can migration policies support the Italian labour market in addressing demographic
change (ageing and shrinking population)?
1.4.3. Women
In spite of the fragile recovery in job creation since 2014, women’s participation in employment
remains disappointing. In 2017, the employment rate of women was 48.9 per cent, up from
46.5 per cent in 2013 but still almost 20 percentage points below the employment rate of men
(68.1 per cent in 2017). Territorial differentials play a crucial role in determining gender gaps in
employment: in 2017, the employment rate of women stood at 59.2 per cent in northern regions,
compared to 32 per cent in the southern regions.
Although women on average have higher educational attainment compared to men, employed
women mainly perform low-skilled jobs, with nearly 44 per cent of total employed women in 2017
employed in sales type activities. If we add to that, the number of women employed in manual
low-skilled occupations, typically in the manufacturing industry, and other elementary occupations,
the share of women in low-skilled occupations reaches 63 per cent (2017). However, the incidence of
women doing low-skilled jobs has decreased by 1.4 percentage points since 2013 (Istat data, 2018).
PE 631.050 27IPOL | Policy Department for Economic, Scientific and Quality of Life Policies
Compared to men, women also face a greater probability of being employed on temporary
contracts: in 2017 nearly 16 per cent of total employed women worked on temporary contracts, an
increase of almost 2 percentage points compared to 2013 (Istat data, 2018).
Figure 21: Incidence of fixed-term and open-ended contracts by sex (2013 and 2017)
Source: Istat 2018.
Gender sectoral and occupational segregation, along with the widespread use of non-standard forms
of contracts for women, is reflected in high gender wage gaps. According to estimates based on the
Italian Labour Force Survey 14, the gender wage gap in 2017 was on average 19.5 per cent, with
women residing in the south of Italy facing a lower gender wage gap relative to the north.
Figure 22: Wage income by sex (left scale) and gender wage gap (right scale) in 2017
Source: Authors’ calculation based on microdata from LFS.
Suggested QUESTIONS for DISCUSSION
• What are the main needs and challenges for female labour market participation?
• What measures are envisaged to support the employment of women and to reduce
the gender wage gap and employment segregation?
14
Authors’ calculations based on Istat Labour Force Survey microdata for 2013 and 2017.
28 PE 631.050Employment, VET and Social Policies in Italy 1.5. Vocational education and training: key features The probability of having poor employment outcomes is often related to the lack of vocational or occupational qualifications. Such qualifications may be gained through school, work experience or a combination of both. The poor performance of the Italian labour market and the need to increase workers’ employability has resulted in a number of strategic objectives to strengthen vocational education and training (VET) and expand apprenticeship-type programmes. According to Eurostat, adults’ (25-64 years old) participation in formal and non-formal VET in Italy has increased over the past 5 years, but is still below the EU28 average: adults’ participation in VET is 3.4 percentage points below the EU average, with women more likely to participate in VET than their male counterparts. Figure 23: Adults’ participation in VET in Italy and EU by sex in 2013 and 2017 Source: Eurostat data, 2018. Participation in VET is much higher for the younger age cohorts. As in other European countries, participation decreases considerably in the older age groups, with a generation gap of 10.1 percentage points in 2017. In Italy, youth participation (25-34) was 14.9 per cent, while elderly people (55-64) who participated in VET was only 4.8 per cent in 2017. Figure 24: Participation in VET in Italy by age in 2013 and 2017 Source: Eurostat data, 2018. PE 631.050 29
You can also read