NETWORK OPERATIONS REPORT 2018 - MAIN REPORT - atceuc
←
→
Page content transcription
If your browser does not render page correctly, please read the page content below

Network Manager
      nominated by
      the European Commission
                                  EUROCONTROL

NETWORK OPERATIONS
REPORT 2018
MAIN REPORT

                                Edition Number: 1
                                       25/04/2019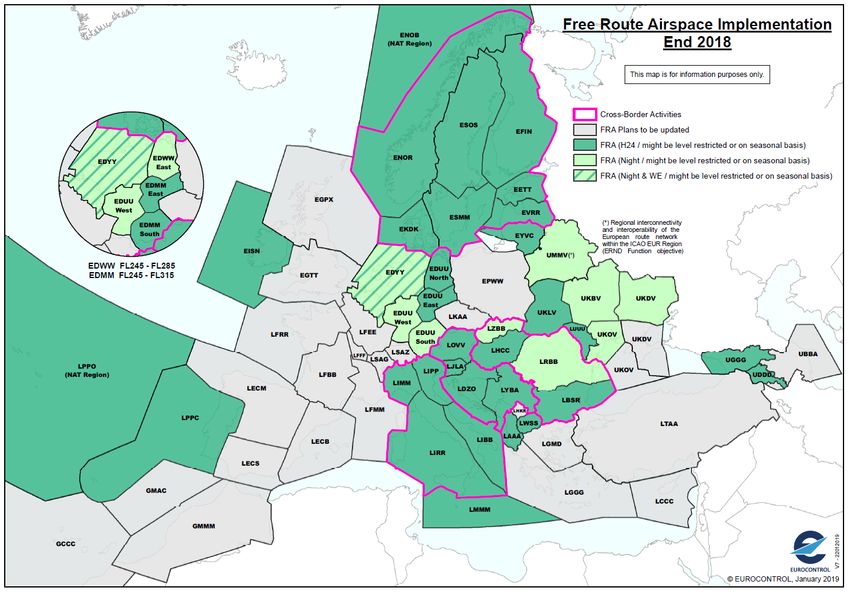
DOCUMENT CHARACTERISTICS
Document Title Document Subtitle Edition Number Edition Date
Network Operations
Main Report 1.0 01/05/2019
Report 2018
Note
This document is the final version of the Network Operations Report 2018. This publication
comes after a consultation period with stakeholders.
STATUS AND ACCESSIBILITY
Status Accessible via
Working Draft Intranet
Draft Extranet
Internet
Proposed Issue
(www.eurocontrol.int)
Released Issue
TLP STATUS
Intended for Detail
Red Highly sensitive, non-disclosable information
Amber Sensitive information with limited disclosure
Green Normal business information
Main Report - Draft for Consultation
White Public information
© 2019 The European Organisation for the Safety of Air Navigation (EUROCONTROL). This
document is published by EUROCONTROL for information purposes. It may be copied in whole
or in part, provided that EUROCONTROL is mentioned as the source and the extent justified by
the non-commercial use (not for sale). The information in this document may not be modified
without prior written permission from EUROCONTROL
Edition Date: 01/05/2019 Edition: 1.0 Status: Released Issue i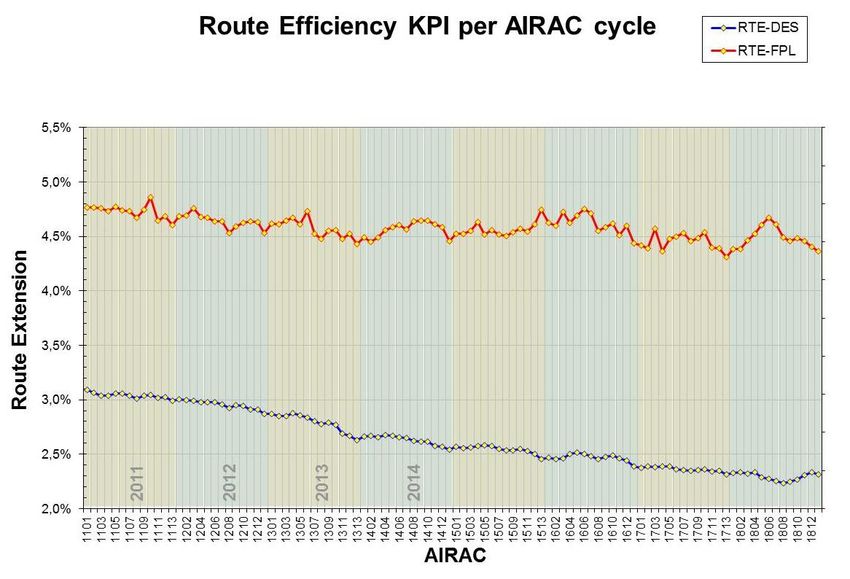
Table of Contents

  DOCUMENT CHARACTERISTICS ................................................................................................................. I
  TABLE OF CONTENTS .................................................................................................................................. II
  LIST OF FIGURES IN MAIN DOCUMENT .................................................................................................... IV
  NOTICE…… .................................................................................................................................................... V

           1 EXECUTIVE SUMMARY ................................................................................................................................... 6
           2 INTRODUCTION & SCOPE............................................................................................................................... 8
           3 NETWORK OVERVIEW .................................................................................................................................... 9

  3.1 2018 BY MONTH .......................................................................................................................................... 9
  3.2 TRAFFIC 2018 ........................................................................................................................................... 11
  3.3 DELAYS… ................................................................................................................................................. 12
        ALL AIR TRANSPORT DELAYS (AIRLINE VIEW) ............................................................................ 12
        ATFM DELAYS .................................................................................................................................... 14
  3.3.2.1 EN-ROUTE ATFM DELAYS ............................................................................................................. 16
  3.3.2.2 AIRPORT/TMA ATFM DELAYS ....................................................................................................... 17
  3.4 FLIGHT EFFICIENCY.................................................................................................................................... 18

           4 TRAFFIC IN DETAIL ....................................................................................................................................... 20

  4.1 NETWORK CONTRIBUTORS ......................................................................................................................... 21
  4.2 ROUTING ASPECTS .................................................................................................................................... 22
  4.3 OUTSIDE EUROPE ...................................................................................................................................... 23
  4.4 AIRPORT TRAFFIC EVOLUTION .................................................................................................................... 24
  4.5 AIRLINE INDUSTRY ..................................................................................................................................... 25
  4.6 FLIGHT REDUCTIONS.................................................................................................................................. 27

           5 EN-ROUTE PERFORMANCE ......................................................................................................................... 28

  5.1 HOT SPOTS ............................................................................................................................................... 28
  5.2 PLANNED EVENTS AND DISRUPTIONS .......................................................................................................... 30
        EN-ROUTE PLANNED EVENTS ......................................................................................................... 30
        EN-ROUTE DISRUPTIONS ................................................................................................................. 32
  5.3 ACC ANALYSIS .......................................................................................................................................... 34
        DEMAND AND CAPACITY MONITORING ......................................................................................... 37
  5.3.1.1 MARSEILLE ...................................................................................................................................... 37
  5.3.1.2 KARLSRUHE UAC ........................................................................................................................... 38
  5.3.1.3 BREST .............................................................................................................................................. 39
  5.3.1.4 MAASTRICHT UAC .......................................................................................................................... 40
  5.3.1.5 REIMS ............................................................................................................................................... 40
  5.3.1.6 VIENNA ............................................................................................................................................. 41
  5.4 ATFM MEASURES ..................................................................................................................................... 42
  5.5 TRAFFIC VOLATILITY ................................................................................................................................... 42

           6 AIRPORTS....................................................................................................................................................... 45

  6.1 HOT SPOTS ............................................................................................................................................... 47
  6.2 AIRPORT DISRUPTIONS .............................................................................................................................. 51
  6.3 NETWORK OPERATIONS SUPPORT .............................................................................................................. 52

Edition Date: 01/05/2019                                                          Edition: 1.0                                   Status: Released Issue                      ii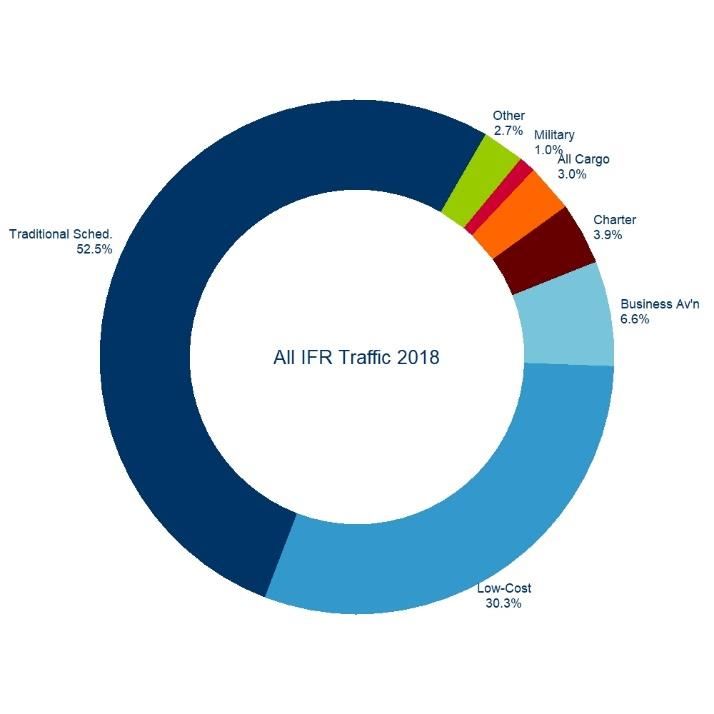
GREEK ISLANDS – SUMMER ............................................................................................................ 52
  6.4 AIRPORT CDM IMPLEMENTATION AND ADVANCED ATC TOWER IMPLEMENTATION......................................... 53
  6.5 INFORMATION EXCHANGE BETWEEN AIRPORTS AND NM – AIRPORT CORNER PROCESS ............................... 54

           7 FLIGHT EFFICIENCY ...................................................................................................................................... 56

  7.1 AIRSPACE DESIGN ..................................................................................................................................... 58
  7.2 AIRSPACE CHANGES VS. FLIGHT PLANNING ................................................................................................. 59
  7.3 ACTUAL TRAJECTORY ................................................................................................................................. 61
  7.4 CONDITIONAL ROUTES (CDR) .................................................................................................................... 62
  7.5 FREE ROUTE OPERATIONS ......................................................................................................................... 66
  7.6 ROUTE AVAILABILITY DOCUMENT (RAD) ..................................................................................................... 67

           8 NETWORK MANAGER ................................................................................................................................... 70

  8.1 CAPACITY (DELAY REDUCTIONS) ................................................................................................................ 71
  8.2 ENVIRONMENT (FLIGHT EFFICIENCY) .......................................................................................................... 72

           9 ATFM COMPLIANCE ...................................................................................................................................... 74

  9.1 ATFM DEPARTURE SLOTS ......................................................................................................................... 74
  9.2 ADHERENCE TO FLIGHT PLAN SUSPENSIONS ............................................................................................... 75
  9.3 ATFM EXEMPTIONS ................................................................................................................................... 76
  9.4 MISSING FLIGHT PLANS.............................................................................................................................. 77
  9.5 MULTIPLE FLIGHTS..................................................................................................................................... 78

           10 REFERENCES............................................................................................................................................... 79

Edition Date: 01/05/2019                                                        Edition: 1.0                                 Status: Released Issue                     iii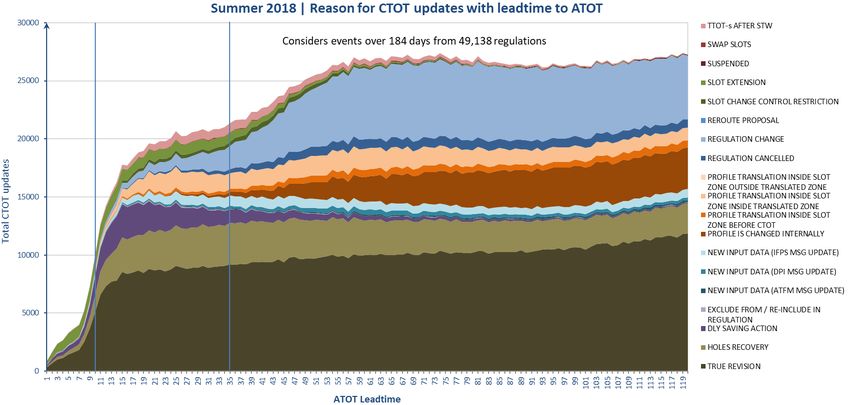
List of Figures in Main Document

         Figure 1: Average daily traffic in 2018 ..................................................................................................................... 9
         Figure 2 Monthly ATFM delay in 2018 .................................................................................................................. 10
         Figure 3: Average daily traffic per year ................................................................................................................. 11
         Figure 4 Average departure delay per flight 2014-2018 ........................................................................................ 12
         Figure 5 Average departure delay per flight 2014-2018 ........................................................................................ 12
         Figure 6: Average departure delay per flight 2018 ................................................................................................ 13
         Figure 7: Percentage of delayed flights: ATFM & All Causes ................................................................................ 13
         Figure 8 : Average daily ATFM delay (2017 vs 2018) ........................................................................................... 14
         Figure 9 : Average daily traffic and ATFM delay per flight (En-route and Airport) 2009-2018 ............................... 14
         Figure 10: ATFM delays in 2018 (av. daily) ........................................................................................................... 15
         Figure 11 : Average ATFM delay per ACC in 2018 ............................................................................................... 15
         Figure 12: 2018 average en-route ATFM delay per flight ...................................................................................... 16
         Figure 13: 2018 average daily airport/TMA delays ................................................................................................ 17
         Figure 15: Average route extension due to airspace design (RTE – DES) ........................................................... 18
         Figure 16: Yearly evolution of flight-planning indicator (KEP) ............................................................................... 18
         Figure 17: Yearly evolution of the actual trajectory indicator (KEA) ...................................................................... 19
         Figure 18 : IFR Flights per day in NM Area ........................................................................................................... 20
         Figure 19: Main contributors to network growth (excl. overflights) in 2018. ........................................................... 21
         Figure 20: Top 4 extra-NM partners in 2018. Left: number of flights per day (unidirectional). Right: additional number
              of flights per day in 2018 (vs 2017). ............................................................................................................. 23
         Figure 21: Left: Market Segment’s share in 2018. Right: Market segment’s growth in 2018................................. 25
         Figure 22: Crude Oil and Fuel Prices Evolution .................................................................................................... 26
         Figure 23 Monthly Rate of Operational Cancellations 2017-2018 ........................................................................ 27
         Figure 24: Top 20 en-route ATFM delay locations during 2018 ............................................................................ 28
         Figure 25: Top 20 en-route ATFM delay per flight locations during 2018 .............................................................. 29
         Figure 28 - Weekly En-route delay per flight - Marseille ACC Summer................................................................. 38
         Figure 29 – Summer sector scheme - Marseille ACC Saturdays after 25/06 (vs. 2017) ....................................... 38
         Figure 30 - Weekly En-route delay per flight – Karlsruhe UAC Summer ............................................................... 39
         Figure 31 – Summer sector scheme (average) - Karlsruhe UAC Sunday (vs. NOP plan and 2017) .................... 39
         Figure 32 - Weekly En-route delay per flight – Brest ACC Summer ...................................................................... 39
         Figure 33 – Summer sector scheme (average) – Brest ACC Saturday (vs. NOP) ................................................ 39
         Figure 34 - Weekly En-route delay per flight – Maastricht UAC Summer .............................................................. 40
         Figure 35 –Summer sector scheme (average) – Maastricht UAC Sunday (vs. NOP plan) ................................... 40
         Figure 36 - Weekly En-route delay per flight – Reims ACC Summer .................................................................... 41
         Figure 37 –Summer sector scheme (average) – Reims ACC Monday (vs. NOP plan) ......................................... 41
         Figure 38 - Weekly En-route delay per flight – Vienna ACC Summer ................................................................... 41
         Figure 39 –Summer sector scheme (average) – Vienna ACC Wednesday (vs. NOP plan) .................................. 41
         Figure 40 Network En-route delays vs Scenarios applied ..................................................................................... 42
         Figure 41 : Network En-route Volatility Indicators ................................................................................................. 43
         Figure 42 : Volatility indicator per FMP ................................................................................................................. 43
         Figure 43 Reasons for CTOT updates in Summer 2018 ....................................................................................... 44
         Figure 44: Top 20 airport delay locations during 2018 .......................................................................................... 48
         Figure 45: Top 20 airport delay per flight locations during 2018 ........................................................................... 50
         Figure 46: Route efficiency KPI per AIRAC cycle.................................................................................................. 57
         Figure 47: yearly evolution of airspace design indicator........................................................................................ 58
         Figure 48: Potential yearly savings/ losses in nautical miles (NM) due to airspace design ................................... 58
         Figure 49: Yearly evolution of flight-planning indicator (KEP) ............................................................................... 59
         Figure 50: Yearly savings/ losses in nautical miles (NM) due to improved flight planning efficiency ..................... 59
         Figure 51: Yearly evolution of the actual trajectory indicator (KEA) ...................................................................... 61
         Figure 52 - Yearly savings/ losses in nautical miles (NM) due to improved actual trajectory efficiency ................ 61

Edition Date: 01/05/2019                                                      Edition: 1.0                                Status: Released Issue                    iv
Figure 53: Evolution of CDR availability in 2018 ................................................................................................... 62
         Figure 54: Rate of CDR availability (RoCA) in 2018.............................................................................................. 62
         Figure 55: RAI (%) 2018 per AIRAC cycle. ........................................................................................................... 62
         Figure 56: RAU (%) 2018 per AIRAC cycle ........................................................................................................... 62
         Figure 57: Five year RAI evolution ........................................................................................................................ 63
         Figure 58: Five year RAU evolution ...................................................................................................................... 63
         Figure 59: CDR availability vs. usage in 2018 ....................................................................................................... 64
         Figure 60: PFE: 2018 Monthly Distance savings (nautical miles per flight) .......................................................... 64
         Figure 61: PFE: 2018 Monthly time savings (minutes per flight) .......................................................................... 64
         Figure 62: PFE 2018 vs. 2017 for planned traffic .................................................................................................. 65
         Figure 63: PFE 2018 vs. 2017 for actual traffic ..................................................................................................... 65
         Figure 64: PFE: 2017 Fuel economy and CO2 emissions .................................................................................... 65
         Figure 65: Map – Free Route Airspace Deployment by end 2018......................................................................... 67
         Figure 66 NM En-route Delay Savings in 2018 ..................................................................................................... 71
         Figure 67: ATFM Departure Slot Monitoring for 2017 and 2018 ........................................................................... 74
         Figure 68: Top 20 ADEPs - Flight Plans Suspensions for 2017 and 2018 ............................................................ 75
         Figure 69: ATFM Exemptions for State Aircraft Monitoring for 2017 and 2018 ..................................................... 76
         Figure 70: Missing Flight Plans for 2017 and 2018 ............................................................................................... 77
         Figure 71: Multiple Flight Plans for 2017 and 2018 ............................................................................................... 78

         Notice

         Traffic and Delay Comparisons: All traffic and delay comparisons are between the
         reporting year (2018) and the previous year, unless otherwise stated.

         NM Area: All figures presented in this report are for the geographical area that is within
         Network Manager’s responsibility unless otherwise stated.

         Summer season: Figures referring to the summer season in this report are for the period
         May to October (incl.), unless otherwise stated.

         Reporting Assumptions and Descriptions: For further information on the NM Area and
         the regulation reason groupings, go to the Reporting Assumptions and Descriptions
         documenti available on the EUROCONTROL website.

         Abbreviations: Abbreviations and acronyms used in this document are available in the
         EUROCONTROL Air Navigation Inter-site Acronym List (AIRIAL)ii.

Edition Date: 01/05/2019                                                     Edition: 1.0                                Status: Released Issue                    v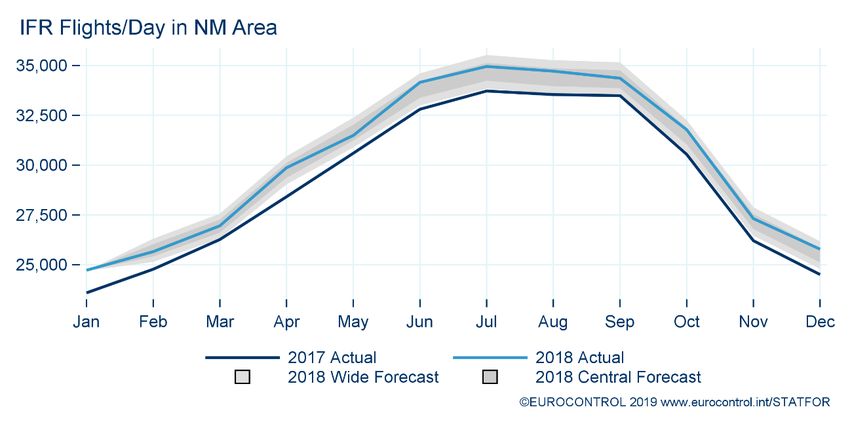
Main Report - Draft for Consultation
         EUROCONTROL
             NMD
                                      NETWORK OPERATIONS REPORT 2018

         1 EXECUTIVE SUMMARY
         There were on average 30,168 daily flights in the NM area in 2018, an increase of 3.8%
         compared to 2017, reaching a total of over 11 million flights. The previous year’s trend of high
         growth was maintained. Overall, traffic remained within the low-high range of the forecast used
         in the planning phase.

         Traffic growth was particularly high in the south-east axis, with ACCs in Central and Eastern
         Europe having record traffic levels. The busiest day ever in the network was Friday 7 September
         with 37,088 flights. There were nineteen days with over 36,000 flights (none in 2017).

         Airline reported delays (all causes) reached 14.7 minutes per flight, an increase of 2.3 minutes
         compared to 2017.

         En-route ATFM delay was 1.73 minutes per flight, double the delay of 2017 (0.88 min/flt in 2017)
         and well above the 0.5 minute per flight target. The high levels of demand, a major drop in
         capacity at two centres in the core area (Karlsruhe UAC and Marseille ACC) and a record
         number of adverse weather events and industrial actions severely disrupted the network in
         2018.

         Despite the high traffic growth in the network, airport ATFM delay was 0.60 minutes per flight,
         a 3% decrease compared to 2017. Weather and capacity accounted for 78% of the total airport
         delays in 2018. The highest airport ATFM delay generators were Amsterdam-Schiphol,
         Barcelona and Lisbon airports.

         ATC capacity, en-route weather and ATC staffing were the main causes of en-route ATFM
         delay. Weather and staffing more than doubled compared to 2017. Delays attributed to
         disruptions and events had the highest increase with delays increasing more than 2.5 times.

         Karlsruhe and Marseille combined caused 36% of all en-route ATFM delays. Limited capacity,
         recurrent staffing issues and disruptions impacted operations, including neighbouring ACCs.
         Maastricht, Reims, Brest and Vienna ACCs were the other centres with ATFM delay above
         2,000 minutes per day.

         NM and affected ANSPs prepared for the capacity issues at Karlsruhe well ahead of summer.
         The 4ACC initiative implemented a large set of measures aimed at diverting demand from risk
         areas. Demand effectively decreased by more than 2% on the UAC. Nevertheless, en-route
         delay at the UAC reached 3.18 minutes per flight in the summer. Moreover, aircraft flew at sub-
         optimal flight levels with a cost impact on operators.

         Marseille ACC was affected by insufficient capacity. In addition, industrial action heavily
         impacted the ACC. Nineteen strike days with severe ATFM impact, including two national strikes
         were recorded in the ACC.

         Unexpected capacity issues occurred in some ACCs in central and south-eastern Europe, partly
         driven by the high demand levels, namely in Vienna, Zagreb, Prague and Budapest ACCs.

         A number of ACCs had lower delays than initially forecasted in the NOP. Bordeaux, Maastricht,
         Palma, Geneva, Amsterdam and London ACCs had been identified as having capacity short-
         comings for the summer, but successfully implemented the NOP measures and performed
         better than expected.

Edition Date: 01/05/2019                         Edition: 1.0               Status: Released Issue   6
Main Report - Draft for Consultation
         EUROCONTROL
             NMD
                                      NETWORK OPERATIONS REPORT 2018

         The year was marked by a record number of adverse weather events, especially CB cells, which
         started early in the summer and continued throughout the season, disrupting operations both
         on the ground and en-route. As a result, regulation delays allocated to weather have doubled
         comparing to 2017, and were one third of all ATFM delays.

         On 3 April NM suffered an outage of its technical system affecting primarily its ATFM and
         CCAMS operational services. The outage of ETFMS resulted in the application of the NM ATFM
         Procedural Contingency Plan, which was correctly executed through all phases. Whilst this
         ensured a safe level of traffic throughout the European ATM Network, it had a negative impact
         on network performance.

         The flight plan indicator (KEP) improved again in 2018, but at a slower rate than in 2017. The
         actual trajectory indicator (KEA) decreased slightly over 2017. During the spring 2018 KEA
         almost reached the target, deteriorating significantly afterwards due to capacity, weather and
         industrial action reasons.

         There were record numbers of ATFM regulations in the NM system with over 400 regulations
         applied on some days. ATFM regulation usage (en-route and airport) increased generating
         delay for over 1.3 million flights.

         ACCs reported an increase of traffic volatility. Fluctuations in tactical traffic counts made it
         difficult to manage operations. Airports also reported departure sequence issues due to the
         amount of updates to take off times. Similarly, airline operations experienced increased
         workload due to frequent updates of CTOT.

         NM’s efforts to reduce delays through re-routeing proposals or direct actions from the NMOC
         increased in 2018. NM delivered en-route delay savings of 12.5% (2.7 million minutes). The
         NMOC received a high number of helpdesk requests (40% increase on 2017) with a peak of
         2,444 requests on a single day (28 July).

Edition Date: 01/05/2019                         Edition: 1.0               Status: Released Issue   7
Main Report - Draft for Consultation
         EUROCONTROL
             NMD
                                          NETWORK OPERATIONS REPORT 2018

         2 INTRODUCTION & SCOPE
         The purpose of this document is to provide an overview of the European ATM network
         performance in 2018 in the areas of traffic evolution, capacity offered by the Air Navigation
         Service Providers and Airports, delays and flight efficiency. Airspace users’ opinion on the
         network performance is also included.

         The report analyses the annual results in light of the main events that took place in the course
         of the year.

         The document structure is as follows:

                   Section 1: Executive Summary.
                   Section 2: Introduction & Scope.
                   Section 3: Network Overview contains the annual performance of the European ATM
                             network: traffic, delays and flight efficiency.
                   Section 4: Traffic in Detail is a detailed analysis of traffic growth in 2018 in the NM area
                             and adjacent regions.
                   Section 5: En-Route Performance is an analysis of network en-route performance:
                            events and disruptions; capacity and ACC performance.
                   Section 6: Airports is an analysis of the performance of airport operations.
                   Section 7: Flight Efficiency is an analysis of network flight efficiency.
                   Section 8: Network Manager is NM’s contribution to achieved performance results.
                   Section 9: ATFM Compliance provides a view on the compliance to the ATFM
                            Implementing Rule.
                   Section 10: References.
                   Annex I: Airspace Users’ View outlines the users’ perspective on how the network
                            performed in 2018.
                   Annex II: ACC contains a traffic and capacity evolution for each ACC in 2018.
                   Annex III: Airports contains capacity, delay, arrival/departure punctuality status and a
                              NM performance assessment of each of the significant airports in 2018.

Edition Date: 01/05/2019                              Edition: 1.0                Status: Released Issue    8
Main Report - Draft for Consultation
EUROCONTROL
NMD
NETWORK OPERATIONS REPORT 2018
3 NETWORK OVERVIEW
3.1 2018 BY MONTH
40000 4.8% 3.6% 2.6% 5.1% 2.9% 4.1% 3.7% 3.5% 2.6% 4.1% 4.2% 5.2%
35000
Avg daily traffic
30000
25000
20000
15000
10000
5000
0
JAN FEB MAR APR MAY JUN JUL AUG SEP OCT NOV DEC
2017 2018
Figure 1: Average daily traffic in 2018
The first months of 2018 were slightly better than 2017 in terms of ATFM delay. The rest of the
year, especially the summer months, was marked by record levels of en-route ATFM delay,
largely due to the capacity limitations in two main ACCs of the core area – Karlsruhe and
Marseille ACCs.
At the end of March, a national strike in France was the first of a series of French industrial
actions with severe ATFM impact in the network. Most of the actions happened in Marseille
ACC, which alone recorded 19 days of strikes until the end of June. By then, more than 20%
of all ATFM delays on the network were due to industrial action.
With the start of the IATA summer season two additional airports joined A-CDM. Naples airport
became a full CDM airport at the end of March and Amsterdam/Schipol joined A-CDM later in
May.
On the 3 April NM suffered an outage of its technical system affecting primarily its ATFM and
CCAMS operational services. The outage of ETFMS resulted in the application of the NM ATFM
Procedural Contingency Plan, which was correctly executed through all phases.
The arrival of the summer schedules in April brought additional traffic growth and exposed the
drop in capacity at Karlsruhe (20% reduction on sectors compared 2017). The network
introduced in May a series of measures to divert traffic from the critical areas (4ACC initiative).
These measures were active throughout the whole summer.
The month of May marked the early start of the convective weather season, which continued
until mid-September. There were adverse weather events affecting most parts of Central and
Eastern Europe during the whole summer, disrupting operations both on the ground and en-
route.
Edition Date: 01/05/2019 Edition: 1.0 Status: Released Issue 9Main Report - Draft for Consultation
EUROCONTROL
NMD
NETWORK OPERATIONS REPORT 2018
As from the end of June, Marseille strikes ceased but the capacity and staffing delays on the
ACC increased to unprecedented levels. In July, Marseille recorded a peak of 5.2 minutes of
ATFM delay per flight. Despite the decrease in demand, Karlsruhe also reached an all-time peak
of 4.31 minutes of delay per flight that month. Significant capacity problems were also occurring
in the neighbouring ACCs of Maastricht, Reims and Vienna.
5.0 4.6
4.5
4.0
ATM delay (min) per flight
4.0 3.5
3.5 3.2
3.0 2.8
2.5
2.5 2.2 2.1
2.0 1.8
2.0 1.5 1.4 1.4
1.5 1.1 1.1 1.2 1.1 1.1
1.0
0.8 0.8 0.8
1.0 0.6 0.6
0.5
0.0
AUG
SEP
FEB
APR
JUN
JAN
MAR
DEC
OCT
JUL
MAY
NOV
2017 2018
Figure 2 Monthly ATFM delay in 2018
The busiest day ever in the network was recorded on Friday 7 September with 37,088 flights.
Nevertheless, September was the month with the lowest traffic growth. Overall network delay
started to decrease, mainly due to an improvement of the staffing situation in Marseille and
better weather conditions.
Karlsruhe and Marseille were still generating considerable ATFM delay in the last quarter of
2018. Lisbon and Canarias ACCs experienced some capacity issues during this period, partly
due to the record traffic on the flows to the Spanish Atlantic islands. For the first time since
February, airport ATFM delays were greater than en-route. Adverse weather affected many
airports in the network, with high impact in London/Heathrow and Amsterdam/Schiphol.
In December, another French ATC strike impacted network operations. The figure of 11 million
flights was reached on the last day of 2018, marking an all-time record for the network.
Edition Date: 01/05/2019 Edition: 1.0 Status: Released Issue 10Main Report - Draft for Consultation
EUROCONTROL
NMD
NETWORK OPERATIONS REPORT 2018
3.2 TRAFFIC 2018
There were on average 30,168 daily flights in the NM area in 2018 (Figure 3), an increase of
3.8% compared to the previous year, reaching a total of over 11 million flights. The summer
months of June, July, August and September totalled more than one million flights each. There
were 19 days with over 36.000 flights (none in 2017). Traffic growth was in line with February
2018 forecast.
30,500
30,000
Average Daily Traffic (Flights)
29,500
29,000
28,500
28,000
27,500
27,000
26,500
26,000
25,500 26,215 26,685 27,094 27,844 29,057 30,168
25,000
2013 2014 2015 2016 2017 2018
Year
Figure 3: Average daily traffic per year
Germany, Spain and Turkey were the main contributors to the increase in traffic in the network.
The south-east axis had particularly high growth, with most of the ACCs in Central and Eastern
Europe recording growth levels near or above 7%. This was mainly due to the increase in flows
to Turkey and Greece (especially from Germany) and a recovery of Russian traffic to
Mediterranean destinations. The south-west axis recorded a more moderate growth compared
to 2017, mainly due to a decrease in UK traffic.
Edition Date: 01/05/2019 Edition: 1.0 Status: Released Issue 11Main Report - Draft for Consultation
EUROCONTROL
NMD
NETWORK OPERATIONS REPORT 2018
3.3 DELAYS
ALL AIR TRANSPORT DELAYS (AIRLINE VIEW)
This section presents the all air transport delay situation by using the data collected by Central
Office for Delay Analysis (CODA) from airlines. Data coverage is 70% of the commercial flights
in the ECAC region for 2018.
Average Departure Delay per Flight 2014-2018
20
14.70
Average departure delay (min) per flight
15
12.31
10.50 11.30
9.70
10
Based on airline data, the average
5
departure delay per flight from ‘All-
0
Causes’ was 14.7 minutes per
flight, an increase of 17% in
2014
2015
2016
2017
2018
Average reactionary delay per flight (CODA) comparison to 2017 where the
Average delay per flight Other Primary delay All Causes (CODA) average delay was 12.31 minutes
Average ATFM en-route delay per flight (CODA)
Average ATFM en-route delay per flight (NM reported)
per flight (Figure 4). Primary
delays accounted for 55% (or 8.02
min/flt), with reactionary delays
Figure 4 Average departure delay per flight 2014-2018
representing the smaller
remaining share of 45% at (6.68
min/flt), as shown in Figure 5.
Average departure delay per flight in minutes
16 14.70
14
12
10
8.02
8
6
4
1.73 1.68
2
0
Average En-Route Average En-Route Average primary delay Passenger experience
Delay/Flight Delay/Flight
NM reported En-Route ATFM delay Airline Reported En-Route ATFM Delay
Primary Delay (excl En-Route) Reactionary delay
Figure 5 Average departure delay per flight 2014-2018
Edition Date: 01/05/2019 Edition: 1.0 Status: Released Issue 12Main Report - Draft for Consultation
EUROCONTROL
NMD
NETWORK OPERATIONS REPORT 2018
25
Avg departure delay/flight (min)
20 Further analysis of the past 12 months
15 (Figure 6) shows that the average ‘All-
10 Causes’ en-route ATFM delay reported by
5 airlines was 1.68 minutes per flight. This is
0
lower1 when compared to the NM reported
average en-route ATFM delay of 1.73
201801
201802
201803
201804
201805
201806
201807
201808
201809
201810
201811
201812
minutes per flight in 2018.
Average reactionary delay per flight (CODA)
Average delay per flight Other Primary delay All Causes (CODA)
Average ATFM en-route delay per flight (CODA)
Average ATFM en-route delay per flight (NM reported)
Figure 6: Average departure delay per flight 2018
The percentage of flights delayed from ‘All-
Percentage of flights delayed on departure
10% 30.0%
Causes’ increased with those exceeding 15
Percentage of flights delayed on
8% 25.0%
minutes increasing by 4.1 percentage points to
departure: All Causes
20.0%
6% 25.9%. As shown in Figure 7, those exceeding
15.0%
- ATFM NM
4%
10.0%
30 minutes also increased with 13.8% of flights
2% 5.0%
being delayed in 2018.
0% 0.0%
2014
2015
2016
2017
2018
> 15min by ATFM Restrictions (NM) > 30min by ATFM Restrictions (NM)
> 15min:All Causes (CODA) > 30min:All Causes (CODA)
Figure 7: Percentage of delayed flights: ATFM & All
Causes
1
ATFM delays reported by airlines could be different than the NM calculated ATFM delays due to difference in methods: ATFM
delays of NM are the (flight) planned “delays”; the airlines report the “actual” experienced ATFM delay on departure.
Edition Date: 01/05/2019 Edition: 1.0 Status: Released Issue 13Main Report - Draft for Consultation
EUROCONTROL
NMD
NETWORK OPERATIONS REPORT 2018
ATFM DELAYS
There were over 1.3 million flights delayed by an ATFM regulation in 2018, a 55% increase on
2017. One third of these flights was delayed by more than 15 minutes.
EN-ROUTE
AIRPORT
80,000
70,212
70,000
ATFM Delays (min)
60,000
50,000 43,533
52,199 The average daily ATFM delay in 2018
40,000 (74%) increased by 61% compared to 2017.
30,000 25,519
(59%)
The en-route ATFM delay was the
20,000 double of 2017 while airport ATFM
10,000 18,014 18,013
delay remained at the same level of
-
(41%) (26%) last year (see Figure 8).
2017 2018
Figure 8 : Average daily ATFM delay (2017 vs
2018)
The average ATFM delay per flight on the network was 2.33 minutes, a 55% increase compared
to 2017 (Figure 9). En-route ATFM delay was 1.73 minutes per flight (97% increase) and airport
ATFM delay was 0.60 minutes per flight (3% decrease). From 2015 to 2017, delay per flight
remained stable at around 1.5 minutes per flight. The year of 2018 marked a change on the
ATFM delay trend. The figure is now closer to the maximum of 2010 when the network recorded
2.88 minutes per flight. However, the traffic that year was 13% lower than 2018.
Average delay per flight (mins)
3.0 31000
2.5 30000
Average Traffic
29000
2.0
28000
1.5
27000
1.0
26000
0.5 25000
0.0 2009 2010 2011 2012 2013 2014 2015 2016 2017 2018
24000
EN-ROUTE 0.96 2.02 1.14 0.63 0.53 0.61 0.73 0.86 0.88 1.73
AIRPORT 0.64 0.86 0.67 0.48 0.39 0.42 0.69 0.67 0.62 0.60
TRAFFIC 26103 26329 27146 26427 26215 26685 27094 27844 29057 30168
Figure 9 : Average daily traffic and ATFM delay per flight (En-route and Airport) 2009-2018
Edition Date: 01/05/2019 Edition: 1.0 Status: Released Issue 14Main Report - Draft for Consultation
EUROCONTROL
NMD
NETWORK OPERATIONS REPORT 2018
AIRPORT DISRUPTIONS 223
AIRPORT DISRUPTIONS (ATC) 406
AIRPORT EVENTS 444
AIRPORT STAFFING (ATC) 479 The main reasons for en-route ATFM
ENROUTE EVENTS 834
ENROUTE DISRUPTIONS 1,200
delay in 2018 were en-route ATC
ENROUTE CAPACITY 1,522 capacity (28%), en-route weather
AIRPORT CAPACITY (ATC) 2,105
ENROUTE DISRUPTIONS (ATC) 3,911
(19%) and en-route ATC staffing (17%).
AIRPORT CAPACITY 5,793 Airport weather (12%) and airport
AIRPORT WEATHER 8,563
ENROUTE STAFFING (ATC) 11,947 capacity (8%) were the main delay
ENROUTE WEATHER
ENROUTE CAPACITY (ATC)
13,181 causes attributed to airports (Figure
19,604
10).
- 5,000 10,000 15,000 20,000
Figure 10: ATFM delays in 2018 (av. daily)
Karlsruhe UAC and Marseille ACCs were the main generators of ATFM delay in the network
(Figure 11). The same situation happened in 2017. Combined, the two centres generated
nineteen thousand minutes of daily delay in 2018, which represents 27% of the total ATFM delay
(Airport and En-route). Karlsruhe was greatly affected by en-route capacity and staffing while
Marseille reported delays mainly due to en-route staffing and disruptions.
20%
Proportion of total ATFM delay
18% 11,077
16%
14% 7,882
12%
10%
8% 4,063
3,461
6% 2,819
2,209 1,960 1,779 1,683
4% 1,351 1,336 1,209 1,205 1,189 1,160 1,155 1,064 1,053 960 876
2%
0%
MARSEILLE ACC
WIEN ACC
BUDAPEST ACC
BARCELONA/EL PRAT
KARLSRUHE UAC
LONDON TMA TC
PRAGUE ACC
BARCELONA ACC
BREST U/ACC
LANGEN ACC
LISBOA
NICOSIA ACC
ZAGREB ACC
MAASTRICHT UAC
REIMS U/ACC
ATHINAI CONTROL
ISTANBUL-ATATURK
AMSTERDAM/SCHIPHOL
LONDON/GATWICK
LONDON/HEATHROW
ENROUTE CAPACITY (ATC) ENROUTE STAFFING (ATC) ENROUTE DISRUPTIONS (ATC) ENROUTE CAPACITY ENROUTE DISRUPTIONS
ENROUTE EVENTS ENROUTE WEATHER AIRPORT CAPACITY (ATC) AIRPORT STAFFING (ATC) AIRPORT DISRUPTIONS (ATC)
AIRPORT CAPACITY AIRPORT DISRUPTIONS AIRPORT EVENTS AIRPORT WEATHER
Figure 11 : Average ATFM delay per ACC in 2018
En-route ATC capacity was the main cause of delay in Reims, Brest and Barcelona ACCs, in
addition to Karlsruhe. En-route ATC staffing had a great impact in Maastricht and Marseille
ACCs. En-route weather affected several ACCs across the network, especially in Karlsruhe,
Maastricht and Vienna.
Weather events affected the airports of Amsterdam/Schiphol, London/Heathrow, Barcelona,
Frankfurt Main and Palma. The airports most affected by airport capacity were Lisbon,
Istanbul/Ataturk and London/Gatwick, in addition to Amsterdam/Schiphol. Despite a decrease
of 31%, the Dutch airport was the main generator of airport ATFM delay in the network.
There were several ATC industrial actions in France, especially between March and June,
affected Marseille ACC and to a lesser extent, the other French ACCs.
Edition Date: 01/05/2019 Edition: 1.0 Status: Released Issue 15Main Report - Draft for Consultation
EUROCONTROL
NMD
NETWORK OPERATIONS REPORT 2018
3.3.2.1 EN-ROUTE ATFM DELAYS
ENROUTE WEATHER 0.20
0.44
ENROUTE EVENTS 0.03
0.03
ENROUTE DISRUPTIONS 0.02
0.04
ENROUTE CAPACITY 0.02
0.05
ENROUTE DISRUPTIONS (ATC) 0.09
0.13
ENROUTE STAFFING (ATC) 0.14
0.40
ENROUTE CAPACITY (ATC) 0.38
0.65
0.00 0.10 0.20 0.30 0.40 0.50 0.60 0.70
Delay per Flight (min/flt)
Figure 12: 2018 average en-route ATFM delay per flight
En-route delays in 2018 were the double of the previous year. This represents 9.7 million more
minutes of en-route delay than 2017. En-route capacity delays increased 77% and en-route
weather increased 116% (Figure 12). En-route staffing had the highest increase, 175%. Delays
due to en-route disruptions and en-route events increased by 71%.
An overview on the performance of individual ACCs is available in 5 En-Route Performance and
in Annex II - ACC.
Edition Date: 01/05/2019 Edition: 1.0 Status: Released Issue 16Main Report - Draft for Consultation
EUROCONTROL
NMD
NETWORK OPERATIONS REPORT 2018
3.3.2.2 AIRPORT/TMA ATFM DELAYS
Despite the traffic growth recorded on the network, airport ATFM delay remained at the same
level as 2017, averaging 18,013 minutes of daily delay. Weather and capacity accounted for
79.7% of the total airport delays in 2018.
Airport weather related delay increased by 2.3% and remained the main airport delay cause.
The airport with the highest weather delay, Amsterdam/Schiphol, generated an average of 999
minutes per day in 2018 compared to 1,337 in 2017. Adverse weather delays also decreased
by 23.3% at London/Heathrow (912 minutes per day), but nearly doubled at Barcelona (715
minutes per day). Adverse weather conditions particularly affected airport operations in January,
May, June and October.
Airport capacity delay decreased by 14.1% but remains the second biggest contributor to airport
delay. Airport capacity related delay has decreased for the third consecutive year. Lisbon airport
had the most capacity related delay in 2018, followed by Istanbul/Atatürk and
Amsterdam/Schiphol airports.
ATFM delays due to airport capacity
(-20.2%), airport disruptions (ATC)
AIRPORT WEATHER 8,367
8,563 and airport disruptions decreased
AIRPORT EVENTS 373
444 compared to 2017 (Figure 13).
AIRPORT DISRUPTIONS 326
223
AIRPORT CAPACITY 6,745
5,793 There was an increase in ATFM
AIRPORT DISRUPTIONS (ATC) 596
406
delays related to airport weather
AIRPORT STAFFING (ATC) 164 (+2.3%), airport capacity (ATC),
479
AIRPORT CAPACITY (ATC) 1,442 airport staffing (ATC) and airport
2,105
events.
0 2,000 4,000 6,000 8,000 10,000
Av. Daily Delay (minutes)
Figure 13: 2018 average daily airport/TMA delays
During 2018, NM continued to provide support and recommendations to major airports facing
local capacity challenges and/or high delay levels. NM gave special attention to specific regions
and airports, with special focus on Barcelona airport and the Greek Action Plan. The airport
function within the NMOC provided tactical support to hot-spot airports (see 6.3.1 Greek Islands
– Summer).
An overview and more information on individual airports can be found in section 6 Airports and
in Annex III - Airports.
Edition Date: 01/05/2019 Edition: 1.0 Status: Released Issue 17Main Report - Draft for Consultation
EUROCONTROL
NMD
NETWORK OPERATIONS REPORT 2018
3.4 FLIGHT EFFICIENCY
3.50%
The average route extension due
3.04%
2.96% to airspace design decreased
3.00% 2.80%
2.63% from 2.36% in 2017 to 2.29% in
2.55%
2.47%
2.50% 2.36% 2.29% 2018 (Figure 14), exceeding
already the target set for 2019
2.00% (2.39%). The indicator reached a
historically low level in August
1.50% 2018 with 2.23% and allowed
2011 2012 2013 2014 2015 2016 2017 2018 potential average savings of
nearly 2,100 nautical miles per
Figure 14: Average route extension due to airspace
day.
design (RTE – DES)
The flight planning indicator
4.91% 4.87% (KEP) measures the average
4.86% 4.82%
4.90% route extension based on the
4.70% 4.74%
4.70% 4.62% 4.59% latest filed flight plan. It
decreased from 4.62% in 2017
4.50%
to 4.59% in 2018 (for the NM
4.30%
area). The targets of 4.27% for
4.10% SES area, 3.99% for NM area
3.90% were not met (Figure 15).
3.70%
The indicator decrease shows
3.50% potential losses of
2011 2012 2013 2014 2015 2016 2017 2018
approximately 3.67 million
Figure 15: Yearly evolution of flight-planning indicator nautical miles.
(KEP)
Despite an improvement on
flight plan efficiency (KEP),
aircraft are flying longer routes
(great circle distances
increased by 2.3% on 2017, an
increase of 12 nautical miles
per flight) which impacts
negatively the total route
extension distance in 2018 in
comparison with 2017.
Edition Date: 01/05/2019 Edition: 1.0 Status: Released Issue 18Main Report - Draft for Consultation
EUROCONTROL
NMD
NETWORK OPERATIONS REPORT 2018
The actual trajectory indicator
3.40% 3.31% (KEA) increased to 2.79%
3.20%
3.14% (Figure 16) for the NM area,
3.20%
3.00% 2.93% thus not meeting the target
2.77% 2.77% 2.79% (2.69%).
2.80% 2.72%
2.60% The indicator increase
2.40% represents an actual increase of
2.20% approximately 5.7 million
additional nautical miles flown.
2.00%
2011 2012 2013 2014 2015 2016 2017 2018
Figure 16: Yearly evolution of the actual trajectory indicator
(KEA)
Edition Date: 01/05/2019 Edition: 1.0 Status: Released Issue 19Main Report - Draft for Consultation
EUROCONTROL
NMD
NETWORK OPERATIONS REPORT 2018
4 TRAFFIC IN DETAIL
Figure 17 : IFR Flights per day in NM Area
In 2018, the number of flights in NM area increased by 3.8% compared to 2017, driving the total
number of flights above 11 million, an all-time record. Traffic growth during the summer months
was in line with the high growth scenario of February 2018 forecast (see Figure 17).
On average, there were 30,168 flights per day on the Network, and the busiest day ever was on
7 September when 37,088 flights were controlled. In fact, there were 19 days in 2018 with over
36,000 flights – there were none in 2017. Across 2018, the second and the last quarters
recorded higher than average growth rates (compared to 2017); the last quarter’s growth was
particularly inflated due to heavy cancellations in 2017 (airline failures and snow).
The overall positive trend in 2018 however hid some local disparities: Germany and Spain were
the busiest contributors to the local traffic growth in Europe while UK and Sweden recorded
losses in their respective local traffic.
Airlines maximised their load factors and the total number of passengers carried reached record
heights. This was due to strong demand and planning of operations when fuel costs were low
at the end of 2017.
Edition Date: 01/05/2019 Edition: 1.0 Status: Released Issue 20Main Report - Draft for Consultation
EUROCONTROL
NMD
NETWORK OPERATIONS REPORT 2018
4.1 NETWORK CONTRIBUTORS
Figure 18 shows the main contributors to traffic growth in 2018 (referring to local traffic only, ie.
excluding overflights). All but two states (Sweden and UK) have been adding flights to the
network in 2018. The three main contributors to the network’s local traffic were Germany, Spain
and Turkey.
Figure 18: Main contributors to network growth (excl. overflights) in 2018.
Germany (+226 flights/day) recorded especially strong growth on the flows from and to
Mediterranean states (Turkey, Spain, Greece as well as Egypt). However, growth rates were
artificially inflated in the last quarter of the year due to the counter effect of airberlin cessation
of operations in October 2017.
Spain was the second biggest contributor (+180 flights/day) owing to a particularly dynamic
domestic flow and strong growth from and to Germany. Turkey was the third main contributor
(155 flights/day), stimulated by the continuing traffic recovery from and to the Russian
Federation as well as strong growth from and to Germany. Growth was held back by weak
domestic flows.
Italy (127 flights/day) ranked fourth, notably due to strong traffic from and to Spain and from and
to the Russian Federation. Poland (121 flights/day) completed the top five owing to strong
growth on flows from and to Ukraine, Germany and Turkey.
At the other end of the scale, Sweden and UK saw declines of their local traffic. UK recorded a
general decrease on its busiest flows: Spain, Germany, France, Netherlands, Switzerland and
Canary Islands.
Edition Date: 01/05/2019 Edition: 1.0 Status: Released Issue 21Main Report - Draft for Consultation
EUROCONTROL
NMD
NETWORK OPERATIONS REPORT 2018
4.2 ROUTING ASPECTS
The year of 2018 was marked by changes in traffic patterns: some flights have used different
routes compared to the ones used in 2017, mostly because airlines optimised their routes and
the network was also continuously refined, for example, recently with the development of free
route airspace. Moreover, during Summer 2018, the Network Manager launched a joint initiative
with a group of ANSPs, the “4 ACCs initiative”, to optimise2 the flows of traffic through the
participant ACCs’ airspaces as a whole, so as to increase overall capacity and throughput.
This affected the ACCs in the core area of the network, with impact on the flight routings and
flight levels, on the distance flown and on the aircraft weights. As an example, flows between
North-West European States (Germany, UK, Belgium/Luxembourg or France) and Italy, were
routed more through Switzerland in 2018 while the year before they were routed more through
Austria.
When comparing 2018 routings to 2017 ones, other route changes on bi-directional flows at
State level include:
Flows between North-West Europe States (Germany, UK) and Turkey have been routed
more via southern routes along the Adriatic coast (Croatia, Bosnia-Herzegovina, Serbia,
Montenegro, Greece) than the northern routes used in 2017 (Czech Republic, Slovakia,
Hungary, Romania, Bulgaria)
Flows between Germany and Egypt have been routed more through eastern routes (via
Czech Republic, Turkey, Cyprus) than through the 2017 routes along the Adriatic coast
(via Croatia, Albania)
Flows between North-Atlantic and Middle-East have been routed more through southern
routes (via UK, Ireland, Bulgaria, Turkey) than northern routes (via Iceland, Norway,
Sweden, Finland and Russian Federation), partly due to the changed jet stream position
during the year
Flows between UK and Canary Islands have been more routed through France, Spain
and Morocco than via the Atlantic routes (Ireland, Santa Maria)
Flows between Italy and Middle-East have been routed more through Bosnia
Herzegovina, Bulgaria and Turkey than through southern routes (Greece, Cyprus).
2
In practice: a new ATS route has been opened in Poland to ease the passage of traffic between northern and southern Europe,
local measures have been introduced to reduce the demand in Karlsruhe UAC and Maastricht UAC and some RAD (Route
Availability Document) measures have been adopted to lower the network delay and minimise the route extension.
Edition Date: 01/05/2019 Edition: 1.0 Status: Released Issue 22Main Report - Draft for Consultation
EUROCONTROL
NMD
NETWORK OPERATIONS REPORT 2018
4.3 OUTSIDE EUROPE
Figure 19: Top 4 extra-NM partners in 2018. Left: number of flights per day (unidirectional).
Right: additional number of flights per day in 2018 (vs 2017).
As shown in Figure 19, the United States remained the number one external3 destination from
Europe in terms of number of flights with ~1,030 flights per day on average in 2018 (both
directions), which is a growth of 5% on 2017.
The Russian Federation was the second destination from Europe with ~940 flights per day,
continuing its recovery from the Russian economic slowdown (2014) with a 11.4% growth per
day on average. During summer months (June-August), Russia traffic grew even more strongly
and became the number one destination, overtaking the United States.
The third destination from Europe remained United Arab Emirates, with an average daily traffic
of 340 flights (+4% on 2017). Egypt is the fourth destination from Europe, slowly recovering from
its extended decline (2011 and 2015) with ~260 flights per day, a 31% increase on 2017 but still
15% below 2010 levels (See Figure 19).
3
Europe = ECAC. Morocco and Israel are considered as external partner (though they belong to NM area)
Edition Date: 01/05/2019 Edition: 1.0 Status: Released Issue 23Main Report - Draft for Consultation
EUROCONTROL
NMD
NETWORK OPERATIONS REPORT 2018
4.4 AIRPORT TRAFFIC EVOLUTION
Departures from the airports in the network increased by 3.4% in 2018.
Nº ICAO ID AIRPORT NAME DEP % Nº ICAO ID AIRPORT NAME DEP %
1 EDDF FRANKFURT MAIN 701 7.7% 26 LIMC MILANO MALPENSA 266 8.6%
2 EHAM AMSTERDAM/SCHIPHOL 701 0.7% 27 EFHK HELSINKI-VANTAA 264 9.1%
3 LFPG PARIS CH DE GAULLE 669 1.2% 28 EPWA CHOPINA W WARSZAWIE 257 9.4%
4 EGLL LONDON/HEATHROW 654 0.3% 29 LTAI ANTALYA 255 20.9%
5 LTBA ISTANBUL-ATATURK 625 1.1% 30 EDDT BERLIN-TEGEL 254 8.1%
6 EDDM MUENCHEN 562 2.0% 31 LSGG GENEVA 247 -2.0%
7 LEMD ADOLFO SUAREZ MADRID-BARAJAS 561 5.7% 32 LLBG TEL AVIV/BEN GURION 214 13.2%
8 LEBL BARCELONA/EL PRAT 460 3.8% 33 LKPR PRAHA RUZYNE 207 5.1%
9 LIRF ROMA/FIUMICINO 421 3.4% 34 EDDH HAMBURG 204 -3.3%
10 EGKK LONDON/GATWICK 389 -0.8% 35 LFMN NICE-COTE D'AZUR 197 1.0%
11 LSZH ZURICH 372 3.1% 36 EDDK KOELN-BONN 194 2.1%
12 EKCH KOBENHAVN/KASTRUP 365 2.8% 37 LEMG MALAGA/COSTA DEL SOL 188 1.6%
13 ENGM OSLO/GARDERMOEN 353 2.6% 38 EGGW LONDON/LUTON 186 0.5%
14 LOWW WIEN SCHWECHAT 351 6.7% 39 EGPH EDINBURGH 177 1.7%
15 ESSA STOCKHOLM-ARLANDA 334 -2.1% 40 EDDS STUTTGART 176 8.6%
16 EIDW DUBLIN 318 4.3% 41 GCLP GRAN CANARIA 175 10.1%
17 LFPO PARIS ORLY 318 0.0% 42 LROP BUCURESTI/HENRI COANDA 168 5.7%
18 EBBR BRUSSELS NATIONAL 315 -1.3% 43 LTAC ANKARA-ESENBOGA 157 2.0%
19 LTFJ ISTANBUL/SABIHA GOKCEN 309 5.5% 44 LHBP BUDAPEST LISZT FERENC INT. 157 12.1%
20 LEPA PALMA DE MALLORCA 302 5.6% 45 LIML MILANO LINATE 156 -1.9%
21 EDDL DUESSELDORF 299 -1.3% 46 LFLL LYON SAINT-EXUPERY 155 0.7%
22 LPPT LISBOA 298 7.2% 47 EGBB BIRMINGHAM 151 -7.4%
23 LGAV ATHINAI/ELEFTHERIOS VENIZELOS 289 11.2% 48 EDDB SCHOENEFELD-BERLIN 138 0.7%
24 EGCC MANCHESTER 276 -1.1% 49 LFBO TOULOUSE BLAGNAC 134 -1.5%
25 EGSS LONDON/STANSTED 274 6.2% 50 LFML MARSEILLE PROVENCE 134 0.0%
Table 1: Top 50 airports per average daily departure traffic in 2018
With a 7.7% traffic increase, Frankfurt/Main airport matched Amsterdam/Schiphol in terms of
average daily departures in 2018. The two airports shared a traffic record of 701 average daily
departures. With a 1.2% traffic increase, Paris Charles de Gaulle remains one of the top 3
busiest airports with 669 average daily departures.
Seven of the top ten airports (Frankfurt/Main, Paris/Charles de Gaulle, Istanbul/Atatürk, Munich,
Madrid/Barajas, Barcelona/El Prat and Rome/Fiumicino) had an increase in average daily flights
in 2018. Amsterdam/Schiphol, London/Heathrow and London/Gatwick, all capacity constrained,
remained at similar levels as 2017.
The largest increase in traffic was at Antalya (20.9%), Tel Aviv/Ben Gurion (13.2%), Budapest
(12.1%), Athens (11.2%), Gran Canaria (10.1%), Warsaw/Chopin (9.4%) and Helsinki (9.4%)
airports also recorded significant traffic increase in 2018.
The cessation of operations of Monarch airlines and airberlin significantly affected the traffic at
Birmingham and Hamburg airports, respectively. Birmingham recorded a traffic decrease of
7.4% while Hamburg had 3.3% less traffic.
Edition Date: 01/05/2019 Edition: 1.0 Status: Released Issue 24You can also read