Motorways 2018 - European Commission
←
→
Page content transcription
If your browser does not render page correctly, please read the page content below

Motorways 2018

Motorways

CONTENTS
1     Overview _________________________________________________________________ 3
2     Definition ________________________________________________________________ 5
3     Motorway network in Europe_________________________________________________ 7
4     Motorway design principles __________________________________________________ 8
    4.1   Design speed and alignment ____________________________________________________ 8
    4.2   Cross-sections ________________________________________________________________ 9
    4.3   Roadside ____________________________________________________________________ 9
    4.4   Interchanges ________________________________________________________________ 10
    4.5   Tunnels ____________________________________________________________________ 11
      4.5.1   Horizontal and vertical alignment ___________________________________________________ 12
      4.5.2   Cross section____________________________________________________________________ 13
      4.5.3   Safety and operation _____________________________________________________________ 14
    4.6   Motorway equipment and traffic control devices __________________________________ 14
5     Safety benefits of motorways ________________________________________________ 17
    5.1   Construction of motorways ____________________________________________________ 17
    5.2   Other motorway characteristics ________________________________________________ 18
      5.2.1   Central medians _________________________________________________________________        18
      5.2.2   Grade-separated junctions _________________________________________________________      18
      5.2.3   Access control ___________________________________________________________________       19
      5.2.4   Dynamic speed limits _____________________________________________________________       20
6     Motorway Accidents _______________________________________________________ 20
    6.1   Improper use of emergency lane ________________________________________________ 21
    6.2   Cross-median accidents _______________________________________________________ 23
    6.3   Wrong-way driving accidents __________________________________________________ 25
      6.3.1   Accident location and conditions ____________________________________________________    25
      6.3.2   Characteristics of the wrong-way driver ______________________________________________   25
      6.3.3   Causes of wrong-way driving _______________________________________________________      26
      6.3.4   Interchange type and wrong-way driving _____________________________________________     27
      6.3.5   Countermeasures ________________________________________________________________         27
7     Road safety and congestion on motorways _____________________________________ 29
8     Managed (urban) motorways ________________________________________________ 30
    8.1   Intelligence elements _________________________________________________________ 31
    8.2   Control elements ____________________________________________________________ 32
    8.3   Information elements _________________________________________________________ 33
    8.4   Hard shoulder running (or "plus lane") _________________________________________ 35
References __________________________________________________________________ 36

                                                  -2-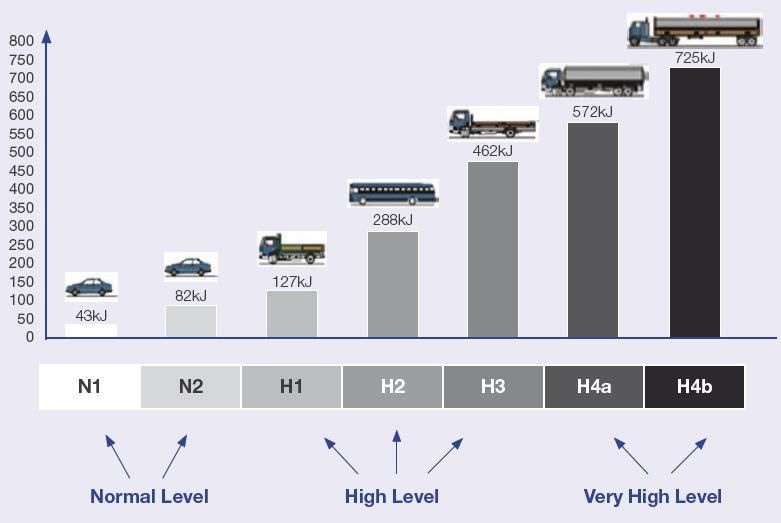
Motorways

1 Overview
What is a motorway?
A motorway is a road, specially designed and built for motor traffic, which does not serve
properties bordering on it, and which: a) is provided, except at special points or temporarily, with
separate carriageways for traffic in two directions, separated from each other, either by a
dividing strip not intended for traffic, or exceptionally by other means; b) has no crossings at the
same level with any road, railway or tramway track, or footpath; c) is especially sign-posted as
a motorway and is reserved for specific categories of road motor vehicles.

Motorway design principles
Although motorway design requirements differ among countries, there are several design
principles that are more or less similar in EU countries and internationally, and distinguish
motorways from other road types. These include:
- A typical design speed in the range of 100-130Km/h.
- Minimum values for horizontal curve radii around 750m to 900m.
- Maximum longitudinal gradients typically not exceeding 4% to 5%.
- Cross sections incorporating a minimum of two through-traffic lanes for each direction of
    travel, with a typical width of 3,50m to 3,75m each, separated by a central median.
- An obstacle free zone varying from 4,5m to 10m, or alternatively installation of appropriate
    vehicle restraint systems.
- Proper design of grade - separated interchanges to provide for the movement of traffic
    between two or more roadways on different levels.
- More frequent (compared to other road types) construction of tunnels, requiring complex
    equipment and methods of operation.
- Installation of highly efficient road equipment and traffic control devices.

Safety benefits of motorways
Motorways exhibit much lower accident rates (injury accidents per million vehicle kilometres)
than other road types. Studies comparing motorways to standard rural and urban roads indicate
50% to 90% lower accident rates for motorways. Before and after studies indicate that when a
new motorway is constructed, the resulting reduction in the number of accidents is not that large:
an average decrease in the number of injury accidents of around 7% has been identified. This
can be justified considering firstly, that not all traffic using the existing roads transfers to the
new motorway, and secondly that the construction of a motorway often generates new traffic.

Specific motorway characteristics also exhibit important road safety benefits: Central medians
(with or without barriers) have been found to reduce accident rates in most situations, however,
the relevant study results are not consistent. As a general observation, medians affect the
distribution of accidents by type: reduced numbers of head-on collisions have been reported, but
often increased numbers of less severe accidents can also be expected. Replacing at-grade
intersections with grade separated interchanges is related to a reduction in the number of
accidents in the range of -15% to -57%. Finally, access restriction on motorways is also related
to reduced accident rates.

                                                -3-
Motorways

Motorway accidents
Although motorways exhibit reduced accident rates compared to other road types, accidents still
occur, and, due to high vehicle speeds, these accidents tend to be more severe. Three types of
accidents on motorways are of particular interest: (a) accidents caused by the improper use of
emergency lanes, (b) cross-median head-on accidents, and (c) accidents involving driving on the
wrong direction.

An investigation of accidents involving vehicles using the emergency lane in the UK came to the
conclusion that the severity of these accidents was three times higher than the severity of other
accidents on motorways. Respective countermeasures include the installation of rumble strips,
the widening of emergency lanes, information campaigns on the use of emergency lanes on
motorways, and installation of lighting.

Head-on cross-median accidents typically occur when a vehicle crosses the median and crashes
with a vehicle travelling in the opposite direction, and they are usually very severe in nature. In
order to reduce cross-median fatalities, engineering, enforcement and education measures are
proposed with the following objectives: (1) to keep vehicles from departing the travelled way, (2)
to minimize the likelihood of head-on accidents with an oncoming vehicle, (3) to reduce the
severity of median-barrier accidents that occur, (4) to enhance enforcement and awareness of
traffic regulations, and (5) to improve coordination of agency safety initiatives.

Wrong way accidents are caused by drivers travelling on the wrong direction on the motorway.
The causes of wrong-way driving vary from inattention and unintentional error (mostly from
senior drivers) to driving under the influence of alcohol or drugs and committing intentional
offences in order to correct a previous mistake, e.g. missing an exit road (mostly from young
drivers). Common countermeasures for wrong-way driving include engineering (signage,
pavement marking, roadway geometry, and ITS), education (training), and enforcement
(emergency response, confinement, and radio messages).

Managed (urban) motorways
The future of motorways is possibly related to actively managed motorways, i.e. urban
motorways that have intelligent information, communications and control systems (ITS tools)
incorporated in and alongside the road. These include coordinated on‐ramp signalling, variable
speed limits, lane control, incident detection and traffic flow data, traveller information and
closed circuit television surveillance. A further typical characteristic of managed motorways is
hard shoulder running. Managed motorways increase journey reliability and throughput of a
motorway through speed management and increase capacity by shoulder running.

                                               -4-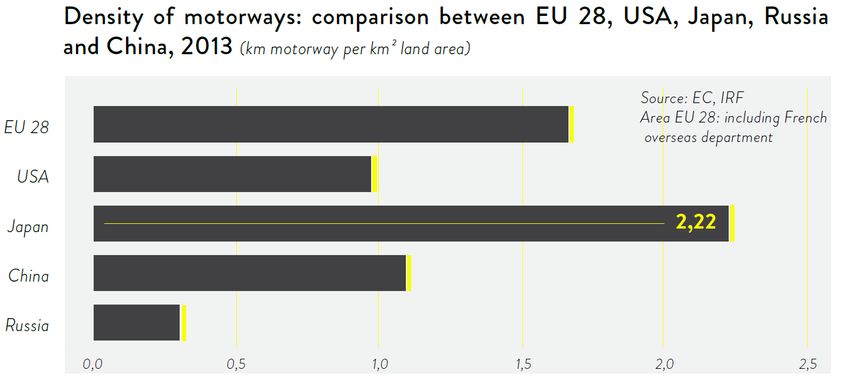
Motorways
2 Definition
A motorway can be briefly described as a type of road that accommodates high-speed vehicular
traffic, with divided directions of travel and controlled access for traffic at selected locations
only. Other terms that are frequently used instead of motorway are: freeway, expressway and
controlled access highway. Motorways are typically designed with high standards, usually have
wide lanes and hard shoulders, are often equipped with road lighting, especially at interchanges,
and are maintained according to high standards.
A more detailed definition according to the Vienna Convention on Road Signs and Signals (UNECE,
1968) and adopted by the European Commission (European Commission, 2003) and the UN
Economic Commission for Europe (EUROSTAT - ITF - UNECE, 2009) is the following:
"Road, specially designed and built for motor traffic, which does not serve properties bordering
on it, and which:
a) is provided, except at special points or temporarily, with separate carriageways for traffic in
two directions, separated from each other, either by a dividing strip not intended for traffic,
or exceptionally by other means;
b) has no crossings at the same level with any road, railway or tramway track, or footpath;
c) is especially sign-posted as a motorway and is reserved for specific categories of road motor
vehicles.
Entry and exit lanes of motorways are included irrespective of the location of the sign-posts.
Urban motorways are also included."
Many European countries use the above motorway definition; however, different national
definitions of motorways can be found in different countries (see Box 1).
Box 1: Different national definitions of "Motorway"
Germany: Roads with two directions of travel and more than one lane that serve only high speed vehicular
traffic (FGSV, 2008).
USA: A multilane, divided highway with a minimum of two lanes for the exclusive use of traffic in each
direction and full control of access without traffic interruption (AASHTO, 2010).
Australia: A divided highway for through traffic with no access for traffic between interchanges and with
grade separation at some interchanges. Certain activities or uses may be restricted or prohibited by legislative
provision (Austroads, 2015a).
Regardless of the exact definition, the basic characteristics that distinguish motorways from
other road types are more or less common:
Motorways serve exclusively motorised traffic.
Motorways have separate carriageways for the two directions of traffic.
Motorways are not crossed at the same level by other roads, footpaths, railways etc. Traffic
entrance and exit is performed at interchanges only.
Motorways have no access for traffic between interchanges and do not provide access to
adjacent land.
-5-Motorways
Motorways are especially sign-posted.
In countries that follow the Vienna Convention on Road Signs and Signals (UNECE, 1968)
motorways are sign-posted as in Figure 1 (dimensions and layout vary between countries), and
the motorway qualification implies they are forbidden for walking or parking, and reserved for
the use of motorized vehicles only.
Figure 1: Motorway signs
Regarding road function (see also ERSO Traffic Safety Synthesis on Roads), motorways serve
exclusively the function of flow (Wegman & Aarts, 2005). They allow for efficient throughput of,
usually long distance, motorized traffic, with unhindered flow of traffic, no traffic signals, at-
grade intersections or property access and elimination of conflicts with other directions of traffic,
thus, dramatically improving both safety and capacity.
Speed limits on motorways in IRTAD countries (OECD/ITF, 2015) vary from 90Km/h to 140Km/h,
with the exception of Germany, where there is only a recommended limit of 130Km/h (see Table
1).
Table 1: Speed limits on motorways
Country Speed Limit Country Speed Limit Country Speed Limit
Argentina 130Km/h Hungary 130Km/h Nigeria 100Km/h
Australia 110Km/h Ireland 120Km/h Norway 90-110Km/h
Austria 130Km/h Israel 110Km/h Poland 140Km/h
130Km/h
Belgium 120Km/h Italy (110Km/h in wet Portugal 120Km/h
conditions)
Canada 100-110Km/h Japan 100Km/h Serbia 120Km/h
Chile 120Km/h Korea 100-110Km/h Slovenia 130Km/h
120-130Km/h
Czech
130Km/h Lithuania (110Km/h in Spain 120Km/h
Republic
winter)
130Km/h
Denmark 110-130Km/h Luxembourg (110Km/h in wet Sweden 110-120Km/h
conditions)
Finland 100-120Km/h Malaysia 110Km/h Switzerland 120Km/h
130Km/h
United 70mph
France (110Km/h in wet Morocco 120Km/h
Kingdom (113Km/h)
conditions)
Germany no limit Netherlands 130Km/h 55-80mph (88-
United States 129Km/h) set by
Greece 130Km/h New Zealand 100Km/h
each state
Source: OECD/ITF, 2015
-6-Motorways
3 Motorway network in Europe
During the last decades, many European countries, in order to improve their road infrastructure,
have invested in the construction of motorways and/or the upgrade of existing roads to
motorways. The total length of motorways in EU-28 at the end of 2015 has been estimated at
75.820Km (European Commission, 2017a). A detailed presentation of the size and growth of the
European network of motorways since 1990 is presented in Table 2.
Table 2: Length of motorways in Europe (km)
1990 1995 2000 2005 2010 2015
EU-28 42.207 48.297 55.116 63.140 71.092 75.820
EU-15 39.647 45.493 51.476 57.901 64.143 66.816
EU-13 2.560 2.804 3.640 5.239 6.949 8.974
BE 1.666 1.666 1.702 1.747 1.763 1.763
BG 273 277 319 331 437 734
CZ 357 414 501 564 734 776
DK 611 796 923 1.032 1.130 1.237
DE 10.854 11.190 11.712 12.363 12.819 12.993
EE 41 65 93 99 115 147
IE 26 70 103 247 900 916
EL 190 421 615 917 1.558 1.589
ES 4.976 6.962 9.049 11.432 14.262 15.336
FR 6.824 8.275 9.766 10.798 11.392 11.599
HR 291 302 411 1.016 1.244 1.310
IT 6.193 6.435 6.478 6.542 6.668 6.943
CY 120 167 257 276 257 272
LV - - - - - -
LT 421 .394 417 417 309 309
LU 78 123 114 147 152 131
HU 267 335 448 859 1.477 1.884
MT - - - - - -
NL 2.092 2.208 2.265 2.600 2.651 2.756
AT 1.445 1.596 1.633 1.677 1.719 1.719
PL 257 246 358 552 857 1.559
PT 316 687 1482 2.341 2.737 3.065
RO 113 113 113 228 332 747
SI 228 293 427 569 771 773
SK 192 198 296 328 416 463
FI 225 394 549 693 779 881
SE 939 1.262 1.499 1.700 1.927 2.119
UK 3.212 3.408 3.586 3.665 3.686 3.769
Source: European Commission, 2017a
In Figure 2, the density of motorways (Km of motorway per 100Km2 of land area) is presented
comparatively for EU-28, USA, Japan, Russia and China (2013 data).
-7-Motorways
Figure 2: Comparative density of motorways in 2013 (Km of motorway per 100Km2 of land area)
Source: ERF, 2017
4 Motorway design principles
European countries have developed road design guidelines independently from each other;
therefore, the design guidelines for motorways also differ among EU countries. There are
however, several design principles that are more or less similar in EU countries and
internationally, and distinguish motorways from other road types (AASHTO, 2011; DHV, 2005;
FGSV, 2008).
4.1 Design speed and alignment
Motorways are generally designed for high volume and high speed operation; therefore, they are
characterized by smooth horizontal and vertical alignment. Minimum radii of horizontal and
vertical curves are usually calculated assuming a design speed of 80 to 130Km/h. Specifically:
A design speed of 120Km/h is normally used in the Netherlands for Type I motorways (DHV,
2005).
Design speeds of 120Km/h to 130Km/h are typically used in Germany (FGSV, 2008) for EKA
1 A and EKA 1 B rural motorways respectively, and 80Km/h for EKA 3 urban motorways.
Design speeds of 100Km/h to 130Km/h are typically used in Greece.
Design speed of 110Km/h is normally assumed for rural freeways in the US (AASHTO, 2014),
reduced to 80-100Km/h for mountainous terrain.
Typical minimum values for horizontal curve radii are around 750m to 900m, in accordance to
the assumed design speed and differences among countries, and longitudinal gradients typically
do not exceed 4% to 5%. Sight distance requirements also necessitate long and smooth vertical
curves, with minimum values for vertical curve radii around 10.000m to 13.000m for crest
curves and 6.000m to 9.000m for sag curves.
-8-Motorways
4.2 Cross-sections
The basic issues to be considered for the dimensioning of motorways' cross sections are the
following (FGSV, 2008):
Traffic safety;
Traffic flow and level of service;
Requirements for construction, operation and maintenance of the motorway.
Normally, typical cross sections are defined based on the predicted traffic volumes and the
required level of service. Furthermore, the consistency between cross sections in different but
successive sections of the motorway should be considered, in order to achieve uniformity in the
design and to ensure that transition sections are safe and properly understood by drivers.
For urban motorways, a further consideration is the adaptation of the cross section and the
project in general with the surrounding urban environment, taking into account roadside growth,
motorway level compared to the city level, construction cost and type of sound barriers (FGSV,
2008).
Normally, motorways have a minimum of two through-traffic lanes for each direction of travel,
with a typical width of 3,50m to 3,75m each. A central median serves to separate opposite
directions of travel and also allows for the installation of suitable road equipment, such as safety
barriers, sign bridge posts, lighting posts, traffic signs, drainage systems, anti-glare equipment,
etc. Paved shoulders and emergency lanes should be continuous on the side of motorway
facilities.
4.3 Roadside
Roadside hazards pose a major risk to the occupants of vehicles which run off the road.
Especially on motorways, where vehicle speed is high, accidents that involve running into
roadside hazards tend to be more severe. In 80 km/h speed limits, 1 in 25 recorded run-off-road
casualty accidents will be fatal. In 110 km/h speed limits, 1 in 15 will result in a fatality
(Austroads, 2015b).
In reducing the number of single vehicle run-off-road accidents, the following objectives can be
identified (DHV, 2005):
preventing drivers running off the road;
when a driver runs off the road, minimise the risk of accident;
in case of an impact, reduce the severity of the accident.
In order to improve roadside safety, the most desirable alternative is a shoulder without
obstacles (and without vehicle restraint system). A shoulder with safe slopes and a shoulder with
fixed objects that yield easily upon collision (i.e. passively safe equipment) are also good
solutions. If these solutions are not feasible, an effectively functioning vehicle restraint system
(safety barrier) is the only remaining alternative (SWOV, 2002; DHV, 2005; Austroads, 2014a;
Austroads, 2015b).
-9-Motorways
According to the design standards of various European countries, the width of obstacle free zone
on motorways varies from 4.5m to more than 10m (SWOV, 2002). DHV (2005) suggests that at
a speed of approximately 100 km/h, 80% to 90% of vehicles that run off road penetrate the
shoulder no further than approximately 10m.
Vehicle restraint systems for motorways are further presented in Section 4.6 of this report.
4.4 Interchanges
The ability to accommodate high volumes of traffic safely and efficiently depends largely on the
arrangements provided for handling intersecting traffic (AASHTO, 2011). The greatest efficiency,
safety, and capacity are attained when the intersecting travelled ways are grade separated. An
interchange is a system of interconnecting roadways in conjunction with one or more grade
separations that provides for the movement of traffic between two or more roadways or
highways at different levels. Motorways include only grade-separated interchanges.
Interchanges may vary from single ramps connecting local streets to complex and
comprehensive layouts involving two or more highways and two, three or even more levels. The
basic interchange configurations are shown in Figure 3.
- 10 -Motorways
Figure 3: Basic Interchange configurations
Source: AASHTO, 2011.
For a safe traffic operation of interchanges, drivers should be clearly and timely prepared for
the required change in driving behaviour (FGSV, 2008). Interchange design should focus on a
gradual change in driving behaviour in order to adapt to the modified characteristics of the
interchange ramps and to gradually reduce speed. Therefore, interchange design elements
should be easily recognisable by drivers, proper warning signage should be installed, adequate
level of service should be provided and traffic safety should always be a priority.
4.5 Tunnels
The alignment requirements of motorways imposed by the aim to safely accommodate high
speed traffic often result in the construction of tunnels in order to cross obstacles (most
commonly a mountain, but also rivers, canals or densely populated areas). Another issue
favouring the construction of tunnels has been the increased demand for environmental
- 11 -Motorways
protection from traffic, including landscape aesthetics and protection from noise and air pollution
produced by large traffic streams.
Tunnels are very complex road structures, incorporating increasingly complex equipment and
methods of operation that require the deployment of control and supervision systems to handle
large amounts of information and accommodate sophisticated management scenarios.
An indicative list of various interacting parameters that need to be considered during tunnel
design are (PIARC, 2015):
urban or non-urban environment,
geology and hydrogeology,
human and natural environmental issues,
traffic characteristics,
costs (construction and operation)
operational issues,
horizontal and vertical alignment,
cross section,
safety issues,
ventilation,
civil works issues, etc.
The complexity of tunnel design means in particular that approaching the design from a single
point of view (e.g. only the alignment, the geology or operating equipment) will most likely result
to a less safe infrastructure which is also difficult to operate (PIARC, 2015). All the objectives
and constraints relating to operation and maintenance must be taken into account from the
preliminary design stage in order to avoid increased operational costs and reduced overall
reliability.
Tunnel design and operation in Europe is largely determined by the recommendations of
Directive 2004/54/EC of the European Parliament and of the Council (EU, 2004), on the minimum
safety requirements for tunnels in the Trans-European Road Network. The Directive includes
specific considerations for the design, management and operation of motorway tunnels, aiming
to prevent critical events that may endanger human life, the environment and tunnel
installations, as well as by the provision of protection in case of accidents.
4.5.1 Horizontal and vertical alignment
The horizontal and vertical alignment of motorways inside tunnels is subject to additional
constraints compared to open roads.
Although several restrictions in tunnels may force designers to apply smaller horizontal curve
radii, from a road safety point of view, this should be avoided. In tunnels, it is more difficult for
the driver to detect curves, accurately estimate curvature and therefore, adjust driving speed
accordingly. Furthermore, in the case of a small radius curve on an open road motorway segment,
the designer has several tools to inform drivers. However, these tools are not feasible in tunnels
(SWOV, 2002).
Geometric characteristics of the horizontal and vertical alignment in tunnels need to integrate
the following elements (PIARC, 2015):
- 12 -Motorways
limitation of gradients, which have a major impact on traffic capacity of the tunnel as well
as sizing of the ventilation system,
hydraulic conditions of underground drainage during construction and operation speed,
reduced lateral clearance, requiring sight distance analysis and particular consideration of
horizontal curve radii,
appropriate choice of radii in order to avoid alternating cross-fall slopes and their impact on
water collecting and drainage systems and possible interference with other tunnel
equipment.
In EU Directive 2004/54/EC, a maximum gradient of 5% is allowed for tunnels.
An additional important consideration for tunnel design is sight distance. Because of ceiling and
walls, sight distances in tunnels are limited in comparison to open road segments. A limited sight
distance in motorway tunnels can partly be compensated by supplying the driver with
information concerning the current traffic situation in the tunnel, by means of Variable Message
Signs (VMS), Lane Control Signs (LCS), Variable Speed Limit Signs (VSLS) and other means of
tunnel dynamic signage. The tunnel operator can use information obtained from CCTV and traffic
flow measurements to decide on the contents of the messages to the drivers (SWOV, 2002).
4.5.2 Cross section
The shape of tunnel cross section is basically determined by the construction method. A circular
cross section is the result of the use of Tunnel Boring Machines (TBM). A horse-shoe shaped
tunnel is typical for drill and blast and a square cross section is found in cut-and-cover tunnels
(SWOV, 2002).
Dimensioning of the cross section relies to the following parameters (PIARC, 2015):
traffic volume, nature of traffic and urban / non-urban tunnel, in order to determine:
- number and width of lanes,
- headroom (according to type of vehicles),
- hard shoulders, emergency lanes, lay-bys.
ventilation (taking into account the space required for ventilation ducts, fans and other
equipment),
evacuation of users and access of emergency and rescue teams,
length and gradient of the tunnel,
networks and equipment for operation (e.g. sewer systems, water supply for the fire-fighting
system, high and medium voltage cables, operation signalling equipment)
construction methods and geological conditions.
Very often tunnel designers aim to minimise the area of the cross section in order to reduce
construction cost, resulting in many cases in the absence of emergency lanes. In a simulator
study (Martens et al., 1998), driver behaviour of subjects over the transition from a wide cross
section into a smaller one was studied in open road conditions (control) and tunnel conditions
(experimental). Driving behaviour was expressed in terms of speed and of distance between the
right road edge line marker and the right side of the car. The experiment revealed that lateral
width per se influences driving behaviour and that this effect is stronger in a tunnel. However,
the effects on lateral position and speed were found to be relatively small. The authors
recommended not to omit the emergency lane in tunnels, and in cases where this is not possible,
- 13 -Motorways
to include a narrow emergency lane of 1,50m in order to mitigate the negative effects on road
capacity and traffic safety.
4.5.3 Safety and operatio n
The following parameters have a major impact on tunnel safety and operation (PIARC, 2015):
Volume and nature of traffic: As previously stated, traffic volume affects the number of
lanes, ventilation and evacuation. It also affects the impact of breakdown vehicles and their
management: requirement for an emergency stopping lane, for lay-bys and organisation of
particular provisions for repair service. The nature of traffic and type of vehicles affect the
evacuation concept (cross-passages, evacuation galleries dimensioning and spacing), according
to the expected number of people to be evacuated. Finally, the transfer or not of dangerous
goods has an important impact on the ventilation system, on cross section design to
accommodate fluid collection and dewatering measures, on diversion routes, on the protection
of structures against a major fire, as well as the organisation of emergency services and
especially the fire brigade.
Evacuation of users and access of emergency teams: The design of the evacuation system
(exits to the outside, cross-passages, under or parallel gallery, shelters or temporary refuges
etc.) requires an integrated approach with the ventilation design, volume of traffic, risk analysis,
drafting of emergency response plan and construction methods. It is necessary to define the
routes in order to ensure the flow of people and to ensure the homogeneity, legibility and calming
character of these facilities, taking into account that they will be used by people in stress
situations (accident, fire) before the arrival of the emergency services.
Ventilation: Ventilation facilities are essentially designed in order to provide healthy conditions
inside the tunnel by the dilution of air pollution and to ensure safety in case of fire by providing
efficient smoke extraction. They have to be able to adapt in a dynamic and fast way to numerous
conditions in order to address climatic constraints (significant and fluctuating air pressure
differentials between tunnel portals) and provide variable operating rates for smoke
management in case of fire, according to the development of fire, in order to assist fire-fighting
strategies and tunnel evacuation.
Communication with users and tunnel supervision system: Communication with users and
supervision has an important impact on tunnel cross section design, as well as on the operating
equipment - remote monitoring, detection, communications, traffic management, control and
supervision - and the organisation of evacuation.
4.6 Motorway equipment and traffic control devices
Due to the high operating speeds, safe motorway operation requires the installation of highly
efficient road equipment and traffic control devices. Specifically:
Road markings: Motorway pavements are fully marked in order to efficiently guide road users.
A fundamental requirement for pavement markings is visibility during daylight, at night time and
in wet conditions. Night-time visibility is of outmost importance, because during the day, drivers
also have other visual clues for optical guidance. Road markings in motorways should be visible
from a minimum distance of 75m to 100m (FGSV, 2008). Further optical guidance, wherever
- 14 -Motorways
required, can be achieved by installing reflective markers on guardrails or posts, or arrow signs
in curves.
Previous research (NCHRP, 2006) in the state of California USA, however, investigating the safety
effect of the retro-reflectivity of pavement markings and markers, was not able to identify a
clear relation. One hypothesis is that drivers compensate by reducing their speed under lower
visibility conditions, and maintain higher speeds under higher visibility conditions. Therefore, any
effect of the level of brightness of pavement markings may be minimized by driver adaptation
to road conditions.
Traffic Signs: Dimensioning and layout of traffic signs on motorways is determined according
to the traffic sign regulation of each country. As a general observation, traffic signs should be
installed only when required. Traffic restriction and warning signs in particular, should be used
only when specific local conditions indicate an increased risk, such as (FGSV, 2008):
occurrence of traffic merging and/ or diversion in relatively small length of the motorway,
densely spaced entrance and exit ramps,
implementation of minimum design values in horizontal and/or vertical alignment, in
otherwise smoothly flowing designs,
record of increased accident rates in a specific section of the motorway.
Informative signs are also of particular importance. A proper balance is required between
presenting detailed direction information and not overloading drivers. During high speed driving
only a limited amount of data can be realized and processed by drivers; excessive signage may
result in driver overload and distraction and ultimately may deteriorate road safety.
Vehicle restraint systems: Vehicle restraint systems on motorways (safety barriers and
guardrails) aim to mitigate accident consequences, both for road users not involved in the
accident (e.g. opposite direction traffic flow) and for vehicle occupants (e.g. prevent a head-on
crash to rigid roadside obstacles). Prior to the installation of vehicle restraint systems, it should
always be investigated if the roadside can be redesigned and potentially dangerous obstacles
can be removed.
As of January 1st 2011, all vehicle restraint systems in the EU (including for motorways) need
to be certified according to the European Norm EN1317, which specifies common requirements
for the testing and certification of such systems. It should, however, be noted that EN1317 does
not specify which barrier should be used in each specific case, but it defines the test procedures
for classification of the performance and other parameters of each product.
According to EN1317, vehicle restraint systems are classified according to three performance
classes: containment level, impact severity and working width. Containment level refers to
vehicle type, impact speed and impact angle for the product's crash tests, impact severity to the
degree of physical strain on the passengers and working width to the physical deformation of
the restraint system.
A graphical representation of the various containment levels, according to crash tests' vehicle
type, as specified in the norm EN 1317, is shown in Figure 4:
- 15 -Motorways
Figure 4: Containment level of Vehicle Restraint Systems according to norm EN1317
Source: ERF, 2012
Minimum legal requirements for the containment level of safety barriers on motorways differ
among EU countries (see Table 3).
Table 3: Minimum legal requirements for the containment level of safety barriers on motorways
Side barrier (except
Country Central median barrier Side barrier on bridges
walls & bridges)
Austria H2 H2 H3
Belgium H2 H2 H4b
Denmark H1 H2 H3
Finland N2 N2 H2
France N2 H1 N2
Germany H2 H2 H4b
Ireland N2 H2 H2
Italy H2 H3 H4b
Netherlands H2 H2 H2
Norway N2 N2 H2
Spain H1 H2 H3
UK N2 N2 H1
Source: ERF, 2012
A general distinction can be made between rigid vehicle restraint systems (e.g. concrete safety
barriers) and flexible systems, such as metal barriers. Rigid systems have the advantage of
requiring less space for installation (because they normally do not deform during the impact)
- 16 -Motorways
and usually cost less to repair after an accident. However, the degree of physical strain to vehicle
occupants, especially in passenger cars, is greater in comparison to flexible systems.
Anti-glare panels: Anti-glare panels, typically installed between the opposite directions of
traffic, serve to protect drivers from the glare of vehicle headlights or from other sources of
light. They are commonly installed in the following cases (FGSV, 2008):
on motorway sections with alignment that allows glare, e.g. in crest vertical curves, in
horizontal curves combined with sag vertical curves, or in sections with different roadway
elevations between the opposite directions of travel,
on motorway sections with high accident rates during night-time,
on sections with high night-time traffic volumes,
on long tangent sections, bridges and rest areas,
at grade-separated intersections with small distance between the ramps and the main
motorway.
Motorway fencing: Fencing aims to prevent wildlife from entering the motorway, in order to
protect both road users and animals.
Electronic traffic control devices:
The safe operation of motorways is enhanced by a large number of electronic equipment and
devices, such as:
emergency phone network, enabling road users to communicate with the motorway operator,
Closed Circuit TV (CCTV), for the surveillance of the motorway and the identification of
various incidents,
Variable Message Signs (VMS), enabling the motorway operator to inform road users on
various safety related issues (e.g. roadworks, incidents etc.)
Variable Speed Limit Signs (VSLS), enabling the motorway operator to reduce the speed limit
according to traffic conditions or other incidents,
Over-Height Vehicle Detection (OHVD), to identify and stop vehicles exceeding the maximum
permissible height, in order to prevent damage to motorway tunnels and other overhead
structures, etc.
A more detailed overview of the above elements on the context of managed (urban) motorways
can be found in Section 8 of the present report.
5 Safety benefits of motorways
5.1 Construction of motorways
Motorways exhibit much lower accident rates (injury accidents per million vehicle kilometre) than
other road types. A meta-analysis of relevant studies in Norway by Elvik et al. (2009) concluded
that accident rates on motorways in Norway were 50% to 81% (according to the examined study
and time period) less than on two-lane rural roads. Studies in other European countries (Sweden,
Denmark, Finland, UK, Germany, the Netherlands) and USA, also compiled by Elvik et al. (2009),
indicate a 70% to 90% lower accident rate in motorways, compared to standard country roads
and urban roads.
- 17 -Motorways
Box 2: High proportion of traffic on motorways in the Netherlands influences road fatality rates
An intensive period of motorway building during 1970s and 1980s in the Netherlands has resulted in 40% of
the national total of vehicle kilometres being travelled on motorways, which have low fatality rates compared
with other rural roads. The respective percentage is 20% in Britain and 14% in Sweden. This high usage is
encouraged by both the high density of the motorway network and the high population density. The density of
the motorway network in the Netherlands is four times that in Britain and 18 times that in Sweden. Population
density in the Netherlands is, on average, about 60% higher than in Britain and almost 20 times that in Sweden.
Source: Koornstra et al., 2002
Before and after studies indicate that when a new motorway is constructed, the resulting
reduction in the number of accidents is not as large as the difference in accident rates might
lead one to expect (Elvik et al., 2009). Such studies in Norway (1993), Sweden (1983 & 1991),
Denmark (1991), Great Britain (1964 & 1969) and USA (1970 & 1992) have found an average
decrease in the number of injury accidents of around 7% (95% confidence intervals: 4% to 9%).
This can be explained (Elvik et al., 2009) considering firstly, that not all traffic using the existing
roads transfers to the new motorway, and secondly, that the construction of a motorway often
generates new traffic, especially when the existing roads had traffic congestion problems.
Generally speaking, the extent of accident reduction that can be attributed to the construction
of motorways depends to some extent on how existing traffic is distributed between the
motorway and the old road network, and on how large the induced traffic is.
5.2 Other motorway characteristics
In addition to the general safety benefits of motorway construction, it is interesting to examine
the safety benefits of specific motorway characteristics, not normally found in other road types,
such as the existence of central medians, of grade-separated junctions, access control etc.
5.2.1 Central medians
Medians have been found to reduce accident rates in most situations, with the effect being more
pronounced for the most severe accidents. However, in most studies, especially for rural areas,
results are inconsistent, either affected by publication bias or by confounding variables which
are not controlled for (Elvik et al., 2009). As a general observation, medians (with or without
safety barriers) increase the distance between opposing traffic flows and as a result change the
distribution of accidents by type: reduced numbers of head-on collisions have been reported, but
often increased numbers of less severe accidents can also be expected (Elvik et al., 2009;
Machata et al., 2017).
5.2.2 Grade-separated junctions
Besides being able to serve large traffic volumes, grade-separated junctions (interchanges)
exhibit lower accident rates compared to at-grade intersections. A relevant meta-analysis by
Elvik et al. (2009) compared the results of several studies on European countries and estimated
the effects of replacing three-legged intersections (T-junctions) and four-legged intersections
(X-junctions) by grade-separated interchanges. The results (Table 4) indicate a reduction in the
number of accidents in all cases, with the only exception of partly grade-separated junctions (i.e.
where there is no at-grade connection between the two intersecting roads, but the connections
between ramps and roads are at-grade, instead of acceleration/deceleration lanes) replacing at-
grade X-junctions with speed cameras.
- 18 -Motorways
Table 4: Safety effect of replacing at-grade junctions by grade-separated intersections
Source: Elvik et al. (2009)
Regarding the effect of different interchange types (see also Section 4.4), lower accident rates
have been identified in diamond interchanges than most other types of interchanges (Elvik et al.,
2009). However, differences are small and usually not statistically significant. This can be
attributed to the simple geometric layout that is recognizable and easily understood by drivers,
as well as to the straight alignment of interchange ramps, that naturally exhibit lower accident
rates compared to the curved ramps of other interchange designs (trumpet, cloverleaf etc.)
5.2.3 Access control
Accident rates have been found to significantly increase with increasing numbers of private
access roads per kilometre of road. Studies in Norway have proposed a relationship between the
number of private access roads per kilometre of road and the accident rate as per Table 5. It is
obvious that access restriction on motorways can be considered an important factor contributing
to reduced accident rates.
- 19 -Motorways
Table 5: Relationship between accident rate on national highways and the number of private access
roads per km road in Norway
Source: Elvik et al. (2009)
5.2.4 Dynamic speed l imit s
One of the objectives of dynamic speed limits is to improve traffic safety through reductions in
mean speeds and in speed variations within and across lanes and between upstream and
downstream flows. In a study by Lee et al. (2006), a microscopic traffic simulation model was
used to simulate changes in traffic conditions as an effect of variable speed limits. The study
results indicated that variable speed limits could reduce accident rates by 5% to 17%, by
temporarily reducing speed limits during risky traffic conditions when accident potential
exceeded a pre-specified threshold. Rämä (1999) investigated the effects of weather-controlled
dynamic speed limits. The results showed that in winter the change of the posted speed limit
from 100km/h to 80km/h decreased the mean speed of cars traveling in free-flow traffic by
3,4km/h, in addition to the average mean speed reduction of 6,3km/h caused by adverse weather
and road surface conditions. When poor road conditions were difficult to detect (e.g., there was
no rain or snowfall or the rain was insignificant), the effect was 1,9km/h higher (i.e., the reduction
was 5,3km/h). In addition to the effects on mean speed, lowering of the speed limit decreased
the speed variance. De Pauw et al. (forthcoming) did a before-after analysis on the effects of a
dynamic speed limit system on the number of crashes. The results showed a significant (-18%)
decrease of the number of injury crashes after the introduction of the system. A distinction
according to crash type showed an almost significant decrease of 20% in the number of rear-
end crashes whereas the number of single-vehicle crashes decreased by 15% (not significant).
No effect was found for side crashes.
All the above research findings clearly indicate that motorways exhibit increased road safety
levels for road users.
6 Motorway Accidents
Although motorways exhibit reduced accident rates compared to other road types, accidents still
occur. Furthermore, as a result of increased vehicle speeds in motorways, accidents tend to be
more severe (see also ERSO Traffic Safety Synthesis on Speed and Speed Management).
According to the European Commission (2017), more than 24.000 people were killed in road
accidents on motorways in the European Union between 2006 and 2015. This number
- 20 -Motorways
corresponds to 7% of all road fatalities in those countries. In Table 6, the number of fatalities
on motorways by country is presented.
Table 6: Number of fatalities on motorways by country
2006 2007 2008 2009 2010 2011 2012 2013 2014 2015
BE 164 153 139 150 106 120 91 94 108 108
BG - - 38 36 - - - - - -
CZ 37 48 30 25 28 21 22 25 25 32
DK 16 24 31 24 27 12 8 12 14 16
DE 645 602 495 475 430 453 387 428 375 414
EE - - - - - - - - - -
IE 11 10 2 4 9 9 5 8 - -
EL 147 140 120 108 87 81 57 79 56 53
ES 776 618 496 465 418 341 304 294 290 277
FR 296 273 233 225 238 268 223 238 220 298
HR - 65 67 43 33 23 43 41 23 18
IT 590 526 452 350 376 338 330 321 287 305
CY 10 13 8 7 9 7 3 2 3 6
LV - - - - - - - - - -
LT - - - - - - - - - -
LU 6 11 6 36 29 4 7 6 3 3
HU 55 61 54 38 44 49 31 30 27 34
MT - - - - - - - - - -
NL - - - 83 64 43 68 59 57 81
AT 74 74 71 61 59 46 50 31 36 41
PL 55 53 35 43 28 37 44 40 56 61
PT 84 128 96 89 111 84 58 44 50 61
RO 50 41 21 25 18 16 17 24 21 19
SI 33 37 13 30 19 20 20 16 15 15
SK 15 19 14 9 14 - - - - -
FI 17 14 9 12 4 11 13 8 8 6
SE 28 25 18 21 24 20 18 21 31 -
UK 189 185 160 132 118 106 89 102 96 111
EU 3.485 3.240 2.691 2.491 2.329 2.159 1.938 1.973 1.859 2.048
Yearly
-7,0% -16,9% -7,4% -6,5% -7,3% -10,2% 1,8% -5,8% 10,2%
change
CH 31 47 27 34 23 22 63 23 12 21
Source: European Commission Traffic Safety Basic Fact on Motorways, 2017b
It is interesting to point out that the highest percentage of fatalities on European motorways
occurred in the 25-49 age group (2015 data), whereas the over 64 age group is less involved in
motorway fatalities (15%) than in non-motorway fatalities (27%).
Three types of accidents on motorways are of particular interest: (a) accidents caused by the
improper use of emergency lanes, (b) cross-median head-on accidents, and (c) accidents
involving wrong way driving.
6.1 Improper use of emergency lane
Accident statistics indicate that a sizeable percentage of accidents on European motorways is
related to emergency lanes. The cause of these accidents seems to be the inappropriate use of
- 21 -Motorways
the emergency lane and the nearside lane (SWOV, 2002). More importantly, the severity of these
accidents tends to be significantly higher than of most other accidents on motorways (see also
Box 3).
In all EU countries, traffic regulations commonly prohibit the use of emergency lanes for normal
operation and regular traffic. The purpose of emergency lanes is (a) to provide the necessary
space for emergency stop of vehicles and (b) to be used by emergency services vehicles (police,
ambulances, fire brigade).
Box 3: Severity of accidents on emergency lanes
Netherlands: Although multiple accidents on emergency lanes accounted for only 1.5% of injury accidents on
Dutch motorways (1992-1995 period), the corresponding share of fatalities was 8%.
United Kingdom: An investigation of accidents involving vehicles using motorway hard shoulders in the UK came
to the conclusion that the severity of these accidents was three times higher than the severity of other accidents
on motorways.
Source: SWOV, 2002
Vehicles stopped on the emergency lane are a potential hazard. An indication of accident risk on
motorways emergency lanes involving a stopped vehicle is the number of stopped vehicles on
emergency lanes per 100Km of motorway. A 1987 study in the Netherlands indicated a total of
4.1 vehicles per 100Km (at both sides of the motorway), while a 1997 study found a 10.9
vehicles per 100Km (SWOV, 2002). A further alarming finding of the 1987 study is that for only
3% of the vehicles stopped on emergency lanes on Dutch motorways, the warning triangle was
placed. This was attributed to insufficient knowledge of the mandatory use of the warning
triangle, unavailability of the triangle, trouble to get out of the car and place the triangle, fear
of being run over, and doubt about either the efficiency of the triangle or the necessity to warn
other users.
Measures that have been proposed in order to reduce accidents on emergency lanes are (SWOV,
2002):
installation of rumble strips on the border between the carriageway and the emergency lane,
widening of emergency lanes,
information campaigns on the use of emergency lanes on motorways,
installation of lighting on motorways, especially in sections where emergency lanes and/ or
through lanes are narrow.
- 22 -Motorways
6.2 Cross-median accidents
Head-on cross-median accidents typically occur when a vehicle crosses the median and crashes
with a vehicle travelling in the opposite direction. A head-on accident can also occur when a
vehicle inadvertently travels the wrong way in the opposing traffic lanes. The latter scenario is
examined in Section 6.3.
Head-on accidents on motorways are usually very severe in nature. According to NCHRP (2009),
in 2003, on US motorways there were 366 fatal cross-median head-on accidents, representing
approximately 8% of all fatal accidents on motorways. From 1994 to 2002, while fluctuating
annually, median-crossover and wrong-way fatalities have increased in the U.S. by 17%. In
addition, it appears that a number of cross-median fatal accidents have occurred at locations
where some type of barrier was in place.
Head-on cross-median accidents are typically the result of improper driver actions, commonly in
combination with other adverse circumstances, such as weather conditions or motorist fatigue.
Donnell et al. (2002) identified the following as major contributory factors for median-barrier
accidents occurring on Pennsylvania Interstate highways: improper lane changes, driver losing
control of vehicle, travelling too fast for weather conditions, exceeding the posted speed limit,
and forced vehicle movement or avoidance manoeuvres. According to NCHRP (2009), "the
predominant geometric feature associated with such crashes is the median, including its width
as well as the presence (or absence) of a barrier or similar device, and proximity to interchanges.
There is evidence that such crashes are associated with high-risk driver behaviors, including
excessive speeding and erratic manoeuvres".
Box 4: Cross-median accidents in the US
- There is one cross-median fatality annually for about every 200 freeway miles.
- An average of 250 people are killed annually in freeway cross-median accidents.
- Cross-median accidents are three times more severe than other highway crashes.
- According to 2003 FARS data, 56 percent of these accidents occur on urban Interstates/ freeways and 44
percent occur on rural Interstates.
Sources: NCHRP, 2009; Stasberg & Crawley, 2005.
Recent experience and research has shown that a comprehensive approach to safety is most
effective in creating a safer driving environment and improved effectiveness of safety
treatments. Within this context, the following objectives for reducing the number of fatal head-
on accidents on motorways have been defined (NCHRP, 2009):
1. Keep vehicles from departing the travelled way
This objective assumes that a vehicle has not left the road and is on the travel lanes or about to
stray out of a lane into the median. The proposed strategies include:
i. Installation of left shoulder rumble strips.
ii. Provision of enhanced pavement markings and median delineation.
iii. Provision of improved pavement surfaces.
The strategies involve either keeping the vehicle on a travel lane through enhanced traffic control
devices that engage the driver’s attention or by the installation of improved pavement capability
to reduce skidding and reduce the potential of leaving the roadway. In addition, if a driver strays
- 23 -Motorways
from the road, the provision of left median shoulder rumble strips aims to give an audible alert
to the driver so that it is possible to regain control.
2. Minimize the likelihood of head-on accidents with an oncoming vehicle
This objective considers the situation in which the vehicle has already left the lane and is in the
median. The proposed strategies include:
i. Provision of wider medians.
ii. Improvement of median design for vehicle recovery, including improvement of pavement
edge drop-offs, provision of paved median shoulder and design for safer slopes.
iii. Installation of median barriers for narrow-width medians.
iv. Implementation of channelization, signing and striping improvements at interchanges
susceptible to wrong-way movements.
The aforementioned strategies involve preventing the vehicle from crossing over into the
opposite direction of travel, and helping to redirect the vehicle in the direction of flow. The
objective is not the prevention of an accident, since the vehicle has already left the travelled
way, but minimizing the potential of a severe head-on accident. Central to the objective is
utilization of the median. There are several principal purposes and advantages in providing
a median. Medians separate opposing traffic streams, provide a recovery area for out-of-
control vehicles, and provide a place for vehicles to stop in the event of an emergency. In
addition, some medians and median barriers can potentially reduce oncoming headlight glare
from vehicles.
3. Reduce the severity of median-barrier crashes that occur
This objective includes a strategy, namely the improvement of design and application of barrier
and attenuation systems, aiming at the likelihood of reducing the severity of the accident rather
than preventing it.
4. Enhance enforcement and awareness of traffic regulations
This objective includes the following strategies:
i. Designate “Highway Safety Corridors”.
ii. Conduct public information & education campaigns.
In some cases, cross-median collisions are symptoms of problems unique to a specific motorway
corridor or location. Evidence of this may come from a review of the traffic volume and geometry
of the problem corridor compared to other similar locations in the state. Understanding why one
corridor experiences cross-median collisions when other comparable roadways do not, may
require more in-depth study but such an effort may lead to more effective and less costly
solutions than, for example, median barrier placement. The reasons may relate to their location,
climate, the local driving population, or other factors not directly related to roadway design. One
strategy that may be considered to address these roadways is to designate the facility as a
“Highway Safety Corridor,” and apply more frequent enforcement, low-cost engineering
improvements, and education efforts to enhance safety along the corridor.
Also, like many other safety problems, the problem of cross-median accidents can be effectively
enhanced with a properly designed public information & education campaign, through television,
radio, local newspapers or the internet.
- 24 -Motorways
5. Improve coordination of agency safety initiatives
In order to plan efficient safety measures, accurate accident data along with periodic updating
are required. Updated information regarding the geometric conditions of the roadway is essential
and the following criteria have been specified as important for assessing the quality of accident
information: timeliness, consistency, completeness, accuracy, accessibility and data integration.
6.3 Wrong-way driving accidents
A wrong-way accident is defined as a traffic accident caused by a wrong-way driver, who is a
driver travelling in the wrong direction along a one-way street or on a physically separated
motorway. This section deals with wrong-way driving accidents on motorways alone, where,
normally, entry points for wrong-way driving are the exit ramps at interchange areas.
Similarly to cross-median motorway accidents, although the number of wrong-way driving
accidents is relatively limited, their consequences are much more severe than the consequences
of other motorway injury accidents.
Box 5: Prevalence of wrong-way driving accidents on motorways
Netherlands: An average of 22 wrong-way accidents per year was estimated for the 1991-1997 period, reduced
to 7 wrong-way accidents per year for the 1998-2003 period (SWOV, 2009).
USA: According to FARS data, a total of 1.753 people died in wrong-way accidents in US motorways from 1996
to 2000, with an average number of 350 fatalities per year (ICT, 2012).
Switzerland: An average of 27 wrong-way accidents per year was estimated in the 2000-2004 period
(Scaramuzza & Cavegn, 2007).
Japan: An average of 31 wrong-way accidents per year was estimated for the 1997-2000 period (ITARDA, 2002).
6.3.1 Accident location a nd condit ions
On motorways, wrong-way driving accidents occur mainly on the main carriageway. A study
(Blokpoel & De Niet, 2000) investigating wrong-way driving accidents in Dutch motorways
between 1983-1998 reported that 79% took place on the main carriageway, 5% on merging
lanes, and 17% on entry and exit ramps. One would expect such accidents to have occurred
mainly during periods of bad weather or darkness, but this was not exactly the case. The majority
of the wrong-way driving accidents (80%) occurred in dry weather and a considerable proportion
of them (40%) occurred during daytime. However, the night time share of wrong-way driving
accidents (0,2%) was indeed twice as large as the daytime share (0,1%).
A study in North Carolina (Braam, 2006) found that 33% of the wrong-way driving accidents
occurred during dark conditions (at night without street lighting), and 28% occurred at night on
motorways with streetlights.
6.3.2 Characteristics of the wrong -way driver
Several studies (ICT, 2012; SWOV, 2007; Cooner & Ranft, 2008; Vicedo, 2006) indicate that
young drivers and older drivers are over-represented in wrong-way accidents. In Japan, older
drivers contributed to 29% of wrong-way accidents although they contributed to only 4% in total
- 25 -You can also read