Emerging Issues and Challenges in Integrating High Levels of Solar into the Electrical Generation and Transmission System - ON THE PATH TO SUNSHOT ...
←
→
Page content transcription
If your browser does not render page correctly, please read the page content below
ON THE PATH TO SUNSHOT

Emerging Issues and Challenges in Integrating
High Levels of Solar into the Electrical
Generation and Transmission System

May 2016
NREL/TP-6A20-65800
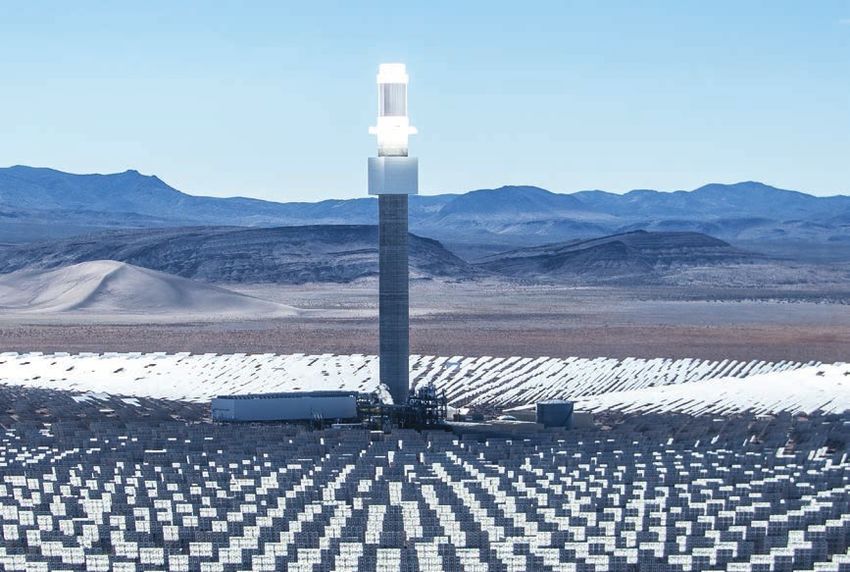
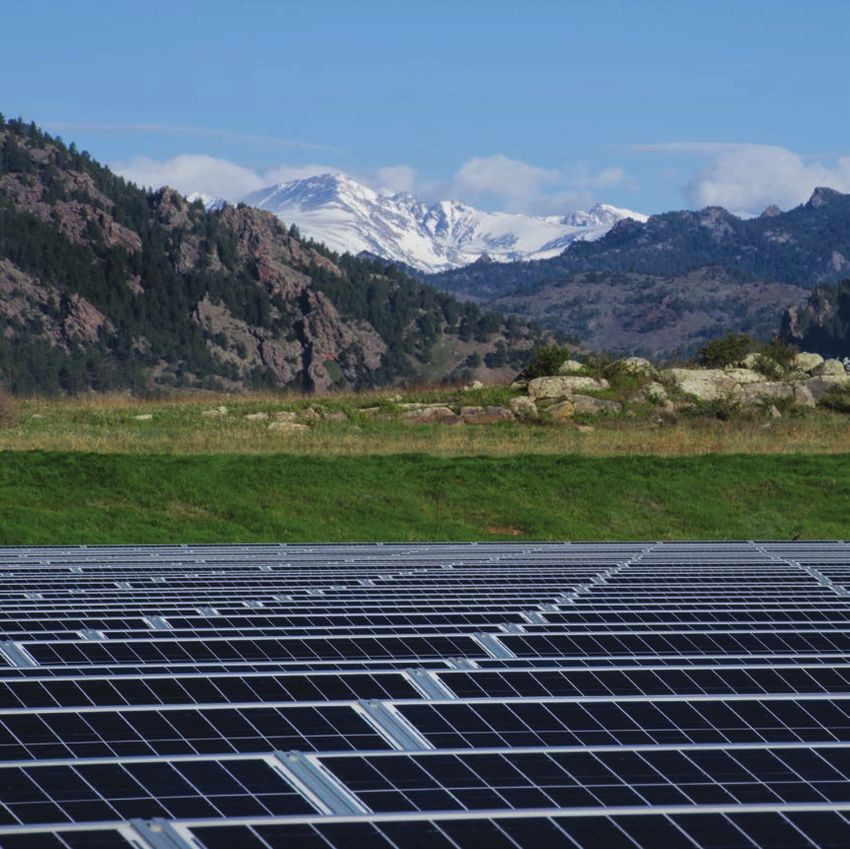
On the Path to SunShot: Emerging Issues and
Challenges in Integrating High Levels of Solar into
the Electrical Generation and Transmission System

Paul Denholm, Kara Clark, and Matt O’Connell

National Renewable Energy Laboratory

NREL is a national laboratory of the U.S. Department of Energy, Office of
Energy Efficiency and Renewable Energy, operated by the Alliance for
Sustainable Energy, LLC.

SUGGESTED CITATION
Denholm, Paul, Kara Clark, and Matt O’Connell. 2016. On the Path to SunShot: Emerging Issues and Challenges in Integrating High Levels of
Solar into the Electrical Generation and Transmission System. Golden, CO: National Renewable Energy Laboratory. NREL/TP-6A20-65800.
http://www.nrel.gov/docs/fy16osti/65800.pdf.

Cover photos (clockwise from top left): Solar Design Associates, Inc., NREL 08563; SolarReserve; Dennis Schroeder, NREL 30551;
and iStock 000075760625

NOTICE

This report was prepared as an account of work sponsored by an
agency of the United States government. Neither the United States
government nor any agency thereof, nor any of their employees,
makes any warranty, express or implied, or assumes any legal liability
or responsibility for the accuracy, completeness, or usefulness of any
information, apparatus, product, or process disclosed, or represents
that its use would not infringe privately owned rights. Reference herein
to any specific commercial product, process, or service by trade name,
trademark, manufacturer, or otherwise does not necessarily constitute
or imply its endorsement, recommendation, or favoring by the United
States government or any agency thereof. The views and opinions of
authors expressed herein do not necessarily state or reflect those of the
United States government or any agency thereof.

This report is available at no cost from the National Renewable Energy
Laboratory (NREL) at www.nrel.gov/publications.

Available electronically at SciTech Connect http:/www.osti.gov/scitech
Available for a processing fee to U.S. Department of Energy
and its contractors, in paper, from:

   U.S. Department of Energy
   Office of Scientific and Technical Information
   P.O. Box 62
   Oak Ridge, TN 37831-0062
   OSTI http://www.osti.gov
   Phone: 865.576.8401
   Fax: 865.576.5728
   Email: reports@osti.gov

Available for sale to the public, in paper, from:

   U.S. Department of Commerce
   National Technical Information Service
   5301 Shawnee Road
   Alexandria, VA 22312
   NTIS http://www.ntis.gov
   Phone: 800.553.6847 or 703.605.6000
   Fax: 703.605.6900
   Email: orders@ntis.gov
Preface
   The U.S. Department of Energy launched the SunShot Initiative in 2011 with the goal of making
   solar electricity cost-competitive with conventionally generated electricity by 2020. At the time
   this meant reducing photovoltaic and concentrating solar power prices by approximately 75%—
   relative to 2010 costs—across the residential, commercial, and utility-scale sectors. To examine
   the implications of this ambitious goal, the Department of Energy’s Solar Energy Technologies
   Office (SETO) published the SunShot Vision Study in 2012. The study projected that achieving
   the SunShot price-reduction targets could result in solar meeting roughly 14% of U.S. electricity
   demand by 2030 and 27% by 2050—while reducing fossil fuel use, cutting emissions of
   greenhouse gases and other pollutants, creating solar-related jobs, and lowering consumer
   electricity bills.

   The SunShot Vision Study also acknowledged, however, that realizing the solar price and
   deployment targets would face a number of challenges. Both evolutionary and revolutionary
   technological changes would be required to hit the cost targets, as well as the capacity to
   manufacture these improved technologies at scale in the U.S. Additionally, operating the U.S.
   transmission and distribution grids with increasing quantities of solar energy would require
   advances in grid-integration technologies and techniques. Serious consideration would also have
   to be given to solar siting, regulation, and water use. Finally, substantial new financial resources
   and strategies would need to be directed toward solar deployment of this magnitude in a
   relatively short period of time. Still the study suggested that the resources required to overcome
   these challenges were well within the capabilities of the public and private sectors. SunShot-level
   price reductions, the study concluded, could accelerate the evolution toward a cleaner, more cost-
   effective and more secure U.S. energy system.

   That was the assessment in 2012. Today, at the halfway mark to the SunShot Initiative’s 2020
   target date, it is a good time to take stock: How much progress has been made? What have we
   learned? What barriers and opportunities must still be addressed to ensure that solar technologies
   achieve cost parity in 2020 and realize their full potential in the decades beyond?

   To answer these questions, SETO launched the On the Path to SunShot series in early 2015 in
   collaboration with the National Renewable Energy Laboratory (NREL) and with contributions
   from Lawrence Berkeley National Laboratory (LBNL), Sandia National Laboratories (SNL), and
   Argonne National Laboratory (ANL). The series of technical reports focuses on the areas of grid
   integration, technology improvements, finance and policy evolution, and environment impacts
   and benefits. The resulting reports examine key topics that must be addressed to achieve the
   SunShot Initiative’s price-reduction and deployment goals. The On the Path to SunShot series
   includes the following reports:

   •   Emerging Issues and Challenges with Integrating High Levels of Solar into the Electrical
       Generation and Transmission Systems (Denholm et al. 2016)
   •   Emerging Issues and Challenges with Integrating High Levels of Solar into the Distribution
       System (Palmintier et al. 2016)
   •   Emerging Opportunities and Challenges in Financing Solar (Feldman and Bolinger 2016)

                                                      iii
This report is available at no cost from the National Renewable Energy Laboratory at www.nrel.gov/publications.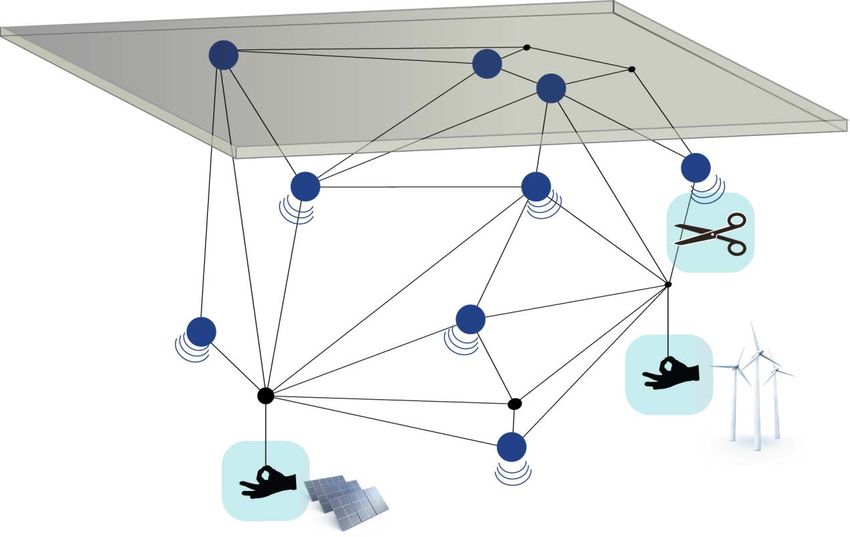
•   Utility Regulatory and Business Model Reforms for Addressing the Financial Impacts of
       Distributed Solar on Utilities (Barbose et al. 2016)
   •   The Role of Advancements in Photovoltaic Efficiency, Reliability, and Costs (Woodhouse
       et al. 2016)
   •   Advancing Concentrating Solar Power Technology, Performance, and Dispatchability
       (Mehos et al. 2016)
   •   Emerging Opportunities and Challenges in U.S. Solar Manufacturing (Chung et al. 2016)
   •   The Environmental and Public Health Benefits of Achieving High Penetrations of Solar
       Energy in the United States (Wiser et al. 2016).
   Solar technology, solar markets, and the solar industry have changed dramatically over the past
   five years. Cumulative U.S. solar deployment has increased more than tenfold, while solar’s
   levelized cost of energy (LCOE) has dropped by as much as 65%. New challenges and
   opportunities have emerged as solar has become much more affordable, and we have learned
   much as solar technologies have been deployed at increasing scale both in the U.S. and abroad.
   The reports included in this series, explore the remaining challenges to realizing widely
   available, cost-competitive solar in the United States. In conjunction with key stakeholders,
   SETO will use the results from the On the Path to SunShot series to aid the development of
   its solar price reduction and deployment strategies for the second half of the SunShot period
   and beyond.

                                                      iv
This report is available at no cost from the National Renewable Energy Laboratory at www.nrel.gov/publications.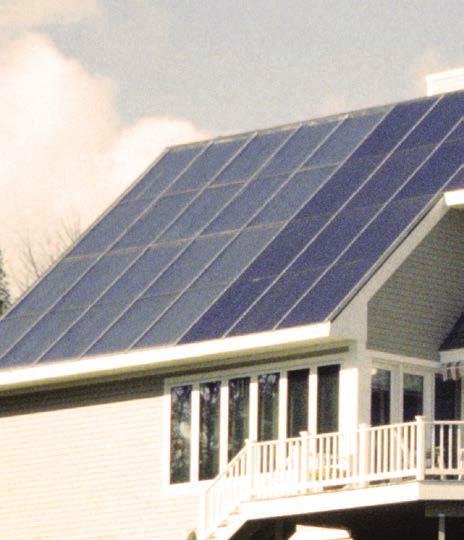
Acknowledgments
   The authors thank the Solar Energy Technologies Office team for its support of this report and
   Robert Margolis of NREL for his management and oversight of the On the Path to SunShot
   report series. And, we acknowledge and thank the following individuals for their reviews and
   comments: Mark Ahlstrom (WindLogics Inc), Aaron Bloom (NREL), Jaquelin Cochran (NREL),
   Barbara Goodman (NREL), Udi Helman (Helman Analytics), Bri-Mathias Hodge (NREL),
   Jennie Jorgenson (NREL), Chuck Kutscher (NREL), Ookie Ma (DOE), Robert Margolis
   (NREL), Mark Mehos (NREL), Mackay Miller (National Grid), David Mooney (NREL), Odette
   Mucha (DOE), Jimmy Nelson (Energy & Environmental Economics), Robin Newmark (NREL),
   Gian Porro (NREL), Charlie Smith (Utility Variable Generation Integration Group), Mary
   Werner (NREL), Patrick Young (California Public Utilities Commission), Meredith Younghein
   (California Public Utilities Commission), and Guohui Yuan (DOE). The authors also thank Jarett
   Zuboy (consultant) and Mike Meshek (NREL) for editorial assistance.

   This work was funded by the Solar Energy Technologies Office of the U.S. Department of
   Energy (DOE) Office of Energy Efficiency and Renewable Energy (EERE) under Contract No.
   DE-AC36-08GO28308.

   John Frenzl of NREL designed the covers for the On the Path to SunShot report series.

                                                      v
This report is available at no cost from the National Renewable Energy Laboratory at www.nrel.gov/publications.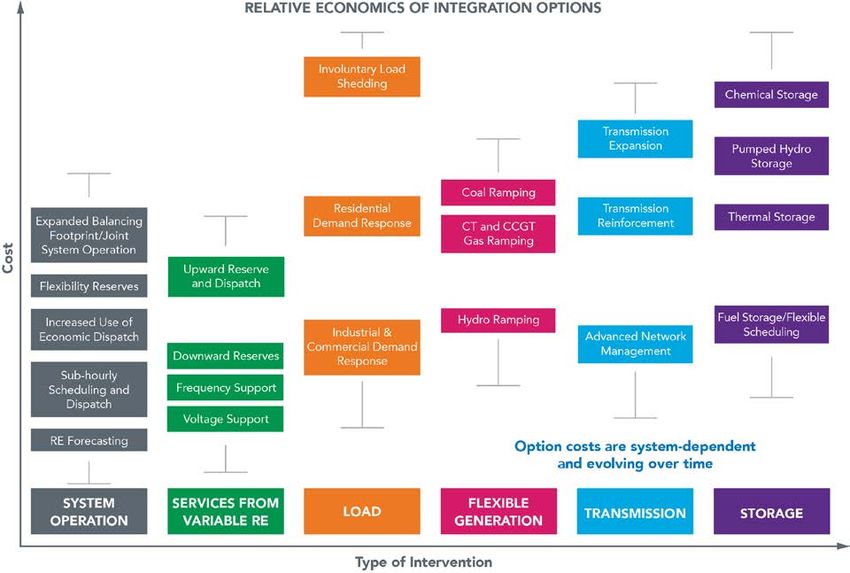
List of Acronyms
   AC                              alternating current
   ACE                             area control error
   AGC                             automatic generation control
   CAES                            compressed-air energy storage
   CAISO                           California Independent System Operator
   CCGT                            combined cycle gas turbine
   CPUC                            California Public Utilities Commission
   CSP                             concentrating solar power
   CT                              combustion turbine
   DOE                             U.S. Department of Energy
   DR                              demand response
   ERCOT                           Electric Reliability Council of Texas
   FERC                            Federal Energy Regulatory Commission
   ISO                             independent system operator
   kWh                             kilowatt-hour
   LCOE                            levelized cost of energy
   LOLP                            loss of load probability
   LTPP                            long-term procurement plan
   MISO                            Midcontinent Independent System Operator
   MWac                            megawatts alternating current
   MWh                             megawatt-hour
   NERC                            North American Electric Reliability Corporation
   NREL                            National Renewable Energy Laboratory
   PFR                             primary frequency response
   PV                              photovoltaic(s)
   RE                              renewable energy
   RPS                             renewable portfolio standard
   RTO                             regional transmission organization
   TEPPC                           Transmission Expansion Planning Policy Committee
   TES                             thermal energy storage
   TWh                             terawatt-hour
   VG                              variable generation
   WECC                            Western Electricity Coordinating Council
   WWSIS                           Western Wind and Solar Integration Study

                                                      vi
This report is available at no cost from the National Renewable Energy Laboratory at www.nrel.gov/publications.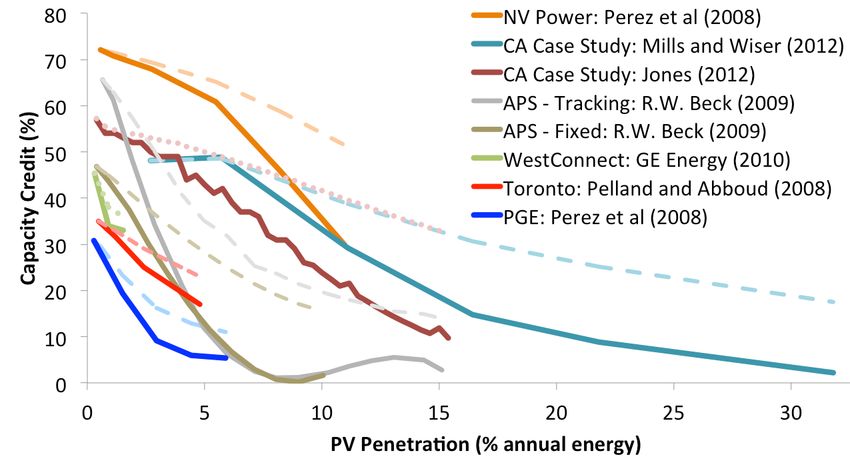
Executive Summary
Achieving the U.S. Department of Energy’s SunShot Initiative cost targets could greatly
accelerate deployment of grid-integrated solar technologies. Global experience with increasing
amounts of wind and solar on power systems has shown that variable generation resources can
be integrated into the grid at penetrations well beyond current capacity. However, the prospect of
dramatically increased photovoltaic (PV) deployment requires detailed examination to ensure
that high-penetration solar technologies will provide their intended benefits, including reducing
fossil fuel use and reducing the conventional capacity needed for reliable service. This report
examines several aspects of how the bulk power system (consisting of traditional generators and
the high-voltage transmission network) may need to evolve to accommodate the increased PV
penetration resulting from achievement of the SunShot cost targets.
The characteristics of PV-generated electricity—including variability, uncertainty, and non-
synchronous generation—present challenges to large-scale, cost-effective grid integration by
reducing PV’s energy value (and thus its ability to displace fossil fuel use) and capacity value
(and thus its ability to replace conventional capacity). One challenge to realizing the full energy
value of PV is the need to accommodate the changing net load (normal load minus generation
from variable solar and wind sources) associated with high midday PV generation and low
electricity demand. This situation can create “overgeneration,” when conventional dispatchable
resources cannot be backed down further to accommodate the supply of PV and other variable
generation (VG). Because of the threat of system disruptions from power supply exceeding
demand, system operators might curtail PV output and thus reduce the economic and
environmental benefits of PV energy. Similarly, the net load changes due to high PV penetration
reduce PV’s ability to displace conventional generation capacity during high-demand periods.
Accommodating the changes in net load resulting from increased VG penetration requires
enhancements to a power system’s “flexibility,” or the ability of the grid and generation fleet to
balance supply and demand over multiple time scales. Numerous technologies and strategies for
increasing flexibility have been implemented already, are being implemented today, or are being
developed. These approaches allow VG to be used directly to offset demand and increase
instantaneous VG penetration, or they improve the alignment of VG supply and demand. We
describe six of these flexibility options:
• System operation—Changing the way the grid is scheduled and dispatched, including
changes to market rules, does not require new technologies and often represents the “least
cost” way to aid VG integration.
• Flexible generation—Generators can respond better to the net load shape created by
additional PV via increased ramp rates and ranges as well as the ability to start and stop more
frequently.
• Reserves and stability services from VG—Inverter-based wind and solar plants can provide
the grid’s frequency response needs as these plants become a larger proportion of the
generation fleet and new mechanisms are developed.
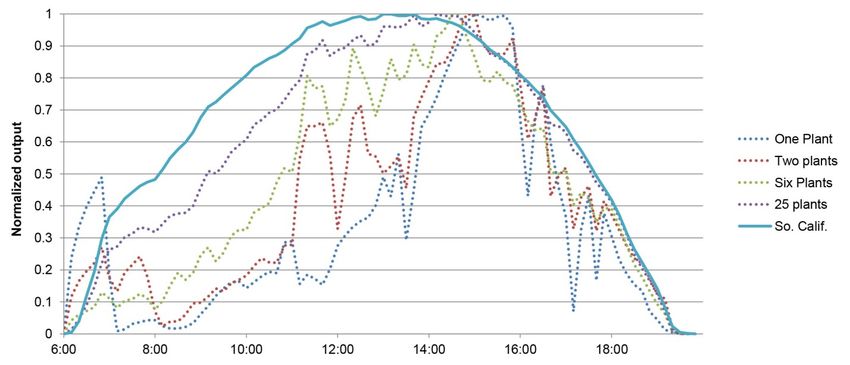
• Transmission and coordination—Balancing supply and demand over larger areas reduces net
variability of both load and renewable resources such as PV owing to greater spatial diversity
of VG resources.
vii
This report is available at no cost from the National Renewable Energy Laboratory at www.nrel.gov/publications.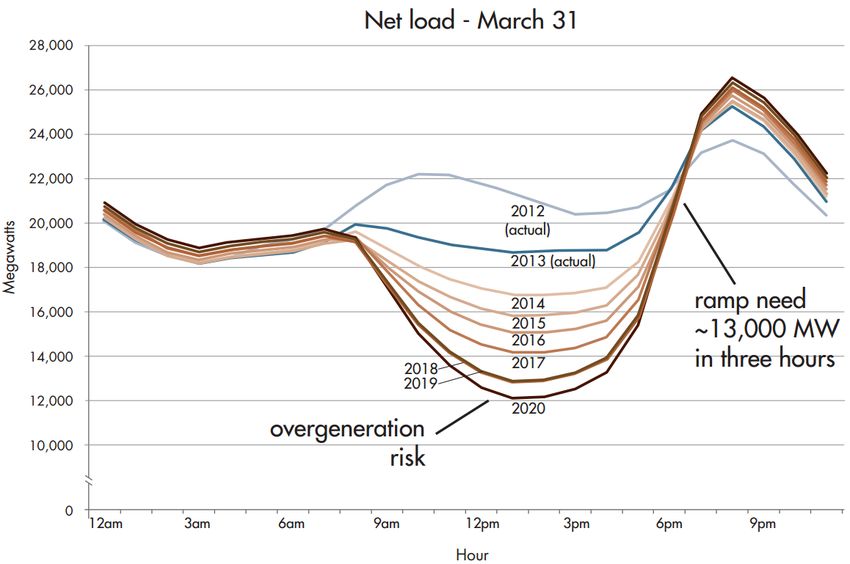
•   Demand response—Voluntary load reduction or load shifting can provide multiple benefits
       to integrating solar and reducing curtailment, including reducing the dependence on partially
       loaded synchronous generators for providing frequency stability and operating reserves and
       changing the shape of the net load, which can reduce ramp rates, better align solar supply
       with demand, and reduce peak capacity needs.
   •   Energy storage—Like DR, energy storage can provide reserves, change net load shape to
       minimize ramping requirements, and shift supply of VG to periods of increased net load.
   Deploying such grid-flexibility options can increase the energy and capacity value of PV to the
   grid. We use grid simulations to examine the impact of “near term” flexibility options in
   California, likely the first large region in the U.S. to experience significant impacts of PV on the
   transmission network; for this reason, we use California as a case study to examine how
   flexibility effects cost-effective integration of solar resources. Lessons learned from this region
   may assist other regions in developing strategies to mitigate the impacts of variability and
   uncertainty of the solar resource. Figure ES-1 demonstrates the levelized cost of energy (LCOE)
   from PV in California under two scenarios. The first is a limited-flexibility scenario, which
   reflects many historical grid operation practices that restrict participation of PV and other
   distributed resources in participation of grid services. The second is an enhanced-flexibility
   scenario which includes several grid-management techniques and technologies that will be or
   could be deployed by 2020. The base cost of PV assumes achievement of the SunShot target of 6
   ¢/kWh as well as zero curtailment. The figure shows the steep increase in marginal PV LCOE
   (the incremental cost of an added unit of PV energy) due to curtailment at penetrations beyond
   about 10%. Marginal costs are particularly important when comparing PV to other generating
   options—by the time PV provides 20% of annual electricity demand, marginal curtailment-
   related costs erase the benefits of achieving the SunShot targets. The figure also shows, however,
   that flexibility enhancements can minimize curtailment and keep PV competitive at penetrations
   at least as high as 25%. Similarly, flexibility options such as demand response and energy
   storage can mitigate declines in capacity credit by exploiting how PV reduces the length of peak
   demand periods while also reducing the time between on- and off-peak periods.

                                                     viii
This report is available at no cost from the National Renewable Energy Laboratory at www.nrel.gov/publications.
15
Limited Flexibility
14 (Marg.)
Limited Flexibility
PV Cost Due to Curtailment
13
(Total)
12 Enhanced Flexibility
(Cents/kWh)
11 (Marg.)
Enhanced Flexibility
10 (Total)
9
8
7
6
6% 8% 10% 12% 14% 16% 18% 20% 22% 24% 26% 28% 30% 32%
Annual Solar Energy Penetration
Figure ES-1. Marginal and average PV LCOE (based on SunShot goals) due to curtailment under
increasing penetration of PV in California with low and enhanced grid flexibility
Looking beyond the 2020 timeframe, our analysis shows how energy storage could facilitate the
cost-effective integration of even higher PV penetration. Figure ES-2 shows the marginal
curtailment curve when concentrating solar power (CSP) with thermal energy storage (TES) is
added to a system with significant PV. In this case, CSP is added starting when solar provides
about 28% of total demand and marginal curtailment of PV is 30%. Adding significantly more
PV to this system will produce very high curtailment (greater than 50%). The dashed line shows
the transition to the addition of CSP with TES. Adding a unit of CSP with 6 hours of TES and
enough capacity to provide about 1% of additional solar generation will reduce marginal
curtailment to about 10%, and this value could be lower with greater amounts of TES. This is
one of many possible deployment scenarios—a more comprehensive analysis of renewable
portfolios and flexibility options would help with determining the most cost-effective mix of
technologies and strategies.
ix
This report is available at no cost from the National Renewable Energy Laboratory at www.nrel.gov/publications.70%
Added PV (Limited
Marginal Annual Solar Curtailment 60% Flexiblity)
Added PV (Enhanced
50%
Flexiblity)
40% Added CSP/TES
30%
20%
10%
0%
6% 8% 10% 12% 14% 16% 18% 20% 22% 24% 26% 28% 30% 32% 34%
Annual Solar Energy Penetration
Figure ES-2. Marginal solar curtailment due to overgeneration under increasing penetration of
solar when adding PV or PV and CSP with TES
Clearly, implementation of appropriate flexibility resources is critical to making high-penetration
PV part of a reliable, cost-effective, and low-carbon electric power system. This includes
ensuring generation resources on the grid are committed and dispatched economically, with the
ability to respond to variations in net demand. Operating the generation fleet in the most
economic manner will unlock inherent flexibility in the system. Such insights will increase the
value of solar generation in terms of both energy and capacity.
Orderly and economic deployment of flexibility options will require a variety of stakeholder
actions, including new market rules and mechanisms. Distributed resources, including rooftop
PV and distributed storage, must be made visible to system operators, and operators might need
the ability to control the output of these resources to maintain a reliable grid. Updated grid codes
and use of existing technologies such as smart inverters will allow PV to participate in system
dispatch and the maintaining of grid frequency and voltage. Accelerating the participation of
demand loads in providing grid services can further accelerate cost-effective integration of solar
resources. Finally, storage technologies, including CSP with TES, can drive solar technologies
toward SunShot-level deployment and beyond—enabling solar to become a primary component
of the de-carbonized electricity future.
x
This report is available at no cost from the National Renewable Energy Laboratory at www.nrel.gov/publications.Table of Contents
1 Introduction ........................................................................................................................................... 1
2 Challenges of Economic PV Grid Integration and the Need for Flexibility .................................... 2
2.1 Energy Value, Grid Flexibility, and the Challenge of Curtailment ............................................... 2
2.1.1 Types of Grid Flexibility .................................................................................................. 3
2.1.2 Impacts of PV on Net Load and the Problem of Overgeneration..................................... 4
2.1.3 Modeling PV Generation and Curtailment with Limited Grid Flexibility ....................... 6
2.2 Capacity Value—The Challenge of Meeting Peak Demand ....................................................... 13
3 Increasing System Flexibility ............................................................................................................ 18
3.1 Improved System Operation........................................................................................................ 21
3.2 Flexible Generation ..................................................................................................................... 22
3.3 Transmission and Coordination................................................................................................... 23
3.4 Reserves and Frequency Stability Services from VG ................................................................. 24
3.5 Demand Response ....................................................................................................................... 28
3.6 Energy Storage ............................................................................................................................ 29
4 Impacts of Increased Flexibility ........................................................................................................ 31
4.1 Impact of Enhanced Flexibility on PV Curtailment .................................................................... 31
4.2 Impact of Enhanced Flexibility on PV Capacity Value .............................................................. 34
4.3 Beyond SunShot: Further Increasing Solar Deployment ............................................................ 38
5 Conclusions ........................................................................................................................................ 41
References ................................................................................................................................................. 42
Appendix: Grid Stability ........................................................................................................................... 51
xi
This report is available at no cost from the National Renewable Energy Laboratory at www.nrel.gov/publications.List of Figures
Figure ES-1. Marginal and average PV LCOE (based on SunShot goals) due to curtailment under
increasing penetration of PV in California with low and enhanced grid flexibility................ ix
Figure ES-2. Marginal solar curtailment due to overgeneration under increasing penetration of solar when
adding PV or PV and CSP with TES ....................................................................................... x
Figure 1. The CAISO duck chart .................................................................................................................. 5
Figure 2. Net load profiles for California on March 29 in a scenario with increasing penetration of solar,
assuming no curtailment (penetrations are based on annual potential) .................................... 7
Figure 3. Modeled net load in California on March 29 in a scenario with 11% annual wind and 11%
annual solar in a system with limited grid flexibility ............................................................... 9
Figure 4. Used and curtailed solar in California on March 29 in a scenario with 11% annual wind and
11% annual solar in a system with limited grid flexibility ...................................................... 9
Figure 5. Fraction of daily solar energy potential curtailed in a scenario with 11% and 15% annual solar
considering operational constraints in a system with limited grid flexibility ........................ 10
Figure 6. Annual marginal and total solar curtailment due to overgeneration under increasing penetration
of PV in California in a system with limited grid flexibility ................................................. 11
Figure 7. Marginal and average PV LCOE (based on SunShot goals) due to overgeneration under
increasing penetration of PV in California in a system with limited grid flexibility ............. 12
Figure 8. Load and net load profiles for increasing levels of PV in California, July 27–29....................... 13
Figure 9. Impact of increased PV on net load in California and decline in capacity credit, July 28 .......... 15
Figure 10. Summary of PV capacity credit estimates ................................................................................. 16
Figure 11. Flexibility options for integration of VG ................................................................................... 18
Figure 12. Reduction in solar variability due to spatial diversity ............................................................... 23
Figure 13. Impact of existing pumped-hydro storage in California on March 29th in a simulated system
with 11% solar penetration..................................................................................................... 29
Figure 14. Net load on March 29 in a scenario with 15% annual solar and limited or enhanced
grid flexibility ........................................................................................................................ 32
Figure 15. Impact of enhanced flexibility on PV curtailment on March 29 in a scenario with 15% annual
PV generation......................................................................................................................... 33
Figure 16. Marginal and average curtailment due to overgeneration under increasing penetration of PV
with limited and enhanced grid flexibility ............................................................................. 33
Figure 17. Marginal and average PV LCOE (based on SunShot goals) due to overgeneration under
increasing penetration of PV in California with limited and enhanced grid flexibility ......... 34
Figure 18. Load with and without PV ......................................................................................................... 36
Figure 19. Narrowing of net peak and amount of storage needed to deliver a 1,325-MW peak demand
reduction on July 30 ............................................................................................................... 37
Figure 20. Hours of storage needed to reduce peak demand by 1,325 MW and 2,650 MW as a function of
PV penetration........................................................................................................................ 38
Figure 21. Dispatch of CSP with TES on March 29 ................................................................................... 39
Figure 22. Dispatch of CSP with TES on July 29 ....................................................................................... 39
Figure 23. Marginal solar curtailment due to overgeneration under increasing penetration of solar when
adding PV (first two cases) or CSP/TES................................................................................ 40
Figure 24. Electricity demand exceeds electricity generation, and frequency drops .................................. 52
Figure 25. Visualization of transient stability with synchronous generators and wind power plants ......... 53
List of Tables
Table 1. Characteristics of PV Electricity Generation and Associated Integration Challenges.................... 2
Table 2. Types of Grid Flexibility ................................................................................................................ 3
Table 3. Six Grid Flexibility Options and How They Mitigate Challenges that Lead to Solar Curtailment20
xii
This report is available at no cost from the National Renewable Energy Laboratory at www.nrel.gov/publications.1 Introduction
Achieving the U.S. Department of Energy’s SunShot cost targets for photovoltaics (PV) and
concentrating solar power (CSP) could greatly accelerate economic deployment of solar
technologies onto the grid. The SunShot Vision Study (DOE 2012) projected that achieving
SunShot cost-reduction goals could increase the deployment of solar technologies in the United
States to 330 GW, or 14% of total electricity demand, by 2030 (DOE 2012). However, this
growth will occur at different rates, with early adoption in states such as California, which
combines aggressive renewable targets with an excellent solar resource. In 2014, solar energy
contributed about 6% of electricity demand in the state, and projections estimate this could
approach 20% by 2020. 1 As PV becomes a significant source of generation in various regions,
utilities and system operators 2 must ensure that the grid is operated to maintain reliable service
while maximizing the usefulness of solar energy. Lessons learned in one region can be applied to
others, helping ease the integration of solar in regions with less experience. More than a decade
of U.S. and international experience with increasing penetration of wind and solar on grid
systems has provided evidence that such variable generation (VG) resources can be integrated
into the grid at penetrations well beyond current levels. However, the prospect of dramatically
increased PV deployment requires more detailed examination to ensure that solar technologies
will provide their intended benefits, including reducing fossil fuel use and reducing the
conventional capacity needed for reliable service.
This report examines several aspects of how the bulk power system (consisting of traditional
generators and the high-voltage transmission network) may need to evolve to accommodate the
increased PV penetration resulting from achievement of the SunShot cost targets. 3 Specifically,
the report first discusses the challenges of operating the grid with increased penetration of PV in
a “business as usual” future. It identifies the key challenge of curtailment—the need to reduce
PV output to maintain power system reliability—that could result if the grid is not operated in a
more flexible manner. Increased curtailment, along with decreased capacity value (the ability of
PV to replace conventional capacity), could reduce the economic competitiveness of PV,
increasing its costs and decreasing its benefits. Next, the report discusses six sources of grid
flexibility that are being deployed or can be deployed in the near future: improved system
operation, flexible generation, reserves and stability services from VG, transmission and regional
coordination, demand response (DR), and energy storage. Finally, the impact of improved grid
flexibility is evaluated, showing how annual solar penetrations of 25% and beyond are
achievable while maintaining a stable and reliable grid. While we use California as a specific
case study, many of the strategies used to cost-effectively integrate solar are generally
applicable, and lessons learned for a specific region can provide insights that can be applied to
power system throughout the United States and internationally.
1
The 2014 estimate includes 12.6 TWh of utility-scale (PV + CSP) generation (CEC 2014) and about 5.1 TWh from
rooftop PV (GTM & SEIA 2015).
2
Throughout this document, we use the term “system operator” to refer to the balancing area authorities responsible
for balancing supply and demand through generator scheduling and dispatch. In areas with wholesale markets, these
authorities are referred to as “independent system operators” (ISOs) or “regional transmission organizations”
(RTOs). In regions without markets, balancing authorities are typically large vertically integrated utilities or federal
power marketing administrations.
3
Another On the Path to SunShot report (Palmintier et al. 2016) discusses the integration of PV on the distribution
system.
1
This report is available at no cost from the National Renewable Energy Laboratory at www.nrel.gov/publications.2 Challenges of Economic PV Grid Integration and
the Need for Flexibility
Solar-generated electricity, particularly from PV, has a number of characteristics that present
challenges to cost-effective grid integration. Table 1 summarizes three key characteristics of PV
generation, including variability, uncertainty, and non-synchronous generation. 4 Each of these
characteristics produces an economic challenge to PV integration—reducing the energy value
(such as the ability to avoid fossil fuel use) and capacity value (the ability to replace
conventional capacity) of PV. Note that CSP, particularly when deployed with thermal energy
storage (TES), does not present the same challenges. The potential opportunities for CSP to
increase overall solar penetration are discussed in Section 4.
Table 1. Characteristics of PV Electricity Generation and Associated Integration Challenges
Potential Economic Challenge to Integration
Solar Characteristic
Energy Value & Curtailment Capacity Value
Supply/demand mismatch
PV output can vary PV may not be able to replace
coupled with generator
Variability as underlying conventional capacity during
inflexibility leads to
resource fluctuates. periods of peak demand.
curtailment.
PV output cannot be Part-load operation of thermal
Capacity needed for provision
Uncertainty predicted with perfect plants for operating reserves
of operating reserves.
accuracy. leads to curtailment.
Part-load operation of thermal
Non- PV does not currently
plants for provision of Capacity needed for provision
synchronous help maintain system
frequency response leads to of frequency response.
generation frequency.
curtailment.
The following subsections discuss each of the two economic challenges to PV deployment
identified in Table 1, including the origin of the economic challenge and how the challenge is
related to grid flexibility (the ability of system operators to respond to increased variability and
uncertainty). Finally, each subsection provides an example of how PV’s benefits can decline in
an inflexible grid.
2.1 Energy Value, Grid Flexibility, and the Challenge of Curtailment
This subsection discusses the ability of PV to provide energy and replace fossil fuel generation.
As described in Table 1, PV’s generating characteristics present challenges to realizing PV’s full
energy value. With high penetrations of VG resources, and without measures to enhance grid
flexibility, not all of the electricity generated by PV can serve demand. As a result, some PV
electricity must be curtailed, forcing the overall levelized cost of energy (LCOE) of PV resources
to rise. Below, Section 2.1.1 describes how power system operators use different sources of grid
flexibility to balance supply and demand. Section 2.1.2 discusses the potential limits to these
sources of flexibility associated with high-penetration PV in a power system, and how these
4
Non-synchronous generation means that PV does not generate electricity via a large rotating turbine. The
implications of this, as well as an introduction to frequency stability are discussed in more detail in Section 3.3 and
the Appendix.
2
This report is available at no cost from the National Renewable Energy Laboratory at www.nrel.gov/publications.limits can result in curtailment. Section 2.1.3 models PV generation and curtailment in a system
with limited grid flexibility. This information provides context for the presentation of options for
maintaining PV’s energy value in Sections 3 and 4.
2.1.1 Types of Grid Flexibility
Power system operators maintain a reliable grid by constantly balancing consumer demand for
energy with generation from a variety of resources. The ability of a power system to
accommodate the changes in electricity demand is often expressed in terms of its “flexibility.”
While there is no uniform definition of grid flexibility, it generally refers to the ability of the grid
and generation fleet to balance supply and demand over multiple time scales, which becomes
particularly important with increased variability and uncertainty of net load (Ela et al. 2014).
Table 2 summarizes four categories of grid flexibility, which are described briefly below and
discussed in Section 3.
Table 2. Types of Grid Flexibility
Type Description
Generator flexibility Ability of conventional generation to vary output over various time scales
Storage flexibility Ability to store energy during periods of low demand and release that
energy during periods of high demand
Geographic flexibility Ability to use transmission to share energy and capacity across multiple
regions
Load flexibility Ability to vary electricity demand in response to grid conditions
Generator flexibility reflects the ability of conventional power plants to vary output to serve
variations in electricity demand. The ability of generators to vary output is based on a host of
technical, economic, and institutional factors. Most thermal plants have a maximum ramp rate
(ability to rapidly change output) and ramp range (minimum and maximum output). The ramp
range is limited by the plant’s minimum stable operating point, below which the plant cannot
run. Because certain plant types cannot be started and stopped quickly, they are forced to remain
online and operating above this minimum generation level. Finally, there are also minimum
generation constraints due to the need to provide online (spinning) capacity for addressing
uncertainty over multiple time frames. This includes operating reserves needed to maintain
frequency stability—that is, the ability of the power system to remain operational after large,
sudden mismatches between generation and load. A primer on frequency stability is provided in
the appendix, while additional discussion of operating reserves is provided in Section 3.3. These
services are typically provided by partially loaded thermal and hydroelectric units. The energy
generated by these units when providing operating reserves represents energy that cannot be
provided by PV.
Storage flexibility represents the ability to store energy during periods of low demand, and
releasing this storage energy at a later time. In this manner, storage changes both the load
(providing load flexibility) and acts as a generator (providing generator flexibility).
3
This report is available at no cost from the National Renewable Energy Laboratory at www.nrel.gov/publications.Geographic flexibility reflects the ability to share energy and capacity across regions, which
requires both transmission capacity and institutions that allow this transfer. Institutions include
markets or some other mechanism to buy and sell energy.
Finally, load flexibility reflects the ability to change the demand for electricity in response to
grid conditions. This includes a variety of market mechanisms to incentivize consumers to use
electricity when it is cheapest. These mechanisms are detailed in Section 3.
Combined, these four grid flexibility options are used by system operators to balance the supply
of generation with demand.
2.1.2 Impacts of PV on Net Load and the Problem of Overgeneration
One challenge to realizing the full energy value of PV is accommodating the change in net load
(normal load minus generation from VG solar 5 and wind) associated with high midday PV
generation and low electricity demand. This situation can create “overgeneration” conditions,
during which conventional dispatchable resources cannot be backed down further to
accommodate the supply of VG, and the supply of power could exceed demand (Younghein and
Martinot 2015). Without intervention, generators and certain motors connected to the grid would
increase rotational speed, which can cause damage. To avoid overgeneration, system operators
may curtail wind or PV output. PV generation is curtailed by either reducing output from the
inverter or disconnecting the plant. This requires that a plant or system operator have physical
control of the generation resource, which is typical for large renewable power plants but
uncommon for smaller systems, particularly distributed or rooftop PV systems. Curtailment has
the undesirable trait of reducing the economic and environmental benefits of VG. Each unit of
VG energy curtailed represents a unit not sold to the grid and a unit of fossil fuel energy not
avoided. As the amount of curtailment increases, the overall benefits of additional PV may drop
to the point where additional installations are not worth the cost (Cochran et al. 2015).
The change in net load shape and associated challenge of grid operation were highlighted in
2013, when the California Independent System Operator (CAISO) published a “duck chart”
showing the potential for overgeneration at relatively high PV penetration, especially considering
the host of technical and institutional constraints on power system operation (CAISO 2013). 6
Although California likely will be the first place in the continental United States that must
address the challenges of operating a large grid with high PV deployment, these issues will arise
elsewhere as PV becomes more cost competitive in locations with lower-quality solar resources. 7
Identifying and addressing the challenges illustrated in the duck chart in a region such as
California will provide examples for other regions as PV becomes more cost competitive in
locations with lower quality solar resources.
5
VG solar includes PV and CSP without TES.
6
The name is derived from the chart’s resemblance to the profile of a duck. Details on the modeling that led to
creation of the duck chart are in CAISO studies (CAISO 2010, 2011a, 2011b; Liu 2014a, 2014b, 2014c).
7
Smaller grids, such as those in Hawaii have seen significant penetration of PV (Schuerger et al. 2013) as have
other regions of the world such as Germany (Stetz et al. 2015). Many of the flexibility options discussed in this
document are being deployed in those regions to successfully integrate PV.
4
This report is available at no cost from the National Renewable Energy Laboratory at www.nrel.gov/publications.Figure 1 shows the duck chart, in which each line represents the net load. Note that this chart
represents only the part of California grid operated by the CAISO, which represents about 80%
of the total state demand. 8 The “belly” of the duck represents the period of lowest net load,
when PV generation is at a maximum. The belly grows as PV installations increase between
2012 and 2020. As a result, it may become increasingly challenging to have sufficient capacity
online to meet the increased ramp rate of net load that occurs when PV output drops in the
evenings. In the 2020 projection, starting at about 9 am, the system operator must be able to
reduce generator output from about 20,000 MW to 12,000 MW by turning generators down or
off. However, the operator must also be able to ramp back up to the peak demand of about
26,000 MW occurring at 8 pm. The operator may not be able to back down sufficient generation,
which would force PV curtailment. Addressing this issue requires increased grid flexibility.
Figure 1. The CAISO duck chart
Source: CAISO 2013
In addition to technical challenges of meeting increased variability, additional factors that limit
generator flexibility include contractual and institutional restrictions on plant operation,
including long-term “must take” contracts, self-scheduling, and combined heat and power plants
(Younghein and Martinot 2015). These constraints also apply to imports of out-of-state
generation, which may have established contracts and restrictions on flexible operation (Lew et
al. 2015).
Examining the relationship between system flexibility and curtailment can help determine the
potential of PV to economically supply substantial amounts of energy to a power system.
8
For more details about CAISO, see http://www.caiso.com/Pages/default.aspx.
5
This report is available at no cost from the National Renewable Energy Laboratory at www.nrel.gov/publications.2.1.3 Modeling PV Generation and Curtailment with Limited Grid Flexibility
This subsection demonstrates the impact of limited grid flexibility on curtailment and the
economics of PV energy in a SunShot future. We start by generating scenarios of increased solar
penetration, and then we examine the resulting impacts on system operation and corresponding
curtailment.
Figure 2 shows normal load and net load with wind and solar (combined PV and CSP) profiles in
California. The scenario assumes a fixed amount of wind with the potential to meet 11% of the
state’s annual demand. 9 Three potential penetration levels of solar are also included: zero, 7.5%,
and 11%. 10 Each case assumes 1.5% of total demand from CSP, with the remainder derived from
PV. The vast majority of the CSP does not have thermal storage, so it produces output profiles
similar to those from PV. The renewable generation profiles were derived from those developed
for the Western Wind and Solar Integration Study (WWSIS) (GE Energy 2010) and refined for
phase 2 of that study (Lew et al. 2013).
Figure 2 shows the profiles for March 29, which is the day in California with the lowest net load
and likely the most challenges for PV integration and possible overgeneration. 11 Because of the
relatively low load, the potential proportion of generation from wind and solar on this day is
higher than average—about 16% from wind and 0%, 12.5%, and 18% from solar in the three
solar cases. The figure also shows very low net loads that would need to be met by the remaining
generation fleet, assuming all solar generation could be used. In this example, the new minimum
net load point (as low as about 7,700 MW in the 11% solar case) is shifted from 4 am to noon.
9
This represents a relatively small increase in wind generation. In 2014, California generated 12.7 TWh from wind
in-state and imported another 12.7 TWh of wind for a total of 25.4 TWh, which provides about 8.6% of the total
demand (296.6 TWh).
10
Penetration of utility-scale solar in 2014 was about 4.2%, or about 6% including rooftop solar (CEC 2014). Based
on recent projections, 11% solar penetration could be achieved as early as the end of 2017 (GTM & SEIA 2015).
11
Versions of several figures provided in this work have been previously presented in Denholm et al. (2015).
6
This report is available at no cost from the National Renewable Energy Laboratory at www.nrel.gov/publications.35,000
30,000
Megawatts 25,000
20,000
15,000
10,000
5,000
0
12 AM 3 AM 6 AM 9 AM 12 PM 3 PM 6 PM 9 PM
Hour
Load without Wind and Solar
Net Load with 11% Wind and Zero Solar
Net Load with 11% Wind and 7.5% Solar
Net Load with 11% Wind and 11% Solar
Figure 2. Net load profiles for California on March 29 in a scenario with increasing penetration of
solar, assuming no curtailment (penetrations are based on annual potential)
The net load shown in Figure 2 does not consider the constraints that actually occur in operating
the system. To examine the impact of PV on system operation, we simulate the California grid
using the PLEXOS production-cost model. Note that our analysis considers the entire state of
California, including the service territories of all investor-owned and publicly owned utilities.
The model simulates the operation of all power plants throughout the Western Interconnection.
The data and assumptions are derived from a combination of the Western Electricity
Coordinating Council (WECC) Transmission Expansion Planning Policy Committee (TEPPC)
2024 Common Case (WECC 2014) and the CAISO 2014 Long-Term Procurement Plan (LTPP)
data set 12 (CPUC 2013a), with significant modifications derived from Brinkman et al. (2016) and
Denholm et al. (2015).
We generated two general scenarios. The first is a “limited flexibility” case that includes a set of
restrictive assumptions about grid operations in California. Key assumptions in this limited
flexiblity case include the following:
• There are no net exports of electricity from California. 13
• No new DR or storage is installed beyond what is in service in 2015. 14 While existing
pumped storage (about 2,500 MW) is allowed to respond to net load, this simulation does not
12
Additional discussion of the California LTPP model can be found in Eichman et al. (2015).
13
This is based on the fact that California has historically been a net importer, and there are limited market
mechanisms to allow California to sell excess renewable energy out of state. Further discussion is provided in Liu
(2014a).
7
This report is available at no cost from the National Renewable Energy Laboratory at www.nrel.gov/publications.consider the 1,325 MW of additional storage that will be deployed as part of the California
storage mandates; this is evaluated in later sections.
• Twenty-five percent of all generation within certain zones must be met with local fossil or
hydro generation. 15
• Instantaneous penetration of VG (including PV, wind, and CSP without TES) is limited to
60% of the normal load. 16
• VG cannot be used to provide reserves.
Grid simulations were performed with these assumptions for a variety of penetrations of solar to
calculate the amount of curtailed energy. In the case with 7.5% annual solar, the system is
flexible enough to accommodate changes in the net load without the need for significant
curtailment. However, in the 11% annual solar case, the system is unable to accommodate all
solar generation. Figure 3 shows the simulated net load resulting from the 11% solar case for
March 29. In this case, the actual net load met by conventional generation is not allowed to drop
below about 12,600 MW. This represents a California system-wide minimum generation
constraint, meaning online generators in California—and certain contracted generators outside
California—cannot reduce output below this level, in order to satisfy operating reserves from
conventional resources and other “traditional” system limitations.17 This minimum generation
level is an important measure of the overall flexibility of the power grid.
14
Up to about 1.3% of peak demand (as much as about 900 MW during periods of peak demand) can be shifted via
economic DR programs. This value is about equal to the existing “price response” DR available from the three
investor-owned utilities in the CAISO territory (CPUC 2015).
15
In the database from which our analysis is derived (the Low Carbon Grid Study from Brinkman et al. 2016), the
zones that require the 25% local generation limit account for 77% of all California load. The Diablo Canyon nuclear
power plant does not contribute to the local generation requirement, which is a conservative assumption based on
the fact that nuclear power plants typically do not vary load to provide operating reserves. For additional analysis of
the impact of the local generation requirement, see Nelson (2014) and Brinkman et al. (2015).
16
This is based on the provision that renewables cannot provide reserves and the concern that, at 60% VG
penetration without VG providing reserves, “the grid may not be able to prevent frequency decline following the
loss of a large conventional generator or transmission asset” (CAISO 2013).
17
This minimum generation value is below a CAISO-only estimate of the lowest net load point of about 15,000 MW
in the current system (Bouillon 2014). The lower minimum generation point in this analysis results from several
factors, including greater flexibility from customer-owned cogeneration and eliminating certain fixed-schedule
contractual limitations on plant dispatch. We assume this flexibility will occur to avoid negative prices that may
occur in the CAISO market under overgeneration conditions. Also, Diablo Canyon unit 2 was out for maintenance
on this day in the simulation, which removed 1,122 MW of non-dispatchable capacity. The net load in the system is
less than 15,000 MW during only 34 hours of the year in this simulation.
8
This report is available at no cost from the National Renewable Energy Laboratory at www.nrel.gov/publications.35,000
Net Load (With Curtailment)
30,000
Net Load (Unconstrained)
25,000
Megawatts
20,000
15,000
10,000
5,000
0
12 AM 3 AM 6 AM 9 AM 12 PM 3 PM 6 PM 9 PM
Hour
Figure 3. Modeled net load in California on March 29 in a scenario with 11% annual wind and 11%
annual solar in a system with limited grid flexibility
These constraints result in the curtailed energy illustrated in Figure 4, which includes the
combined solar potential, the amount of solar actually used by the system, and the curtailed solar.
Overall, about 4% of the potential solar energy on this day is curtailed. However, during most
days, there is little or no curtailment; over the entire year, only about 0.4% of potential solar
generation is curtailed.
25,000
Solar Potential
20,000 Solar After Curtailment
Curtailment
Megawatts
15,000
10,000
5,000
0
12 AM 3 AM 6 AM 9 AM 12 PM 3 PM 6 PM 9 PM
Hour
Figure 4. Used and curtailed solar in California on March 29 in a scenario with 11% annual wind
and 11% annual solar in a system with limited grid flexibility
9
This report is available at no cost from the National Renewable Energy Laboratory at www.nrel.gov/publications.Without flexibility changes that allow conventional generation to reduce output, only a relatively
small amount of additional PV generation can be accommodated on March 29. As more PV is
added, there will also be a greater number of days with PV curtailment. Figure 5 shows the
fraction of daily solar energy curtailed for each day of the year for the 11% annual solar potential
case (blue) as well as a 15% annual solar potential case (red). Note that we add only PV in these
cases; the impact of adding CSP/TES is discussed in Section 4. In the 11% solar potential case,
solar energy is curtailed due to system flexibility limits on a total of 57 days, and on 49 of those
days the amount of solar curtailed is less than 5% of potential generation. Moving to the 15%
solar case increases the number of days of curtailed solar to 139, and on 16 days greater than
10% of solar potential is curtailed.
25%
11% Annual Solar
15% Annual Solar
Fraction of Daily Solar Energy Curtailed
20%
15%
10%
5%
0%
1-Jan 1-Feb 1-Mar 1-Apr 1-May 1-Jun 1-Jul 1-Aug 1-Sep 1-Oct 1-Nov 1-Dec
Figure 5. Fraction of daily solar energy potential curtailed in a scenario with 11% and 15% annual
solar considering operational constraints in a system with limited grid flexibility
On an annual basis, increasing the annual solar potential from 11% to 15% increases the total
curtailment from 0.4% to 1.6% of potential solar generation. However, marginal curtailment—
that is, the curtailment of additional PV required to increase solar potential from one level to the
next—increases at a greater rate. Increasing annual solar potential from 7.5% to 11% requires
that only 1.2% of the added PV generation be curtailed. However, increasing annual solar
potential from 11% to 15% requires that about 5.5% of the added PV generation be curtailed.
This illustrates the diminishing returns that can result from adding PV to a system with limited
grid flexibility, and it highlights the importance of analyzing total and marginal curtailment rates
in such systems.
10
This report is available at no cost from the National Renewable Energy Laboratory at www.nrel.gov/publications.Figure 6 illustrates the total and marginal curtailment results from the addition of PV. The annual
solar penetration is the fraction of total demand in California met by PV (plus the fixed amount
of CSP), after removing curtailed solar energy. 18 The points on the curve are the actual modeled
scenarios.
70%
Marginal Curtailment
60%
Total Curtailment
Annual Solar Curtailment
50%
40%
30%
20%
10%
0%
6% 8% 10% 12% 14% 16% 18% 20% 22% 24%
Annual Solar Energy Penetration
Figure 6. Annual marginal and total solar curtailment due to overgeneration under increasing
penetration of PV in California in a system with limited grid flexibility
The rapid increase in marginal PV curtailment rates as a function of solar penetration is a
significant limitation to PV remaining competitive with other sources of low-carbon energy once
solar achieves a certain penetration (in this case, perhaps 15%–20% of annual demand). For
example, previous analysis demonstrated that additional wind often has a lower curtailment rate
than PV at increasing penetration (Denholm and Hand 2011; E3 2014). This challenge can be
observed by examining the impact of curtailment on PV’s LCOE. As curtailment increases and
capacity factors decrease, the LCOE increases. This is illustrated in Figure 7, which provides PV
LCOE as a function of solar penetration in the system without enhanced grid flexibility. In this
figure, the PV cost is based on the SunShot utility-scale LCOE goal of 6 ¢/kWh, which largely
depends on being able to use all the PV energy by minimizing curtailment.
18
Where the total demand is equal to the consumer demand plus storage losses associated with pumped hydro.
11
This report is available at no cost from the National Renewable Energy Laboratory at www.nrel.gov/publications.You can also read