GETTING TO 2020 Two Software Tools to Help Californians Design Zero Net Energy Homes
←
→
Page content transcription
If your browser does not render page correctly, please read the page content below
Energy Research and Development Division
FINAL PROJECT REPORT

   GETTING TO 2020
   Two Software Tools to Help Californians
   Design Zero Net Energy Homes

Prepared for:   California Energy Commission
Prepared by:    Energy Design Tools Group, UCLA Department of Architecture and Urban Design

                                                                                    MA RC H 20 13
                                                                             CE C- 5 00 - 20 13 - 11 6
PRIMARY AUTHOR(S):
  Murray Milne
  Robin Liggett

Energy Design Tools Group
Department of Architecture and Urban Design
UCLA
Los Angeles, CA 90095
310-454-7348
energy.design.tools@ucla.edu

Contract Number: 500-08-029

Prepared for:

California Energy Commission

Dustin Davis
Contract Manager

Virginia Lew
Office Manager
Energy Efficiency Research Office

Laurie ten Hope
Deputy Director
ENERGY RESEARCH ANDDEVELOPMENT DIVISION

Robert P. Oglesby
Executive Director

                                                 DISCLAIMER
        This report was prepared as the result of work sponsored by the California Energy Commission. It
        does not necessarily represent the views of the Energy Commission, its employees or the State of
        California. The Energy Commission, the State of California, its employees, contractors and
        subcontractors make no warrant, express or implied, and assume no legal liability for the information
        in this report; nor does any party represent that the uses of this information will not infringe upon
        privately owned rights. This report has not been approved or disapproved by the California Energy
        Commission nor has the California Energy Commission passed upon the accuracy or adequacy of
        the information in this report.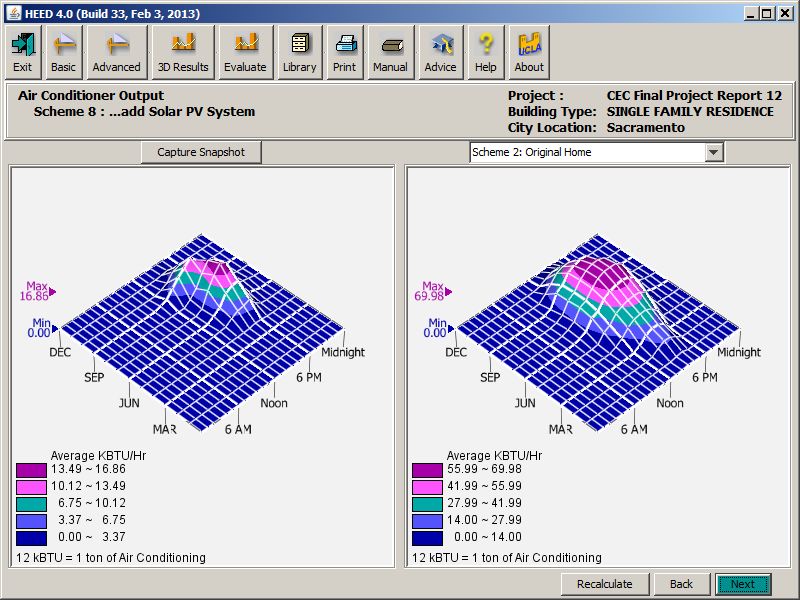
ACKNOWLEDGEMENTS
We wish to thank the many people who contributed to this project:

   •   Bill Beckman, Solar Energy Laboratory, University of Wisconsin and

   •   David Bradley, TESS Corporation, Madison Wisconsin

   •   Gail Brager and Ed Arens, University of California, Berkeley

   •   Tim Kohut, Collaborative Project Consulting, Inc

   •   John Morton, ZNE Buildings Program, Southern California Edison

   •   Marc Schiller, Building Science Program, University of Southern California

   •   Peter Turnbull, ZNE Building Program, Pacific Gas and Electric

   •   Pablo LaRoche, California Polytechnic University, Pomona

   •   Alicyn Henkhaus, University of Southern California

… and especially to our software development team:

Carlos Gomez and Don Leeper

                                               i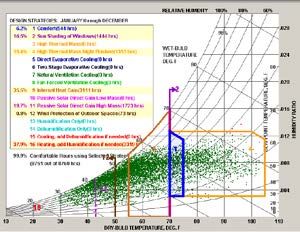
PREFACE
The California Energy Commission Energy Research and Development Division supports
public interest energy research and development that will help improve the quality of life in
California by bringing environmentally safe, affordable, and reliable energy services and
products to the marketplace.

The Energy Research and Development Division conducts public interest research,
development, and demonstration (RD&D) projects to benefit California.

The Energy Research and Development Division strives to conduct the most promising public
interest energy research by partnering with RD&D entities, including individuals, businesses,
utilities, and public or private research institutions.

Energy Research and Development Division funding efforts are focused on the following
RD&D program areas:

   •   Buildings End-Use Energy Efficiency

   •   Energy Innovations Small Grants

   •   Energy-Related Environmental Research

   •   Energy Systems Integration

   •   Environmentally Preferred Advanced Generation

   •   Industrial/Agricultural/Water End-Use Energy Efficiency

   •   Renewable Energy Technologies

   •   Transportation

Getting to 2020 is the final report of this project to develop Two Software Tools to Help
Californians Design Zero Net Energy Homes (contract number 500-08-029) conducted by
Energy Design Tools Group, Department of Architecture and Urban Design, UCLA
(www.energy-design-tools.aud.ucla.edu). The information from this project contributes to
Energy Research and Development Division’s Buildings End-Use Energy Efficiency Program.

For more information about the PIER Program, please visit the Energy Commission’s website at
www.energy.ca.gov/research/ or contact the Energy Commission at 916-654-4878.

                                               ii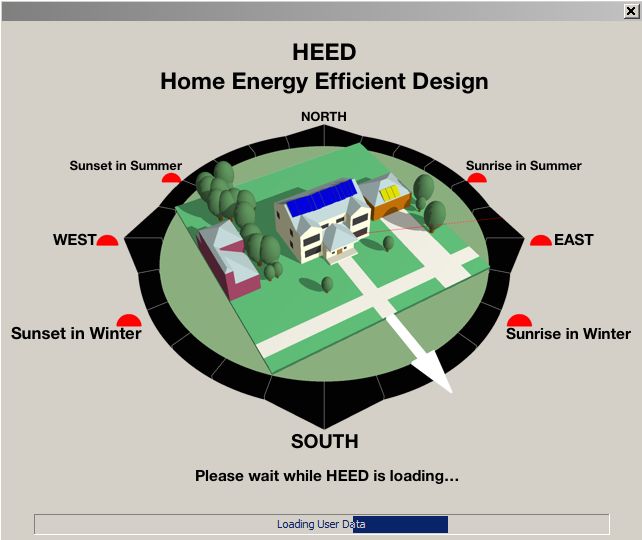
ABSTRACT
Home Energy Efficient Design and Climate Consultant are two user-friendly design tools that
help Californians create more energy efficient homes that take advantage of their local climate
resources. These new tools were developed to help meet the goals of Assembly Bill 32, which
calls for substantial greenhouse gas reductions and the California Public Utilities Commission’s
Big Bold Strategies, which aims for zero net energy new residential construction by 2020. These
tools provided Californians a head start at “Getting to 2020”. Hundreds of thousands of permits
will be issued for new residential construction and for remodeling California’s existing housing
stock before 2020. The objective of this project was to make it possible for California
homeowners, contractors, builders, and architects to become involved from the very beginning
of a project in designing comfortable, energy-efficient homes, rather than leaving everything up
to an energy consultant at the end of the project who would be focusing on code compliance.

These software tools run on personal or Macintosh computers and emphasize graphic output.
Climate Consultant creates various graphic representations of the local climate data and
displays a list of the Top 20 Design Guidelines to best use the climate resources of each specific
location. Home Energy Efficient Design is a “day one” design tool that lets users quickly create
alternative schemes for their home. It uses local climate data to calculate and compare the
performance of each new scheme as it evolves toward a zero net energy home. Passive cooling
and heating strategies can also be incorporated along with solar hot water and solar
photovoltaic systems. The final scheme can be automatically transferred to a certified
compliance program to confirm that it meets the California energy building code. Both
programs are free and when this report was written they collectively had over 120,000 users.

Keywords: HEED, Climate Consultant, home, energy, design, Zero Net Energy, passive, solar,
PV, SHW, California, Energy Code, AB32, 2020

Please use the following citation for this report:

Milne, Murray, Robin Liggett, UCLA Department of Architecture and Urban Design, 2013,
       Getting to 2020: Two Software Tools to Help Californians Design Zero Net Energy
       Homes, California Energy Commission, Publication number: CEC-500-2013-116.

                                                 iii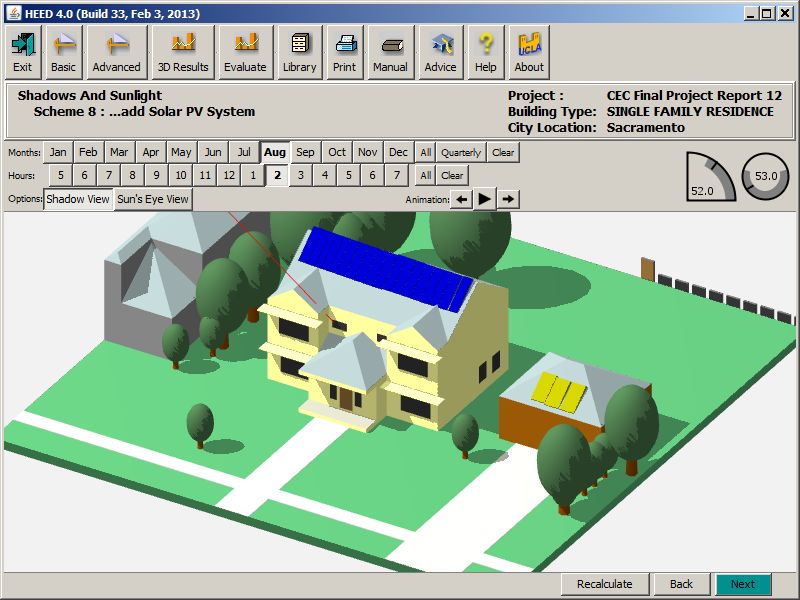
TABLE OF CONTENTS
ACKNOWLEDGEMENTS ...................................................................................................................... I

PREFACE ................................................................................................................................................... II

ABSTRACT ............................................................................................................................................. III

TABLE OF CONTENTS ........................................................................................................................ IV

LIST OF FIGURES ................................................................................................................................... V

EXECUTIVE SUMMARY ........................................................................................................................ 1

       Introduction ........................................................................................................................................ 1

       Project Purpose ................................................................................................................................... 1

       Project Results..................................................................................................................................... 2

       Project Benefits ................................................................................................................................... 2

CHAPTER 1: INTRODUCTION ........................................................................................................... 5

   1.1 Background ....................................................................................................................................... 5

   1.2 Advancements Produced by this Project ...................................................................................... 5

CHAPTER 2: WORKED EXAMPLES OF HEED AND CLIMATE CONSULTANT ................... 7

       2.1 HEED Case Study ........................................................................................................................ 7

       2.2 Climate Consultant Case Study ............................................................................................... 19

CHAPTER 3: UPDATES TO HEED AND CLIMATE CONSULTANT ....................................... 29

   3.1 HEED Upgrades, Expanded Development and Validation..................................................... 29

       3.1.1 Year 1 HEED Upgrades .......................................................................................................... 29

       3.1.2 Year 2 HEED Upgrades .......................................................................................................... 31

       3.1.3 Year 3 HEED Upgrades .......................................................................................................... 33

   3.2 Climate Consultant Upgrades ...................................................................................................... 35

       3.2.1 Year 1 Climate Consultant Upgrades ................................................................................... 35

       3.2.2 Year 2: Climate Consultant Upgrades .................................................................................. 36

       3.2.3 Year 3 Climate Consultant Upgrades ................................................................................... 38

CHAPTER 4: DISSEMINATION AND PROJECT OUTREACH ................................................. 39

   4.1 Energy Design Tools Web Site ..................................................................................................... 39

                                                                             iv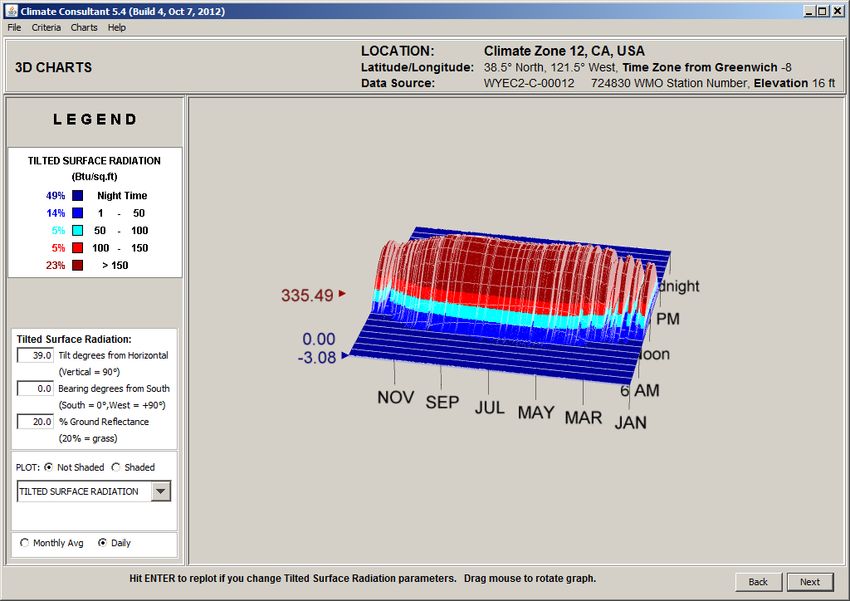
4.2 Technology Transfer: HEED-Climate Consultant Workshops ................................................ 41

       4.2.1 Year 1: ....................................................................................................................................... 41

       4.2.2 Year 2 ........................................................................................................................................ 42

       4.2.3 Year 3: ....................................................................................................................................... 42

   4.3 User Hot Line: Comments on HEED and Climate Consultant ............................................... 42

       4.3.1 HEED User Comments ........................................................................................................... 42

       4.3.2 Climate Consultant User Comments.................................................................................... 45

       4.3.3 Multiplier Effect: User Hot Line Comments from Teachers ............................................. 46

CHAPTER 5: CONCLUSIONS AND RECOMMENDATIONS ................................................... 48

   5.1 Project Outcomes: Benefits to California .................................................................................... 48

   5.2 Recommendations for Future Work ............................................................................................ 48

REFERENCES .......................................................................................................................................... 50

GLOSSARY .............................................................................................................................................. 52

APPENDIX A: HEED VALIDATION TESTS.................................................................................A-1

                                                          LIST OF FIGURES
Figure 1: HEED Download and Installation .......................................................................................... 7
Figure 2: Initial Design Screen.................................................................................................................. 8
Figure 3: Home Energy Rating ................................................................................................................. 9
Figure 4: Home Energy Rating for a Remodeled Home in Sacramento........................................... 10
Figure 5: Shadows and Sunlight ........................................................................................................... 11
Figure 6: Energy Costs............................................................................................................................ 12
Figure 7: Energy Efficient Design ......................................................................................................... 13
Figure 8: Basic Design Screens .............................................................................................................. 14
Figure 9: Air Conditioner Output: 3D Results .................................................................................... 15
Figure 10: Electric Charges under the Evaluate Icon ......................................................................... 16
Figure 11: Climate Specific Design Guidelines .................................................................................... 17
Figure 12: Code Compliance using EnergyPro .................................................................................... 18
Figure 13: Climate Consultant Download and Installation .............................................................. 19
Figure 14: Temperature Range Plot ....................................................................................................... 20

                                                                              v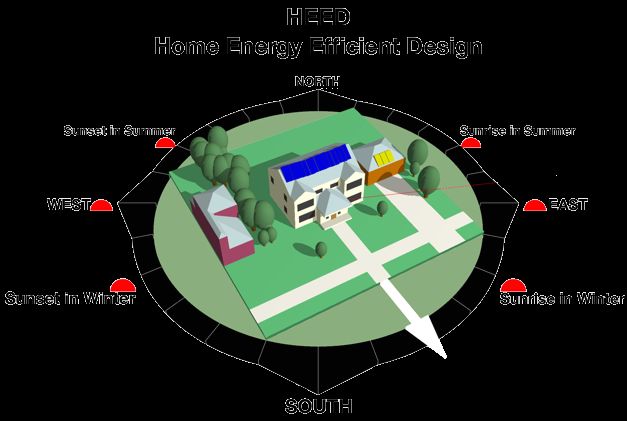
Figure 15: Monthly Diurnal Averages Plot .......................................................................................... 21
Figure 16: 3D Chart of Tilted Surface Radiation ................................................................................. 22
Figure 17: Psychrometric Chart.............................................................................................................. 23
Figure 18: Design Guidelines for the Full Year .................................................................................... 24
Figure 20: Wind Wheel ............................................................................................................................ 26
Figure 21: User Help ................................................................................................................................ 27
Figure 22: Energy Design Tools web site excerpt ................................................................................ 39
Figure 22: Energy Design Tools web site excerpt (continued) .......................................................... 40
Figure 22: Energy Design Tools web site excerpt (continued) .......................................................... 41

                                                                          vi
EXECUTIVE SUMMARY
Introduction
The “Getting to 2020” program refers to the year when all newly constructed homes should be
zero net energy (ZNE) as set forth by the goals of the California Public Utilities Commission
(CPUC) Big Bold Strategies program. With these goals fast approaching, Californians need tools
to enable designing new or existing homes that maximize energy efficiency and lower energy
consumption along with the ability to incorporate on-site renewable energy (solar photovoltaic
and solar domestic hot water systems) to reach ZNE annually.

Project Purpose
The goal of this project was to enhance two existing software design tools. Home Energy
Efficient Design (HEED) is a popular user-friendly graphic software tool that was first
published in 2001. It was intended for intuitive use by architects, contractors, homeowners, and
students to help them design more energy efficient homes. Climate Consultant was first
published in 1988, and shows users the resources of their local climate, identifies the most
appropriate home design resources for passive heating and cooling in that climate, and then
gives a list of 20 detailed design guidelines with accompanying sketches.

There were three specific objectives of the project, each of which had numerous tasks associated
with it.

1. Enhance HEED to help users:

   •  Define any shape home with roofs of any slope and orientation using HEED’s simple
      graphics.
   • Design photovoltaic (PV) and solar domestic hot water (SDHW) systems for their own
      specific home and to graphically click and drag collectors to fit onto their roof.
   • Easily draw in external shading objects like trees and nearby buildings.
   • See a sun’s-eye-view of the building for each hour to check shading from nearby objects.
   • Export a building design file directly into certified code compliance tools such as
      EnergyPro.
   • Validate HEED against EnergyPlus using the Home Energy Rating System (HERS) Best
      Protocol.
   • Add various low energy cooling systems such as evaporative cooling and natural or fan-
      forced ventilation.
   • Add the option of air-to-air heat exchangers such as heat recovery ventilators.
   • Calculate hourly indoor air effective temperatures to evaluate natural ventilation
      effectiveness.
   • Expand computational capabilities for remodeling older pre-code homes.
   • Upgrade H EED to the 2008 Title 24 Code, the latest gas and electric rates, and the latest
      greenhouse gas (GH G) emissions coefficients.
   • Offer a Spanish language version of each new release
2. Enhance Climate Consultant to help users:

   •   Understand the potential energy and comfort resources of their own local climate.

                                               1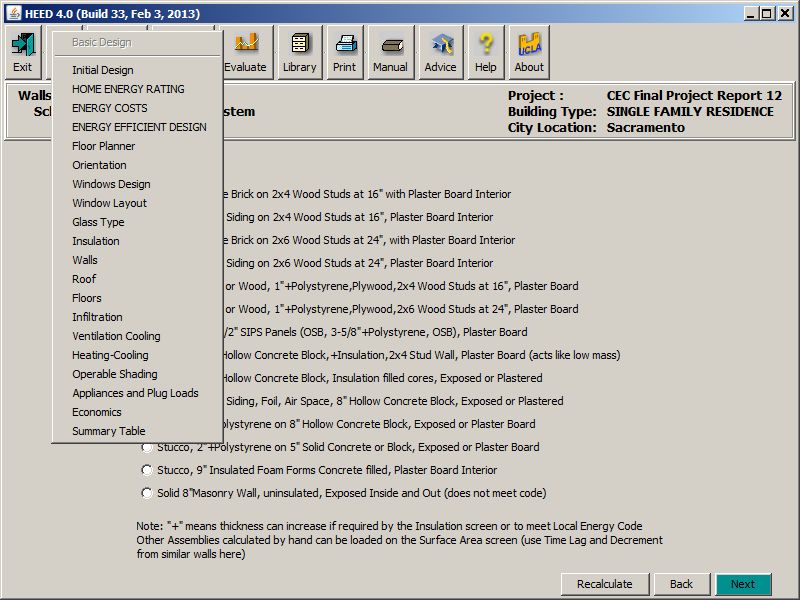
•  Evaluate alternative thermal comfort strategies.
   •  Obtain a list of the top-20 Design Guidelines for their specific home in its specific
      climate.
   • Have the option of trying a web-based version before they download and install the full
      version.
   • See on a sun-shading plot how nearby objects shade windows or PV or SDHW
      collectors.
3. Offer nine workshops on HEED and Climate Consultant throughout the state, and maintain
   user hot lines for each:

    •   Conduct workshops for three utilities: Pacific Gas and Electric (PG&E); Southern
        California Gas (SCG), which is a subsidiary of Southern California Edison; and San
        Diego Gas & Electric (SDG&E).
    •   Conduct a workshop for the American Institute of Architects (AIA).
    •   Staff user hotlines for HEED and Climate Consultant and maintain for three years
        following the completion of this project.
Project Results
Many new features were added to HEED and Climate Consultant, including PV and SDHW
systems and new ways to passively create indoor thermal comfort. HEED also was updated to
support the 2008 Title 24 Codes and Standards by calculating the energy performance of each
scheme compared to a home that meets the 2008 Title 24 code. Technology transfer to the
marketplace was aided by offering nine public workshops throughout California in the three
major investor-owned utility territories: San Francisco for PG&E, Downey for SCG, and San
Diego for SDG&E. This resulted in over 120,000 downloads of the two software programs,
50,000 downloads of HEED and over 70,000 downloads of Climate Consultant. The enhanced
versions of HEED and Climate Consultant were designed to be user friendly enough for non-
professionals but also to produce sophisticated simulations that were validated by the
standards relied upon by energy professionals. These updated tools were compatible with both
personal computers (PCs) and Macintosh computers (Macs). Both programs can be downloaded
free of charge at: www.energy-design-tools.aud.ucla.edu/.

 California energy policy goals are calling for commercial buildings to be much more energy
efficient and for new construction to be ZNE by 2030. Additional tools similar to HEED and
Climate Consultant that target commercial buildings would be helpful in order to reach energy
policy goals without relying solely on energy consultants. HEED and Climate Consultant could
also be updated to support the 2013 Title 24 building energy code and comfort criteria.

Project Benefits
The primary benefit of this project was to give California ratepayers two user-friendly tools that
will help design more energy efficient or potentially ZNE homes. HEED and Climate Comfort
made it possible for all Californians to become involved at the very beginning of their project
rather than having to rely solely on energy consultants to design more energy efficient homes. If
the use of HEED saved an average of just 25 percent of home energy consumption with only a
modest one percent penetration of the new home market, then it would save Californian

                                                2
ratepayers over $24 million in energy costs by 2020. These tools can also help California achieve
its energy policy goals.
3CHAPTER 1:
Introduction
Getting to 2020 is a program that points to the year when all new homes should be Zero Net
Carbon and Zero Net Energy (ZNE). It has been said that we will never get to 2020 without new
tools and techniques. The objective of this project was to develop two software tools that can
“change the market” with respect to designing homes that maximize energy efficiency. These
tools make it possible for all Californians to become involved from “day-one” in the design of
their new or existing home, and not just to rely on energy consultants brought in at the end of a
project to check code compliance. The goal of this project is to push beyond the current business
as usual approaches, to create new alternative paths to show Californians how to lower the end-
use energy consumption of their homes, whether new or existing, and how to greatly exceed
code standards, and even how to reach zero net energy.
1.1 Background
The two design tools that are being expanded as part of this project have been in development
for many years.
HEED (Home Energy Efficient Design) is a popular user-friendly graphic software tool that was
first published in 2001 intended for intuitive use by architects, contractors, homeowners, and
students, to help them design more energy efficient homes. HEED’s advantages have always
been speed and ease of use. Inside HEED is a computation engine called Solar-5 that was first
published in 1987, and has been under continuous development since. It calculates an hourly
heat balance for the building for each of the 8760 hours in a year. It uses standard ASHRAE
equations to account for the time lag of heat flow through opaque walls as well as for the time
lag of internal thermal mass. It calculates indoor air temperatures that can float within the
comfort range. It also integrates loads and energy calculations and in this sense is similar to the
EnergyPlus engine. Over the years HEED has been validated using the ANSI/ASHRAE
Standard 140-2001 and experimentally against a number of test cells as well as occupied
buildings, all of which are documented on the HEED web site (www.energy-design-
tools.aud.ucla.edu).
Climate Consultant is the second design tool that was expanded as part of this project. It was
first published in 1988, and shows users the resources of their local climate and identifies the
most appropriate home design resources for passive heating and cooling in that climate, and
then gives a list of 20 detailed design guidelines with accompanying sketches. It can use any of
the thousands of EnergyPlus weather files published by the US Department of Energy. It is
intended for use at the very beginning of a project, which is the time when design changes are
the least expensive to make and when they will have the greatest impact of the final outcome.
1.2 Advancements Produced by this Project
As a result of this project the new releases of HEED and Climate Consultant have added many
new features.
5These major new advancements have made HEED the first user friendly, whole-building design
tool to allow users to specify a building integrated PV or Solar Hot Water System based on the
work of Bill Beckman for the CEC. This new version of HEED will let users click and drag
collectors/modules onto a 3-D image of their house and pivot it to the eye level of someone
standing on the ground in order to evaluate layout and aesthetics. Then a sun’s eye view lets
them graphically check on shading each hour from nearby buildings or trees. Because HEED
runs an hourly energy balance it can calculate how efficiently these on-site generation systems
match the building loads. Also incorporated into HEED are a number of new passive heating
and cooling options such as various natural and fan-forced ventilation cooling strategies,
evaporative coolers, heat recovery ventilators, and detailed shading from trees and neighbors.
Each design that HEED generates is complete enough to be directly exported to a certified code
compliance tool, such as EnergyPro.
The advancements in the new versions of Climate Consultant incorporate the latest research on
human thermal comfort. It has been argued that Californians must get beyond the idea that the
only definition of thermal comfort is thermostatically controlled still air between 70 and 75
degrees. Climate Consultant now helps to demonstrate that there are other dimensions of
thermal comfort, each of which can be less energy intensive. This is the first design tool to
incorporate the work by Gale Brager (on the Adaptive Comfort Model) and Ed Arens (on how
air motion impacts thermal comfort). These new advancements in Climate Consultant
proceeded in parallel and are nicely cross-linked to HEED, for example, the human thermal
comfort calculator developed in Climate Consultant in the first year was incorporated into
HEED in the second year.
This Project also produced a number of additional advances to help Californians create zero net
energy homes. A web-based version of Climate Consultant, called CClite, was created to allow
beginning users to analyze their local climate without having to download and install the full
program. Workshops were also offered throughout California to give users a hands-on
experience in using these two tools.
All of this was a carefully integrated effort to help Californians understand the resources of
their local climate and to implement alternative ways to create more comfortable, more efficient
homes. The objective of these new design tools is to help Californians reach well beyond Title 24
minimum performance, and instead to see how they can achieve zero net energy.
The team is pleased to report that these two new versions of HEED and Climate Consultant
now have over 120,000 users.
6CHAPTER 2:
Worked Examples of HEED and Climate Consultant
These are some examples of selected screens showing HEED and Climate Consultant in action
to retrofit a 1960s two-story house in Sacramento. These tools are based on the 2008 Title 24
building energy code, and contain California climate data for all 16 zones.
2.1 HEED Case Study
To dow nload H EED go to: www.energy-design-tools.aud.ucla.edu/heed
Figure 1: HEED Download and Installation
HEED is a user-friendly design tool to help Californians design homes that reach zero net
energy (ZNE). This image is taken from HEED’s Orientation screen. It show a hypothetical
house that was created on the Floor Planner screen to show building geometry, plus garages,
trees, neighbors, and paving. To further adjust the site layout the user clicks on the arrow head
and drags the building to its correct orientation. The objective is to create a model that correctly
captures the solar radiation loads on the building’s windows and solar collectors.
7Figure 2: Initial Design Screen
This data input is all that is needed for HEED to generate two homes, in this case for a Brand
New Single Family Home in UCLA’s zip code in Los Angeles. Scheme 1 is the Standard Design
that meets the Title 24 Energy Code, and Scheme 2 is a Proposed Design that HEED’s expert
system creates that also meets the energy code but is More Energy Efficient. For Location the
user can input either a zip code or one of the 16 California Climate Zones, or can download
Energy Plus weather (EPW) data for anywhere in the world. HEED also contain gas and electric
utility rates for utilities such as San Diego Gas and Electric (SDG&E), Southern California
Edison (SCE), and Pacific Gas and Electric (PG&E), and national greenhouse gas production
ratios.
To start this day-one design tool the user only enters four facts. In this case the user selected:
1. Building Type: New Construction, Single Family Detached Home
2. Location: Zip code 90095 for UCLA
3. Floor Area: 2256 sq.ft.
4. Number of Stories: 2
8Figure 3: Home Energy Rating
With the data that was input on the Initial Design screen, HEED’s expert system first creates
Scheme 1 which is a building that meets the 2008 California Energy Code. Then it creates
Scheme 2, a proposed building that is more energy efficient than the 2008 California Energy
Code as shown above. In this case it is 28 percent better than the code building, which almost
meets the Tier 2 reach standard requirements. These two Schemes differ as follows:
Scheme 1 Scheme 2
2008 CODE MINIMUM DESIGN MORE ENERGY EFFICIENT DESIGN
• Square floor plan • Rectangular floor plan facing South
• Equal area of glass on each wall • Most glass on South, minimum on East & West
• Window tinted as required by code • Clear glass on South and North
• No window shading • Overhang shaded South windows
• Stud and stucco walls • High mass walls with exterior insulation
• Raised wood floor over crawlspace • Slab on Grade floor
• 0.5 Air change infiltration • Whole House Fan, 10 air changes/hour
• Lights are mostly incandescent • Lights are half fluorescent
Both schemes have the same:
Floor Area, Window Area, Climate, Occupancy Schedules
9Figure 4: Home Energy Rating for a Remodeled Home in Sacramento
In this example HEED again created Scheme 1, a 2256 sq. ft. home that meets the 2008 California
building energy code. Instead of new construction, the user selected “Remodel Your Home
within Existing Walls,” and then input the year of original construction. HEED’s expert system
then created Scheme 2 that represents a typical existing Original Home built in 1978.
Scheme 3, the 1978 Home as Built, was a copy of Scheme 2 to which the user adjusted things
like moving some windows, creating a pitched gable roof, and adding a porch
Scheme 4, Remodel of 1978 Home, was a copy of Scheme 3, adding attic and underfloor
insulation and adding code compliant windows.
Scheme 5, Deep Retrofit, is a copy of scheme 4 but tried super insulating the attic and
underfloor, then stripping the exterior walls and adding insulation plus exterior foam.
Scheme 6, Best Heat Pump, replaced the older furnace and air conditioner with seasonal energy
efficiency ratio (SEER) of 20 and heating seasonal performance factor (HSPF) of 9.5.
Scheme 7 added a Solar Hot Water (SHW) system
Scheme 8 added a Photovoltaic (PV) System with a 3.9 kilowatt (kW) capacity utilizing 18
panels that will fit on the roof and the building has almost reached ZNE.
10Scheme 9 added an Oversized PV System (7.9 kW with 36 panels) and the building is a net
energy producer, but the floor plan showed that there were too many panels to fit the roof.
Figure 5: Shadows and Sunlight
This screen shows how the remodeled home might look after the Solar PV Panels have been
added to the roof. The SHW system is mounted on the garage. In this case it shows the shadows
at the hottest time of the year, in August at 2p.m. Note that almost all of the windows are fully
shaded.
A neighbor was added to the west and paving was added to better define the site. Trees of
various heights were added which will affect building performance if they shade windows or
solar collectors. Homes with various geometries can be easily input using the fill-in-the-squares
technique on the Floor Planner screen. Roof geometry can be automatically created for flat,
gable, or shed roofs. The Roof screen lets user choose fan or naturally vented attics with
shingles, tiles, or a cool roof.
This example screen also illustrates how windows and doors are initially delivered to the edge
of the site. Notice that the north windows and the north door are still lined up along the north
curb. If desired the user could have dragged them onto the north wall, however the HEED
model calculates building energy performance whether they are left at the curb or placed on the
wall. There is an exception if these windows had been placed on a wall where they were shaded
by the large tree during some hours, the performance might have been slightly different.
11Figure 6: Energy Costs
This screen is another way HEED graphically shows the user the comparative performance of
various schemes. In this case showing Energy Use Intensity (EUI) in kBTU/sq ft, which is just
one of the eight different variables that could be displayed. Notice that in the Total bar chart
(right) for Scheme 8 the amount of Electricity and Fuel above the line is roughly equal to the
total amount of onsite generated PV and Solar Hot Water below the line. Thus when all these
are added together it shows that this Scheme 8 is very close to a Zero Net Energy Home, in this
case the Net Total Site Energy consumption is only 3.26 kBTU/sq ft, which is only 8 percent of a
home that meets 2008 building energy code (Scheme 1). When the user moves the cursor onto
the Scheme 8 bar the following appears:
This chart shows that even though this original 1978 home (Scheme 2) uses double the energy of
a home that meets 2008 building energy code (Scheme 1), it could be retrofitted into a home that
performs at ZNE using readily available conventional technology. This shows that it’s entirely
possible for all newly constructed houses to be ZNE by 2020 including existing homes as
Scheme 8 depicts.
12Figure 7: Energy Efficient Design
This screen shows HEED users another type of information about the performance of their
various schemes. In this case the green areas show the home’s passive performance when the
home uses no heating or cooling energy. This screen shows that the occupants are comfortable
all year long, because there are no black bars. Notice that for Schemes 5 to 9 the number of red
and blue hours when the furnace and air conditioner were used is unchanged, but the prior
screens showed that it takes less and less energy to keep the building within the comfort range.
This screen also gives a list of the Energy Efficient Design Strategies, in this case for
Sacramento’s Climate Zone 12. Notice that all these are met except Strategy 2, because the
original 1978 home was assumed to have a raised floor, however the deep retrofit might have
added a tile or slate floor or an extra layer of drywall to the ceiling or some other way to add
thermal mass to the interior. Strategy 10 is also questionable because this house looks to be
rather large, however in this example the square footage was set at the average, 2256 sq ft.
13Figure 8: Basic Design Screens
If the user clicks on the Basic Design icon on the top row, this list of options will drop down,
and users can select any one of them depending on their decision making process. This list
includes various performance graphic screens and various lists of options for Glass Type,
Insulation, Walls, Roof, Floors, etc. and even Economic Payoff and Performance Summary
Tables. The HEED expert system will have selected appropriate options for all of the variables
in each of these screens depending on many different factors including the local code
requirements and the local climate. As users become more comfortable with HEED they might
elect to change variables on any of the various Basic Design options as shown in the screenshot
above. If the user clicked on the Advanced Design icon on the top row, a list of an additional
dozen items will appear, which will allow the user to modify the design in more detail by
changing specific numeric values of every aspect of the building design. For example the user
can change the U-factor for each individual window or each different wall orientation.
14Figure 9: Air Conditioner Output: 3D Results
Once advanced users become more familiar and comfortable with HEED there are many more
graphic screens available which will help explain building energy performance. In this example,
the three-dimensional (3D) results plots shown above highlight the amount of Air Conditioner
Output required to maintain indoor comfort conditions, for Scheme 2 the Original Home (on
the right) and for Scheme 8 adding Solar PV (on the left). Each of these plots shows the average
for every hour of every month. Notice that on the left side of each plot is the Maximum value
which shows that the Original 1978 house used almost 70 kBTU of cooling on summer
afternoons, while the Scheme 8 design used only about 17 kBTU in July at 5p.m. This plot shows
that the air conditioner in Scheme 8 could be much smaller and would run fewer hours.
HEED also plots indoor air temperatures so the user can see how comfort conditions would
change if the air conditioner was eliminated, for example.
These plots prove quite useful as the user tries out other design revisions to create a more
energy efficient building design.
15Figure 10: Electric Charges under the Evaluate Icon
HEED contains residential electric rates for each of California’s utilities as shown above. This
example for Scheme 8, a very energy efficient building that uses an electric heat pump, has 3.91
kW of PV and so uses very little net electricity in the summer but reaches into Tier 2 in the
winter. Notice that the PV system generates onsite power that is worth $962.60, leaving the
homeowner with a net cost of only $258.84 per year.
HEED uses the same algorithm to calculate PV performance as used by the New Solar Homes
Partnership (CECPV). It also lets users assemble systems with any of the approved inverters or
panels. HEED also allows users to modify the electric utility rates if they want to try different
energy scenarios.
Similarly, the Fuel Charges screen also shows the value of solar heated domestic hot water that
is generated on site, and shows how this would reduce Net Fuel Cost.
16Figure 11: Climate Specific Design Guidelines
This screen provides a direct link between HEED and Climate Consultant. By clicking on the
large green button on the bottom of this screen the user will be taken to Climate Consultant
which will automatically run an analysis for the same EPW climate data that HEED is using, in
this case California’s Climate Zone 12.
Climate Consultant will show a list of the top 20 Design Guidelines most appropriate for this
climate. If the user clicks on any one of these guidelines a graphic image will appear showing
various design options for this guideline. When all 20 images are assembled, a very rough idea
will emerge of the kind of house that is most appropriate for this particular climate. This is not a
complete building by any means, but is like a set of snapshots of various small scale and large
scale aspects of the building (in reality this is still a work in progress, but many users have
found all this helpful, surprising, and even insightful).
17Figure 12: Code Compliance using EnergyPro
HEED was created to be a day-one design tool that launches with only very minimum
information about the project, which is the opposite of a code compliance tool that needs the
final fully defined building and only has to output Yes or No, whether or not the building meets
the energy code. California currently has three approved residential compliance computer
programs. Because one of these, EnergyPro 5.1, accepts input files defining the building that are
written in Extensible Markup Language (XML), the team added an automatic feature to HEED
that writes out any selected scheme in XML to be directly imported into EnergyPro for a code
compliance check.
HEED lets Californians create multiple schemes, graphically displaying whether the design is
becoming progressively closer and closer to zero net energy. HEED starts with very little user
supplied information about the project, and then its expert system uses the climate data, the
energy code, and other architectural design heuristics to fill in everything else. The user can
work on up to nine different schemes at the same time, using the design guidelines to try
different alternatives and combinations, and can look at HEED’s graphic outputs to see if the
building’s performance is improving. Finally, when the best scheme has been created the user
can load it directly into EnergyPro (by selecting the third button on this screen).
Once in EnergyPro, the user can print out code compliance form (form CF-1R) that will show if
the building complies and by what margin, give the Home Energy Rating System (HERS)
rating, and will calculate the annual Time-Dependent Valuation (TDV) energy usage. Thus
HEED can in effect function as a user-friendly front end to this certified code compliance
program.
182.2 Climate Consultant Case Study
Climate Consultant (CC) is a free user-friendly design tool to help Californians design homes
that take advantage of the resources of the local climate.
To download Climate Consultant go to: www.energy-design-tools.aud.ucla.edu
Figure 13: Climate Consultant Download and Installation
The image above is Climate Consultant’s first screen that outlines some of the recent features
that have been added and explains that when in doubt about what to do next, click the Next
button. Data for Climate Consultant in EPW format is provided for California’s entire 16 climate
zones or else can be downloaded automatically for thousands of other locations around the
world from the U.S. Department of Energy Climate Data site.
19Figure 14: Temperature Range Plot
.
This is the most basic chart in Climate Consultant and shows us a great deal of information
about dry bulb temperatures.
This example for Sacramento shows how Temperature is distributed over the 8760 hours of the
year. The California building energy code assumes that the indoor comfort range is between 70°
and 75° so it is easy to see that much of time it is uncomfortable outdoors in Sacramento, either
too warm or too cool. For example, notice that the highest recorded temperature exceeds 100°F
in July. However, the average daily range (yellow) implies that it usually falls below 70°F at
night, which means that a home constructed with enough thermal mass and ventilated at night
could substantially reduce the cooling load the following day. In winter, the average daily
temperature range is only about 15 degrees which implies overcast conditions, thus there will
be days when there is not enough passive solar gain to directly heat the building suggesting (as
the above chart shows) that supplemental heating will be needed in Sacramento. However, as
the Design Guidelines suggests, a compact, well insulated, tightly sealed and carefully
ventilated home will minimize the amount of the supplemental heating energy required.
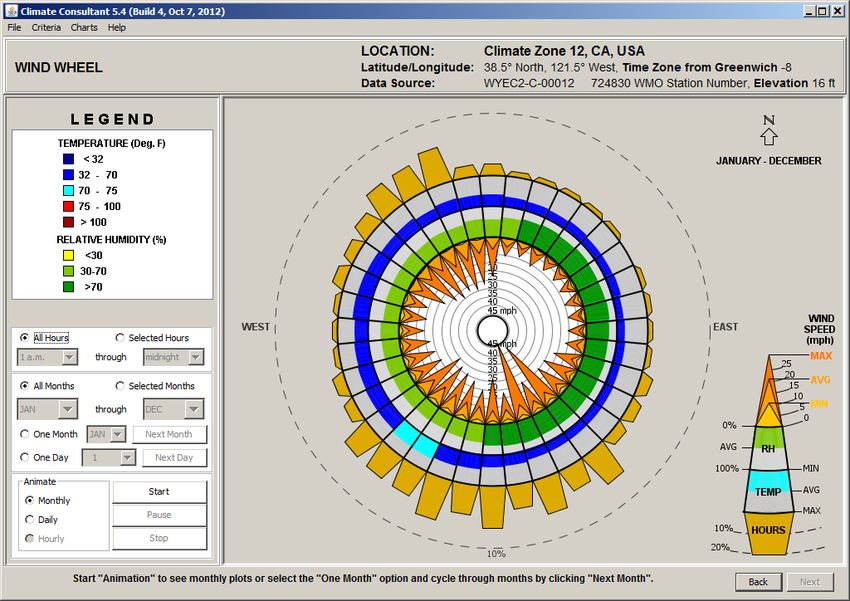
20Figure 15: Monthly Diurnal Averages Plot
This is an example of one of the more complex graphic climate analysis plots. It shows how a
number of different factors interact and how they change over the 24 hours of each month. The
yellow areas show the amount of direct solar radiation peaking at noon for each month in
Sacramento. If you were considering adding PV to the roof of your building, this plot shows
that most of the PV power output would occur in summer (when air conditioning loads will be
the highest).
The red lines are dry bulb temperatures peaking in the afternoon, with the lowest values
occurring just before sunrise. The lower dark red lines are wet bulb temperatures. The fact that
they are very close together in January means conditions are very humid and probably overcast,
but the fact that they are far apart in July means that conditions are dryer with probably clearer
skies. The light blue area shows the dry bulb temperatures for every hour of the month, again
repeating the same day/night pattern and showing the range of highs and lows.
21Figure 16: 3D Chart of Tilted Surface Radiation
In Climate Consultant there is a whole set of charts of climate data plotted in 3 dimensions to
show the 24 hours of each day for all 365 days of the year. This example is a plot of Total
Radiation on a Tilted Surface, such as a solar collector, in this case tilted up at 39 degrees. The
radiation would peak in the summer if the surface was lying flat horizontally, but would peak
in the winter if the surface was hanging vertically. However, if a surface is tilted up at an angle
equal to local latitude, then the radiation on it will be approximately equal all year long. This is
true for most of the year for Sacramento, CA, which is depicted in the screen shot above, except
in the winter when useful radiation is eliminated for many days (due to stormy and overcast
skies).
Other 3D Plots are available including dry bulb temperature, wet bulb temperature, wet bulb
depression, relative humidity, wind speed, global horizontal radiation, direct normal radiation,
global illumination, direct normal illumination, and sky cover.
22Figure 17: Psychrometric Chart
The Psychrometric chart is the most powerful design tool in Climate Consultant. The case above
shows one dot for the outdoor temperature/humidity on each hour of the year in Sacramento.
The blue outline encloses comfortable conditions. The legend lists various building Design
Strategies with the percentage of time they could produce comfortable indoor conditions. This
list is automatically generated based on the attributes of this particular climate, but the user can
change it if desired. Notice that a High Thermal Mass building with Night Ventilation could
produce comfortable conditions for 15.4 percent of the hours when it is too warm outdoors.
When it is too cool outdoors the Design Strategies legend shows that for 35.5 percent of the time
Internal Heat Gain from things like lights, appliances, and occupants will be enough to
eliminate the need for supplemental heating. However, for 37.9 percent of the time a heating
system will be needed.
Note that these numbers are estimated by Climate Consultant based on the assumption of
typical home construction that meets the 2008 code. However, the Design Guidelines list (see
below) will give other options that can create an even more efficient design, and design tools
like HEED will allow these options to be tested in an actual building design, along with a more
efficient heating, ventilation, and air conditioning (HVAC) system and onsite generation from
PV and SHW.
23This screen might look complex but a graphic tutorial has been developed that explains this
chart and each of the design strategies. This Flash tutorial is available on the Energy Design
Tools web site.
Figure 18: Design Guidelines for the Full Year
This example shows a set of energy efficiency Design Guidelines. This list was selected based on
the attributes of Sacramento’s unique climate and the list of Design Strategies describing the
building design as given on the Psychrometric Chart. It is organized so that the first items are
the most important and have the greatest effect on building performance.
In this case, for a climate responsive residential building in Sacramento, it confirms the value of
internal sources of heat gain, night time ventilation, south facing solar windows for solar gain,
high mass interior surfaces, high efficiency HVAC equipment, and creating a small compact
floor plan.
It should be emphasized that when the climate data for other locations in California are
analyzed by Climate Consultant, it could create a totally different list of Design Guidelines,
many of which are the exact opposite of the ones on this list.
24Figure 19: Example of Sketches for each Design Guideline
If you click on any one of the design guidelines on the prior list, Climate Consultant will display
a sketch or graphic image to help illustrate the application of this guideline and how it might
influence building design.
In this case the user clicked on guideline 39, which suggests that in this climate night ventilation
will help cool off the house and can store up “cool air” for the next day in high mass surfaces.
This cool night air can be brought in by cross ventilation if there is enough wind velocity and if
there are openings on adjacent sides of the home, or at least on adjacent walls. However another
option would be to install a whole house fan to exhaust air out of the house at night, often into
the attic space to help cool this unconditioned zone. There are of course many other ventilation
strategies that might include balanced ventilation systems (that insure that inlet and outlet air is
equal), heat recovery ventilators (HRV), energy recovery ventilators (ERVs), and traditional
stack ventilation (that uses high ceilings and vertical openings with rooftop vents).
Note that in HEED if ventilation cooling is selected, any of these options can be tested in the
context of the specific building design and the actual hour by hour climate data.
25Figure 20: Wind Wheel
This diagram is unique to Climate Consultant. It shows the correlation of a number of different
variables. It displays for each wind direction the wind velocity (triangles), wind frequency of
occurrence (brown bars), average dry bulb temperature (red to blue ring), and relative humidity
(yellow to green ring). In this example, most of the wind comes from the northwest or generally
southerly, but seldom from other directions. However, wind data is notoriously idiosyncratic
and is extremely dependent on the specific location where the weather station is located. This is
usually at an airport in an open field or on top of a high-rise building, in contrast to the site
where the particular home is located that is influenced by nearby structures, trees, or landforms.
Note that this data is for the official California Climate Zone 12 where Sacramento is located,
but there are three other EPW climate data sets available for Sacramento, one at the Municipal
Airport, one at the Metropolitan Airport, and an older one at Mather Field. The Climate Zone 12
data seems to be based on data taken at the Metropolitan airport. It is reassuring to note that the
wind data is very similar for all four locations. The same is true of the psychrometric chart data.
Also, the selected list of Best Design Strategies is identical in three of the four data sets, while
the fourth set only adds two different design guidelines.
The Wind Wheel also can be animated to show how the data changes hourly over each day or
monthly over the full year. Any individual hour, day, or monthly average can be displayed.
26Figure 21: User Help
Every screen in Climate Consultant is provided with additional explanations and definitions of
terms whenever the user clicks on Help on the top line. The title of every screen is listed and
wherever there is a “+” sign the user can click to see additional Help screens. In the case above,
27additional screens are shown that offer more information about how to select units, open EPW
files, design guidelines, and wind data.
28CHAPTER 3:
Updates to HEED and Climate Consultant
This project was made up of separate projects with multiple specific technical tasks.
Note that sections below headed “In addition” are the 26 tasks or products that were added
above and beyond what were specified in the original contract Scope of Work. Note the word
“screen” below refers to the a specific graphic user interface screen in either HEED or Climate
Consultant plus the required computational algorithm development and software required to
implement this set of graphics or options. (Note also in the following chapter that capitalized
phrases are the title of screens in HEED or Climate Consultant or are chapter headings in
reference documents.)
3.1 HEED Upgrades, Expanded Development and Validation
This project upgraded HEED to include several new capabilities. As noted above, the
functionality for HEED was expanded much more than originally anticipated over a three year
period. Upgrades for each year of this effort are highlighted below.
3.1.1 Year 1 HEED Upgrades
Subcontractors Bill Beckman and David Bradley provided the algorithms for calculating the
performance of PV systems and SHW systems. Bill Beckman and David Bradley were also the
authors of fChart which is used by the California Energy Commission (Energy Commission) for
calculating the hourly PV performance in the CECPV software. This software was used to
validate HEED’s PV performance calculations.
A new PV Power Design screen was added to input PV system parameters.
In addition, a hot link was added to this screen for direct connection to the CECPV web site to
encourage users to download and install a current copy of CECPV.
In addition, the capability was added to read and integrate the most recent .LKT files that
contain the Energy Commission’s current approved lists of Inverters and PV panels (note that
HEED has a built-in Example Panel and Example Inverter if the user elects to not download
CECPV).
Solar Domestic Hot Water System (SDHW) calculation screen was added (based on algorithms
provided by subcontractors Bill Beckman and David Bradley).
In addition, a new Solar Collector Data screen was added with a hot link for direct connection
to the Solar Ratings Certification Council (SRCC) web site data base.
In addition, a new Water Heating screen was added under the Advanced Design icon, to allow
the design of a Storage Tank or Instantaneous Auxiliary Powered Non-Solar Water Heating
29System. This also would be the system that provides the back-up water heating for a SHW
systems.
In addition, a new AHRI Water Heater screen has been added, accessible from the Water
Heating screen that allows manual input of the eleven different variables required for
simulating water heating tank performance using the fChart method. It also contains a hot link
to the Air Conditioning Heating and Refrigeration Institute (AHRI) web site where data is
available for thousands of water heaters.
On the Floor Planner or the Shadows and Sunlight graphic screens, users can drag and drop PV
or SDHW collectors from the curb onto sloped roofs or onto mounting racks on flat roofs,
allowing users to visually evaluate the design of roof surfaces and to check if sufficient area is
actually available.
Roof Geometry Options were increased in HEED to include graphic representation of various
roof shapes, types, slopes, orientations, and materials. For example, the Floor Planner screen
now allows users to change roof shape from flat to hip, gable, or shed facing any direction,
while the Envelope screen now allows roof slope to be changed to any angle. The Roof Basic
Design screen allows ten pre-designed construction options, or the Advanced Surface Area
Design screen allows the user to enter any performance data for many other roof options.
In addition, five optional Cool Roofs were added to the Basic Roof Design screen, while
Emissivity and Absorptivity can be modified on the Advanced Envelope Design screen.
The new Shadows and Sunlight screen allows users to add a Graphic Representation of Exterior
Objects that might shade collectors or windows (such as trees, neighboring buildings, wing
walls, porches, balconies, or fins and overhangs), and then to run an hourly time lapse video to
see the progress of shading hourly and seasonally across the building and site.
HEED was upgraded to simulate 2008 code compliant homes for each of California’s sixteen
climate zones and for selecting construction types from the ACM (Alternative Calculation
Methods Reference Manual). To minimize download size and increase computational speed,
only the most common ACM construction types were included in the Basic Design options.
Since HEED is a design tool and not a certified compliance tool, the Ventilated Attic Model from
the 2005 ASHRAE Handbook was used in lieu of the Attic Unconditioned Zone Model. Note
that the desired technical specifications of any construction type in the 2008 ACM Reference
Appendix can be manually input on the Surface Area screen. By using the newly created link to
EnergyPro, users can evaluate the performance of their building using the Attic Unconditioned
Zone Model if desired, and also in EnergyPro they can test all of the other ACM construction
types.
30You can also read