United in Science 2021 - A multi-organization high-level compilation of the latest climate science information - World Meteorological ...
←
→
Page content transcription
If your browser does not render page correctly, please read the page content below
United in Science 2021
  A multi-organization high-level compilation of the latest
                climate science information
This report has been compiled by the World Meteorological Organization (WMO) on behalf of the United Nations Secretary-
General to bring together the latest climate science related updates from a group of key global partner organizations: WMO, Global
Carbon Project (GCP), Intergovernmental Panel on Climate Change (IPCC), United Nations Environment Programme (UNEP),
World Health Organization (WHO), the Met Office (United Kingdom, UK) and the jointly sponsored WMO/Intergovernmental
Oceanographic Commission (IOC) of UNESCO/International Science Council (ISC) and World Climate Research Programme
(WCRP). The content of each chapter is attributable to each respective entity.

The report is available electronically at: public.wmo.int/en/resources/united_in_science

Cover Illustration: Flooding after heavy rainfall in Koblenz, Deutsches Eck, a headland where the river Mosel joins the Rhine river.
Adobe stock/EKH-Pictures.

Lead authors and contributors:
Overall coordination and editing by WMO: Jürg Luterbacher, Laura Paterson, Rosa von Borries, Kate Solazzo, Rose Devillier and
Sylvie Castonguay (Editor).

Greenhouse Gas Concentrations in the Atmosphere (WMO Global Atmosphere Watch): Oksana Tarasova (WMO), Alex Vermeulen
(Carbon Portal, Lund University, Sweden), Claus Zehner (European Space Agency, Italy), Zoe Loh (Commonwealth Scientific and
Industrial Research Organisation (CSIRO), Australia)

Global GHG Emissions and Budgets (GCP): Josep G Canadell (CSIRO, Australia), Robbie Andrew (Centre for International Climate
and Environmental Research (CICERO), Norway), Philippe Ciais (Laboratoire des Sciences du Climat et de l’Environnement
(LSCE), France), Eric Davidson (University of Maryland Center for Environmental Science, USA), Steven Davis (University of
California, Irvine (UCI), USA), Pierre Friedlingstein (University of Exeter, UK, and WCRP Joint Scientific Committee), Robert B.
Jackson (Stanford University, USA), Corinne Le Quéré (University of East Anglia, UK), Glen Peters (CICERO, Norway), Rona
Thompson (Norwegian Institute for Air Research (NILU), Hanqin Tian (Auburn University, USA), Zhu Liu (Tsinghua University,
China)

Global Climate in 2017-2021 (WMO): John Kennedy (Met Office, UK), Atsushi Goto (Japan Meteorological Agency (JMA)), Stephan
Rösner (DWD, Germany’s National Meteorological Service), Peter Bissolli (DWD), Omar Baddour (WMO), Cyrille Honoré (WMO)

Highlights of the IPCC Sixth Assessment Report (AR6): The Physical Science Basis (IPCC): Valérie Masson-Delmotte (IPCC
Working Group I (WGI) co-chair)

Heatwaves, Wildfires and Air Pollution: Compounding and Cascading Climate Hazards to Health (WHO/WMO): Rosa von Borries
(WMO), Diarmid Campbell-Lendrum (WHO), Robert Stefanski (WMO)

Sea-level and Coastal Impacts (WMO/IOC/ISC): Robert J. Nicholls (University of East Anglia, UK, and WCRP), Sarah Grimes
(WMO), Michael Sparrow (WCRP – WMO/IOC/ISC)

Global Climate in 2021–2025 (WMO Global Annual to Decadal Climate Update - Met Office (UK), WCRP, WMO): Adam Scaife (Met
Office, UK), Leon Hermanson (Met Office, UK), Doug Smith (Met Office, UK)

Emissions Gap (UNEP): Anne Olhoff (UNEP DTU (Technical University of Denmark) Partnership), John Christensen (CONCITO
(Denmark’s Climate Thinktank), Joeri Rogelj (Imperial College London, UK; International Institute for Applied Systems Analysis,
Austria), Maarten Kappelle (UNEP), Jian Liu (UNEP).
Foreword by Antonio Guterres, Secretary-General of the United Nations
This is a critical year for climate action. This report by the   which collectively cut global
United Nations and global scientific partner organizations       emissions by 45 per cent by
provides a holistic assessment of the most recent climate        2030, compared to 2010 levels.
science. The result is an alarming appraisal of just how
                                                                 We need a breakthrough on
far off course we are.
                                                                 protecting people and their
We are still significantly off-schedule to meet the goals        livelihoods, with at least half
of the Paris Agreement. This year has seen fossil fuel           of all public climate finance
emissions bounce back, greenhouse gas concentrations             committed to building resilience
continuing to rise and severe human-enhanced weather             and helping people adapt. And
events that have affected health, lives and livelihoods          we need much greater solidarity,
on every continent. Unless there are immediate, rapid            including full delivery of the long-
and large-scale reductions in greenhouse gas emissions,          standing climate finance pledge
limiting warming to 1.5°C will be impossible, with               to help developing countries
catastrophic consequences for people and the planet on           take climate action. There is no
which we depend.                                                 alternative if we are to achieve
                                                                 a safer, more sustainable and
This report is clear. Time is running out. For the               prosperous future for all.
2021 United Nations Climate Change Conference in
Glasgow, known as COP26, to be a turning point, we
need all countries to commit to net zero emissions by
2050, backed up by concrete long-term strategies, and
enhanced Nationally Determined Contributions (NDCs)              A. Guterres, Secretary-General UN

Foreword by Prof. Petteri Taalas, Secretary-General of the World Meteorological Organization
Throughout the pandemic we have heard that we must               I would like to thank the many
“build back better” to set humanity on a more sustainable        expert teams involved in creating
path, and to avoid the worst impacts of climate change on        this report – most notably from
society and economies. This report shows that so far in          Global Carbon Project, the
2021, we are not going in the right direction.                   Intergovernmental Panel on
                                                                 Climate Change, World Health
Greenhouse gas concentrations – which are already                Organization, UN Environment,
at their highest levels in three million years – have            the World Climate Research
continued to rise, reaching new record highs this year.          Programme, and the Met Office
Fossil fuel emissions in many sectors are back at the            (UK) – for their collaboration,
same or at even higher levels than before the pandemic.          uniting the climate science
Global temperatures in 2017–2021 are among the                   community to deliver the latest
warmest of any equivalent period since meteorological            essential information, in these
measurements, with warming evident in many climate               unprecedented times.
indicators such as sea ice, glacier melt and sea-level rise.

United in Science 2021 delivers on its mission, to present
the very latest scientific data and findings related to
climate change, to inform policy and decision-makers.
This work depends on a global network of scientists and
institutions, and on the critical underpinning observation,
modelling and research infrastructure, which we must be          Prof. P. Taalas, Secretary-General WMO
supported to meet the demands of today’s challenges.
Key Points

Greenhouse Gas Concentrations in the Atmosphere � WMO GAW

    •   Concentrations of the major greenhouse gases – CO2, CH4, and N2O –
        continued to increase in 2020 and the first half of 2021.

    •   Overall emissions reductions in 2020 likely
        reduced the annual increase of the
        atmospheric concentrations of long-lived
        greenhouse gases, but this effect was
        too small to be distinguished from
        natural variability.

    •   Reducing atmospheric
        methane (CH4) in the short
        term could support the
        achievement of the Paris
        Agreement. This does
        not reduce the need
        for strong, rapid and
        sustained reductions
        in CO2 and other
        greenhouse gases.

Global GHG Emissions and
Budgets � GCP

    •   Fossil CO2 emissions – coal,
        oil, gas and cement – peaked at
        36.6 GtCO2 in 2019, followed by
        an extraordinary drop of 1.98 GtCO2
        (5.6%) in 2020 due to the COVID-19
        pandemic.

    •   The drop in CO2 emissions is temporary, and
        based on preliminary estimates, from January–July 2021
        global emissions in the power and industry sectors were already at the
        same level or higher than in the same period in 2019. Emissions from road transport remained about 5% lower.

    •   Recent emissions trends of N2O, the third most important greenhouse gas after CO2 and CH4, exceed the most greenhouse
        gases intense socioeconomic pathways used to explore future climate change.

Global Climate in 2017�2021 � WMO

    •   The global average mean surface temperature for the period from 2017–2021 is among the warmest on record, estimated
        at 1.06 °C to 1.26 °C above pre-industrial (1850–1900) levels.

    •   In every year from 2017 to 2021, the Arctic average summer minimum and average winter maximum sea-ice extent were
        below the 1981–2010 long term average. In September 2020, the Arctic sea-ice extent reached its second lowest minimum
        on record.

    •   2021 recorded devastating extreme weather and climate events – a signature of human-caused climate change has been
        identified in the extraordinary North American extreme heat and west European floods.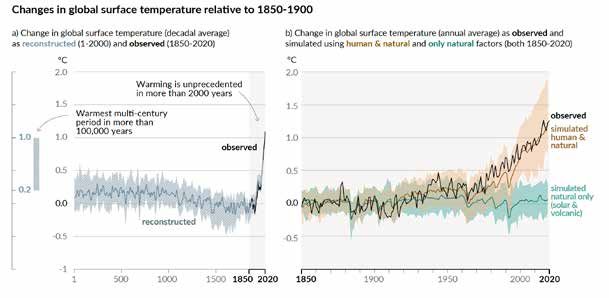
Key Points

Highlights of AR6: The Physical Science Basis � IPCC

    •   It is unequivocal that human influence has warmed the atmosphere, ocean and land. Widespread and rapid changes in the
        atmosphere, ocean, cryosphere and biosphere have occurred.
    •   The scale of recent changes across the climate system as a whole and the present state of many aspects of the climate
        system are unprecedented over many centuries to many thousands of years.
    •   Human-induced climate change is already increasing the frequency and intensity of many weather and climate extremes in
        every region across the globe.

Heatwaves, Wildfires, and Air Pollution: Compounding and Cascading Climate Hazards to Health � WHO/WMO
    •   Rising temperatures are linked to increased heat-related mortality and work impairment, with an excess of 103 billion
        potential work hours lost globally in 2019 compared with those lost in 2000.
    •   COVID-19 infections and climate hazards such as heatwaves, wildfires and poor air quality combine to threaten human
        health worldwide, putting vulnerable populations at particular risk.
    •   COVID-19 recovery efforts should be aligned with national climate change and air quality strategies to reduce risks from
        compounding and cascading climate hazards, and gain health co-benefits.

Sea-level Rise and Coastal Impacts � WCRP (WMO/IOC/ISC)

    •   Global mean sea levels rose 20 cm from 1900 to 2018 and at an accelerated rate of 3.7+0.5 mm/yr from 2006 to 2018.
    •   Even if emissions are reduced to limit warming to well below 2 °C, global mean sea level would likely rise 0.3–0.6 m by
        2100 and could rise by 0.3–3.1 m by 2300 (relative to 1995-2014).
    •   If greenhouse emission continue to rise unabated global mean sea level will likely rise 0.6–1.0 by 2100 (relative to 1995-
        2014) and, with less confidence, range from 1.7–6.8 m (perhaps more) by 2300 with further large rises continuing beyond.
    •   Even with climate stabilization, adaptation to this residual rise will be essential – adaptation strategies are needed where
        they do not exist – especially in low-lying coasts, small islands, deltas and coastal cities.

Global Climate in 2021�2025 � WMO Global Annual to Decadal Climate Update � Met Office/WMO/WCRP

    •   Annual global mean near-surface temperature is likely to be at least 1 °C warmer than pre-industrial levels (defined as the
        1850–1900 average) in each of the coming five years and is very likely to be within the range 0.9 °C to 1.8 °C.
    •   There is a 40% chance that average global temperature in one of the next five years will be at least 1.5 °C warmer than
        pre-industrial levels but it is very unlikely (~10%) that the 5-year mean temperature for 2021–2025 will be 1.5 °C warmer
        than pre-industrial levels.
    •   Over 2021–2025, high latitude regions and the Sahel are likely to be wetter than the recent past.

Emissions Gap � UNEP

    •   Five years after the adoption of the Paris Agreement, the emissions gap is as large as ever: global emissions need to be 15
        GtCO2e lower than current unconditional Nationally Determined Contributions (NDCs) imply for a 2 °C goal, and 32 GtCO2e
        lower for the 1.5 °C goal.
    •   The COVID-19 crisis offers only a short-term reduction in global emissions. It will not significantly reduce emissions by 2030
        unless countries pursue an economic recovery that incorporates strong decarbonization.
    •   The increasing number of countries committing to net-zero emission goals is encouraging, with about 63% of global
        emissions now covered by such goals. However, to remain feasible and credible, these goals urgently need to be reflected
        in near-term policy and in significantly more ambitious NDCs for the period to 2030.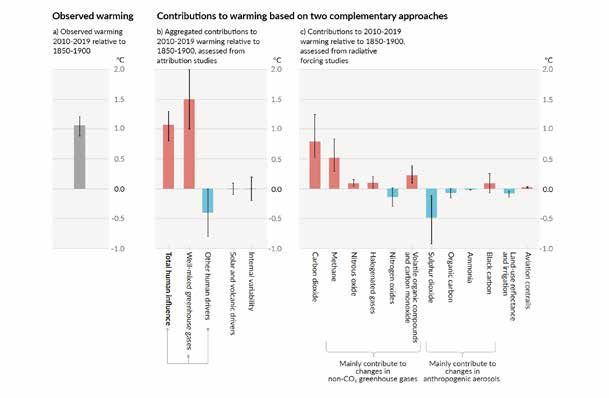
Greenhouse Gas Concentrations in the Atmosphere �
WMO Global Atmosphere Watch

Levels of Greenhouse Gases in the Atmosphere

Levels of atmospheric carbon dioxide (CO2), methane (CH4) and nitrous oxide (N2O) continue to rise. Preliminary
analysis of the data – from a subset of the WMO Global Atmosphere Watch (GAW) greenhouse gas (GHG)
observational network – demonstrated that CO2 concentrations1 in the Northern Hemisphere exceeded
410 parts per million (ppm) for most of 2020 and exceeded 415 ppm in the first half of 2021.

A full analysis of the three main GHGs (Figure 1) shows the globally averaged atmospheric concentrations of CO2 at 410.5
± 0.2 ppm, CH4 at 1877 ± 2 parts per billion (ppb) and N2O at 332.0 ± 0.1 ppb for 2019 (respectively 148%, 260% and 123%
of pre-industrial levels in 1750). The annual increases of CO2 and CH4 were larger in 2019 than the 10-year averaged
rate of increase, while the N2O annual increase was slightly less than the 10-year average growth rate (WMO, 2020).

Figure 1. (upper row) Globally averaged CO2, CH4 and N2O mole fraction in ppm (CO2) and ppb (CH4; N2O, respectively) and its growth rates (bottom row) from 1984 to
2019. Increases in successive annual means are shown as the shaded columns in the bottom row. The red line in the upper row is the monthly mean with the seasonal
variation removed; the blue dots and line depict the monthly averages

Final global average concentration data                                                                                                         Figure 2. Monthly mean CO2 mole fraction
                                                                                                                                                in ppm at Mauna Loa observatory from
figures for 2020 will not be available until
                                                                                                                                                March 1958 to July 2021. The dashed red
the second half of 2021, but data from                                                                                                          line represents the monthly mean values,
all global locations, including flagship                                                                                                        centred on the middle of each month.
observatories, indicate that levels of CO2,                                                                                                     The black line represents the same, but
                                                                                                                                                here the average seasonal cycle has
CH4 and N2O continued to increase in 2020                                                                                                       been removed by a statistical treatment.
and 2021 (Figures 2 and 3). In July 2021,                                                                                                       Source:     www.esrl.noaa.gov/gmd/ccgg/
CO2 concentration at Mauna Loa (Hawaii,                                                                                                         trends/mlo.html

US) and Cape Grim (Tasmania, Australia)
reached 416.96 ppm and 412.1 ppm,
respectively, in comparison with 414.62
ppm, and 410.03 ppm in July 2020.

1
    In this section, the physical quantity related to the amount of gases in the atmosphere (dry mole fraction) is referred to as “concentration”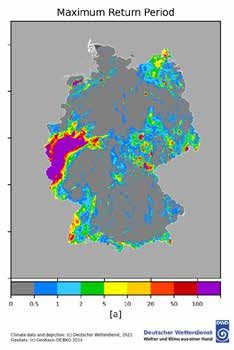
Greenhouse Gas Concentrations in the Atmosphere �
WMO Global Atmosphere Watch

Concentration variability and COVID-19

The Global Carbon Project (Friedlingstein et al., 2020)
estimated that total emissions from 2010–2019 were partitioned
into the atmosphere (44%), ocean (23%) and land (29%) with
an unattributed budget imbalance (4%). While the increase of
GHG concentrations in the atmosphere is driven by human
emissions, the interannual changes in the atmospheric CO2
increase rates are modulated by the variability of the sinks,
and especially of the land-based biosphere. The CO2 growth
rate was between 2 ppm and 3 ppm per year within the last 10
years, with the highest increase rate of 3.2 ppm observed in
2016, during the strong El Niño (WMO, 2016). El Niño typically
reduces the uptake of CO2 from the atmosphere by vegetation,
due to the increased extent of droughts over land surfaces
(Betts et al., 2016).                                             Figure 3. Monthly mean CO2 mole fraction in ppm from May 1976 to July 2021 at
                                                                  Cape Grim observatory (https://www.csiro.au/greenhouse-gases/)

The decline of CO2 emissions due to the COVID-19 crisis (-5.6%, see section “Global Emissions and Budgets – GCP”) would result
in a final change of the annual growth rate of less than 0.2 ppm – well within the 1 ppm – driven by the uptake of the biosphere. This
difference can be detected by the GAW network, which has a precision goal that is better than 0.1 ppm, but its detection will require
longer than one year of measurements.

The WMO Integrated Global Greenhouse Gas Information System IG3IS (www.ig3is.wmo.int) uses atmospheric observation and
analysis tools to improve knowledge of greenhouse gas sources and sinks at national and smaller scales. To achieve its objectives,
WMO IG3IS is developing good-practice guidelines for producing observation-based emissions estimates for nations, as well as
guidelines for estimating emissions from cities and states, and works toward broadening the use of this methodology.

Methane monitoring in support of the temperature target of the Paris Agreement

Methane accounts for about 16% of radiative forcing by long-lived greenhouse gases, making CH4 the second most important
anthropogenic GHG. Approximately 40% of methane is emitted into the atmosphere by natural sources, for example, wetlands and
termites, and about 60% comes from anthropogenic sources such as ruminants, rice agriculture, fossil fuel exploitation, landfills and
biomass burning (Saunois et al., 2020). CH4 emissions also indirectly affect human health and agricultural productivity through the
production of tropospheric ozone (UNEP, 2021). To limit global warming, strong, rapid, and sustained reductions in CO2, CH4, and
other greenhouse gases are necessary (IPCC, 2021).

The global CH4 increase of 8 ppb in 2019 (WMO, 2020) continues the trend of the past decade, which experienced increases of
5–10 ppb per year (ppb/yr). Preliminary analysis from the US National Oceanic and Atmospheric Administration (NOAA) network
demonstrates an increase of CH4 concentration in 2020 of 15 ppb, which is the largest increase within the 37-year (from 1984 to 2020)
record (https://gml.noaa.gov/ccgg/trends_CH4/).

Observations of CH4 stable isotopes are used to identify sources of atmospheric CH4 (Nisbet et al., 2016). The observed trend in 13C-
CH4 is explained by a combined increase in microbial (both natural and anthropogenic) and fossil emissions (WMO, 2020).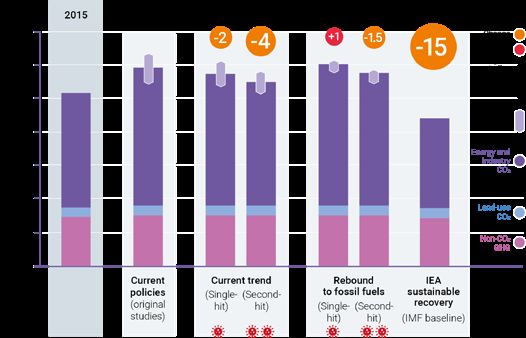
Greenhouse Gas Concentrations in the Atmosphere �
WMO Global Atmosphere Watch
Addressing CH4 emissions starts with
finding, identifying and quantifying
emissions (Nisbet et al., 2020). Satellite
data play an important role in locating
previously unknown large CH4 emission
sources (hotspots), for example, from
gas and oil production sites. The satellite
TROPOspheric Monitoring Instrument
(TROPOMI) provides CH4 column
concentrations with high sensitivity at the
Earth’s surface, a good spatiotemporal
coverage and sufficient accuracy to
facilitate inverse modelling of sources
and sinks. Data from TROPOMI were
used to identify emission hotspots Figure 4. This image shows a sample of abnormal methane concentrations over 2019 as measured by Sentinel-
(Figure 4) and can guide action to 5P. The size and colour of the circles indicate the size and intensity of the plume detected. The redder the colour,
address methane super-emitters. the higher the concentration of the methane plume. This image contains modified Copernicus Sentinel data
(2019), processed by Kayrros.
Substantial methodological development
is still needed to improve satellite-
derived emission estimates, for which
accurate measurements on the ground
are indispensable. However, with
the current capabilities, an important
new contribution to regional emission
monitoring can already be made. The
combination of Sentinel-5P and Sentinel2
Methane measurements show promising
results in deriving emission rates (see
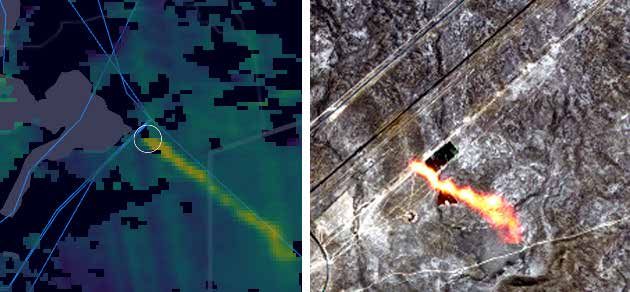
Figure 5).
Figure 5: Methane emission hotspots over a gas pipeline in Kazakhstan detected by Sentinel-5P (left) and
Sentinel2 (right) missions. This image contains modified Copernicus Sentinel data (2019), processed by Kayrros
Several studies have pointed to the short-term climate benefits and cost-effectiveness of mitigating CH4 emissions, which are well
described in the UNEP methane assessment of 2021. There is a strong call to upscale action on CH4 emissions and there are
indicative plans for an International Decade for Methane Management to be proposed at the 76th Session of the United Nations
General Assembly.
References
Betts, R. A., et al. 2016: El Niño and a Record CO2 Rise, Nature Climate Change 6 (9), 806–10. doi:10.1038/nclimate3063, https://www.nature.com/articles/nature06591
Friedlingstein, P., et al. 2020: Global Carbon Budget 2020. Earth Syst. Sci. Data, 12, 3269–3340, https://doi.org/10.5194/essd-12-3269–2020
Nisbet, E.G., E.J. Dlugokencky, E. J., et al. 2016: Rising atmospheric methane: 2007–2014 growth and isotopic shift. Glob. Biogeochem. Cycl. 30, 1356–1370, https://doi.
org/10.1002/2016GB005406
Nisbet, E. G., et al. 2020: Methane mitigation: methods to reduce emissions, on the path to the Paris agreement. Rev. Geophys.58, https://doi.org/10.1029/2019RG000675
Ocko, IB. et al. 2021: Acting rapidly to deploy readily available methane mitigation measures by sector can immediately slow global warming. Environ. Res. Lett. 16 054042, https://
iopscience.iop.org/article/10.1088/1748-9326/abf9c8/pdf
Saunois, M., et al. 2020: The Global Methane Budget 2000–2017. Earth Sys.. Sci Data, 12, 1561–1623. https://doi.org/10.5194/essd-12-1561-2020.
United Nations Environment Programme (UNEP) and Climate and Clean Air Coalition, 2021: Global Methane Assessment: Benefits and Costs of Mitigating Methane Emissions.
Nairobi: United Nations Environment Programme. ISBN: 978-92-807-3854-4
WMO, 2020: WMO Greenhouse Gas Bulletin No. 16: The State of Greenhouse Gases in the Atmosphere Based on Global Observations through 2019. https://library.wmo.int/doc_
num.php?explnum_id=10437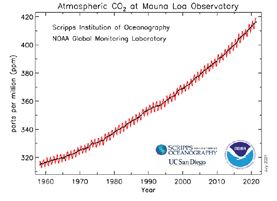
Global GHG Emissions and Budgets �
Global Carbon Project (GCP)

Global CO2 emissions from the combustion of fossil fuels and
land use change in 2019 reached a new high of 43 Gigatonnes
of CO2 (Gt, billion metric tonnes), 56% above the level when
international climate negotiations started early in the 1990s.
Fossil CO2 emissions (coal, oil, gas and cement), which account
for about 85% of all CO2 emissions (2010–2019), peaked at
36.6 GtCO2 in 2019, followed by an extraordinary drop of 1.9 GtCO2
(5.6%) in 2020 (updated from Friedlingstein et al., 2020, Figure 1).
The drop in emissions was mainly due to the slowdown of the
global economy and lower energy demands during the COVID-19
pandemic, especially during the first wave of confinements. The
transport sector, particularly road transport, contributed the most to
the decline. Although aviation dropped by 75% at the peak of the         Figure 1. Global fossil CO2 emissions which include coal, oil, gas and cement
lockdown in spring 2020, its contribution was smaller given that         production. Data updated from Friedlingstein et al. (2020)
the sector only accounts for about 2.8% of the total mean annual
global emissions (Le Quéré et al., 2020).

The emissions drop in 2020 was almost four times the size of the
one during the Global Financial Crisis in 2008 (1.5%, compared
to the previous year), and was the largest annual drop ever
recorded in absolute values (1.9 Gt CO2, Figure 2). Although there
is uncertainty about the global post-pandemic recovery, the drop is
temporary and initial estimates for 2021 show a strong recovery in
emissions with a possible return to pre-COVID levels within a year
or two (Figure 3).

Based on preliminary estimates, global emissions in the power
and industry sectors were already at the same level or higher in
                                                                         Figure 2. Annual changes in global fossil CO2 emissions. Data updated from
January-July 2021 than in the same period in 2019, before the            Friedlingstein et al. (2020)
pandemic, while emissions from road transport remained about
5% lower. Excluding aviation and sea transport, global emissions
were at about the same levels as in 2019, averaged across those
7 months.

Despite the expected high growth rates in 2021, the medium-term
outlook is for slower emissions growth than seen earlier in this
century. In fact, slowing growth rates already began before the
pandemic, with an average of 1% per year during the last decade,
down from 3% in the previous decade (2000–2009). The emissions
growth in 2019, just before the pandemic, was near zero. There is
no certainty as to when peak CO2 emission will be reached, given
that 150 countries had increasing fossil CO2 emissions during the
                                                                         Figure 3. Changes in fossil fuel CO2 emissions for the world and a selected
five years prior to the pandemic, but progress is occurring, with 64     group of countries for January-May in 2020 and 2021 compared with the same
countries recording declining emissions (Le Quéré et al., 2021).         period in 2019 (Carbon Monitor).

Additional 6.6 ± 2.5 Gt CO2 were added to the atmosphere in 2019 from the net impact of land-use change – that is, deforestation,
degradation, reforestation. These emissions are above the average from the past decade (2010–2019) of 5.8 Gt CO2 due to large
land-clearing fires in the Amazon and Indonesia (Friedlingstein et al., 2020). For the first time in the global carbon budget, we provide
estimates for the contributing gross fluxes that make up net land-use change emissions and show that gross emissions, such as land
clearing, shifting cultivation and peat draining, are about 2–3 times larger (16 ± 2.6 Gt CO2) than the net flux (average for 2010–2019).
However, the trends for land use emissions in the last decade are inconsistent between estimates because of divergent estimates
of forest loss areas. These emissions are only partially offset by anthropogenic sinks such as reforestation and vegetation regrowth
after crop abandonment.
Global GHG Emissions and Budgets �
Global Carbon Project (GCP)
The land and oceans sinks removed almost half of all anthropogenic CO2 emissions, with oceans sinks remaining close to the
decadal average (2000–2009) in 2019 and 2020. Land sinks were slightly below their average, reflecting several climate anomalies
such as wildfires in Australia and elsewhere.
Figure 4. Attribution of changes in atmospheric CO2 concentrations (parts per million, ppm) to main sources of fossil fuels and cement production. Data from
Friedlingstein et al. (2020). Note that atmospheric concentrations are estimated from the NOAA/ESRL network and therefore are not exactly the same as the ones based
on the WMO global network; this choice is determined by data availability at the time of submission of the Global Carbon Budget for publication.
The importance of nitrous oxide (N2O) emissions
Nitrous oxide (N2O) is the third most important greenhouse gas contributing to human induced warming, after CO2 and methane
(CH4). Its third place often results in its receiving less attention, although N2O is 298 times more effective at trapping heat per unit
mass than CO2 (on a 100-y time scale). Once emitted, N2O remains in the atmosphere for 116 ± 9 years, a shorter lifetime than CO2
but much longer than CH4.
Anthropogenic emissions of N2O GLOBAL N2O BUDGET GLOBAL N2O BUDGET
ANTHROPOGENIC SOURCES CHANGE IN ATMOSPHERIC NATURAL SOURCES
have been growing for over 100 ABUNDANCE
7.3 9.7
years, with a 30% increase in the (4.2 to 11.4)
4.3
(3.8 to 4.8) (8.0 to 12.0)
past three decades. Agriculture,
4.2 0.6 1.0 1.3 0.6 6.0 13.5 3.4
owing to the use of nitrogen fertilizers (2.7 to 6.3) (0.5 to 0.8) (0.8 to 1.1) (0.7 to 2.2) (-0.3 to 2.3) (5.2 to 6.6) (12.4 to 14.6) (2.5 to 4.3)
and manure, contributes 70% of all
anthropogenic N2O emissions (Tian
et al., 2020). Excess nitrogen in
the environment has led to a four-
fold increase in global riverine N2O
Atmospheric
emissions in the period from 1900 to chemical sink
Agriculture & Biomass Fossil fuel & Indirect Anthropogenic/Natural Land
2016 with emissions peaking over Waste water burning Industry emission Oceans
the past decade (Yao et al., 2020).
The recently published Global N2O
Budget (Figure 5) estimated all FLUX OF N2O BY SOURCE
in Teragrams of Nitrogen per year (Tg N yr1) for the decade of 2007-2016
anthropogenic and natural sources Anthropogenic emissions Natural emissions
and sinks that determine the
Figure 5. Mean global N2O budget for all major anthropogenic and natural sources and sinks for the decade
accumulation of atmospheric N2O.
2007–2016 (redrawn from Tian et al., 2020).Global GHG Emissions and Budgets �
Global Carbon Project (GCP)
Recent trends in N2O emissions exceed the illustrative socioeconomic pathways used by the global climate community, and show
a rapidly departing trajectory from scenarios that are consistent with the Paris Agreement targets (Figure 6). Despite this growth,
some regions (for example, Europe) have stable emissions, often resulting from reductions in industrial emissions (through emission
abatement technologies) and increased nitrogen use efficiency in agriculture (Thompson et al., 2019). These technological and
efficiency improvements are important also in offsetting a growth in N2O emissions from increases in, for example, agricultural activity
in some regions, such as North America.
Global Anthropogenic N2O Emissions
12
11
Anthropogenic N2O emissions (TgNyr-1)
10 SSP3-7.0
SSP4-6.0
9
Top down
Bottom up SSP5-8.5
8 SSP2-4.5
Average
SSP4-3.4
CMIP6
7
6
SSP1-1.9
5 SSP1-2.6
4
2000 2010 2020 2030 2040 2050
Figure 6. Historical and projected global N2O emissions used in the marker socioeconomic pathway scenarios used in the IPCC AR6 (Tian et al., 2020).
References
Carbon Monitor: https://carbonmonitor.org/
Friedlingstein, P. et al. 2020: Global Carbon Budget 2020. Earth Sys. Sci. Data, 12, 3269–3340, https://doi.org/10.5194/essd-12-3269–2020
Global Carbon Project, 2021: An annual update of the global carbon budget and trends. https://www.globalcarbonproject.org/carbonbudget
Le Quéré, C. et al. 2020: Temporary reduction in daily global CO2 emissions during the COVID-19 forced confinement. Nat. Clim. Chang., 10, 647–653, https://doi.org/10.1038/
s41558-020-0797-x
Le Quéré, C. et al. 2021: Fossil CO2 emissions in the post-COVID-19 era. Nat. Clim. Chang., 11, 197–199, .https://www.nature.com/articles/s41558-021-01001-0
Thompson, R.L. et al. 2019: Acceleration of global N2O emissions seen from two decades of atmospheric inversion. Nat. Clim. Chang., 9, 993–998, https://doi.org/10.1038/s41558-
019-0613-7
Tian, H. et al. 2020: A comprehensive quantification of global nitrous oxide sources and sinks. Nature, 586, 248–256, https://doi.org/10.1038/s41586-020-2780-0
Yao, Y. et al. 2020: Increased global nitrous oxide emissions from streams and rivers in the Anthropocene. Nat. Clim. Chang. 10, 138-142, https://www.nature.com/articles/s41558-
019-0665-8Global Climate in 2017�2021 � WMO
This section provides a summary on the state of change of two important climate indicators (Trewin et al., 2021) – temperature and
sea ice – in the five-year period from 2017–2021. The global average mean surface temperature for 2017–2021 (2021 data are based
on averages for January to May or June, depending on the data set) is among the warmest of any equivalent period on record (Figure
1). It is estimated to be 1.06 °C to 1.26 °C above pre-industrial (1850–1900) levels, depending on the data set used.
Global mean temperature difference from 1850-1900 ( C)
1.4
HadCRUT5 analysis
1.2 NOAAGlobalTemp
1.0 GISTEMP
ERA-5
0.8 Berkeley Earth
0.6 JRA-55
C
0.4
0.2
0.0
0.2
1850 1875 1900 1925 1950 1975 2000 2025
Year © Crown Copyright. Source: Met Office
Figure 1. Five-year running average of global temperature anomalies (relative to pre-industrial) from 1854 to 2021 for six data sets: HadCRUT.5.0.1.0, NOAA
GlobalTemp v5, GISTEMP v4, Berkeley Earth, ERA5, and JRA-55. Data for 2020 to June 2021 for HadCRUT5 and July for NOAAGlobalTemp, GISTEMP, Berkeley
Earth, ERA5 and JRA-55.
90N
The 2017–2021 average global temperature dropped
slightly from the record high for 2016–2020. This is mainly
due to the El Niño conditions in 2016 which boosted global 45N
temperatures (WMO, 2016) and the La Niña conditions in
early 2021 that contributed to a slight drop of the global 0
annual temperatures. The 2017–2021 five-year average
temperature is likely to be the highest on record for large 45S
areas of North Africa, the Middle East, Eastern Asia, eastern
parts of the US, parts of Central America, and areas of South
90S
America. Only a few land areas were close to or slightly 180 90W 0 90E
cooler than the 1981–2010 average, most notably an area of
-10 -5 -3 -1 -0.5 -0.2 0 0.2 0.5 1 3 5
North America (Figure 2).
Temperature anomaly relative to 1981-2010 (°C)
Figure 2. 2017-2021 five-year average temperature anomalies relative to the 1981-2010
Sea ice average. Data is from NASA GISTEMP v4. Date updated to July 2021
Arctic sea ice has seen a long-term decline every month since the beginning of the satellite era (1979–present), with the largest
relative losses in late summer, around the time of the annual minimum in September (Figure 3), albeit with regional variations. For
the 2016–2020 period, the average arctic sea-ice extent in September was 28% below the 1981–2010 average while the average
March maximum was around 6% below the 1981–2010 average.
In every year from 2017 to 2021, the Arctic average summer minimum and average winter maximum sea-ice extent were below the
1981–2010 long term average. In September 2020, the Arctic sea-ice extent reached its second lowest minimum on record.
There has also been a marked decline in the fraction of older, usually thicker, ice. At the time of the March maximum, the fraction of
ice older than one year has declined from around 60% in 1985 to around 27% in 2021.1 The fraction of ice older than four years has
declined from 30% in 1985 to less than 5% in 2021.
Antarctic sea-ice extent increased slowly from the start of the satellite era to around 2015. However, in the three years following 2015,
ice extent dropped rapidly (Figure 3). The drop was associated with ocean warming, combined with incursions of warm air during
the spring and an unusual weakening of the mid-latitude westerly winds.2 Since then, ice extent has returned close to the long-term
average.
1
http://nsidc.org/arcticseaicenews/2021/05/
2
https://www.nature.com/articles/s41561-021-00768-3Global Climate in 2017�2021 � WMO
Figure 3. For 1979–2021: (left) monthly September and March Arctic sea-ice extent anomalies relative to the 1981–2010 average; (right) monthly February and
September Antarctic sea-ice extent anomalies relative to the 1981–2010 average (Sources: US National Snow and Ice Data Center (NSIDC) and EUMETSAT Ocean
and Sea Ice Satellite Application Facility (OSI SAF))
An exceptional and dangerous heatwave devastated the US northwest and
Western Canada in June /July
The all-time Canadian heat record was broken when Lytton, British Columbia, recorded a high of 49.6 °C on 29 June 2021. Using
published peer-reviewed methods (van Oldenborgh et al., 2021), the World Weather Attribution (WWA) initiative investigated the
role of human-induced climate change in the likelihood and intensity of this extreme heatwave. The occurrence of a heatwave with
the high maximum daily temperatures observed in the area 45–52 ºN, 119–123 ºW, was virtually impossible without human-caused
climate change (World Weather Attribution; Philip et al., 2021). The temperatures were so extreme that they were far beyond the
range of historically observed temperatures. This makes it hard to quantify with confidence how rare the event was. In the most
realistic statistical analysis, the event is estimated to be a 1 in 1000 year event in today’s climate. An event such as the Pacific
Northwest 2021 heatwave is still rare or extremely rare in today’s climate, yet would be
virtually impossible without human-caused climate change. As warming continues, it will
become a lot less rare (Philip et al., 2021).human-caused climate change. As warming
continues, it will become a lot less rare (Philip et al., 2021).
Severe Flooding Event in Germany and neighbouring
countries
Very pronounced heavy rainfall occurred in Germany and neighbouring countries
in connection with the low-pressure system “Bernd”, especially in the period from
12–15 July 2021. This led to severe flooding, particularly in North Rhine-Westphalia
and Rhineland-Palatinate. The flooding resulted in a high number of fatalities (186
deaths and 26 missing) and considerable infrastructure damage – estimated around
€ 5 billion (US$ 5.9 billion) by insurers. The flooding was triggered by long-lasting
heavy precipitation that fell on already saturated ground and, in many parts, rocky
underground. Wide areas experienced 100 litre (l) /m2 within 12 to 72 hours, some
areas even 150 l/m2 within 12 to 24 hours (Figure 4). In the current climate, for a given
location within the larger area north of the Alps to the Netherlands on average it is
expected one such event every 400 years (Kreienkamp et al., 2021).
The World Weather Attribution (WWA) initiative analyzed how human-induced climate Figure 4. Maximum return period (years) of rainfall
change affected maximum 1-day and 2-day rainfall events in the summer season with durations between 1 and 72 hours from
12.07.2021 05:50 UTC to 19.07.21 05:50 UTC
(April–September) in two small regions where recent flooding has been most severe based on an hourly precipitation sum from the
(Ahr-Erft region, Germany; and the Meuse, Belgium) as well as anywhere over a larger Deutscher Wetterdienst (DWD, Germany’s National
region including Germany, Belgium and the Netherlands (Kreienkamp et al., 2021). Meteorological Service) radar network adjusted to
rain gauge observations.Global Climate in 2017�2021 � WMO
All available evidence taken into consideration, including physical understanding, meteorological observations as well as different
regional climate models, give high confidence that human-induced climate change has increased the likelihood and intensity of
such an event to occur and these changes will continue in a rapidly warming climate (Kreienkamp et al., 2021). Under future climate
change, such events will occur more frequently.
Weather, climate and water in 50-year disaster data
The recent WMO Atlas of Mortality and Economic Losses from Weather, Climate and Water Extremes (WMO-No. 1267) shows that
of the 22 326 disasters recorded worldwide from 1970 to 2019 over 11 000 were attributed to weather, climate and water-related
hazards. Those disasters resulted in 2.06 million deaths and US$ 3.64 trillion in losses. Some 44% of the disasters were associated
with floods (riverine floods 24%, general floods 14%) and 17% with tropical cyclones (Figure 5). Tropical cyclones and droughts were
the most prevalent hazards with respect to human losses, accounting for 38% and 34% of disaster related deaths respectively. In
terms of economic losses, 38% were associated with tropical cyclones, while different types of floods account for 31%, riverine floods
(20%), general floods (8%) and flash floods (3%) (WMO, 2021).
2% 1% 1% 3% Avalanche
6% Coastal flood
1% Cold wave
17%
Drought
6% Extra-tropical storm
Flash flood
2% 3% Forest fire
1% General flood
2% General landslide
Number
General storm
of reported disasters
Hail
by hazard type 14%
Heat wave
Land fire
Lightning/Thunderstorms
24% Mudslide
Riverine flood
5% Severe storm
Severe winter conditions
7% Tornado
1% 2%1% 2%1%
Tropical cyclone
Winter storm/Blizzard
Figure 5. Distribution of number of disasters globally covering the period 1970–2019 (WMO, 2021)
Although the number of recorded disasters rose by a factor of five over the period the number of deaths decreased almost three-
fold. This is due, in part, to better multi-hazard early warning systems, which are improving prevention, preparedness and response.
References
Trewin, B. et al. 2021: Headline Indicators for Global Climate Monitoring. Bull. Amer. Met. Sci., https://doi.org/10.1175/BAMS-D-19-0196.1
WMO, 2021: Atlas of mortality and economic losses from weather, climate and water extremes covering the past 50 years. WMO Report 1267.
WMO Statement on the Status of the Global Climate in 2016, WMO-No. 1189, 2017
Philip, S.Y. et al. 2021: Rapid attribution analysis of the extraordinary heatwave on the Pacific Coast of the US and Canada June 2021. World Weather Attribution. https://www.
worldweatherattribution.org/wp-content/uploads/NW-US-extreme-heat-2021-scientific-report-WWA.pdf, accessed 25 August 2021
van Oldenborgh, G.J. et al. 2021: Pathways and pitfalls in extreme event attribution. Clim. Change, 166, 13, https://doi.org/10.1007/s10584-021-03071-7
Kreienkamp, F. et al. 2021: Rapid attribution of heavy rainfall events leading to the severe flooding in Western Europe during July 2021. World Weather Attribution: https://www.
worldweatherattribution.org/wp-content/uploads/Scientific-report-Western-Europe-floods-2021-attribution.pdf, accessed 25 August 2021Highlights of IPCC Climate Change 2021, The Physical
Science Basis for the current state of climate
It is unequivocal that human influence has warmed the atmosphere, ocean and land.
Widespread and rapid changes in the atmosphere, ocean, cryosphere and biosphere have
occurred.
Observed increases in well-mixed greenhouse gas (GHG) concentrations since around 1750 are unequivocally caused by human
activities. Their concentrations have continued to increase in the atmosphere. Land and ocean have taken up a near-constant
proportion (globally about 56% per year) of CO2 emissions from human activities over the past six decades, with regional differences.
Human-caused radiative forcing of 2.72 [1.96–3.48] W m–2 in 2019 relative to 1750 has warmed the climate system. This warming
is mainly due to increased GHG concentrations, partly reduced by cooling due to increased aerosol concentrations. The radiative
forcing has increased by 0.43 W m–2 (19%) relative to the previous IPCC report (AR5, published in 2013), of which 0.34 W m–2 is due
to the increase in GHG concentrations since 2011. The remainder is due to improved scientific understanding and changes in the
assessment of aerosol forcing, which include decreases in concentration and improvement in its calculation.
Each of the last four decades has been successively warmer than any decade that preceded it since 1850. Global surface temperature
in the first two decades of the twenty-first century (2001–2020) was 0.99 [0.84–1.10] °C higher than 1850–1900. Global surface
temperature was 1.09 [0.95–1.20] °C higher in 2011–2020 than 1850–1900, with larger increases over land (1.59 [1.34–1.83] °C)
than over the ocean (0.88 [0.68–1.01] °C).
For the period when attribution studies are available, the observed warming from 1850–1900 to 2010–2019 is 1.06 [0.88–1.21] °C,
and the best estimate of total human-caused warming is 1.07 °C, with a likely range of 0.8–1.3 °C. It is likely that well-mixed GHGs
contributed a warming of 1.0–2.0 °C, other human drivers (principally aerosols) contributed a cooling of 0.0–0.8 °C, natural drivers
changed global surface temperature by -0.1–0.1 °C, and internal variability changed it by -0.2–0.2 °C (Figure 1).
Figure 1. Taken from IPCC AR6 WG1 Figure SPM.2: Assessed contributions to observed warming in 2010–2019 relative to 1850–1900. Panel a): Observed global
warming (increase in global surface temperature) and its very likely range Panel b): Evidence from attribution studies, which synthesize information from climate models
and observations. The panel shows temperature change attributed to total human influence, changes in well-mixed greenhouse gas concentrations, other human drivers
due to aerosols, ozone and land-use change (land-use reflectance), solar and volcanic drivers, and internal climate variability. Whiskers show likely ranges {3.3.1}. Panel
c): Evidence from the assessment of radiative forcing and climate sensitivity. The panel shows temperature changes from individual components of human influence,
including emissions of greenhouse gases, aerosols and their precursors; land-use changes (land-use reflectance and irrigation); and aviation contrails. Whiskers show
very likely ranges. Estimates account for both direct emissions into the atmosphere and their effect, if any, on other climate drivers. For aerosols, both direct (through
radiation) and indirect (through interactions with clouds) effects are considered.{6.4.2, 7.3}Highlights of IPCC Climate Change 2021, The Physical Science Basis for the current state of climate Details of observed changes in other parts of the climate system, such as the land, oceans, cryosphere and biosphere, and their attribution to human influence, can be found in the Summary for Policy Makers and the Technical Summary (IPCC, 2021). The scale of recent changes across the climate system as a whole and the present state of many aspects of the climate system are unprecedented over many centuries to many thousands of years. In 2019, atmospheric CO2 concentrations were higher than at any time in at least 2 million years and concentrations of CH4 and N2O were higher than at any time in at least 800 000 years. Global surface temperature has increased faster since 1970 than in any other 50-year period over at least the last 2000 years (Figure 2). Temperatures during the most recent decade (2011–2020) exceed those of the most recent multi-century warm period, around 6500 years ago [0.2–1 °C relative to 1850–1900]. Prior to that, the next most recent warm period was about 125 000 years ago when the multi-century temperature [0.5 °C–1.5 °C relative to 1850–1900] overlaps the observations of the most recent decade. Figure 2. Taken from IPCC AR6 WG1 SPM.1: History of global temperature change and causes of recent warming. Panel a): Changes in global surface temperature reconstructed from paleoclimate archives (solid grey line, 1–2000) and from direct observations (solid black line, 1850–2020), both relative to 1850–1900 and decadally averaged. The vertical bar on the left shows the estimated temperature (very likely range) during the warmest multi-century period in at least the last 100 000 years, which occurred around 6 500 years ago during the current interglacial period (Holocene). The Last Interglacial, around 125 000 years ago, is the next most recent candidate for a period of higher temperature. These past warm periods were caused by slow (multi-millennial) orbital variations. The grey shading with white diagonal lines shows the very likely ranges for the temperature reconstructions. Panel b): Changes in global surface temperature over the past 170 years (black line) relative to 1850–1900 and annually averaged, compared to CMIP6 climate model simulations In 2011–2020, late summer Arctic sea-ice area was smaller than at any time in at least the past 1000 years). The global nature of glacier retreat, with almost all of the world’s glaciers retreating synchronously, since the 1950s is unprecedented in at least the last 2000 years. Global mean sea level has risen faster since 1900 than over any preceding century in at least the last 3000 years. The global ocean has warmed faster over the past century than since the end of the last deglacial transition (around 11 000 years ago).
Highlights of IPCC Climate Change 2021, The Physical
Science Basis for the current state of climate

Human-induced climate change is already affecting many weather and climate extremes
in every region around the globe. Evidence of observed changes in extremes – such
as heatwaves, heavy precipitation, droughts, and tropical cyclones – and, in particular,
their attribution to human influence has strengthened since the publication of the
previous IPCC report (AR5) in 2013.

       It is virtually certain that hot extremes (including heatwaves) have become more frequent and more intense across most
       land regions since the 1950s, while cold extremes (including cold waves) have become less frequent and less severe,
       with high confidence that human-induced climate change is the main driver of these changes. Some recent hot extremes
       observed over the past decade would have been extremely unlikely to occur without human influence on the climate
       system. Marine heatwaves have approximately doubled in frequency since the 1980s, and human influence has very
       likely contributed to most of them since at least 2006.

       The frequency and intensity of heavy precipitation events have increased since the 1950s over most land area for which
       observational data are sufficient for trend analysis, and human-induced climate change is likely the main driver. Human-
       induced climate change has contributed to increases in agricultural and ecological droughts in some regions due to
       increased land evapotranspiration.

       Decreases in global land monsoon precipitation from the 1950s to the 1980s are partly attributed to human-caused Northern
       Hemisphere aerosol emissions but increases since then have resulted from rising GHG concentrations and decadal to
       multi-decadal internal variability. Over South Asia, East Asia and West Africa increases in monsoon precipitation due to
       warming from GHG emissions were counteracted by decreases in monsoon precipitation due to cooling from human-
       caused aerosol emissions over the twentieth century. Increases in West African monsoon precipitation since the 1980s
       are partly due to the growing influence of GHGs and reductions in the cooling effect of human-caused aerosol emissions
       over Europe and North America.

       It is likely that the global proportion of major (Category 3–5) tropical cyclone occurrence has increased over the last
       four decades, and the latitude where tropical cyclones in the western North Pacific reach their peak intensity has shifted
       northward; these changes cannot be explained by internal variability alone. There is low confidence in long-term (multi-
       decadal to centennial) trends in the frequency of all-category tropical cyclones. Event attribution studies and physical
       understanding indicate that human-induced climate change increases heavy precipitation associated with tropical
       cyclones but data limitations inhibit clear detection of past trends on the global scale.

       Human influence has likely increased the chance of compound extreme events since the 1950s. This includes increases
       in the frequency of concurrent heatwaves and droughts on the global scale; fire weather in some regions of all inhabited
       continents; and compound flooding in some locations.
Highlights of IPCC Climate Change 2021, The Physical
Science Basis for the current state of climate
In addition to this state of knowledge regarding observed • Natural drivers and internal variability will modulate
climate change, and its attribution, these are the headline human-caused changes, especially at regional scales
statements from the report: and in the near term, with little effect on centennial global
warming. These modulations are important to consider in
• Improved knowledge of climate processes, paleoclimate planning for the full range of possible changes.
evidence and the response of the climate system to
increasing radiative forcing gives a best estimate of • With further global warming, every region is projected
equilibrium climate sensitivity of 3 °C with a narrower to increasingly experience concurrent and multiple
range compared to AR5. changes in climatic impact-drivers. Changes in several
climatic impact-drivers would be more widespread at
• Global surface temperature will continue to increase until 2 °C compared to 1.5 °C global warming and even more
at least the mid-century under all emissions scenarios widespread and/or pronounced for higher warming levels.
considered. Global warming of 1.5 °C and 2 °C will be
exceeded during the twenty-first century unless deep • Low-likelihood outcomes, such as ice sheet collapse,
reductions in CO2 and other greenhouse gas emissions abrupt ocean circulation changes, some compound
occur in the coming decades. extreme events and warming substantially larger than the
assessed very likely range of future warming cannot be
• Many changes in the climate system become larger in ruled out and are part of risk assessment.
direct relation to increasing global warming. They include
increases in the frequency and intensity of hot extremes, • From a physical science perspective, limiting human-
marine heatwaves, and heavy precipitation, agricultural induced global warming to a specific level requires
and ecological droughts in some regions, and proportion limiting cumulative CO2 emissions, reaching at least net
of intense tropical cyclones, as well as reductions in zero CO2 emissions, along with strong reductions in other
Arctic se ice, snow cover and permafrost. greenhouse gas emissions. Strong, rapid and sustained
reductions in CH4 emissions would also limit the warming
• Continued global warming is projected to further intensify effect resulting from declining aerosol pollution and would
the global water cycle, including its variability, global improve air quality.
monsoon precipitation and the severity of wet and dry
events.Under scenarios with increasing CO2 emissions, • Scenarios with very low or low GHG emissions lead
the ocean and land carbon sinks are projected to be within years to discernible effects on greenhouse gas and
less effective at slowing the accumulation of CO2 in the aerosol concentrations and on air quality relative to high
atmosphere. and very high GHG emissions scenarios. Under these
contrasting scenarios, discernible differences in trends of
• Many changes due to past and future greenhouse gas global surface temperature would begin to emerge from
emissions are irreversible for centuries to millennia, natural variability within around 20 years, and over longer
especially changes in the ocean, ice sheets and global time periods for many other climatic impact-drivers.
sea level.
References
Arias, P.A., 2021: Technical Summary. In: Climate Change 2021: The Physical Science Basis. Contribution of Working Group I to the Sixth Assessment Report of the
Intergovernmental Panel on Climate Change [Masson-Delmotte, V., P. Zhai, et. al (eds.)]. Cambridge University Press. In Press
IPCC, 2021: Summary for Policymakers. In: Climate Change 2021: The Physical Science Basis. Contribution of Working Group I to the Sixth Assessment Report of the
Intergovernmental Panel on Climate Change [Masson-Delmotte, V., P. Zhai, et al. (eds.)]. Cambridge University Press. In PressHeatwaves, Wildfires and Air Pollution: Compounding
and Cascading Climate Hazards to Health during the
COVID-19 Pandemic � WHO/WMO
The severe short- and long-term impacts of COVID-19 are an Extreme weather
Rising temperatures Air quality
additional burden for communities worldwide already dealing events
with the existing climate threats to health. Individuals infected
with COVID-19 and exposed to climate hazards such as
heat, wildfires or air pollution are at risk of experiencing More frequent, More frequent, Increased air
EXPOSURE
intense and intense and pollution & GHG
more severe health outcomes compared to the risks from prolonged heat prolonged wild- emissions
events fires
individual hazards. In addition, each individual climate hazard
and COVID-19 impact can undermine and complicate public
health responses to other climate hazards and COVID-19
impacts, compounding the stresses on health care quality
INDIRECT HEALTH
Increased risk of Infrastructure Increased hospital
IMPACTS
and capacity. Heat and wildfire exposure combined with accidents and damage and admissions and
injuries disruption limited capacity of
COVID-19 dynamics may lead to significant increases in health services
hospital admissions whilst reducing health care services
and infrastructural capacities – medical equipment is limited,
medical staff may be affected and health care facilities may
DIRECT HEALTH
be impaired (Figure 1). Climate hazards and COVID-19 Acute and chronic Acute and chronic Other diseases
IMPACTS
cardiovascular
impacts could also interact to make specific and routine disease
respiratory and accelerated
disease deaths
interventions less effective, more challenging or more risky.
Heat impacts: Mechanisms and Vulnerable popula- Overburdened Poor air quality
vulnerabilities tions at increased health systems with
COVID-19
increasing the risk
RISKS
health risks from limited medical for COVID-19
COVID-19 and workers and morbidity and
Heat can affect human health in several ways. Direct impacts climate hazards equipment mortality
include increased morbidity and mortality due to heat stress,
heatstroke and exacerbations of cardiovascular, respiratory Figure 1. Direct and indirect health impacts of climate hazards and COVID-19 risks
and cerebrovascular diseases (Figure 2). Heat can also representing compounding and cascading factors.
impair human behaviour (e.g., physical and mental activities),
health service delivery, air quality and critical infrastructure,
leading to indirect health effects. Some population groups
are particularly vulnerable: people over the age of 65, Head
Headache
Mouth
Excessive thirst
infants and children, individuals with disabilities or pre- Dizziness Dry mouth
Confusion
existing medical conditions, outdoor workers and people Loss of conciousness Lungs
Loss of coordination Increased breathing rate
with low socioeconomic status. In urban areas, the dense Agitation Worsened allergies and asthma
Seizures Worsened chronic obstructive
concentrations of structures and the beehive of human Delirium pulmonary disease
Stroke
activities can produce higher temperatures – the urban heat Coma Heart
Increased heart rate
island effect – which may, for example, alter and deprive Liver
Irregular heart beat
Liver injury
people of sleep at night. Reduced blood flow to the heart
Heart attack
Kidneys
Kidney disease
Kidney failure
Arms and legs
Heat and health threats in recent years Skin Heat cramps
Tender, rigid, limp or cramping
Flushed and clammy skin
Profuse sweating muscles
Rising temperatures and more frequent, longer and persistent Heat rash
heatwaves in recent years are affecting human health, General physiology
Fever
increasing heat-related mortality and impairment of capacity Nausea
Vomiting
to work. Global heat-related mortality in people older than 65 Fatigue
Dehydration
years increased by 53.7% from 2000–2004 to 2014–2018, Electrolyte imbalance
reaching 296 000 deaths in 2018, with the majority occurring Drop in blood pressure
in Japan, eastern China, northern India and central Europe.
37% of heat-related deaths can be attributed to human- Figure 2. Symptoms of heat exposure affecting different organ systems. Adapted from
Dahl et al., 2019.
induced warming, according to a global analysis includingYou can also read