VULNERABILITY AND ADAPTATION TO CLIMATE CHANGE - An Assessment for the Texas Mid-Coast
←
→
Page content transcription
If your browser does not render page correctly, please read the page content below
VULNERABILITY
AND ADAPTATION TO
CLIMATE CHANGE
An Assessment for the Texas Mid-Coast
Arsum Pathak and Amanda Fuller

     Vulnerability and
   Adaptation to Climate
         Change:
   An Assessment for the
     Texas Mid-Coast

                    National Wildlife Federation
                    Texas Coast and Water Program
                                                    1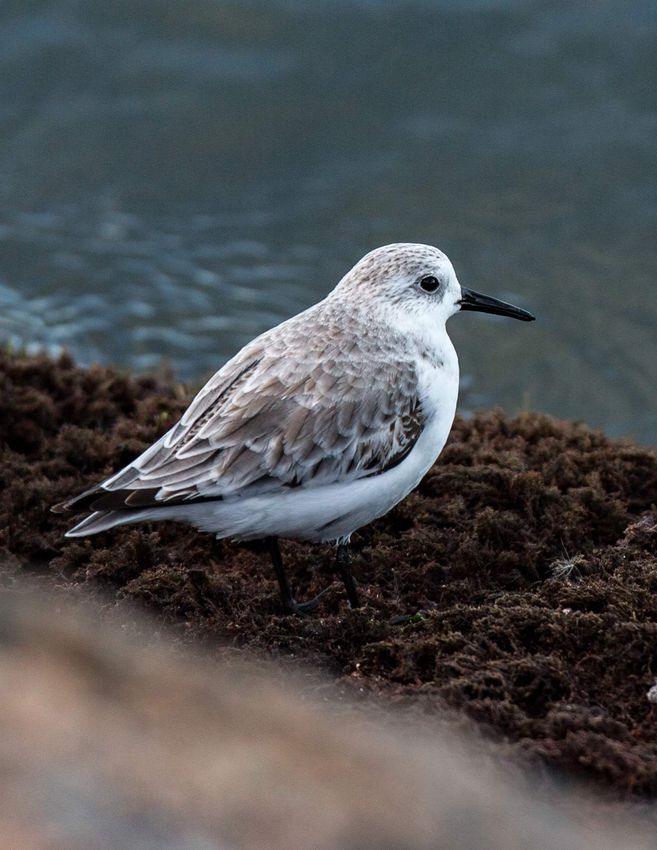
CONTENTS
Suggested Citation: Pathak, A., & Fuller, A. (2021). Vulnerability and Adaptation to
Climate Change: An Assessment for the Texas Mid-Coast. Austin, TX: National Wildlife       List of Tables and Figures   4
Federation.
                                                                                           Executive Summary 5
                                                                                           1. INTRODUCTION: PURPOSE AND OBJECTIVES 10
Acknowledgements: The National Wildlife Federation would like to thank the Cynthia
and George Mitchell Foundation for their financial support that made this work possible.        State of Climate Science 11
We would also like to thank the following expert reviewers who provided comments                Analytical Framework     12
and suggestions that helped improve this report: Dr. David Yoskowitz and Dr. Kateryna
(Katya) Wowk (Harte Research Institute, Texas A&M University-Corpus Christi) and                Management Needs and Opportunity 14
Myron Hess (Tributary Consulting). We thank Jonathan Seefeldt for the final design and
layout of this work.
                                                                                           2. THE TEXAS MID-COAST      17
                                                                                               Overview of the Mid-Coast Region     17
Cover image: A whooping crane in the Aransas National Wildlife Refuge along the Texas          Regional Environmental Assets		      17
Mid-Coast. Photo by Kaila Drayton, National Wildlife Federation.                               Regional Socio-economic Assets       18
                                                                                           3. CLIMATE CHANGE PROJECTIONS FOR THE MID-COAST           20
All photos unless otherwise noted are by Kaila Drayton, National Wildlife Federation.          Sea Level Rise and Inundation Regimes  20
                                                                                               Coastal Storms and Storm Surge      29
                                                                                               Extreme Temperature and Precipitation 32
                                                                                           4. ENVIRONMENTAL, SOCIAL, AND ECONOMIC IMPACTS            34
                                                                                               Projected Changes to Coastal Habitats    35
                                                                                               Implications for Whooping Cranes and Other Wildlife Species 40
                                                                                               Projected Changes to Water Quantity and Quality       42
                                                                                               Impacts on Key Economic Sectors 43
                                                                                           5. SOCIAL VULNERABILITY 46
                                                                                               Population Changes       48
                                                                                               Additional Social Vulnerability Considerations   48
                                                                                           6. ADAPTATION PLANNING 50
                                                                                               Advancing Ecosystem Restoration and Adaptation Goals       51
                                                                                               Adaptation Assessment Tools and Resources    53
                                                                                           7. FUTURE ACTION AND POLICY RECOMMENDATIONS 56
                             National Wildlife Federation                                  References		    59
                             Texas Coast and Water Program                                 Appendices		    64
LIST OF FIGURES
    Figure 1. A typical framework for vulnerability and adaptation assessments. 13
                                                                                               EXECUTIVE SUMMARY
    Figure 2. Geographic scope of this assessment.         14                                  In a time of increasing climate variability, local leaders and
    Figure 3. Overview of environmental assets.            19
                                                                                               decision-makers in the Mid-Coast need to account for emerging
    Figure 4. Inundation caused by four different scenarios of sea level rise.     22
                                                                                               environmental, social, and economic impacts.
    Figure 5. National Wildlife Refuges inundated by an intermediate low scenario of           The purpose of this assessment is to equip local leaders and decision-makers in
    sea level rise.    24                                                                      the Texas Mid-Coast with locally relevant information about the area’s future
    Figure 6. Wildlife Management Areas inundated by an intermediate low scenario              related to climate change impacts, enabling them to make greater investments in
    of sea level rise. 25                                                                      natural assets to shore up coastal environments for wildlife, local economies, and
                                                                                               protection of their communities. The objectives of this assessment are threefold:
    Figure 7. Key areas inundated by an intermediate low scenario of sea level rise.           1) to provide the latest information regarding climate change-related risks to the
    26
                                                                                               Texas Mid-Coast, 2) to examine the impacts of climate change on key socio-
    Figure 8. Key areas inundated by an intermediate scenario of sea level rise. 27            economic and environmental assets in the region and, 3) to explore the adaptation
                                                                                               planning, including funding mechanisms for nature-based projects, that can be
    Figure 9. Increase in inundation regimes in the Rockport-Fulton coastline with an          utilized to address these risks.
    increase in sea level rise. 28
                                                                                               The Texas Mid-Coast is an ecologically unique transition zone with a combination
    Figure 10. Changes in storm surge caused by a Category 2 hurricane.            30
                                                                                               of fresh and salt wetlands surrounded by shallow bays and a low salinity
    Figure 11. Changes in storm surge caused by a Category 2 hurricane in                      environment. These productive ecosystems attract several critical species of
    Matagorda Bay. 31                                                                          aquatic and terrestrial wildlife such as whooping cranes, migratory waterfowl,
                                                                                               Kemp’s Ridley sea turtles, among others. In addition to serving as habitats, these
    Figure 12. Days with min temperature below 32°F and max temperature
    above 95°F.        33                                                                      ecosystems in the Mid-Coast region also provide vital benefits to the surrounding
                                                                                               coastal communities, including recreation, employment, flood protection, and
    Figure 13. Land use changes.         36                                                    carbon sequestration, playing an integral role in the socio-economic development
                                                                                               of these areas. The nearby coastal towns, with numerous recreational opportunities,
    Figure 14. Land use changes in Aransas NWR.            37
                                                                                               further enhance the economic and cultural importance of the Mid-Coast region.
    Figure 15. Land use changes in Guadalupe Delta WMA.           38                           The Texas Mid-Coast, however, is highly vulnerable to coastal hazards that are
    Figure 16. Land use changes in Matagorda Bay.          39                                  expected to become more frequent and severe in the face of a changing climate.
                                                                                               The region is expecting greater than the global average increase in sea level rise
    Figure 17. Social vulnerability rating for study area.		      47                           due to other non-climatic processes such as artificial groundwater and oil/gas
                                                                                               extraction that enhance vertical land subsidence. Combined with an increase in
    LIST OF TABLES                                                                             storm surge events, the coastal inundation and flooding pose direct challenges
                                                                                               to the built and natural infrastructure of the region. The macroclimatic drivers
    Table 1. Examples of optimum temperature and salinity ranges for two common                of changes in temperature and precipitation extremes further increase the
    estuary-dependent fishes in the Mid-Coast. 44                                              vulnerability of ecosystems with spillover effects on the dependent species and
                                                                                               coastal communities. The expected future growth and development in the region,
    Table 2. Current and future population projections. 48
                                                                                               compounded with climate variability, will lead to changes in coastal habitats,
    Table 3. Social vulnerability indicators.     49                                           freshwater inflows, and other socio-economic implications.

    Table 4. Examples of projects funded from the Deepwater Horizon Oil Spill. 52              This assessment distills the larger context of coastal risks down to a localized
                                                                                               understanding of the Mid-Coast region’s exposure for present and future threats
    Table 5. Examples of major federal and state level funding opportunities for               posed by climate change to people and wildlife. It considers a full range of
    nature-based projects.     55
                                                                                               scientifically plausible outcomes using a combination of climate change modeling

4                                                         Texas Mid-Coast Climate Assessment   Executive Summary                                                                     5
Socio-economic and
    tools, geospatial tools, literature reviews, and publicly available climate and non-
    climate related datasets to gain a comprehensive understanding of vulnerabilities of

                                                                                                 Environmental Impacts
    the region. Some of the key findings from this assessment are as follows:

    Climate Change Projections                                                                   Projected changes to coastal habitats and wildlife: As much as 21% of land
                                                                                                 in the Texas Mid-Coast is expected to be converted to open water by the end

    and Exposure                                                                                 of the century, with the erosion of about 56% of freshwater
                                                                                                 wetlands and conversion of tidal wetlands in Guadalupe Delta
    Sea level rise: An intermediate low sea level rise scenario (3 feet) will lead to            to open water. Tidal wetlands in the barriers islands of
    widespread inundation to critical areas such as Matagorda Island unit of Aransas             Aransas NWR are also expected to erode
    National Wildlife Refuge (NWR), half of the Big Boggy NWR, majority of San                   and convert to open water. The
    Bernard NWR, and Mad Island Wildlife Management Area (WMA). Roads                            resulting loss in crucial habitat
    and infrastructure at the coastal towns of Rockport and Aransas Pass will face               will be consequential for whooping cranes and
    inundation. The shallow land between Guadalupe Bay and Hynes Bay will be lost,               migratory waterfowls. Loss of saltwater wetlands at                        Big
    resulting in an intrusion of saltwater in the nearby lakes, bayous, and Guadalupe            Boggy NWR will also lead to disruptions in birding and
    River streams that flows to the bay. In Jackson, an intermediate low sea level rise          nesting sites for thousands of ducks and geese.
    will lead to the intrusion of saltwater into the lower Lavaca River basin and other          Projected changes to water quantity and quality: Guadalupe, San Antonio,
    small creeks that empty in Lavaca Bay. Sea level rise at an intermediate level (5            Colorado, and Lavaca Rivers are already showing impaired water quality and
    feet) will also pose damages to the parts of Aransas NWR located in Calhoun, and             declining 7-day minimum flows. Freshwater inflows from upstream rivers will
    infrastructure located on the coastal strip of Port Lavaca and Port O’Connor. Sea            further impact the estuaries and bays in the Mid-Coast region. Long-term water
    level rise will also increase high tide flooding from seven flood days at present to         quality trends in Matagorda Bay and Lavaca Bay indicate an increase in salinity by
    60-160 per year by mid-century.                                                              an average 0.3/year in the last 20 years.
    Storm surge: Most of Matagorda Island WMA and Matagorda Peninsula and part                   Key economic sectors: About 44 critical infrastructure facilities in the region,
    of Aransas, Big Boggy, and San Bernard NWRs lie in a Category 2 storm surge                  such as city halls and police departments, are susceptible to an intermediate low
    zone. In the intermediate low sea level rise, the extent of flooding in these areas          sea level rise. Commercial and recreational fisheries in the Mid-Coast estuaries, an
    will significantly increase. New areas will also become vulnerable to a Category 2           important economic driver, can be adversely impacted by changes in water quality
    storm surge. For example, Guadalupe Delta and Goose Island State Park, which                 and reductions in freshwater flows delivered from the Guadalupe-San Antonio
    are not currently susceptible to flooding if a Category 2 storm hits Matagorda               River basin and Colorado-Lavaca River basin. The ecotourism opportunities
    Island, will face heavy flooding in the future.                                              provided by Aransas NWR, Goose Island State Park, including the coastal tourism
    Temperature and precipitation: The number of days when the temperature dips                  sites in the nearby towns such as the fishing piers and beach parks, will also be
    below zero will follow a negative trend in the future for all the Mid-Coast counties.        impacted by changing climate leading to losses in visitor-related expenditures and
    In a lower-end scenario (RCP 4.5), the Rockport Station data shows about 4.3                 employment in the region.
    frost days by the end of this century from an average of 8.2 frost days in 2010.             Socially vulnerable population: Census level data of the six Mid-Coast counties
    Days per year with a max temperature above 95°F in Rockport and surrounding                  show relatively moderate to high social vulnerability as compared to the other
    Mid-Coast areas are projected to increase from 33.8 in 2020 to 70.8 in 2099                  communities in the state. The total population in the Mid-Coast counties of
    under a lower-end scenario of global emissions. The frequency and intensity                  Aransas, Calhoun, Jackson, Matagorda, Refugio, and Victoria will increase
    of extreme precipitation events and hurricane-induced rainfall are expected to               by more than 24%, with a positive trend in the population of Hispanic and
    increase under a higher-end scenario in the entire Southern Great Plains region,             Non-Hispanic Black people in four out of six counties. Additional factors that
    including the Texas coastline. Sea surface temperature has also been increasing in           contribute to the social vulnerability of the region include a high percent of the
    the Gulf of Mexico and associated estuaries and bays. Based on the measurements              population over 65, percent of housing with mobile homes, and percent of the
    from Texas Parks and Wildlife Department, the monthly median temperature in                  population with disabilities in the region.
    Guadalupe Estuary has increased by about 1.8°F (1°C) between 1990 to 2015 for
    the months of July to August.

6                                                           Texas Mid-Coast Climate Assessment   Executive Summary                                                                      7
In this time of increasing climate variability, local leaders and decision-makers                 •   Restoring natural hydrological flow by enhancing tidal connectivity where
    in the Mid-Coast need to account for these risks in their future planning. The                        feasible.
    vulnerability information gained from this assessment is followed by adaptation
                                                                                                  Build resilient coastlines and communities that can withstand projected
    assessment to identify existing and potential options and strategies to lower
                                                                                                  changes and extreme events by:
    specific climate vulnerabilities and build resilience. With the high importance
    and vulnerability of vital ecosystems in the region, the assessment calls for a                   •   Prioritizing natural infrastructure and nature-based strategies to shore up
    strong investment in nature-based solutions and ecosystem restoration priorities.                     coastal resources and defend from extreme storm events, particularly in low
    Plans and projects recently funded by the RESTORE Act, the National Fish and                          to moderate income communities, physically vulnerable areas, and areas
    Wildlife Foundation’s Gulf Environmental Benefit Fund, the Gulf of Mexico                             with critical facilities identified in this assessment.
    Energy and Security Act, and the Texas Coastal Resiliency Master Plan (Resiliency
                                                                                                      •   Participating in the Texas General Land Office’s Technical Advisory
    Plan), among others, are already prioritizing ecosystem conservation and
                                                                                                          Committee dedicated to scoping and conceptualizing coastal projects for
    restoration in the Mid-Coast.
                                                                                                          the Texas Coastal Resiliency Master Plan.
    The assessment outlines the following policy recommendations for future
                                                                                                      •   Integrating proactive hazard mitigation and resilience planning by
    restoration and adaptation strategies to address climate-related hazards to critical
                                                                                                          incorporating climate change projections in future coastal development
    natural and socio-economic assets.
                                                                                                          and infrastructure expansion.
    Conserve and restore wetlands to safeguard whooping cranes and other coastal
                                                                                                      •   Building up community capacity through shared data repositories
    species to maintain Texas’ coastal heritage of recreation and a vibrant seafood
                                                                                                          for hazards and risks specific to the region and through participatory
    industry by:
                                                                                                          workshops to help develop their coastal restoration projects. (For
        •   Investing in strategic coastal land acquisitions, expansion, and ecosystem                    example, the Community Health and Resource Management
            restoration priorities for critical NWRs and WMAs identified in the                           (CHARM) workshops hosted by the Texas Community
            region, leveraging Deepwater Horizon oil spill and state and federal                          Watershed Partners of Texas A&M University, and The Coastal
            funding programs identified in this assessment. This includes coordination                    Restoration Toolkit developed by Restore America’s Estuaries).
            with partner agencies and private landowners to protect vulnerable
            wetlands on both public and private lands.
        •   Working with conservation planners, wildlife biologists, and resource
            managers to protect winter habitat for whooping cranes. This includes
            creating incentives for private landowners to provide habitat for the
            protection of vulnerable and endangered species on their land.
        •   Implementing living shoreline techniques to reduce the intrusion of
            saltwater along the bay and protect wetlands, refuge systems, protected
            areas, as well as improve water quality.
    Ensure enough freshwater reaches Texas’ bays and estuaries to maintain (or
    improve) ecological health of these important ecosystems by:
        •   Conducting studies and analyses to support the revision of environmental
            flow standards pursuant to the adaptive management process of Senate
            Bill 3, enacted in 2007, in order to identify flow levels adequate to protect
            healthy streams, rivers, and bays.
        •   Establishing set-asides, pursuant to Senate Bill 3, of reasonable amounts of
            unappropriated water to help maintain critical freshwater inflow.
        •   Identifying and implementing affirmative strategies for converting some
            water previously permitted for other uses, including return flows, to
            freshwater inflow protection as contemplated by Senate Bill 3 to protect
            freshwater inflows to key habitats.

8                                                            Texas Mid-Coast Climate Assessment   Executive Summary                                                                     9
INTRODUCTION
                                                                                      Climate variability will pose significant socio-economic and environmental
                                                                                      consequences to Coastal Texas. To understand these impacts, the decision-makers
                                                                                      in the region need to understand the specific climate vulnerabilities and prioritize
                                                                                      adaptation strategies for future capital investments. The purpose of this assessment
Climate variability will pose significant socio-economic                              is to equip local leaders and decision-makers in the Texas Mid-Coast with locally
                                                                                      relevant information about the area’s future related to climate change impacts,
and environmental consequences to Coastal Texas.                                      enabling them to make greater investments in natural assets to shore up coastal
                                                                                      environments for wildlife, local economies, and protection of their communities. It
                                                                                      considers a full range of scientifically plausible outcomes that threaten the viability
                                                                                      of the region using best-available science. In doing so, the assessment aims to serve
                                                                                      as a foundation for decision-makers to make informed choices for the present and
                                                                                      future of the Mid-Coast region.
                                                                                      The objectives of this assessment are threefold:
                                                                                      1. To provide the latest information regarding climate change-related risks to the
                                                                                         Texas Mid-Coast.
                                                                                      2. To examine the impacts of climate change on key socio-economic and
                                                                                         environmental assets in the region.
                                                                                      3. To explore the adaptation planning, including funding mechanisms for nature-
                                                                                         based projects that can be utilized to address these risks.
                                                                                      This assessment draws from the best-available science to characterize multiple
                                                                                      variables associated with climate change that are likely to interact and lead to
                                                                                      compound risks for people and wildlife. The assessment synthesizes diverse sources
                                                                                      of information pertaining to physical and demographic trends and projections
                                                                                      over the next several decades and evaluates the potential impacts of these changes
                                                                                      on critical resources that drive the local economy. It seeks to understand, to the
                                                                                      extent possible, how critical assets, like wetlands and whooping crane populations,
                                                                                      will change over the coming decades, given projected changes in the system due
                                                                                      to natural and human-induced disturbances. This assessment intends to serve as
                                                                                      a resource for decision-makers, coastal planners, and restoration practitioners by
                                                                                      identifying strategies that ensure the long-term resilience of communities and
                                                                                      natural assets in the region.

                                                                                      State of Climate Science
                                                                                      Evidence of climate variabilities are widespread and scientifically documented at
                                                                                      the global (Church et al., 2013; IPCC, 2013), national (Romero-Lankao et al.,
                                                                                      2014), and state (Kloesel et al., 2018; Runkle et al., 2017) levels. While exploring
                                                                                      all these sources is beyond the scope of this work, some state-of-the-art climate
                                                                                      science works are discussed in this section to serve as a baseline understanding of
                                                                                      climate change vulnerabilities for this assessment.
                                                                                      IPCC’s Fifth Assessment Report (AR5) provides robust science on global-scale
                                                                                      assessment of observed and projected climate variability. The land and ocean
                                                                                      surface temperature data in the report show warming of 1.5°F (0.85°C) for the
                                                                                      entire globe over the period of 1880 to 2012 (IPCC, 2013). The annual average
10                                               Texas Mid-Coast Climate Assessment   Introduction                                                                              11
temperature in the Southern Great Plains, including Texas, may increase by 3.6°–             Figure 1. A typical                                                      STEP 1.
     5.1°F by the mid-21st century and 4.4°–8.4°F by the late 21st century depending              framework for                                              ESTABLISH CONTEXT AND FOCUS
     on the levels of greenhouse gas emissions (Kloesel et al., 2018).                            vulnerability                                             • Identify goals and objectives
                                                                                                  and adaptation                                            • Consider needs and opportunities
     Along the Texas coastline, global warming and climate change will lead to                                                                              • Create asset inventories
                                                                                                  assessments.
     increasing risks from sea level rise and storm surge events. The Gulf of Mexico
     has already warmed by 0.6°F (0.31°C) from 1982 to 2006, and sea levels have
     increased at the rate of 2 to 3 mm/year from 1950 to 2000 due to ocean thermal                                       STEP 5. MONITORING AND                                                       STEP 2. ASSESS VULNERABILITY
     expansion and glacier mass loss (Hoegh-Guldberg et al., 2014). With respect to                                              EVALUATION                                                            • Select climate change projections
     storm surge, the latest IPCC reports do not provide conclusive evidence due to the                             • Track recent changes in climate                                                    and timeframes
     absence of long-term trends. However, the reports conclude that projections from                                 science                                                                          • Assess biophysical impacts
     general circulation models (GCM) under 5.4°F (3°C) to 7.2°F (4°C) of warming                                   • Evaluate changes in vulnerabilities                                              • Evaluate social vulnerability
                                                                                                                      and make adjustments
     indicate an increase in the global number of very intense tropical storms with sea
     level rise leading to high surge levels (Collins et al., 2019; Hoegh-Guldberg et al.,
     2018).
                                                                                                                                      STEP 4. IMPLEMENTATION                           STEP 3. ASSESS ADAPTATION
     Following the third U.S. National Climate Assessment, NOAA released state-level
                                                                                                                               • Communicate risks                                  • Consider options for nature-based
     climate summaries to provide localized assessments of climate change across the
                                                                                                                               • Engage decision-makers & stakeholders                solutions, where appropriate
     country. The findings for Texas (Runkle et al., 2017) are summarized below.                                               • Incorporate climate projections in                 • Identify funding streams and existing
      •   An increase in mean annual temperature by 1°F in the first half of the 20th                                            formal planning                                      tools
          century which is projected to increase by the end of this century.
      •   An increase in extreme precipitation and drought intensity.
      •   An increase in hurricane-related precipitation, surge height, and the intensity         expected climate and its effects (IPCC, 2014). The goal of adaptation is to
          of the strongest hurricanes.                                                            moderate or avoid harm or exploit beneficial opportunities to tackle climate
                                                                                                  change. Adaptation decisions require identifying strategies, funding opportunities,
      •   An increase in sea levels between 1 to 4 feet by 2100.                                  and tools available for resource managers to help communities reduce their
                                                                                                  vulnerabilities. Section 6 of this assessment delves deeper into adaptation planning

     Analytical Framework
                                                                                                  with a specific focus on nature-based solutions due to the high importance
                                                                                                  and vulnerabilities of natural assets in the region. This is followed by policy
                                                                                                  recommendations to inform future adaptation strategies and efforts in the region.
     To achieve the first two objectives of this assessment, a vulnerability assessment
     is performed. As defined by IPCC (2014), vulnerability is the propensity or                  Conducting a comprehensive vulnerability tailored for local contexts is the first
     predisposition to be adversely affected (IPCC, 2014). In climate change literature,          step for bringing the attention of decision-makers towards climate risks and
     vulnerability is a function of exposure to climate-related stressors, sensitivity of         adaptation needs. This is followed by an adaptation assessment to identify existing
     social and natural systems, and adaptive capacity of these systems. The recent               and potential options and strategies to lower specific climate vulnerabilities and
     vulnerability frameworks also integrate social vulnerability, referring to social            build resilience. To further facilitate the decision-making process, subsequent
     characteristics of a system, due to its ability to influence sensitivity and adaptive        steps involve implementation and monitoring where the adaptation planning is
     capacity of a system (Binita et al., 2015). An integrated biophysical and social             translated to real-world projects and policies, which are continuously reassessed as
     vulnerability framework provides a basis to perform a comprehensive vulnerability            the climate science and projections evolve over time. Figure 1 presents a generic
     assessment. To understand the vulnerability of the Mid-Coast, this assessment                framework for assessing vulnerability and adaptation, which is modified to fit the
     begins by characterizing the socio-economic and environmental assets in the study            context of this assessment.
     area (Section 2). Exposure is analyzed by identifying climate change projections             This assessment performs the first three steps of the framework to achieve its goals
     for the region (Section 3). This is followed by an analysis of how these impacts will        and objectives. The following methods are employed: climate change modeling
     affect the Mid-Coast (Section 4) and an assessment of social vulnerability in the            tools, geospatial tools, literature reviews, and publicly available climate and non-
     region (Section 5).                                                                          climate related data (Appendix A).Future work stemming from this assessment
     A vulnerability assessment is a precursor to assessing adaptation planning                   will focus on supporting Steps 4 and 5 through various risk communication,
     (Objective 3). Adaptation is defined as the process of adjustment to actual or               education, and other outreach efforts.

12                                                           Texas Mid-Coast Climate Assessment   Introduction                                                                                                                         13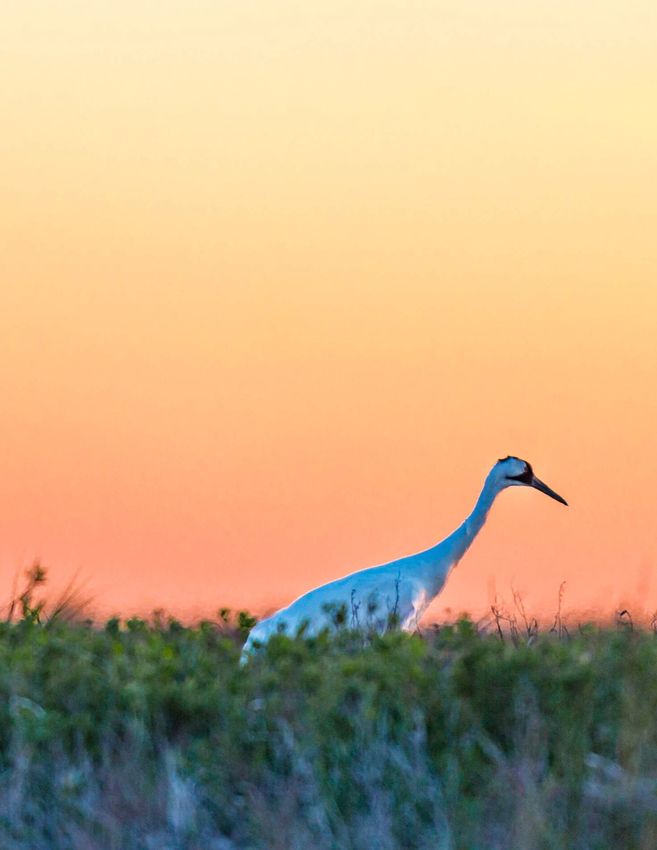
Deepwater Horizon oil spill over the last five years are also mostly in the upper
                                                                                                                     coast.
                                                                                                                     More recently, studies are emerging from other funding sources such as
                                                                                                                     Community Development Block Grant Disaster Recovery (CDBG-DR)
                                                                                                                     funds with a focus on the mid-coast counties. One example is the Economic
                                                                                                                     Development and Strategy Diversification Study (2020) conducted by the
                                                                                                                     Texas General Land Office (GLO) that covered the Aransas, Calhoun, Refugio,
                                                                                                                     and Victoria counties. This study created an inventory of economic assets and
                                                                                                                     deficiencies in the region and provided recommendations with the aim of
                                                                                                                     enhancing resilience to climate hazards. One of the major recommendations was to
                                                                                                                     aid these counties in pursuing state or federal funding opportunities.
                                                                                                                     The 2019 Texas Coastal Resiliency Master Plan (Resiliency Plan) created by the
                                                                                                                     Texas General Land Office (GLO) has been instrumental in identifying coastal
                                                                                                                     risks, actions, and specific projects for building resilience along the entire Texas
                                                                                                                     Coast in the face of increasing climatic and non-climatic pressures. The Resiliency
                                                                                                                     Plan calls for state’s investment in the form of legislative appropriation and
                                                                                                                     other federal, state, and local funding streams to implement priority projects.
                                                                                                                     Additionally, billions of dollars are available to the state of Texas for coastal
                                                                                                                     restoration, flood mitigation, and disaster prevention efforts. These sources of
                                                                                                                     funding result from the Deepwater Horizon oil spill, Hurricane Harvey, and other
                                                                                                                     flooding events, and through other sources like the Matagorda Bay Mitigation
                                                                                                                     Trust, and the revenue sharing provisions in the Gulf of Mexico Energy Security
                                                                                                                     Act. These investment streams represent a significant opportunity to address the
                                                                                                                     region’s future and help mitigate threats related to climate change.

Figure 2.             The geographic focus of this work lies on the coastal basins of Guadalupe, San
Geographic scope of   Antonio, Colorado, and Lavaca Rivers. This region includes major estuaries
this assessment.      (Guadalupe and Colorado Lavaca), bays (San Antonio, Guadalupe, Lavaca,
                      and Matagorda), and the surrounding counties (Aransas, Calhoun, Jackson,
                      Matagorda, Refugio, and Victoria) (See Figure 2). The next section explains the
                      rationale behind narrowing down on this particular region for conducting this
                      assessment.

                      Management Needs and
                      Opportunity
                      Areas like Houston, Rockport, and Port Aransas suffered major impacts from
                      Hurricane Harvey. Even though the San Antonio Bay and Matagorda Bay areas are
                      eligible for all of the same funding opportunities, compared to other hard-hit areas
                      of the state, this part of the coast seems to be receiving less attention in the various
                      ongoing studies and activities. For instance, the vast majority of investments
                      outlined in the Army Corps’ Coastal Texas Protection and Restoration Feasibility
                      Study are in the upper Texas coast, and the projects funded by sources from the
14                                                                              Texas Mid-Coast Climate Assessment   Introduction                                                                           15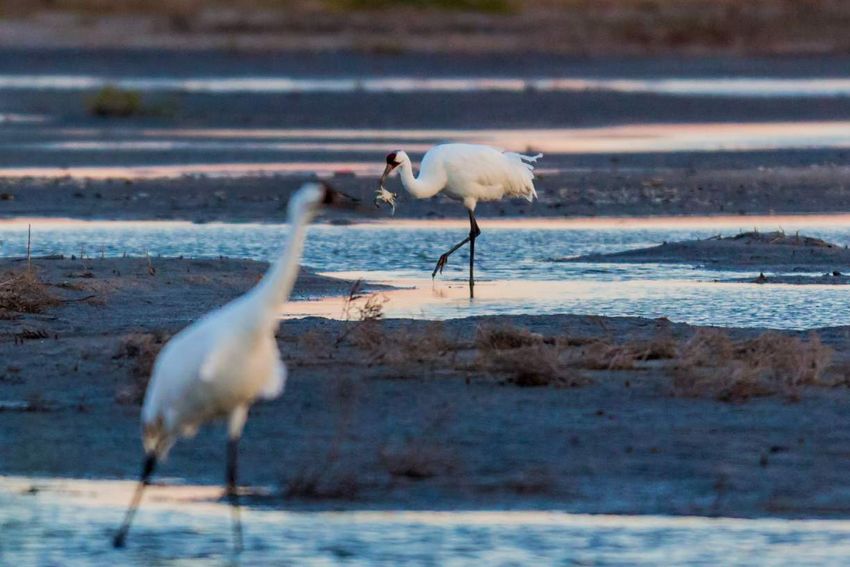
THE TEXAS MID-COAST                                                                     Overview of the Mid-Coast Region
                                                                                         The Texas Mid-Coast is situated within an ecological transition zone teeming with
                                                                                         environmental assets such as wetlands and associated wildlife. The Mid-Coast receives
 Temperature sensitivity, combined with accelerating rates of                            freshwater inflow from the San Antonio and Guadalupe River basins that flow into the
                                                                                         Guadalupe estuary and San Antonio Bay and the Colorado and Lavaca Rivers that flow
 relative sea level rise and changing rainfall regimes, leaves coastal                   into the Matagorda Bay. However, this region is highly vulnerable to storms, sea level
 wetlands across this region of Texas highly vulnerable and in a                         rise, changes in extreme temperatures and rainfall regimes (Osland et al., 2013, 2016).
                                                                                         Tidal saline wetlands are comprised of a combination of salt marshes and mangrove
 state of flux.                                                                          forests, and their relative abundance is largely driven by the frequency and intensity of
                                                                                         extreme cold temperatures. For instance, relatively small declines in the occurrence of
                                                                                         extreme winter lows can cause dramatic changes to the ecosystem structure and function
                                                                                         of wetlands in the form of inland mangrove expansion and salt marsh displacement.
                                                                                         Freshwater wetlands in the region are susceptible to changes in upstream freshwater
                                                                                         inflows and displacement by saltwater intrusion. Additionally, the temperature and
                                                                                         precipitation changes threaten the viability of critically important wildlife and migratory
                                                                                         birds that are dependent on the health of these wetlands. This temperature sensitivity,
                                                                                         combined with accelerating rates of relative sea level rise and changing rainfall regimes,
                                                                                         leaves coastal wetlands across this region of Texas highly vulnerable and in a state of flux.
                                                                                         These climate-induced changes also impact other ecosystem services that drive many
                                                                                         local and regional economic activities such as fishing, birdwatching, and associated
                                                                                         ecotourism in the Mid-Coast. Sea level rise and storm surge directly threaten the coastal
                                                                                         infrastructure in the Mid-Coast counties, which are experiencing a higher than average
                                                                                         rate of sea level rise. Understanding how sea level rise and changing inundation regimes,
                                                                                         as well as extreme temperatures and precipitation, will interact with expected growth

                                               2
                                                                                         and development in the region needs closer scrutiny to enable resource managers to
                                                                                         prepare for the effects of climatic drivers on coastal wetland community assemblages.
                                                                                         The following subsections outline the culturally and economically important natural
                                                                                         assets of the region that are at risk but vital to the cultural heritage and the local and
                                                                                         regional vibrancy of the Texas Mid-Coast.

                                                                                         Regional Environmental Assets
                                                                                         The Texas Mid-Coast is home to ecologically important hardwood wetland forests,
                                                                                         associated wetlands, and coastal prairies. Figure 3 provides an overview of environmental
                                                                                         assets in the region, including watershed boundaries, National Wildlife Refuges
                                                                                         (NWRs), Wildlife Management Areas (WMAs), and State Parks.
                                                                                         Two out of the seven major estuaries in Texas are located along the Mid-Coast region.
                                                                                         The natural rainfall patterns in Texas create a north-south gradient in the estuaries with
                                                                                         decreasing freshwater flow and increasing salinities moving southward (Bugica et al.,
                                                                                         2020). The Mid-Coast estuaries rely on the quantity and quality of freshwater inflows
                                                                                         from rivers and creeks to maintain their salinity, nutrient, and sediment regimes. The
                                                                                         Guadalupe Estuary, which includes the San Antonio Bay, surrounds the Mid-Coast
                                                                                         counties of Aransas, Refugio, and Calhoun. The freshwater inflow from Guadalupe and
                                                                                         San Antonio Rivers in the Guadalupe estuary creates a salinity gradient and provides
                                                                                         nutrients and sediments critical to the estuary-dependent species such as fish, shrimp,
16                                                  Texas Mid-Coast Climate Assessment   The Texas Mid-Coast                                                                             17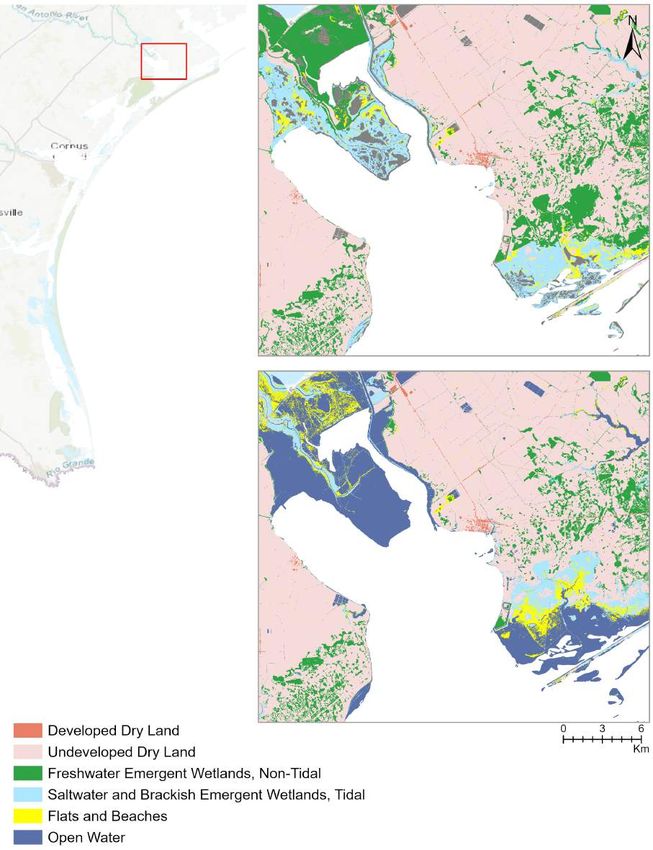
and oysters. Another significant estuary in the upper Mid-Coast of Matagorda,
     Jackson, Victoria, and Calhoun counties is the Colorado-Lavaca Estuary. The estuary,
     including the Matagorda Bay and Lavaca Bay, is the second largest in the state and
     receives more than 3 million acre-feet of freshwater inflow from the Colorado and
     Lavaca Rivers (TWDB, 2021).
     As much as 55% of the land area in Aransas County is covered with wetlands
     (NOAA, 2016). Sites such as Aransas NWR in the Mid-Coast serve as habitat to
     various species due to their unique ecosystems. The Aransas NWR is surrounded
     by shallow bays resulting in a shift of the wetland ecosystem from estuarine to
     freshwater. The Matagorda island unit of the NWR is primarily composed of barrier
     islands extending down the Texas coastline. Big Boggy NWR and parts of San
     Bernard NWR in Matagorda County are internationally significant shorebird sites
     and together form a part of the Texas Mid-Coast Refuge Complex. These two NWRs
     consist of several coastal wetlands, including salt and freshwater marshes, ponds, and
     coastal prairies.
     About 15,000 acres of Mid-Coast wetlands are preserved and protected in Guadalupe
     Delta WMA and Mad Island WMA. Guadalupe WMA units in Calhoun,                                    Figure 3. Overview of
     Victoria, and Refugio are predominantly freshwater marshes receiving water from                  environmental assets.
     the Guadalupe River. Mad Island WMA is a 7200-acre area consisting of fresh,
     intermediate, brackish, and saline marshes.                                                      ocean-related businesses provided 13.1% of total jobs marking a 68% increase from
     A diversity of wildlife flourishes in these protected habitats of the Mid-Coast. Coastal         2005 (NOAA, 2016). As compared to the rest of the state, the economic output
     prairies in the Aransas NWR provide habitat for federally listed species such as                 generated by the oil and gas industry is not a significant driver in these counties. For
     whooping cranes. In the winter of 2019-2020, 509 whooping cranes migrated to the                 instance, offshore mineral extraction contributed to more than 52% of the ocean jobs
     Aransas NWR near Austwell. Young blue crabs, the primary food source of whooping                 in the state. However, with the exception of Refugio (63.6%), the contribution of
     cranes, also seek the low salinity of Aransas NWR. The Matagorda Island Unit of the              such activities to the ocean-related economy had been 20.2% to Aransas and 7.1%
     Aransas NWR is home to reddish egrets, alligators, and coyotes (FWS, 2020). The                  in Jackson with no offshore mineral extraction jobs in the remaining counties since
     beach and dune system of barrier islands also provide nesting grounds for Kemp’s                 2005. On the other hand, the tourism and recreation sector constitute a major part
     Ridley sea turtles. The low salinity and shallow environment of the Guadalupe delta              of these ocean-related jobs in this region, accounting for more than half of such jobs
     further attract several other threatened and endangered species such as brown pelican,           in Aransas (75.5%), Calhoun (53.3%), and Matagorda (63.7%) counties.
     reddish egret, and white-faced Ibis (TPWD, n.d.). The 4500 acres of salt marshes in              In 2019, the tourism sector generated about $490 million in direct travel spending
     Big Boggy harbor more than 55,000 geese and 15,000 ducks annually. Big Boggy and                 in Aransas, Calhoun, Jackson, Matagorda, Refugio, and Victoria counties (Travel
     San Bernard NWRs are home to more than 300 species of birds with waterfowl and                   Texas, 2019). With its idyllic beaches and quaint coastal towns, the Mid-Coast
     neotropical migratory songbirds using these areas as crucial points in their journey             region provides several recreational opportunities and attracts millions of visitors.
     across the Gulf.                                                                                 The coastal town of Seadrift, a popular choice for fishing and paddling activities, has
                                                                                                      been experiencing positive growth in direct travel spending by the visitors over the

     Regional Socio-economic Assets
                                                                                                      last ten years. The Aransas NWR is also an attractive recreational site and adds to the
                                                                                                      economic opportunities to the local communities of Aransas, Calhoun, and Refugio
                                                                                                      counties. In 2017, about 84,000 visitors spent a total expenditure worth $2.5
     The economic stability and prosperity of the Texas Mid-Coast region is inextricably              million on activities related to wildlife photography, auto tour, visitor center, etc.,
     linked to the health of the Gulf of Mexico and associated bays. A healthy marine life            in the Aransas NWR (FWS, 2019). Goose Island State Park covers 321 acres and
     of the Guadalupe and Colorado-Lavaca estuaries is an integral part of the commercial             attracts over 190,000 visitors annually for hiking, camping, and fishing. Matagorda
     and recreational fishing industry through providing employment opportunities                     Bay Nature Park, a 1,333-acre park and nature preserve, is another popular spot for
     across the Mid-Coast counties. As of 2015, ocean-related businesses in Refugio and               birdwatching and wetland paddling. With a growing fondness for outdoor recreation
     Aransas counties provided 25% of the total jobs in these counties, representing a                due to the looming pandemic, ecotourism in the Mid-Coast is bound to increase in
     52% and 26% increase since 2005, respectively (NOAA, 2016). In Calhoun County,                   the short term. Population expansion in the longer term will further add to an influx
     ocean-related jobs grew 70% from 2005 to 2015 (NOAA, 2016). In Jackson, jobs in                  of visitors to these coastal areas thriving with wildlife and ecological resources.

18                                                               Texas Mid-Coast Climate Assessment   The Texas Mid-Coast                                                                        19
CLIMATE CHANGE
This section describes existing trends and projections for various climate-induced
hazards that pose threats to the Texas Mid-Coast region. It focuses on three key
climate change projections: sea level rise, storm surge, and changes in temperature
and precipitation. Consistent with global studies such as IPCC AR5 (IPCC,
PROJECTIONS FOR
2014), national studies such as Fourth National Climate Assessment (Avery et al.,
2018), and local studies such as Resiliency Plan, a timeframe of 2100 is chosen for
the projections in this assessment.
THE MID-COAST Sea Level Rise and Inundation
Regimes
The Texas coastline has experienced a rise in sea levels by 0.4-1.4 feet over the past
100 years, depending on local topography and rate of subsidence (Runkle et al.,
2017). In the Texas Mid-Coast, relative sea level is projected to increase between
2.82 to 9.32 feet by 2100, depending on the future scenarios. The relative sea level
rise trends, highest in Texas and Louisiana, enhance the global sea level rise by
about 0.5-2 mm/year as it takes into account regional changes in ocean circulation
and local vertical land motion, thereby providing an estimate of sea level rise based
on specific local variations. The relative sea level rise in Texas, including the Mid-
Coast, is expected to be greater than the global average due to other non-climatic
processes such as artificial groundwater and oil/gas extraction that enhance land
3
subsidence (Sweet et al., 2017).
This assessment utilizes relative sea level rise data from NOAA to identify and map
the areas vulnerable to permanent inundation in the Texas Mid-Coast. Based on
NOAA’s relative sea level rise projections for the nearest location (Rockport, TX),
four local scenarios – Intermediate low (3 feet), Intermediate (5 feet), Intermediate
high (7 feet), and High (9 feet) – are used to show the areas at risk by 2100 (Figure
4). In Rockport, TX, the historical observations depict a 5.86 mm/year increase
in relative sea level rise trend from 1973 to 2020. It is worth noting that future
projections in Rockport are slightly higher than the nearest tide gauge located in
Corpus Christi, indicating a higher vertical land movement along this stretch of
the coastline. Figure 4 provides an overview of the Mid-Coast’s vulnerability under
different sea level rise projections. Matagorda Peninsula, a strip of land between
Matagorda Bay and the Gulf of Mexico, will face significant inundation with an
intermediate low sea level rise. In Jackson, an intermediate low sea level rise will
lead to the intrusion of saltwater into the lower Lavaca River basin and other small
creeks that empty in Lavaca Bay.
20 Texas Mid-Coast Climate Assessment Climate Projections 21INTERMEDIATE INTERMEDIATE
LOW HIGH
INTERMEDIATE HIGH
Figure 4. Inundation caused by four different scenarios of sea level rise.Figure 6.
Figure 5.
Wildlife Management
National Wildlife Refuges inundated
Areas inundated by
by an intermediate low scenario of
an intermediate low
sea level rise
scenario of sea level
rise.
Figure 5 presents NWR areas that will experience widespread inundation with an Even at an intermediate low estimate of sea level rise, parts of the Guadalupe delta
intermediate low sea level rise by 2100. At this point, most of the land area of the surrounding Mission Lake will be inundated (Figure 6). The shallow land between
Matagorda Island unit of Aransas NWR is likely to lose land and convert to open Guadalupe Bay and Hynes Bay will be lost, resulting in an intrusion of saltwater in
water. Around the east Matagorda Bay, the majority of the San Bernard NWR the nearby lakes, bayous, and Guadalupe River streams that flows to the bay. A 3
located in the county and half of the Big Boggy NWR will face inundation. feet sea level rise will also lead to land loss at Mad Island WMA (Figure 6).
24 Texas Mid-Coast Climate Assessment Climate Projections 25Figure 7. Figure 8.
Key areas inundated Key areas inundated by
by an intermediate an intermediate scenario
low scenario of sea of sea level rise.
level rise.
Sea level rise will inundate the roads and infrastructure in the coastal towns of Sea level rise at an intermediate level (5 feet) will also pose damages to the physical
Rockport and Aransas Pass (Figure 7). The popular visitor attractions such as and natural infrastructure located on the coastal strip of Port Lavaca and Port
the Rockport beach and fishing pier will be impacted by an intermediate low O’Connor, such as Port Lavaca Bird Sanctuary, Fishing Pier park, and several small
increase of 3 feet in sea level rise. Matagorda Bay Nature Park and the surrounding tourism businesses. The sea level rise will also lead to significant inundation at
Colorado River will also face significant risk due to inundation and intrusion by Aransas NWR in Calhoun (Figure 8). Majority of the Matagorda Peninsula and
sea level rise. Matagorda Beach will be inundated at this point.
26 Texas Mid-Coast Climate Assessment Climate Projections 27Decision-makers need to prioritize the areas at risk of an intermediate low scenario
of sea level rise in their planning. In the worst-case scenario where high estimates
of global emissions continue, the sea level will accelerate much faster, reaching
above the 3 feet levels by as early as 2060. Coastal planners in the Mid-Coast are
also charged with the additional responsibility of dealing with other non-climatic
factors that are enhancing the rate of sea level rise in the region. Risk-averse
decision-makers also need to consider the intermediate high to high scenarios
of sea level rise that would wreak havoc in the Texas Mid-Coast and threaten a
majority of the areas with environmental and socio-economic importance.
Coastal Storms and Storm
Surge
Over the past 20 years, Texas has witnessed several major hurricanes such as
Hurricane Rita (Category 3), Hurricane Ike (Category 2), and most recently,
Hurricane Harvey (Category 4). These hurricane events posed hazards due to
widespread coastal flooding, extreme rainfall, and associated winds in the Mid-
Coast. For example, San Antonio Bay’s western shores experienced the highest
inundation (8 to 10 feet) due to the combined effects of storm surge and tide
during Hurricane Harvey (Blake & Zelinsky, 2018). The barrier islands in
Matagorda experienced storm surge inundation of 4 to 7 feet above ground level.
Climate change is expected to increase the frequency of severe Category 4 and 5
hurricanes such as Harvey (Kossin et al., 2020). The damage potential of these
hurricanes will further increase with a potential rise in sea level.
In this assessment, the areas under risk of storm surge inundation are identified
using the data available through the Resiliency Plan. The Resiliency Plan uses
Maximum of the Maximum Envelopes of Water (MOMs) outputs for a Category
2 storm produced from Sea, Lake, and Overland Surges from Hurricanes
(SLOSH) model. To investigate the areas threatened by a future increase in sea
level rise by 2100, the Resiliency Plan delineates storm surge zones for Category
Figure 9. Inundation is likely to continue in these areas with an increase in sea level rise. 2 plus 3 feet (1 meter) of sea level rise scenarios using the Sea Level Affecting
Increase in inundation For instance, in Fulton, the extent of inland seawater intrusion and inundation Marshes Model (SLAMM) outcome. Layers containing the maximum inundation
regimes in the Rockport- continues to increase with sea level rise (Figure 9). An intermediate high scenario extent under the present and future scenario of 1 meter sea level rise for the
Fulton coastline with an (7 feet) threatens the future existence of other Mid-Coast towns such as Port relevant Mid-Coast region are extracted and modulated in ArcGIS Pro.
increase in sea level rise. Lavaca, whereas other places such as Seadrift and Palacios will lose vital tourism Figure 10 provides an overview of the area susceptible to the current storm surge
infrastructure that is essential for their survival. The sea level rise projections only zone by a Category 2 hurricane in the Texas Mid-Coast. It includes most of
show slight flooding for Austwell at an intermediate-high scenario. Matagorda Island WMA and Matagorda Peninsula and part of Aransas, Big Boggy,
In many of these low-lying Mid-Coast areas, high-tide flooding will also become and San Bernard NWRs. In the intermediate low sea level rise, the extent of
more frequent due to an increase in relative sea level rise. The Rockport tide gauge flooding in these areas will significantly increase.
shows seven high-tide flooding days at present from only one day in 2000. The Depending on the landfall location, new areas will also become vulnerable to a
number of flood days is projected to increase to 60-160 per year by mid-century. Category 2 storm surge, for example, Guadalupe Delta and Goose Island State
While these events are temporary in nature, it still damages the infrastructure Park, which are not currently susceptible to flooding if a Category 2 storm hits
through flooding roads, streets and storm drains. Along the Texas coast, high- Matagorda Island, will face heavy flooding in the future. In case of a storm hitting
tide flooding is also likely responsible for impaired groundwater quality due to the Matagorda peninsula, areas such as Mad Island WMA that are slightly flooded
saltwater intrusion in the aquifer (Sweet et al., 2020). at present will become prone to higher levels of flooding in the future (Figure 11).
28 Texas Mid-Coast Climate Assessment Climate Projections 29Figure 10. Figure 11.
Changes in storm surge caused by Changes in storm surge
a Category 2 hurricane – present caused by a Category 2
(above) and future (below). hurricane in Matagorda
Bay – present (above) and
future (below).
30 Texas Mid-Coast Climate Assessment Climate Projections 31Even a storm making landfall further south in Padre Island will cause flooding in temperature rises over 100°F will increase from about one day in 2020 to more
the Mid-Coast counties of Aransas, Calhoun, and Refugio. In Aransas County, than 52 days under a higher-end emission scenario. Figure 12 shows the changes
the vulnerability of surge-related flooding will increase drastically in the Rockport- in hot and cold days at the Rockport station.
Fulton area with a future 3 feet sea level rise.
The data on annual precipitation changes depict more spatial and temporal
Decision-makers need to consider two important points. Firstly, the risks associated variations across Texas in the future (Jiang & Yang, 2012). At present, the average
with low-probability, high-consequence events such as a Category 5 storm cannot yearly precipitation ranges from 30 to 50 inches in the Texas Mid-Coast, with
be neglected in current and future adaptation planning. Failure to account for small changes expected in the future (Kloesel et al., 2018). However, the frequency
these higher category hurricanes may result in loss of assets and, at times, life in the and intensity of extreme precipitation events are expected to increase under a
Mid-Coast region. Secondly, and more importantly, the current level of hurricane higher-end scenario in the entire Southern Great Plains region, including the
planning, if only focused on gray infrastructure, will not keep up with the future Texas coastline (Kloesel et al., 2018; Runkle et al., 2017). Heavy rainfall that
climatic changes. Recent research has corroborated the fact that the frequency of accompanies a storm event is also projected to increase. During Harvey, the
high-intensity storms (Category 3-Category 5) will increase with climate change mid-coast region experienced about 10-20 inches of heavy rainfall in total (Blake
(Kossin et al., 2020; Walsh et al., 2016). Keeping this in mind, the Category 2 & Zelinsky, 2018). As compared to 1981–2000, Emanuel (2017) projected a
scenario used in the Resiliency Plan does not adequately reflect the future surge sixfold increase in hurricane rains for Harvey-like events in Texas by the end of the
conditions. Additionally, the MOM output used in the study also provides a century.
conservative estimate of maximum inundation for a particular hurricane category
as it does not consider the wind-driven waves that further increase the storm surge Sea surface temperature has also been increasing in the Gulf of Mexico and
height (Glahn et al., 2009). associated estuaries and bays (Hoegh-Guldberg et al., 2014). For this assessment,
observed changes in water temperature are based on the point measurements
collected by Texas Parks and Wildlife Department for Water Data for Texas. The
Extreme Temperature and data shows that monthly median temperature in Guadalupe Estuary has increased
by about 1.8°F (1°C) between 1990 to 2015 for the months of July to August.
Precipitation Research corroborates that the long-term trends in Lavaca Bay, Matagorda
Bay, and San Antonio Bay show a significant increase in summer temperature
Texas is expected to experience warming under all future scenarios. This warming (Bugica et al., 2020). This assessment does not include projected changes in water
will increase the number of extremely hot days and a decrease in the number temperature but assumes the trend of warming likely to continue in the future for
of cold days (Runkle et al., 2017). For instance, the number of days when the the Mid-Coast estuaries.
temperature dips below zero will follow a negative trend in the future for all the
Mid-Coast counties. The assessment uses station data created by the Climate
Explorer (NOAA) that provides downscaled results generated by global climate
models for the Coupled Model Intercomparison Project Phase 5 (CMIP5). In a
lower-end scenario, Aransas, Refugio, Victoria, and Calhoun counties will witness
about 4.3 frost days by the end of this century from an average of 8.2 frost days in
2010. Less than 2 frost days are expected by the end of the century if we continue
to a worst-case scenario of future emission concentrations. The projections for
upper Mid-Coast counties of Jackson and Matagorda show the frost days reducing
by half in 2021 compared with 2010 levels under a low-emission scenario. Frost
days will decrease by more than 80% under a high-emission scenario from about 11
days in 2010 to 2 days in 2021.
On the other hand, days per year with a max temperature above 95°F in Rockport Figure 12. Days with min temperature
and surrounding Mid-Coast areas are projected to increase from 33.8 in 2020 below 32°F (left) and max
to 70.8 in 2099 under a lower-end scenario of global emissions (RCP 4.5). The temperature above 95°F (right).
extent of these days will increase more than thrice to 130.6 by 2099 as compared to
present conditions under a higher-end emission scenario of RCP 8.5. In Rockport,
the number of days with a temperature above 100°F is likely to increase from less
than 1% in 2020 to over 16% in 2099 under a higher-end emission scenario. In
Matagorda and Jackson counties, the number of extremely hot days when the
32 Texas Mid-Coast Climate Assessment Climate Projections 33ENVIRONMENTAL,
This section describes the potential and likely impacts of changing risks from
projected climate change and natural hazards to critical resources and assets
essential to the local, regional, and state economy, including how they may impact
ecosystem services.
SOCIAL, AND Projected Changes to Coastal
Habitats
ECONOMIC IMPACTS Climate change-induced sea level rise and storm surge pose direct threats to the
ecologically important habitats in the Mid-Coast. The data from NOAA’s Office
for Coastal Management reveals that wetland cover in Matagorda, Jackson, and
Victoria counties has decreased over the last twenty years. However, the decrease
has been by less than 1% only. Total wetland area has slightly increased from 1996
to 2016 in other counties ranging from 2.65% for Refugio to 0.86% for Calhoun.
However. climate change is likely to accelerate wetland loss in the future at a rate
slower than the new wetland area is created. According to the Resiliency Plan, the
following habitats within the Guadalupe Bay area are projected to decrease by the
year 2100 due to an intermediate (5 feet) increase in relative sea level: estuarine
wetlands (-20%), freshwater wetlands (-56%), and undeveloped dry land in
surrounding areas (-7%). As much as 21% of the land is expected to be converted
to open water by the end of the century. A map showing these changes in land
cover types by 2100 is provided below (Figure 13). In the Mid-Coast, wetlands in
4
the NWRs and WMAs are projected to be lost and converted to open water by an
intermediate sea level rise scenario.
34 Texas Mid-Coast Climate Assessment Environmental, Social, & Economic Impacts 35Figure 13. Figure 14.
Land use changes – present Land use changes in
(above) and future (below). Aransas NWR – present
(above) and future
(below).
Figure 14 depicts the close-up views of future land use changes in Aransas
NWR and the surrounding areas of San Jose and Matagorda Islands due to an
intermediate sea level rise (5 feet). The near coast saltwater and brackish wetlands
will transition to open water by the year 2100. Most of the tidal wetlands in the
barrier islands of Aransas NWR are expected to erode and convert to open water.
These estuarine habitats provide storm surge buffers, and their loss through erosion
and transition to open water will further increase the severity of future storm surge
and sea level rise in the Mid-Coast.
36 Texas Mid-Coast Climate Assessment Environmental, Social, & Economic Impacts 37Figure 15. Figure 16.
Land use changes in Land use changes
Guadalupe Delta WMA in Matagorda
– present (above) and Bay – present
future (below). (above) and future
(below).
The changes in land cover for Guadalupe Delta WMA and the surrounding Figure 16 depicts the present and future landcover in the critical areas around
Guadalupe Bay are presented in Figure 15. Around the Guadalupe bay, particularly Matagorda Bay, such as Big Boggy NWR, Mad Island WMA, etc. In east
in some Guadalupe Delta WMA units, almost all the freshwater wetlands will Matagorda Bay that surrounds the Big Boggy NWR, much of the saltwater
erode to tidal flats or open waters. This decrease in freshwater wetlands, including wetlands will be lost due to open water. The freshwater wetlands located in
marshes and swamps, will result in an enhanced saltwater intrusion from the Gulf the parts of San Bernard NWR will be replaced by flat shorelines and beaches.
of Mexico. The current saltwater and brackish wetlands in the Guadalupe bay, Similarly, saltwater wetlands in Mad Island WMA and surrounding freshwater
with a slower accretion rate than the rise in sea level and lack of options to migrate wetlands will convert to open water and flat shorelines, respectively.
inward, are likely to convert into open water.
38 Texas Mid-Coast Climate Assessment Environmental, Social, & Economic Impacts 39The changes in temperature and precipitation also poses consequences for the
wetlands in the region. Even small declines in the occurrence of extreme winter
lows can cause dramatic changes to the ecosystem structure and function of
wetlands (Osland et al., 2016). One such threat is the displacement of salt marshes
by inland mangroves. Findings from a study indicated an increase in the mangrove
extent from 1990 to 2010 around the Harbor Island/Port Aransas/Mustang
Island area due to displacement from salt marsh and other wetlands (Armitage et
al., 2015). Precipitation can also cause changes to the existing water balance of
wetlands. An increase in flashier precipitation will increase the length and depth
of flooding for inland wetlands, particularly the smaller wetlands in the region
(Finlayson, 2018).
This loss of wetlands and increased open water is likely to cause cascading impacts
due to their loss of flood buffer capacity and erosion control to the nearby coastal
communities of the Mid-Coast counties. Assuming a loss of 21% and 12% for
freshwater and saltwater marshes respective, research conducted in Galveston
Bay found annual losses up to $51 million from an initial condition to 2100
(Yoskowitz et al., 2017). This research did not include socio-economic pressures
that lead to the loss of wetlands due to coastal squeeze and further add to these
monetary losses in ecosystem services.
Implications for Whooping
Cranes and Other Wildlife
Species concluded that an urgent timeframe (within the next 30 years) is required to tackle
climate change challenges for these birds (Butler et al., 2017).
The wetlands in the Mid-Coast provide crucial nursery habitat for several species,
and the loss will be consequential for these birds and animals. Whooping cranes Migratory waterfowl are dependent on the marshes of Big Boggy NWR,
are one such example that winter in the wetlands of Aransas NWR after migrating Guadalupe WMA, and Mad Island WMA. Other wetland species such as reddish
more than 3,000 miles from Canada. From fewer than 20 birds in 1941, the egret, and white-faced Ibis will be impacted due to loss of foraging grounds at
2019-2020 winter marked more than 500 whooping cranes at Aransas NWR. Guadalupe WMA and Mad Island WMA. Loss of saltwater wetlands at Big Boggy
Unfortunately, the rising sea level not only threatens the coastal wetlands habitat NWR will also lead to disruptions in birding and nesting sites for thousands of
of whooping cranes, but the declining freshwater lens is also unable to support ducks and geese. In addition to land loss, the location of the Mid-Coast in an
their primary food source – blue crabs. The freshwater availability is also impacted ecological transition zone means that even small macroclimatic changes in winter
by other weather patterns such as droughts and upstream water use from the temperature and rainfall can lead to regime shifts in these wetlands and their native
Guadalupe-San Antonio River basin. Nearly 10% of the population died in the vegetation (Osland et al., 2016).
winter of 2008-09 due to the unrestricted use of upstream waters during a drought
An increase in extreme temperature directly threatens and alters several species.
(International Crane Foundation, 2021). Whooping cranes will also be exposed to
While evaluating all these impacts are beyond the scope of this work, one notable
threats from predators as they fly to upland areas in search of freshwater.
example of Kemp’s ridley sea turtles is discussed here. The temperature plays an
To further support their population expansion, The International Crane important role in determining the sex of hatchlings for these endangered sea
Foundation established a habitat goal requiring 50,000 acres of coastal prairie and turtles. Higher temperatures can lead to a low nest success and affect sex ratios
marsh to become suitable for whooping crane habitat. These acres constitute 25 with producing only females.
percent of their long-term target of 200,000 acres of coastal prairies for Whooping
crane habitat to accommodate sea level rise and climate change models by 2024
(International Crane Foundation, 2021). A recent article modeled the population
growth of whooping cranes under different climate change scenarios and
40 Texas Mid-Coast Climate Assessment Environmental, Social, & Economic Impacts 41You can also read