Small Cetacean in a Human High-Use Area: Trends in Harbor Porpoise Abundance in the North Sea Over Two Decades - dpaq.de
←
→
Page content transcription
If your browser does not render page correctly, please read the page content below
ORIGINAL RESEARCH
                                                                                                                                         published: 07 January 2021
                                                                                                                                   doi: 10.3389/fmars.2020.606609

                                            Small Cetacean in a Human
                                            High-Use Area: Trends in Harbor
                                            Porpoise Abundance in the North
                                            Sea Over Two Decades
                                            Dominik A. Nachtsheim 1 , Sacha Viquerat 2 , Nadya C. Ramírez-Martínez 1,3 ,
                                            Bianca Unger 1 , Ursula Siebert 1 and Anita Gilles 1*
                                            1
                                             Institute for Terrestrial and Aquatic Wildlife Research (ITAW), University of Veterinary Medicine Hannover Foundation,
                                            Büsum, Germany, 2 Center of Natural History (CeNak), University of Hamburg, Hamburg, Germany, 3 Fundación Macuáticos
                                            Colombia, Medellin, Colombia

                                            The North Sea is one of the most heavily used shelf regions worldwide with a diversity
                                            of human impacts, including shipping, pollution, fisheries, and offshore constructions.
                                            These stressors on the environment can have consequences for marine organisms,
                             Edited by:
                         Jeremy Kiszka,
                                            such as our study species, the harbor porpoise (Phocoena phocoena), which is
        Florida International University,   regarded as a sentinel species and hence has a high conservation priority in the
                          United States
                                            European Union (EU). As EU member states are obliged to monitor the population
                       Reviewed by:
                                            status, the present study aims to estimate trends in absolute harbor porpoise
                    Philip Hammond,
            University of St Andrews,       abundance in the German North Sea based on almost two decades of aerial surveys
                     United Kingdom         (2002–2019) using line-transect methodology. Furthermore, we were interested in trends
                        Patrick Halpin,
        Duke University, United States
                                            in three Natura2000 Special Areas of Conservation (SACs), which include the harbor
                    *Correspondence:
                                            porpoise as designated feature. Trends were estimated for each SAC and two seasons
                            Anita Gilles    (spring and summer) as well as the complete area of the German North Sea. For the
         anita.gilles@tiho-hannover.de
                                            trend analysis we applied a Bayesian framework to a series of replicated visual surveys,
                   Specialty section:
                                            allowing to propagate the error structure of the original abundance estimates to the
         This article was submitted to      final trend estimate and designed to deal with spatio-temporal heterogeneity and other
                    Marine Megafauna,
                                            sources of uncertainty. In general, harbor porpoise abundance decreased in northern
               a section of the journal
          Frontiers in Marine Science       areas and increased in the south, such as in the SAC Borkum Reef Ground. A particularly
      Received: 15 September 2020           strong decline with a high probability (94.9%) was detected in the core area and main
      Accepted: 01 December 2020            reproduction site in summer, the SAC Sylt Outer Reef (−3.79% per year). The overall
        Published: 07 January 2021
                                            trend for the German North Sea revealed a decrease in harbor porpoise abundance
                             Citation:
          Nachtsheim DA, Viquerat S,
                                            over the whole study period (−1.79% per year) with high probability (95.1%). The
     Ramírez-Martínez NC, Unger B,          assessment of these trends in abundance based on systematic monitoring should now
  Siebert U and Gilles A (2021) Small
                                            form the basis for adaptive management, especially in the SAC Sylt Outer Reef, where
Cetacean in a Human High-Use Area:
           Trends in Harbor Porpoise        the underlying causes and drivers for the large decline remain unknown and deserve
   Abundance in the North Sea Over          further investigation, also in a regional North Sea wide context.
                       Two Decades.
           Front. Mar. Sci. 7:606609.       Keywords: harbor porpoise, North Sea, monitoring, Bayesian trend analysis, marine mammal conservation,
    doi: 10.3389/fmars.2020.606609          biodiversity indicators, marine protected areas

Frontiers in Marine Science | www.frontiersin.org                                1                                         January 2021 | Volume 7 | Article 606609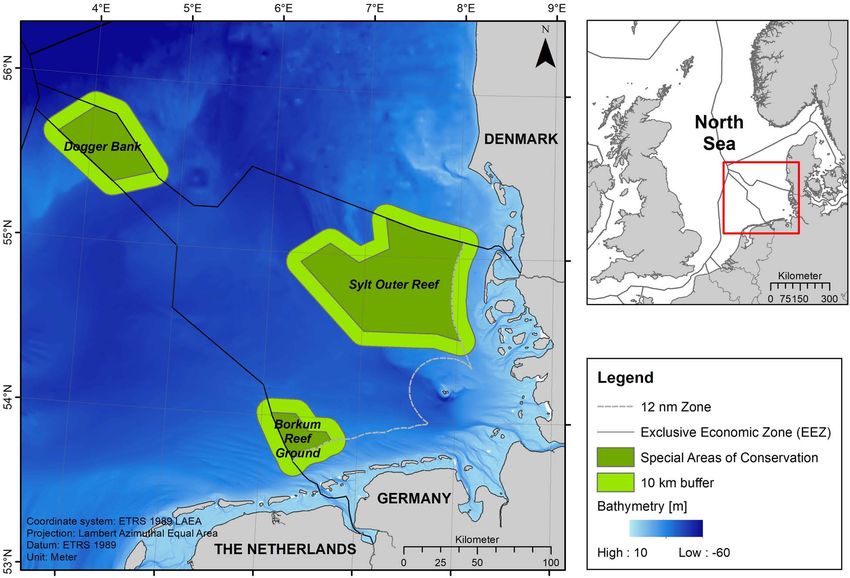
Nachtsheim et al.                                                                                                 Trends in Harbor Porpoise Abundance

INTRODUCTION                                                                 2013; Brandt et al., 2018). Similar impulsive noise is generated
                                                                             during seismic surveys with air guns or clearance of unexploded
The harbor porpoise (Phocoena phocoena) is the smallest and                  World War ordnance, which can likewise affect hearing and
by far most common cetacean species in the North Sea,                        distribution (Lucke et al., 2009; von Benda-Beckmann et al., 2015;
including German waters (Benke et al., 1998; Siebert et al., 2006a;          Aarts et al., 2016; Merchant et al., 2020; Sarnocińska et al., 2020).
Hammond et al., 2013). Being described as a continental shelf                As odontocetes, harbor porpoises rely on sound for orientation,
species, it is distributed throughout the shallow North Sea, from            predation and intraspecific communication (Clausen et al., 2010;
coastal waters up to the Dogger Bank in the central North Sea                Wisniewska et al., 2016; Sørensen et al., 2018), which is why
(Gilles et al., 2009, 2011, 2016). Occasionally, harbor porpoises            they are particularly vulnerable to underwater noise and any
also enter estuaries and move upstream rivers (Wenger and                    hearing impairment should be prevented. Beside impulsive noise
Koschinski, 2012). In the North Sea, they are usually encountered            events, the global underwater soundscape is largely dominated
solitary or in small groups (Benke et al., 1998; Gilles et al., 2009;        by shipping noise proven to have negative effects on harbor
Hammond et al., 2013). Females reach sexual maturity between 3               porpoise behavior (Hermannsen et al., 2014; Dyndo et al., 2015;
and 5 years (Sørensen and Kinze, 1994; Kesselring et al., 2017)              Akkaya Bas et al., 2017; Wisniewska et al., 2018b).
and potentially give birth to a single calf every year thereafter                Another important anthropogenic stressor affecting harbor
(Sørensen and Kinze, 1994; Read and Hohn, 1995). However,                    porpoises is fisheries. The fishing intensity in the North Sea is
the North-East Atlantic population which includes the North                  high, especially towards coastal waters (Pedersen et al., 2009a,b;
Sea, seems to have lower pregnancy rates (Pierce et al., 2008;               Vespe et al., 2016; Eigaard et al., 2017), although fishing effort has
Learmonth et al., 2014; Murphy et al., 2015).                                decreased in recent years (ICES, 2019b; STECF, 2020). The use
    Harbor porpoises feed on energy-rich fish (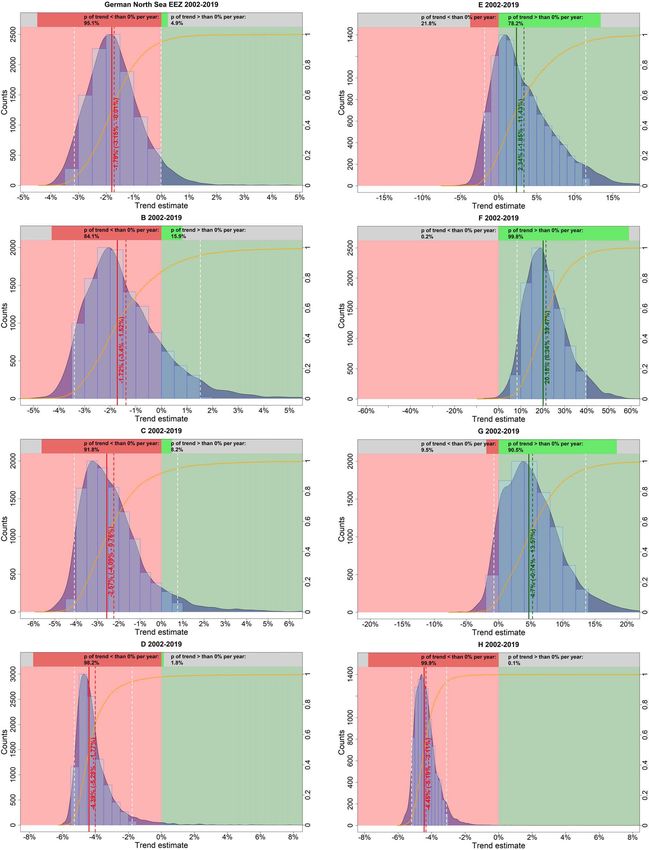
Nachtsheim et al.                                                                                                 Trends in Harbor Porpoise Abundance

similar, a notable southward shift in the distribution was detected         2014). These allow researchers not only to quantify the magnitude
with now highest porpoise densities in the south-western North              of the trend, but also its uncertainty; i.e., all sources of uncertainty
Sea (Hammond et al., 2013, 2017). However, trend estimation is              and intrinsic bias in the data will be propagated to a final
difficult when comparing only a few point estimates of abundance            estimate. In this study, we applied a Bayesian framework to a
over a large area with their large uncertainty (Authier et al.,             series of replicated visual surveys in the German North Sea to
2020). While there are ways to derive trends between short and              report trends in harbor porpoise abundance, based on 18 years
noisy time series from sporadic large scale survey estimates (see           of data from the regular national monitoring program for
for example, Hammond et al., 2017), these rarely consider all               harbor porpoises.
sources of uncertainty and variability within the underlying data
and more sophisticated approaches are needed (see for example,
Authier et al., 2020). Statistical power to detect change in marine         MATERIALS AND METHODS
mammal population is crucial for policy making, but achieving
statistical power is challenging and has long been debated in               Study Area
conservation practice (Taylor and Gerrodette, 1993; Wade, 2000;             The study area encompassed the EEZ and the 12 nautical mile
Taylor et al., 2007).                                                       zone of the German North Sea, a shallow shelf sea region of the
    In this context, national monitoring programs are essential to          North East Atlantic (Figure 1). The coast is characterized by the
gather dedicated survey data more frequently in higher temporal             shallow and tidally influenced Wadden Sea, with estuaries from
and spatial resolution and, ultimately, to infer on fine-scale trends       the rivers Ems, Weser, Elbe and Eider (Becker et al., 1992). The
at a national level to inform conservation and management                   deep, wedge-shaped post glacial valley of the river Elbe (>30 m
needs. For instance, an increase in harbor porpoise densities               water depth) extends from the Elbe estuary to the northwest and
with accompanied increased densities of porpoise calves in the              dominates the bathymetry of the study area. In the central part
southern German Bight between 2002 and 2013 was derived from                of the German North Sea, water depths lie between 40 and 60 m
subsets of the dataset used in the present study (Peschko et al.,           (Becker et al., 1992).
2016). Moreover, fine-scale surveys are also helpful to improve                 While the North Sea is supplied with salty marine water in
our understanding of seasonal distribution patterns. It has been            the north by the North Atlantic, salinity decreases toward the
shown that harbor porpoises are most abundant in spring and                 south due to river water input (Turrell et al., 1992; Prandle
summer in the German North Sea (Gilles et al., 2009, 2011).                 et al., 1997; Ducrotoy et al., 2000). There is an anti-clockwise
These findings of the early survey years led to adaptations of the          current in the North Sea. Water masses enter the North Sea in
present long-term monitoring scheme to focus efforts particularly           the North between Scotland and Norway, travel along the east
on seasons with high density [as suggested e.g. by, Harvey (2008);          coast of Great Britain and mix with the waters of the English
Lindenmayer and Likens (2009), and Hammond (2010)].                         Channel in the south before continuing along the coastline
    Our aim of the present study was to determine trends in                 of Belgium, the Netherlands, Germany, and Denmark. After
absolute abundance of harbor porpoises based on aerial surveys              entering the Skagerrak, water masses leave the North Sea along
conducted in the German Exclusive Economic Zone (EEZ) in the                the Norwegian coast back into the North East Atlantic (Turrell
North Sea. In addition, we were interested in the dynamics in               et al., 1992; Ducrotoy et al., 2000). Strong west winds can reverse
the Special Areas of Conservation (SACs, as designated under                the direction of the current flow (Stanev et al., 2019).
the EU Natura2000 framework) “Borkum Reef Ground,” “Sylt                        The three SACs Borkum Reef Ground (EU Code: DE 2104-
Outer Reef,” and “Dogger Bank.” These sites were nominated                  301), Sylt Outer Reef (DE 1209-301) and Dogger Bank (DE
in 2004 and officially approved by the European Commission                  1003-301) are located within the German EEZ (Figure 1). The
in 2008. Only recently, in May 2020, Germany implemented                    SAC Borkum Reef Ground is the smallest of the three areas
management plans for these SACs that define conservation and                covering 625 km2 and is situated north of the East Frisian
restoration measures required to achieve the protection purposes.           Wadden Sea islands Borkum and Juist, bordering Dutch waters
Amongst further Annex II qualifying species and habitats, these             (water depths: 18–33 m). It is characterized by a single submerged
three sites were designated for harbor porpoises and specific               sandbank, including patches of reef, hosting a very diverse
conservation objectives of these sites demand a maintenance or              benthic community (Federal Agency for Nature Conservation,
restoration of a favorable conservation status of habitats and              2008a). The Sylt Outer Reef is the largest SAC in the German
species. A trend analysis can be useful to detect changes in                EEZ and is located to the west of the North Frisian Wadden Sea
abundance and hence to inform management on the effectiveness               island of Sylt with a size of 5,314 km2 (water depths: 8–48 m).
of conservation efforts. As the assessment of the abundance of a            It consists of alternating sandbanks and reefs characterized by
wildlife population usually comes with an associated uncertainty,           a rich benthic diversity and also provides an important habitat
ideally, the anticipated analysis should propagate this uncertainty         for many important fish species as well as endangered seabirds
into the final trend estimate. Bayesian tools are particularly useful       (Federal Agency for Nature Conservation, 2008b; Neumann et al.,
in that sense as they are a valid option for complex hierarchical           2013, 2017). The SAC Sylt Outer Reef is considered as a core
problems such as trend estimation that require error propagation            area for the population and as a main reproduction site for
(Buckland et al., 2004; Newman et al., 2006; Humbert et al.,                harbor porpoises in German waters with high numbers of calves
2009). Such tools are now also more easily applicable in user-              (Sonntag et al., 1999; Siebert et al., 2006a; Gilles et al., 2009). The
friendly software packages (Hadfield, 2010; Johnson and Fritz,              SAC Dogger Bank covers the part of the Dogger Bank (a large

Frontiers in Marine Science | www.frontiersin.org                       3                                      January 2021 | Volume 7 | Article 606609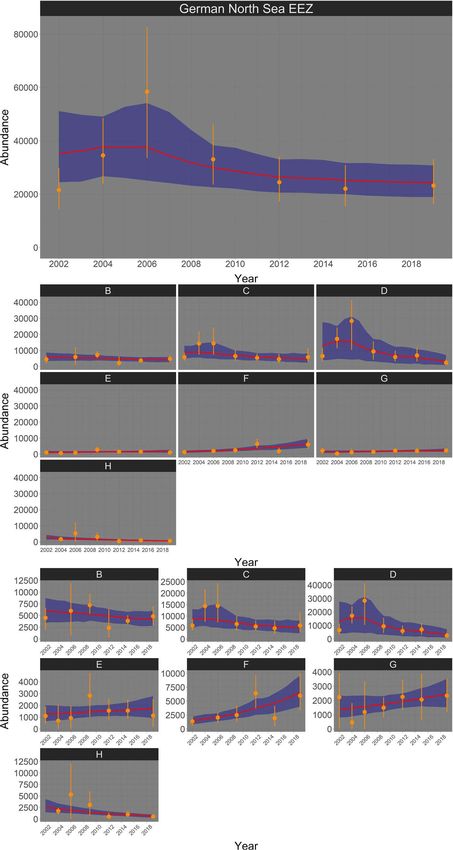
Nachtsheim et al. Trends in Harbor Porpoise Abundance
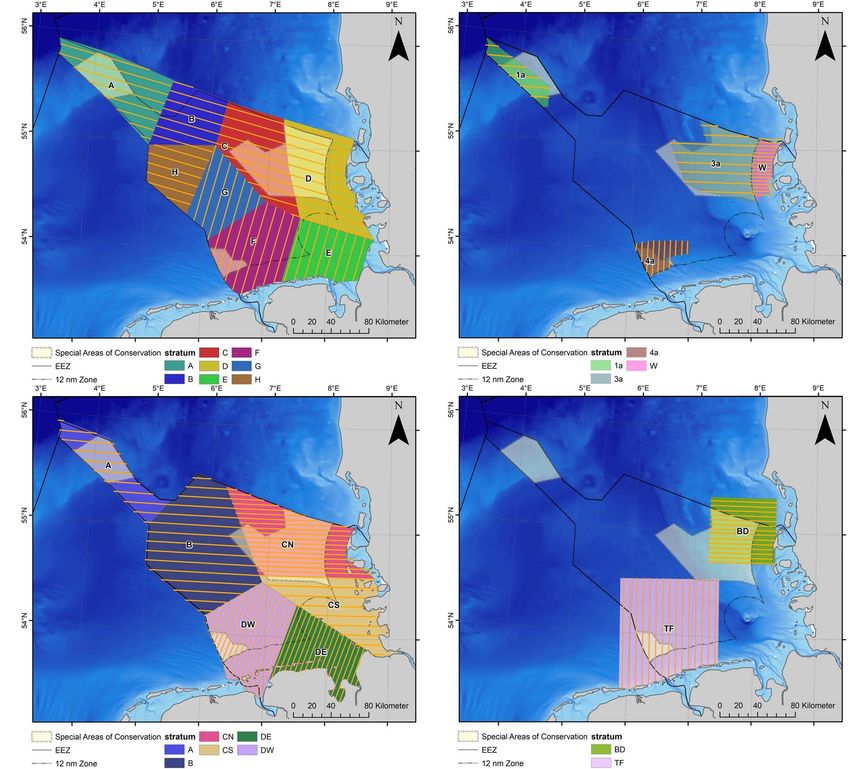
FIGURE 1 | Overview map (top right) of the study area in the German North Sea marked by a red box. Dark green areas in the map on the left illustrate the three
SACs located in the German North Sea EEZ: Dogger Bank, Sylt Outer Reef and Borkum Reef Ground. Light green areas around the SACs indicate the 10 km buffer
zone used during the analysis stage.
sandbank in the central North Sea) extending into the German each stratum, transects were designed to provide a systematic
EEZ; the SAC covers an area of 1,699 km2 (water depths: 29– survey with even coverage of the survey region, following the
40 m). The sediment mainly consists of fine sands and hosts a principles described in Buckland et al. (2001) (Figure 2). If
unique epi- and infauna community (Federal Agency for Nature possible, strata boundaries and transect placement within strata
Conservation, 2010; Neumann et al., 2013, 2017). The local were kept constant throughout the years. The study areas TF and
hydrographic conditions also support a relatively high primary BD were primarily designed to study the large scale effects of
productivity and provide an ideal spawning ground for marine the construction of the OWFs “alpha ventus” and “Butendiek,”
fishes attracting seabirds and marine mammals (Federal Agency respectively, on harbor porpoise distribution (Dähne et al., 2013;
for Nature Conservation, 2010). Viquerat et al., 2015) (Figure 2D).
Data on spatial extents of the SACs were retrieved from Field methods were identical during all surveys and detailed
the EEA1 . descriptions of aerial survey data collection protocols are given
elsewhere (Scheidat et al., 2008; Gilles et al., 2009; Hammond
Survey Methodology and Data et al., 2013). Briefly, all surveys were conducted using the
Processing same platform, a twin engine, high-wing aircraft (Partenavia P-
Dedicated aerial line-transect distance sampling surveys 68) equipped with two bubble windows. A constant altitude
(Buckland et al., 2001) were conducted in the German North (600 ft) and speed over ground (90–100 km) were maintained
Sea between 2002 and 2019 under the German monitoring while on the transect. Two observers, one at either side of
program for harbor porpoises and smaller scale research projects the plane, monitored the area directly underneath the airplane
(Figure 2). The study area was stratified into different survey and relayed all sightings with corresponding information via
blocks (i.e., strata) that could be covered on a single day. For Intercom to a third person, the data recorder, operating a
customized survey software running on a laptop connected to
1
https://www.eea.europa.eu/data-and-maps/data/natura-10/natura-2000- an external GPS device (Garmin GPSMAP 78S or GPS 72H).
spatial-data Surveys were only conducted when weather conditions were
Frontiers in Marine Science | www.frontiersin.org 4 January 2021 | Volume 7 | Article 606609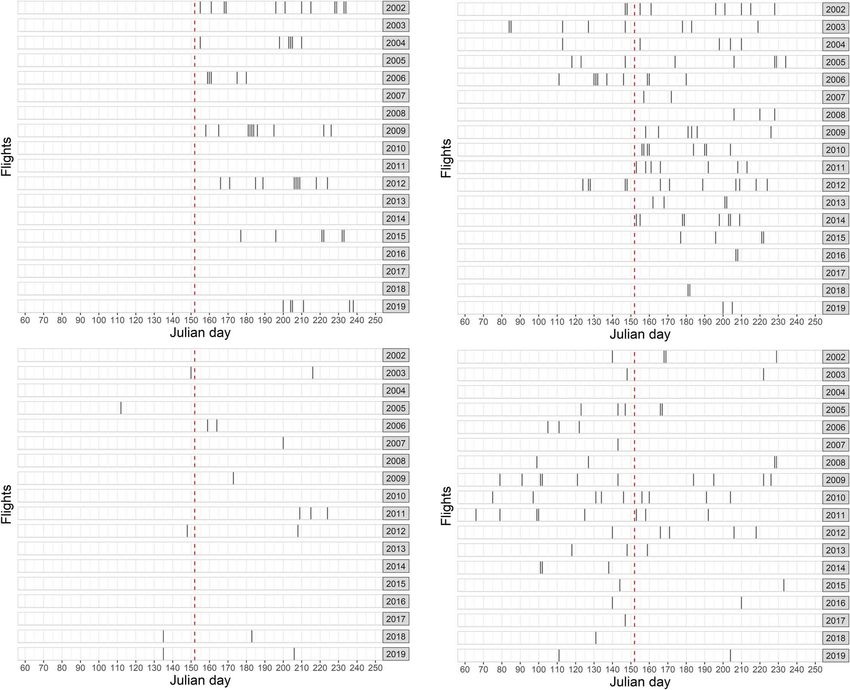
Nachtsheim et al.                                                                                                           Trends in Harbor Porpoise Abundance

  FIGURE 2 | Survey and transect design of the German visual monitoring of harbor porpoises and related research projects: (A) TopMarine, since 2017; (B) MINOS
  and TopSpace, 2002–2016 (Gilles et al., 2009); (C) EMSON (1a, 3a, and 4a) and whale protection area (W), 2002–2003; (D) alpha ventus OWF test field 2008–2012
  (TF; Dähne et al., 2013) and Butendiek 2014 (BD; Viquerat et al., 2015).

expected to be good (no low clouds, visibilities >5 km, Beaufort                   T-NASS (Trans-North Atlantic Sightings Survey) aerial surveys
sea states 0–3); if conditions deteriorated during the flight, the                 (Gilles et al., 2020).
survey was paused or canceled. All environmental conditions [sea                      The probability of detecting an animal on the transect line
state, glare (area obstructed by glare and glare strength), water                  (commonly known as g(0)), is often assumed to be 1 for
turbidity, cloud cover] and corresponding changes were noted.                      marine mammals to provide minimum (uncorrected) estimates.
Additionally, each observer reported on subjective sighting                        However, due to diving and the often restricted visibility into
conditions (good, moderate, or poor), which reflect the likelihood                 the water column, we expect a substantial fraction of animals to
of sighting a harbor porpoise given the above described                            be missed on the transect by the observers. This “false absence”
environmental conditions on either side. Although this describes                   is one of the main component of the availability bias, which
a subjective measure it is important to note that there was a                      modifies g(0) to below 1 (Laake et al., 1997). Another bias is
consistent way of allocating these conditions based on prevailing                  introduced when the animal is indeed missed by the observer
environmental conditions. All observers were long-trained and                      although it was actually visible, also called perception bias (Marsh
highly experienced harbor porpoise observers, many of them also                    and Sinclair, 1989). In order to estimate the fraction missed, in
participating in the SCANS (Hammond et al., 2013, 2017) and                        our surveys, the Hiby racetrack (or circle-back) data collection

Frontiers in Marine Science | www.frontiersin.org                              5                                         January 2021 | Volume 7 | Article 606609
Nachtsheim et al.                                                                                                  Trends in Harbor Porpoise Abundance

method (Hiby, 1999) was followed, where the survey aircraft                    the full data set), these very short transects are very unlikely to
circles back to resurvey a defined segment of transect (see details            provide reliable data due to the limited window of observation.
on field protocol on Scheidat et al., 2008). This presents a                   Excluding these short transects led to an average transect length
modification of the tandem formation method, as implemented,                   of 71.0 ± 50.4 km. Given the high effort in most strata
e.g., in SCANS 1994 (Hammond et al., 2002), where two survey                   (average effort per stratum is 790 ± 750 km) these short
aircraft would closely follow each other on the transect to                    transects would not contribute to the overall estimate but rather
determine leading/trailing pairs and consequently duplicates of                inflate the uncertainty due to high randomness and false zero
porpoise sightings (Hiby and Lovell, 1998). The major advantage                counts. Secondly, survey-specific coverage of strata was assessed,
of this method is that it takes into account both availability and             and only strata with sufficient realized area coverage and a
perception bias with the same data collected (Hiby and Lovell,                 representative spatial coverage were included. Conversely, strata
1998; Hiby, 1999). Per definition of the analytical approach, the              were excluded if realized area coverage was deemed not be
Hiby racetrack method produces estimates of total effective strip              representative (e.g., missing a major part of the stratum due to
width ESW (i.e., on both sides of the aircraft) that incorporates              closed air space or bad local weather conditions). Maps showing
g(0). Here, ESWs were estimated separately for good and                        the coverage of the respective survey areas (German EEZ and the
moderate conditions (poor conditions default to an ESW of 0).                  three SACs) are available in the Supplementary Material.
This provided a correction for missed animals on the transect line                We then estimated abundances and their associated error
within varying sighting conditions that could also differ between              structures for each stratum in a given season and year. As
observer sides (Scheidat et al., 2008; Hammond et al., 2013, 2017).            described above, the total ESW, i.e., on both sides of the transect,
The same (racetrack) data collection method and software, the                  was estimated for good and moderate sighting conditions (µ̂g
same aircraft and a pool of the same experienced observers have                and µ̂m , respectively) based on the racetrack method taking a
been used in SCANS-II, SCANS-III and in harbor porpoise aerial                 detection probability of less than 1 on the transect into account.
surveys in the Netherlands (Scheidat et al., 2012; Hiby and Gilles,            Abundance N̂ in stratum v was estimated as:
2016). The estimate resulted in a total corrected ESW of 166 m
(CV = 0.13) for good and of 83 m (CV = 0.13) for moderate                                                       ngv

                                                                                                     Av               nmv
porpoise sighting conditions, incorporating g(0) values of 0.42                              N
                                                                                             cv =       ×           +             × s̄v              (1)
                                                                                                     Lv         µ̂g   µ̂m
and 0.21, respectively.
    In the following, only surveys performed during spring                     where Av is the stratum area in km2 , Lv is the effective transect
(1 March–31 May) and summer (1 June–31 August) were                            length in km in stratum v (i.e., effort under good or moderate
considered, due to very low and fragmented survey coverage in                  conditions), ngv and nmv are the number of harbor porpoise
other seasons (Gilles et al., 2009, 2011, 2016). Data were filtered            group sightings made in good and moderate conditions in
to include only good and moderate survey conditions.                           stratum v, respectively, and s̄v is the mean observed group size
                                                                               in stratum v in both good and moderate conditions combined.
Stratum-Based Abundance Estimation                                             Absolute densities (individuals/km2 ) were estimated by dividing
The data base for the trend analysis includes all survey data of               the abundance estimates by the area of the associated stratum.
the aircraft-based national monitoring campaigns from 2002 to                     Coefficients of variation (CVs) and 95% confidence intervals
2019 in the areas of the German North Sea. Data were aggregated                (CI) were estimated by non-parametric bootstrapping
seasonally at stratum level to determine a total abundance and                 (999 replicates). More specific details on the abundance
associated variance measures per study area per season (here,                  estimation method are provided in Scheidat et al. (2008)
for spring and summer). For ease of calculation, all data were                 and Hammond et al. (2013).
spatially aggregated (or “post-stratified”) based on the current
stratum design (see Figure 2A). For the abundance estimation
within the SACs, we post-stratified the data to the extent of                  Bayesian Trend Analysis of Harbor
the three SACs but added a 10 km buffer around each area                       Porpoise Abundance
(Figure 1) to enhance the data base for a more reliable estimation             The data base from the previous step contains the abundance
of density. According to distance sampling methodology, strata-                estimates and 95% CI per season, stratum and year for data
based density estimates assume a uniform distribution of density               from the national monitoring program from 2002 to 2019 within
within the strata and can thus be applied to smaller subsets of                the areas of the German North Sea. In contrast to fitting a
the strata to estimate abundances (Buckland et al., 2001). Thus,               linear model to the design-based point estimates (i.e., in this
abundance was subsequently estimated based on the extent of the                case abundance estimates in one stratum in one season), we
original SAC area without the 10 km buffer zone.                               incorporated the structure of the uncertainty, i.e., the variability
   Prior to abundance estimation, the coverage of the post-                    of the individual estimates and the associated errors over the
stratified areas was assessed on two levels: transects and strata.             course of the years. We take these assumptions:
First, all transects with effective transect lengths (i.e., effort in km
under good or moderate conditions) shorter than 10 km were                        1. The abundance and distribution of animals at any given
excluded [average length of all excluded transects: 2.9 ± 3.2 km                     point in time within any area is the sum of effects caused
(mean ± SD)]. Given the high survey speed (ca. 180 km/h) and                         by observable drivers (either immediate such as seasonality
encounter rates for harbor porpoises (ca. 0.1 porpoises/km in                        or proxies such as spatial boundaries) and by an unknown

Frontiers in Marine Science | www.frontiersin.org                          6                                     January 2021 | Volume 7 | Article 606609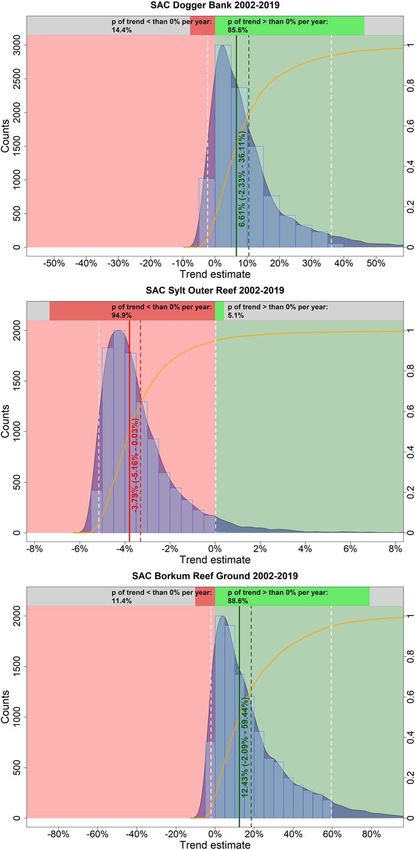
Nachtsheim et al.                                                                                                                       Trends in Harbor Porpoise Abundance

       number of interacting and unobservable (hidden) drivers                                      level framework for Bayesian trend and abundance estimation
       (e.g., prey occurrence).                                                                     from sites with uneven sample schemes over time, while
    2. Our survey setup and effort is sufficient to detect a shift in                               accounting for variability due to survey replication (Johnson
       abundance and distribution across large temporal scales (in                                  and Fritz, 2014). For this analysis, we extracted the posterior
       our case between years, and between spring and summer)                                       distribution of true abundances from agTrend but used our own
       and is robust towards day to day fluctuations (within                                        metric to assess trends between points in time.
       the same stratum). Furthermore, the survey frequency is                                         agTrend offers additional model hierarchy for availability
       sufficient to cover the observed within season, between                                      bias and covariates on site level and all levels of observation.
       season and between years variation of distribution and                                       Since we used the racetrack method to estimate g(0) and
       abundance. Thus, we assume that we have sufficient power                                     have been following standardized protocols throughout the data
       to determine a trend based on the available data and that                                    acquisition, we assumed availability and survey related covariates
       the coverage is representative in both space and time.                                       to be 1. Site specific variables were considered irrelevant over the
                                                                                                    last 20 years and were assumed to be 1 as well.
   In order to assess a shift between years in our data, we
                                                                                                       In order to identify the relative change in abundance between
assume a known stratum-based abundance and associated error
                                                                                                    two points in time, we decided to use the coefficient of a linear
structure (here, the standard error based on 95% CI) based
                                                                                                    model that links the distribution of true abundances at year a
on our survey efforts since 2002 as our a priori estimates for
                                                                                                    with the distribution of true abundances at year b (assuming but
each stratum, season and year. The posteriori abundances are
                                                                                                    neglecting an intercept). We then consider the model coefficient
subsequently determined using a hierarchical Markov chain
                                                                                                    (including variance) ma,b as trend for that given time period:
Monte Carlo model (MCMC).
   We ran separate models for each data set (full data set of
complete surveys of German EEZ, subsets for three individual                                                               Nb = b + ma,b · Na                            (5)
SACs) for each season (spring, summer) across all available data
between 2002 and 2019.                                                                              with Na the distribution of true abundances at year a and Nb the
                                                                                                  distribution of true abundances at year b. ma,b is the coefficient

                  nij | Nij , µij , σij = L µij , σij2

                                                             (2)                                    for the linear model and is considered the relative trend between
                                                                                                    year a and year b. The empirical cumulative distribution function
   Equation 2 describes the log-normal model used for the                                           (ecdf) of the resulting distribution of relative trend estimates was
abundance process for nij at site i = 1, . . ., I and time                                         used to quantify the probability that a trend between two given
j = 1, . . ., J. L µ, σ2 represents a log-normal distribution with                                  years was negative (p less than 0) or positive (p greater than 0),
location parameter µij (expected observed abundance) and scale                                      indicating a decline in true abundance or incline, respectively.
parameter σij2 (in our case: standard error of observed abundance                                       For the SAC Borkum Reef Ground the first three surveys
estimate). The model for the latent and missing true abundances                                     (2002, 2003, and 2005) in summer were removed from the
Nij is given by Eq. 3.                                                                              analyses since the stratum-based abundance estimates were
                                                                                                    either zero or very close to zero due a lack of sightings (see
                                                                                                    Supplementary Table 3). This led to computational issues in the

                     Nij | βi , ωij = L dij0 βi + ωij , ξi2

                                                               (3)
                                                                                                    estimation of trends, as abundances in “agTrend” are modeled
with dij0 a vector of site and time specific covariates related to Nij ,                            using a log-normal distribution (Johnson and Fritz, 2014). The
                                                                                                    logarithm of zero is not defined. To overcome the problem,
βi the site level covariates  associated with abundance Ni , ξi2 the
                                                                                                    we have arbitrarily added the value 1 to the estimate and error
variance of log Nij and ωij the parameters of a random walk

                                                                                                    structure, which solves the computational issue but is not advised
process. Our true abundance estimates for site i at time j were
                                                                                                    (O’Hara and Kotze, 2010). The resulting model also revealed that
drawn from the posterior distribution of Nij using Eq. 4.
                                                                                                    the posterior distributions were clearly centered on the original
                                                                                                    abundance point estimates, as the low estimate with a narrow
                      J n
                    I Y                                                                             variance indicates a very precise prior value as a starting point.
                    Y                                 s(i,j)                 o
   [N, ϕ | n] ∝                nij | Nij , µij , σi            Nij |βi , ωij

                                                                                    [ϕ]   (4)       When removing the first three survey years, the model was
                    i=1 j=1                                                                         deemed more realistic and anticipates very low abundances in the
                                                                                                    first years in this area and season.
where N is a vector of all Nij . ϕ is the vector of all parameters, [ϕ]
is the prior distribution of these. s(i, j) is an indicator function
that equals 1 if site I was surveyed at time j. We then considered
the median of the posteriori distribution as the true abundance                                     RESULTS
for site i and time j. We additionally chose 95% Bayesian credible
intervals to illustrate the uncertainty and range of the posteriori                                 Survey Effort and Harbor Porpoise
distribution values.                                                                                Sightings
    The hierarchical modeling framework was provided by                                             A total effort of 122,344 km was realized under good or moderate
“agTrend” (Johnson and Fritz, 2014) in R 3.4.4 (R Core Team,                                        conditions during 247 individual aerial survey flights between
2018). The “agTrend” package was designed to provide a high                                         2002 and 2019 in spring and summer (Figure 3). A combined

Frontiers in Marine Science | www.frontiersin.org                                               7                                    January 2021 | Volume 7 | Article 606609
Nachtsheim et al. Trends in Harbor Porpoise Abundance
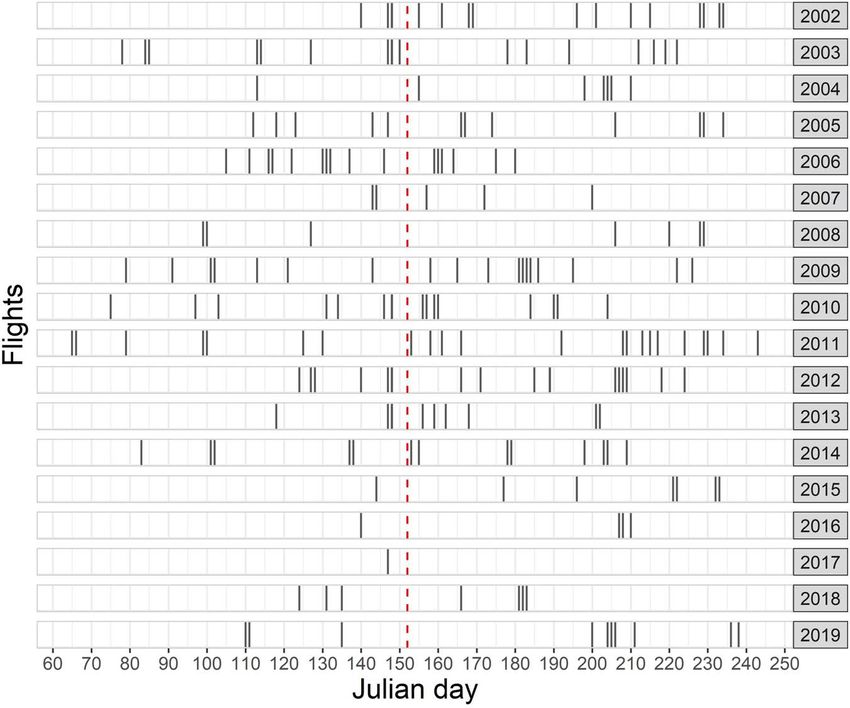
FIGURE 3 | Total number of aerial survey flights conducted in the frame of the national visual monitoring and related research projects between 2002 and 2019 in
the German North Sea. Timing of each flight is shown with respect to the Julian day. The red dashed line shows the transition from spring to summer.
total of 12,942 harbor porpoise groups (15,910 individuals) were German North Sea EEZ: Trends of Harbor
observed, resulting in an overall mean observed group size of 1.2. Porpoise Abundance
The German North Sea EEZ (excluding the Dogger Bank
A visual inspection of the model-estimated harbor porpoise
stratum A) was surveyed completely in summer in 7 of
abundance in the German North Sea EEZ suggests decreasing
18 years (Figure 4A). The total effective survey effort (i.e.,
numbers between 2002 and 2019 (Figure 5A). After an initial
under good or moderate conditions) summed up to 27,633 km.
slight increase until 2006, the abundance declined sharply before
A total of 2,614 harbor porpoise groups were recorded
leveling off toward the end of the study period. The probability
(Supplementary Table 1).
that the trend was indeed negative (i.e., less than 0% per year)
In spring, the SAC Dogger Bank was surveyed in 5 of
is 95.1% (Figure 6). The median relative change in abundance
18 years with a total effective effort (i.e., under good or
per year was −1.79% with a narrow credibility interval (95%
moderate conditions) of 1,263 km, while in summer months
credibility interval: −3.15 – −0.01%).
1,975 km were covered in 8 years (Figure 4B). In spring,
Trends in harbor porpoise abundance were also calculated for
a total of 195 harbor porpoise groups was recorded, while
each site (i.e., stratum) within the whole region, contributing to
in summer 233 porpoise group sightings were recorded
the aggregated trend. Abundances differed between strata and
(Supplementary Tables 2, 3).
also the trend varied between the sites with some areas showing
The SAC Sylt Outer Reef was covered in 5 of 18 years
increases and others declines (Figures 5B,C). Generally, strata in
in spring, whereas it was surveyed in 17 years in
the north (e.g., B, C, and D) were apparently exhibiting negative
summer (Figure 4C). The effective effort summed up to
trends, whereas southern areas (e.g., E and F) showed positive
5,213 km in spring and 25,747 km in summer. During
trends (Figure 6).
spring surveys, a total of 1,322 harbor porpoise groups
were sighted. In summer, 3,992 groups were observed
(Supplementary Tables 2, 3). SACs: Trends of Harbor Porpoise
In spring, the SAC Borkum Reef Ground was surveyed Abundance in Spring
in 17 of 18 years with a total effective effort of 5,748 km, In spring, harbor porpoise abundance in the SAC Dogger Bank
while during summer 3,563 km were covered in 12 years seemed to be stable between 2002 and 2019 (Figure 7A). The
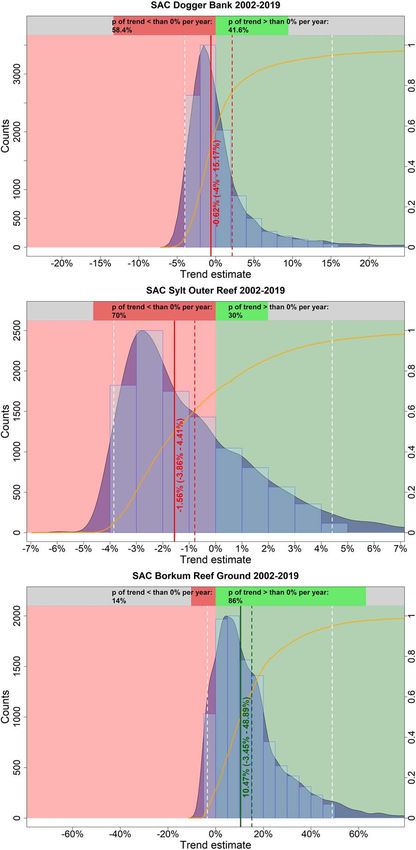
(Figure 4D). In spring, a total of 868 harbor porpoise groups were probability that the trend was negative (i.e., less than 0% per
observed, while in summer 553 group sightings were recorded year) is 58.4% (Figure 8A). The median change in abundance
(Supplementary Tables 2, 3). per year was −0.62%, but there was also a large credibility
Frontiers in Marine Science | www.frontiersin.org 8 January 2021 | Volume 7 | Article 606609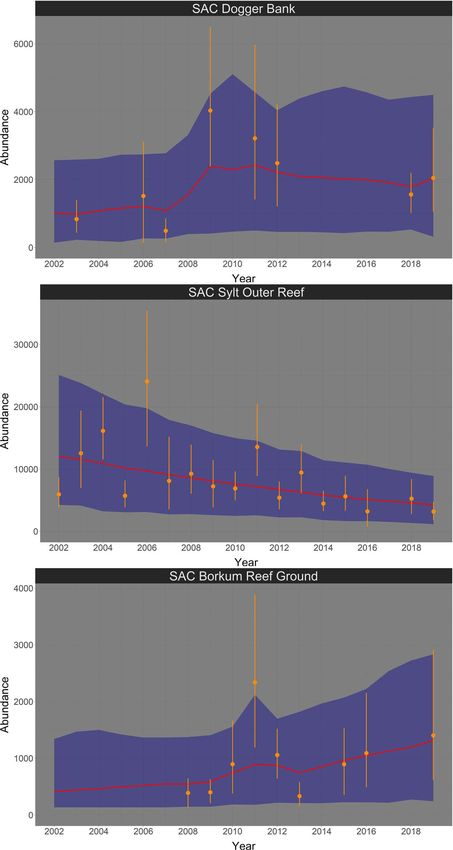
Nachtsheim et al.                                                                                                            Trends in Harbor Porpoise Abundance

  FIGURE 4 | Aerial survey flights in the different study areas: (A) German North Sea EEZ, (B) SAC Dogger Bank, (C) SAC Sylt Outer Reef, (D) SAC Borkum Reef
  Ground. Timing of each flight is shown with respect to the Julian day. The red dashed line shows the transition from spring to summer.

interval (95% credibility interval: −4.00% – +15.17%). The trend                    increased by 10.47% per year (95% credibility interval: −3.45% –
analysis suggests a decline of harbor porpoises in the SAC                          +48.89%).
Sylt Outer Reef in the first years until reaching a certain level
(Figure 7B). However, this apparently stable trend in the years
2006 until 2019 is mainly caused due to a lack of surveys (only                     SACs: Trends of Harbor Porpoise
one estimate in 2012), resulting in large credibility intervals.                    Abundance in Summer
The probability that the trend was indeed negative between                          In summer, harbor porpoise abundance seemed to increase
2002 and 2019 is 70.0% (Figure 8B). The median change in                            in the SAC Dogger Bank from 2002 until 2019 (Figure 9A).
harbor porpoise abundance per year was −1.56%, with a large                         The probability for a positive trend was 85.6% (Figure 10A).
uncertainty (95% credibility interval: −3.86% – +4.41%). Harbor                     The median increase in abundance was 6.61% per year (95%
porpoise abundance in the SAC Borkum Reef Ground exhibited                          credibility interval: −2.33% – +36.11%). The Bayesian model
high fluctuations over the study period (Figure 7C). The Bayesian                   suggests an almost linear decline of harbor porpoise abundance
trend analysis indicates an increase until 2005, relatively constant                in the SAC Sylt Outer Reef over the study period from 2002
abundance until 2007 before dropping and increasing again until                     until 2019 (Figure 9B). The trend was highly likely to be
2012. After 2012, the posteriori abundances declined steadily and                   negative with a probability of 94.9% (Figure 10B). The change
remained rather low until 2019. Nevertheless, when assessing the                    in abundance between 2002 and 2019 was −3.79% per year
trend from 2002 until 2019, the trend was likely to be positive                     (95% credibility interval: −5.16% – +0.03%). In contrast, harbor
with 86.0% probability (Figure 8C). Harbor porpoise abundances                      porpoise abundances seemed to increase in the SAC Borkum Reef

Frontiers in Marine Science | www.frontiersin.org                               9                                         January 2021 | Volume 7 | Article 606609
Nachtsheim et al.                                                                                                                Trends in Harbor Porpoise Abundance

  FIGURE 5 | Bayesian abundance trend analysis for harbor porpoises in the German North Sea EEZ (aggregated trend) (A) and for each stratum separately (B,C)
  based on post-stratified aerial survey data in summer, between 2002 and 2019. Only years are included when the complete study area was covered (excluding
  Dogger Bank stratum A). Orange dots illustrate stratum-based abundance estimates and orange lines represent the associated 95% CI. The red line shows the
  median of the posteriori distribution of the calculated “true” abundances from the Bayesian model, the blue shaded area displays the corresponding 95% credibility
  intervals. Please note that all sub-figures in (B) share a common y-axis, while the y-axis is free in (C).

Frontiers in Marine Science | www.frontiersin.org                                 10                                          January 2021 | Volume 7 | Article 606609
Nachtsheim et al.                                                                                                                    Trends in Harbor Porpoise Abundance

  FIGURE 6 | Estimated trends in harbor porpoise abundance in the German North Sea EEZ (but excluding Dogger Bank) and in each strata (B–H) separately in
  summer, between 2002 and 2019. The light blue histogram and the blue shaded density curve show the distribution of the trend estimates (relative change in
  abundance) between 2002 and 2019 (x-axis); the median is indicated by the solid red vertical line. The mean is shown by the vertical red dashed line, while the white
  dashed lines represent the upper and lower 95% credibility intervals of the trend estimate. The red colored area corresponds to an area with a negative trend,
  whereas the green colored area represents a positive trend. The orange solid line illustrates the empirical cumulative distribution function of the trend estimates,
  giving the probability of a trend estimate at a specified value (e.g., 0%). The upper bar chart hence indicates how likely it is that the trend is either negative (i.e.,
  p < 0%; red) or positive (i.e., p > 0%; green).

Frontiers in Marine Science | www.frontiersin.org                                    11                                           January 2021 | Volume 7 | Article 606609
Nachtsheim et al.                                                                                                               Trends in Harbor Porpoise Abundance

  FIGURE 7 | Bayesian abundance trend analysis for harbour porpoises in the three SACs Dogger Bank (A), Sylt Outer Reef (B), and Borkum Reef Ground (C), based
  on post-stratified aerial survey data in spring, between 2002 and 2019. Orange dots illustrate stratum-based abundance estimates and orange lines the associated
  95% CI. The red line shows the median of the posteriori distribution of the calculated ‘true’ abundances from the Bayesian model, the blue shaded area displays the
  corresponding 95% credibility intervals. Please note in all figures the y-axis is free.

Frontiers in Marine Science | www.frontiersin.org                                 12                                          January 2021 | Volume 7 | Article 606609
Nachtsheim et al.                                                                                                         Trends in Harbor Porpoise Abundance

Ground over the study period (Figure 9C). The probability that
the trend in SAC Borkum Reef Ground was positive is 88.6%
(Figure 10C). The posteriori abundance increased strongly with
a median of 12.43% per year (95% credibility interval: −2.09% –
+59.44%).

DISCUSSION
In this study, unbiased abundance estimates of harbor porpoises
obtained from aerial surveys in the German North Sea over
18 years were used to estimate trends in abundance by
applying a Bayesian framework, considering error propagation.
Most of the areas were covered continuously over the study
period with a comparable survey frequency. We focused
the trend analyses on spring and summer, as survey effort
was highest in these seasons. Autumn and winter had a
lower coverage due to low densities of harbor porpoises
during these times (Gilles et al., 2009). Distance sampling
requires a certain minimum amount of sightings to provide
accurate abundance estimates, which is why monitoring
efforts and resources were concentrated on seasons with
sufficiently high densities and encounter rates. This hampers
a seasonal comparison in some respect but ensures a good
comparison between years.
   Data presented here were collected as part of an ongoing
national long-term monitoring of harbor porpoise status in
German waters. Long-term monitoring is necessary to better
understand population dynamics, to determine changes in
population size and, ultimately, to advise conservation efforts and
management (Marsh and Trenham, 2008; Magurran et al., 2010).
Also, long time-series are needed to achieve sufficient statistical
power to detect trends, in particular if changes are relatively
subtle (Forney et al., 1991; White, 2019), whereas short time series
can be underpowered and, thus, misleading. At least 10 years of
monitoring is usually required to achieve a high level of statistical
power to infer with confidence on population trends (White,
2019). Our evaluation presented here can be regarded reliable
in the sense of (i) being based on adequate data collected over
a sufficiently long-time frame and (ii) resulting from an analysis
designed to deal with spatio-temporal heterogeneity and other                 FIGURE 8 | Estimated trends in harbour porpoise abundance in the three
sources of uncertainty (Johnson and Fritz, 2014). Furthermore,                SACs Dogger Bank (A), Sylt Outer Reef (B), and Borkum Reef Ground (C) in
we have developed a methodological approach whose graphical                   spring, between 2002 and 2019. The light blue histogram and the blue
output is clearly transferable to stakeholders and policy as the              shaded density curve show the distribution of the trend estimates (relative
                                                                              change in abundance) between 2002 and 2019 (x-axis); the median is
interpretation of the probability of change can be quickly grasped
                                                                              indicated by the solid red vertical line. The mean is shown by the vertical red
using the color codes.                                                        dashed line, while the white dashed lines represent the upper and lower 95%
                                                                              credibility intervals of the trend estimate. The red coloured area corresponds
SACs in the German North Sea                                                  to an area with a negative trend, whereas the green coloured area represents
                                                                              a positive trend. The orange solid line illustrates the empirical cumulative
Our analyses revealed obvious trends in specific areas and                    distribution function of the trend estimates, giving the probability of a trend
seasons. Harbor porpoise abundance overall increased in SAC                   estimate at a specified value (e.g. 0%). The upper bar chart hence indicates
Borkum Reef Ground in both spring and summer, however,                        how likely it is that the trend is either negative (i.e., p < 0%; red) or positive
there were fluctuations over the course of the whole study                    (i.e., p > 0%; green).
period. The overall increase in harbor porpoise abundances
in the south-western German Bight, where SAC Borkum
Reef Ground is located, was also described in Peschko et al.                 from neighboring countries in the southern North Sea.
(2016) for earlier years (2002–2013), including a subset of                  Harbor porpoise sighting rates have increased substantially
data used in this study. These results are in line with findings             in Dutch coastal waters, especially from the early 1990s

Frontiers in Marine Science | www.frontiersin.org                       13                                             January 2021 | Volume 7 | Article 606609
Nachtsheim et al. Trends in Harbor Porpoise Abundance FIGURE 9 | Bayesian abundance trend analysis for harbour porpoises in the three SACs Dogger Bank (A), Sylt Outer Reef (B), and Borkum Reef Ground (C), based on post-stratified aerial survey data in summer, between 2002 and 2019. Orange dots illustrate stratum-based abundance estimates and orange lines the associated 95% CI. The red line shows the median of the posteriori distribution of the calculated ‘true’ abundances from the Bayesian model, the blue shaded area displays the corresponding 95% credibility intervals. Please note in all figures the y-axis is free. Frontiers in Marine Science | www.frontiersin.org 14 January 2021 | Volume 7 | Article 606609
Nachtsheim et al.                                                                                                               Trends in Harbor Porpoise Abundance

                                                                                            2011, 2018; Peltier et al., 2013; Ijsseldijk et al., 2020). This
                                                                                            sharp increase in sighting rates and strandings has been
                                                                                            attributed to a southward shift of the North Sea harbor
                                                                                            porpoise population as detected between the large scale
                                                                                            surveys SCANS in 1994 and SCANS II in 2005 (Hammond
                                                                                            et al., 2002, 2013). It has been hypothesized that the shift
                                                                                            was caused by a change in distribution of principal prey
                                                                                            species (Hammond et al., 2013). National monitoring in
                                                                                            the southern North Sea showed indeed that the seasonal
                                                                                            pattern of occurrence has changed. For instance, in the
                                                                                            Netherlands harbor porpoises showed a higher abundance
                                                                                            in winter and spring and lower abundances in summer
                                                                                            (Camphuysen, 2011; Scheidat et al., 2012). Recently, this
                                                                                            pattern has changed (2012–2017): harbor porpoise abundance
                                                                                            increased markedly in summer and abundance and density
                                                                                            are now comparable to spring (Geelhoed and Scheidat,
                                                                                            2018). Additionally, mother-calf pairs are now regularly
                                                                                            sighted (Geelhoed et al., 2013; Geelhoed and Scheidat, 2018).
                                                                                            The increasing abundances reported in the Netherlands
                                                                                            corroborate the increasing trends in the southern German Bight,
                                                                                            including SAC Borkum Reef Ground, in spring and summer as
                                                                                            seen in this study.
                                                                                                Although being an overall positive trend, it is noteworthy that
                                                                                            harbor porpoise abundance decreased after 2012 following the
                                                                                            initial increase in SAC Borkum Reef Ground in spring. This is
                                                                                            not congruent with the patterns described above for neighboring
                                                                                            areas. Also, in summer the abundances in SAC Borkum Reef
                                                                                            Ground continue to increase. In general, the SAC Borkum Reef
                                                                                            Ground is the smallest of the three SACs examined here. As
                                                                                            harbor porpoises are highly mobile species and their distribution
                                                                                            can be variable, small protected areas may not adequately reflect
                                                                                            their spatial requirements and, conversely, may not be effective.
                                                                                            The variability of the abundance estimates and the associated
                                                                                            confidence intervals in this area could be an indication of a rather
                                                                                            variable distribution and small-scale distribution shifts in spring.
                                                                                            Since 2007, harbor porpoises have been observed periodically
                                                                                            entering the rivers Ems, Weser and Elbe following anadromous
                                                                                            fish shoals in spring (Wenger and Koschinski, 2012; Wenger et al.,
                                                                                            2016; Weel et al., 2018). It is noteworthy that the occurrence of
                                                                                            harbor porpoises in the estuaries and rivers is subject to annual
  FIGURE 10 | Estimated trends in harbour porpoise abundance in the three                   fluctuations, with some years of absence and other years of high
  SACs Dogger Bank (A), Sylt Outer Reef (B), and Borkum Reef Ground (C) in                  usage. Since these estuaries are located close to the SAC Borkum
  summer, between 2002 and 2019. The light blue histogram and the blue
  shaded density curve show the distribution of the trend estimates (relative
                                                                                            Reef Ground, this could be a further explanation for the variable
  change in abundance) between 2002 and 2019 (x-axis); the median is                        abundances and a reduced usage of this area in the last years.
  indicated by the solid red vertical line. The mean is shown by the vertical red               In SAC Sylt Outer Reef, a highly likely and strong decline
  dashed line, while the white dashed lines represent the upper and lower 95%               was observed in summer. The decline is continuous and almost
  credibility intervals of the trend estimate. The red coloured area corresponds            linear from 2002 until 2019. The trend for spring also suggests
  to an area with a negative trend, whereas the green coloured area represents
  a positive trend. The orange solid line illustrates the empirical cumulative
                                                                                            a decline, however, data are much sparser in this season,
  distribution function of the trend estimates, giving the probability of a trend           in particular toward the end of the study period. Further
  estimate at a specified value (e.g. 0%). The upper bar chart hence indicates              monitoring efforts should concentrate on gathering more data
  how likely it is that the trend is either negative (i.e., p < 0%; red) or positive        in spring to get a better insight into seasonal developments
  (i.e., p > 0%; green).
                                                                                            in the SAC Sylt Outer Reef. Being identified as a core area
                                                                                            of harbor porpoises in the German North Sea, with regular
                                                                                            high densities, and its high relevance as a calving ground,
onward (Camphuysen, 2004, 2011). Similar results were                                       beyond national borders (Sonntag et al., 1999; Gilles et al.,
also reported from Belgian and French waters, including a                                   2009, 2011, 2016), the SAC Sylt Outer Reef was specifically
steep increase in harbor porpoise strandings (Haelters et al.,                              designated for the protection of harbor porpoises. As mentioned

Frontiers in Marine Science | www.frontiersin.org                                      15                                    January 2021 | Volume 7 | Article 606609
Nachtsheim et al. Trends in Harbor Porpoise Abundance before, the North Sea is characterized by a diversity of human negative trends seen in the adjacent SAC Sylt Outer Reef. It exploitations affecting harbor porpoises on different levels. also highlights the importance of aligned and joint national Although management plans of all three SACs are now in monitoring programs, as demanded by the EU Marine Strategy place since May 2020, fisheries are not yet specifically managed Framework Directive (MSFD), to gather information on fine- within the areas. There is high fishing pressure from mobile scale changes in distribution and abundance in between large bottom contacting gear, e.g. beam and otter trawls, in SAC Sylt scale, quasi-decadal surveys such as SCANS. Aggregated national Outer Reef (Pedersen et al., 2009a,b), which may negatively monitoring data can also be put in a larger, North Sea wide impact the delicate reef communities. One of the main target context by applying spatial modeling (see e.g., Gilles et al., 2016). species in SAC Sylt Outer Reef are sandeels (Ammodytes spp.) (Pedersen et al., 2009b), which constitute a generally important part of the harbor porpoise diet (Gilles, 2008; Leopold et al., German North Sea EEZ 2015). However, sandeel biomass in this management unit has Obviously, there are clear differences in trends between strata been repeatedly below the reference value according to the and seasons – however, it is also important to have a holistic precautionary approach since 2004 due to the high fishing view on the entire German North Sea EEZ since the motivation pressure (ICES, 2019c; Otto et al., 2019). In this context, the of the monitoring program is to assess the status of key marine estimated negative trends of harbor porpoises in the core area top predators. Germany has to meet the protection obligations SAC Sylt Outer Reef could be an indicator of fishing-related under international and European law and is i.a. obliged to habitat degradation and a competition with fisheries (Herr et al., determine trends and assess conservation status of Annex II 2009), which is particularly relevant for a species depending species populations in their marine waters for incorporation on continuous food intake as shown for harbor porpoises in HD Art. 17 assessments and to report on progress toward in the Baltic Sea (Wisniewska et al., 2016). A recent joint Good Environmental Status for marine mammals under Art. 8 recommendation for fisheries management measures in the two of MSFD. For OSPAR, the status of cetaceans in the Northeast SACs Sylt Outer Reef and Borkum Reef Ground was rejected Atlantic needs to be assessed and especially the status of the by the European Commission as the proposed measures were harbor porpoise, as occurring on the OSPAR List of Threatened insufficient, in particular with respect to the conservation of and/or Declining Species and Habitats (OSPAR, 2008). The key harbor porpoises, endangered seabirds and important habitat indicator for MSFD Descriptor 1 is population size, and to types (STECF, 2019). Appropriate measures to reduce fishing assess trends with confidence. State-of- the-art methods fitting activities within the SAC Sylt Outer Reef are needed and should to MSFD requirements and concepts should be prioritized be implemented soon to protect harbor porpoises and other (Palialexis et al., 2019) and our approach outlines a fitting sensitive marine biota. approach to this concept. Moreover, several OWFs have been built in the vicinity of Overall, the abundance in the German North Sea EEZ shows the SAC Sylt Outer Reef since 2013 and in 2014 the OWF a pronounced decline over the years. The decline is mainly “Butendiek” was constructed within the SAC (Viquerat et al., driven by the strong decrease in absolute numbers of porpoises 2015; Brandt et al., 2018). During the construction phase a large in the SAC Sylt Outer Reef, which make up the majority of scale disturbance of harbor porpoises has been reported for all harbor porpoises in the German North Sea. When looking those and other OWFs in the North Sea (Dähne et al., 2013; at an even larger scale, such as the entire North Sea, there Viquerat et al., 2015; Brandt et al., 2018). The construction close is no indication for a decline of harbor porpoises based on to and within the SAC Sylt Outer Reef took place during the the SCANS III survey in 2016 but high densities in the south peak breeding and calving season of harbor porpoises in June and south-west and low densities in the east (Hammond et al., and July (Hasselmeier et al., 2004; Kesselring et al., 2019). It 2017). A joint analysis of stranding records from North Sea has been predicted that an almost continuous construction of neighboring countries from 1990 to 2017 showed a steep increase OWFs over several years close to important core areas, such as in strandings in the southern North Sea since 2005 (Ijsseldijk foraging grounds, would lead to a high degree of disturbance et al., 2020). Harbor porpoises were almost absent in the English and a substantial population decline (Nabe-Nielsen et al., 2018). Channel two decades ago but are now regularly seen in this The predicted scenario is comparable to the situation seen in the region (Hammond et al., 2013, 2017; Bouveroux et al., 2020). The SAC Sylt Outer Reef. Although the decline in harbor porpoise further southward population shift implies that harbor porpoises abundance had started already before the first OWFs were built, are now more exposed to human high-use areas, which might the construction of OWFs added another level of disturbance to represent a less optimal habitat. The southern North Sea is the already existing list of stressors acting on the population and characterized by high shipping traffic, a high fishing intensity could hence be an additional confounding factor for the decline. and a high density of OWFs that will likely increase strongly in Similar to SAC Sylt Outer Reef, a decreasing trend in harbor the near future (Pedersen et al., 2009a; Berkenhagen et al., 2010; porpoise abundance has also been observed in neighboring Emeis et al., 2015; Vespe et al., 2016) leading to an environment- areas to the north, in Danish waters, including the SAC user conflict. This is of conservation concern, also in view of “Southern North Sea”. Aerial surveys were conducted yearly in the ongoing industrialization of the North Sea as forced by the summer between 2011 and 2018 with the same methodology EUs Blue Growth strategy (European Commission, 2020). In this as in this study, and results suggest a decline over the study respect there is a large knowledge gap regarding exposure limits period (Sveegaard et al., 2019). This further supports the for marine mammals. Frontiers in Marine Science | www.frontiersin.org 16 January 2021 | Volume 7 | Article 606609
Nachtsheim et al.                                                                                                Trends in Harbor Porpoise Abundance

    Considering the variety and wealth of anthropogenic stressors,            important predictors influencing distribution and changes
the long-term reproductive success of harbor porpoises has                    therein (e.g., Hammond et al., 2013; Gilles et al., 2016). However,
been questioned in the heavily used North Sea. Female harbor                  our understanding of anthropogenic drivers and impacts could
porpoises from the German North Sea were found to be sexually                 be improved if data with high temporal and spatial resolution
mature at an age of 4.95 (±0.6) years, while the average age                  on pressures such as ship traffic, fishing effort (and bycatch
of death was determined at 5.7 (±0.27) years, especially due                  rates) and noise propagation of major anthropogenic activities
to a high mortality of young animals which may not had the                    would be included in such models and integrated in a Bayesian
chance to reproduce (Kesselring et al., 2017). Similarly, there is            hierarchical framework (see, e.g., Forney et al., 2020). Such data
an exceptionally high mortality of neonates along the German                  could also feed into agent-based population models to predict
and Danish North Sea coast compared to other North Sea regions                population dynamics (Nabe-Nielsen et al., 2018; Pirotta et al.,
(Ijsseldijk et al., 2020). This again underlines the importance of            2018). Yet, these data are not readily available at the needed
the SAC Sylt Outer Reef area as a calving habitat but also raises             temporal and spatial resolution but will be vital to ensure a
concerns about the high neonate mortality. A high mortality of                better understanding of harbor porpoise ecology and the impact
young individuals of a population would be expected, however, it              of anthropogenic disturbances on the population level as well
was shown recently that juvenile harbor porpoises carry a higher              as exposure limits, ultimately leading to effective management
load of neurotoxic substances than adults - probably due to a                 and conservation.
selective maternal transfer of these substances through lactation
(Williams et al., 2020). In general, harbor porpoises in the North
Sea exhibit a longer calving interval, lower pregnancy rates, a
higher incidence of severe lesions (especially of the respiratory             CONCLUSION
tract), and higher pollutant burdens by PCBs, DDT, Hg and
PBDEs than in areas with less human impacts, such as in the                   Overall, harbor porpoise abundance in summer has decreased
Arctic (Siebert et al., 1999, 2001, 2006b, 2009; Wunschmann et al.,           in the German EEZ between 2002 and 2019. Within the
2001; Beineke et al., 2005; Lehnert et al., 2005; Murphy et al.,              German North Sea, local and seasonal differences in trends
2015). Given the high contaminant load, high mortality of young               of abundance were noted: Harbor porpoises have decreased
harbor porpoises and the potential lower reproductive output, the             in the north-east and increased in the south, such as the
relevance of a calving ground such as the SAC Sylt Outer Reef                 southern German Bight, including SAC Borkum Reef Ground.
could diminish over time affecting the whole population.                      A particularly strong decline was found in the SAC Sylt Outer
    It has been argued that porpoises have a high movement                    Reef in summer. Due to its significance as a core area and
potential. For instance, porpoises from the Danish Baltic Sea                 main reproduction site beyond national borders, the decline is
and Skagerrak disperse over a large area and can cover vast                   of conservation concern and needs to be further investigated.
distances (Teilmann et al., 2007; Sveegaard et al., 2011). This               Further, monitoring efforts should be enlarged to survey more
is also known from tagging studies of porpoises in Greenland                  frequently in spring to get a better insight into seasonal
(Nielsen et al., 2018); however, these individuals also exhibit               developments of harbor porpoises in the SAC Sylt Outer Reef.
a high degree of site fidelity, with many individuals returning               The underlying causes for the observed trends are unknown and
to the tagging site after their seasonal migration. Other harbor              probably due to cumulative effects of numerous stressors, where
porpoise populations show a remarkably high residency and                     of most we lack adequate data on. If the trends were driven by
limited large-scale movements, such as on the US East and                     anthropogenic stressors, these should rapidly be identified, and
West Coast (Read and Westgate, 1997; Johnston et al., 2005;                   appropriate management measures developed and implemented.
Forney et al., 2017; Elliser et al., 2018). There are also indications        The necessary next step will be to put the here seen trends in a
that harbor porpoises from the North Sea show site fidelity                   North Sea-wide context reflecting the range and distribution of
and high residency over weeks and months, based on offshore                   this population.
observations in the Netherlands (Camphuysen and Krop, 2011)
and satellite tracking studies in the Danish Wadden Sea (van
Beest et al., 2018; Stalder et al., 2020). In particular, recent
telemetry results from the Wadden Sea suggest limited dispersal               DATA AVAILABILITY STATEMENT
of harbor porpoises throughout the whole year (Stalder et al.,
2020). More information on the (seasonal) movements of harbor                 Publicly available datasets were analyzed in this study.
porpoises in the North Sea by means of satellite tracking studies             This data can be found here: https://geodienste.bfn.de/
are needed to improve our interpretation of observed changes in               schweinswalmonitoring?lang=en.
distribution and population trends.
    Considering the predominant anthropogenic pressures
and our presented trends in harbor porpoise abundance, it
is imperative to better understand the underlying drivers                     ETHICS STATEMENT
and causalities, also in a regional North Sea wide context.
Habitat-based modeling, including proxies for environmental                   Ethical review and approval was not required for the animal study
dynamics that aggregate prey, are valuable tools to identify                  because of no invasive monitoring.

Frontiers in Marine Science | www.frontiersin.org                        17                                    January 2021 | Volume 7 | Article 606609
You can also read


