Senate Inquiry into the indicators of, and impact of, regional inequality in Australia - Submission to - Parliament House
←
→
Page content transcription
If your browser does not render page correctly, please read the page content below
Regional Inequality in Australia
                                Submission 118

Submission to

Senate Inquiry into the indicators of, and impact of,
regional inequality in Australia

Townsville City Council

June 2018
Regional Inequality in Australia
                                             Submission 118

EXECUTIVE SUMMARY

Regional Inequality and Challenges to Townsville’s Growth

Regional inequality is a significant constraint on national development. In particular, it is being driven by the
shift from resource (agriculture, mining, and manufacturing) to service industries. This shift has profound
geographic consequences with the loss of jobs most acutely experienced in regional centres like Townsville
and North Queensland. Skilled service jobs are in high demand, but these cluster in capital cities.

A further contributing factor to regional decline is energy affordability. This is due in significant part to
successive Australian and state governments failing to balance competing priorities of competition, security,
reliability and emissions targets, without adequate regard to the impacts on affordability and business
viability. Like energy, significantly higher cost of household and business insurance in North Queensland is also
creating regional inequality and cost of living pressures for Townsville residents.

Townsville is being impacted by synchronised cyclical (mining) and structural (manufacturing) industry decline.
These forces underlie deterioration in confidence, investment, employment, income and growth. This is
compounded by federal Government fiscal decisions impacting the level of Australian Public Service
employment within the city. The subsequent economic and demographic effects are cause for government
intervention that will mitigate the economic and social impacts and enable the region, its industries and
residents, to adjust effectively and take advantage of new opportunities arising from the Indo-Pacific region.

Current Policy Responses – Townsville City Deal

In December 2016, the Commonwealth, Queensland Government and Townsville City Council enacted
Australia's first City Deal. The Townsville City Deal is a 15-year commitment focused on improving the lives of
Townsville residents through job creation, economic growth, investment in local infrastructure, a revitalised
urban centre, and a more vibrant and liveable city. It provides an approach for government to work together
to deliver transformative outcomes for Townsville.

The Townsville City Deal is in its second year of implementation. While Townsville City Council is encouraged
with progress made in establishing the deal, further work needs to be done to drive outcomes under the deal.
The level of funding commitment and practical implementation to drive investment, particularly at the federal
level, has been disappointing.

Given the economic climate and the commitment provided under the City Deal, Townsville is very
disappointed with the 2018/19 Federal budget. The city received no additional funding and was not specifically
included in any capital works initiatives. Nothing was delivered under the City Deal.

Townsville City Council looks forward to working with the Federal Government to address the impacts of
inequality in North Queensland. Recommended initiatives and actions to progress this process include:

Recommended Actions

Townsville City Council has identified a number of priorities requiring federal support. These are:

     Regionalisation Policy:

                 •     Relocation of federal government functions to Townsville and the devolution of
                       authority and decision making to regional Australia
                 •     Supported regional immigration schemes
                 •     Supported foreign student programs
                 •     Improved availability of reliable regional social, economic and demographic data and
                       analysis

                                                 Page 1 of 21
Regional Inequality in Australia
                                      Submission 118

Defence:

           •     Revisit and elevate the Defence Working Group under the City Deal
           •     Development and implementation of Townsville focus defence procurement strategy
           •     Townsville to be developed as a deep maintenance, sustainment and logistic hub
           •     Co-location/relocation of defence trade training schools to Townsville
           •     Establish a permanent navy presence in support of 2 RAR’s role as the Australian army’s
                 principal amphibious force
           •     Acceleration of capital works programs

  Water:

           •     Army to partner with Council in the proposed water reuse scheme for Lavarack Barracks
           •     Funding support for green energy (solar) water pipeline pumping upgrade
           •     Medium term support for future water security infrastructure developments and
                 upgrades

       Port Channel Widening:

           •     $75 million towards contribution towards Townsville Port Channel widening

  Transport Infrastructure:

           •     Acceleration of North Queensland Bruce Highway initiatives
           •     Increased investment in upgrades to the Mount Isa Rail Line

  Knowledge and Innovation:

           •     Development of Australian Tropical Marine and Aquaculture Centre within the CBD
           •     Support for Townsville implementing its Smart City Strategy to capitalise on the next
                 wave of digital infrastructure, skills and jobs
           •     Employment re and upskilling initiatives
           •     Support for innovative economic investment opportunities and partnerships with the
                 private sector such as those presented by a Lithium Ion Battery Plant or construction of
                 a major lagoon on the Strand

  Price Parity

           •     Investment in new energy generation in the north
           •     Introduction of energy retail competition to North Queensland
           •     Supported access to solar PV, smart meters and energy efficient appliances to reduce
                 energy demand for low income households
           •     Greater regulatory scrutiny on insurance pricing and encouragement of regional
                 insurance market reform

                                          Page 2 of 21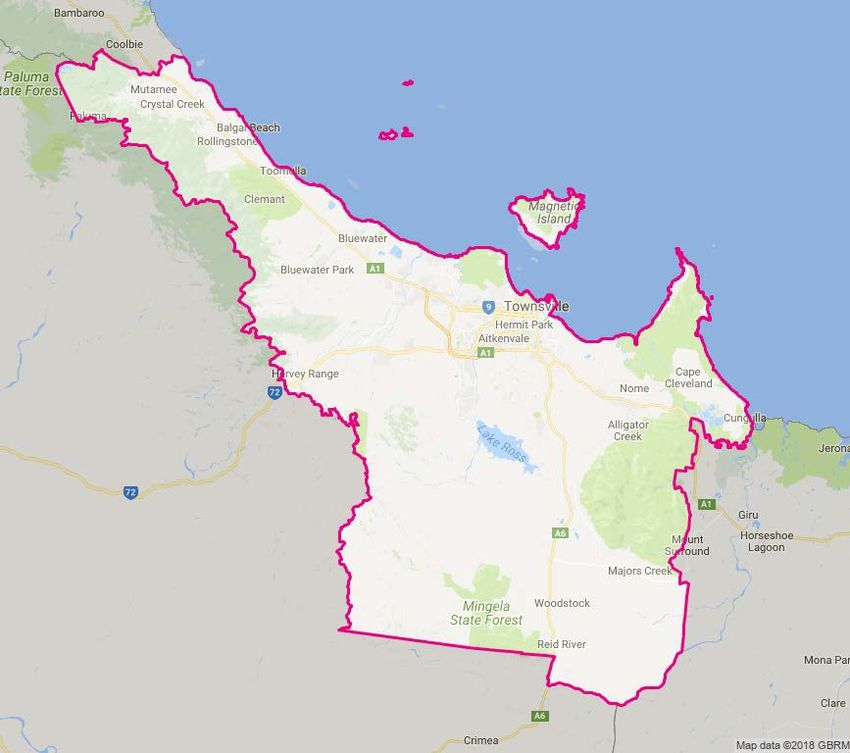
Regional Inequality in Australia
                                             Submission 118

1.       Introduction

Over 150 years Townsville has grown from a small private port to the largest city in Northern Australia.

We survived depressions and recessions, natural disasters, droughts and World Wars and have grown to be
home to metal refineries, universities, the largest tertiary hospital outside a capital city and 200,000 of our
nation’s most resourceful and resilient people.

Since 2013, Townsville has been hit with several economic shocks that have seen our economy and community
suffer. These shocks have been significantly exacerbated and hampered in their recovery by government
policy, regulation and political processes.

Our city is experiencing increasing social disadvantage, compounded by significantly higher than average
business and households cost, particular for energy, insurance and transport services. With more than 21 per
cent of Townsville residents falling within the most disadvantaged quartile, households are having increasing
difficulty in meeting high cost-of-living expenses. Australia’s welfare and taxation systems need to better
recognise and address systemic regional inequalities.

Central to Townsville’s transition is the structural shift from manufacturing and agriculture to an economy
dominated by services. As a metalliferous manufacturing hub, located on the doorstep of the world’s largest
base metals minerals province, Townsville has lost both jobs and confidence as we redefine our place in the
changing world of global trade.

Economic opportunities and government funding are not distributed equitably. The relative decline of
agriculture, manufacturing and mining is having a profound impact on regional Australia. Skilled service jobs
are in high demand and tend to cluster in capital cities. Regional Australia is voting with its feet through its
increasing support for minor parties. The message is clear and its time we listened.

With our links to the north’s natural wealth and beauty, and proximity to the increasingly prosperous Indo-
Pacific, no region is better placed to take advantage of Australia’s resources and global opportunities than
Townsville North Queensland.

We are young, capable and enthusiastic and we are proven in our ability to contribute more than our share.
Most importantly we want to partner with our federal and state colleagues to reach our potential in a world of
opportunity.

The Townsville City Deal, with its focus on the growth and investment needed to create a more vibrant and
liveable city, provides the foundation to this partnership. The Townsville City Council looks forward to working
with its state and federal partners to deliver real outcomes for the city and its residents.

Townsville was disappointed with the recent federal budget. Despite obvious economic and social need, the
city received no new or additional federal funding or support. It is difficult to reconcile this against the City
Deal’s principles of breaking down barriers to secure economic success for the city and its people.

This submission offers a revealing look at Townsville’s current socioeconomic environment and provides a
current and real example of inequality in regional Australia. It should be a catalyst for change in federal-local
relations.

We thank you for your consideration and look forward to working with the Federal Senate to address
inequality and disadvantage in regional Australia.

Cr Jenny Hill
Mayor of Townsville

                                                 Page 3 of 21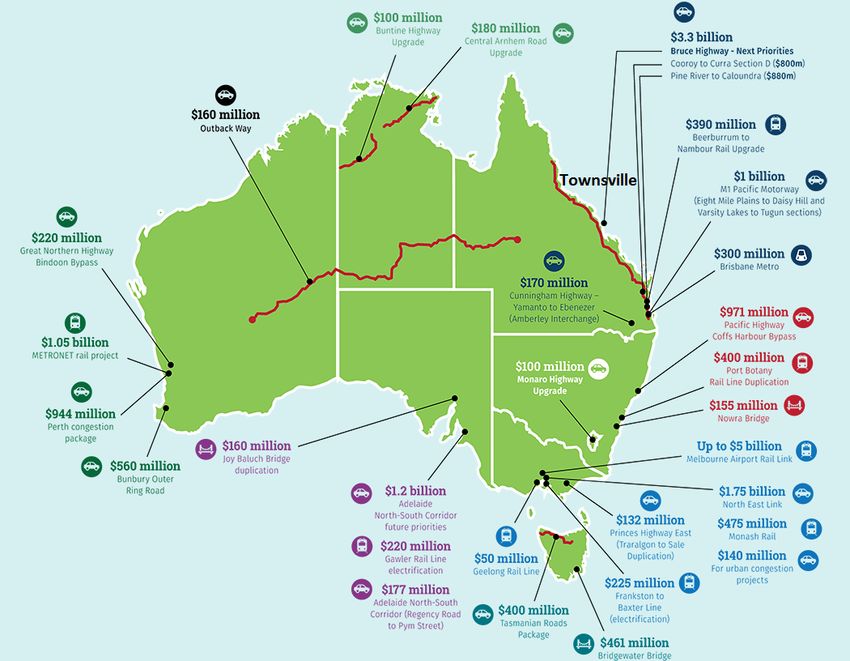
Regional Inequality in Australia
                                                    Submission 118

2.        Townsville City Overview

Figure 1: Townsville Local Government Area
                                                                                            The Townsville Local Government
                                                                                            Area, as outlined in Figure 1, has a
                                                                                            land area of 3,738.6 km2, with an
                                                                                            average daily temperature range
                                                                                            of 18.8°C to 28.1°C and average
                                                                                            annual rainfall of 1,363 mm.

                                                                                            As at 30 June 2017, Townsville had
                                                                                            a population of 193,601 with
                                                                                            average annual growth of 1.7
                                                                                            percent over the preceding decade
                                                                                            and 1.0 percent over the five years
                                                                                            to June 2017. This growth was 0.1
                                                                                            and 0.5 percentage points less
                                                                                            respectively than the average
                                                                                            annual growth for Queensland
                                                                                            over the corresponding period.

                                                                                            During    2016/17    Townsville’s
                                                                                            population growth declined to 0.8
                                                                                            percent.
Source: MapBuilder

Estimated Resident Population (ERP), for the decade through to June 2017, is outlined within Table 1 below.

Table 1: Estimated Resident Population – Townsville LGA and Queensland
      LGA/State                                As at 30 June                                    Average annual growth rate
                            2007            2012pr           2016              2017p      2007–2017p    2012–2017p      2015-2016p
                                                — number —                                                 —%—

Townsville                163,509           183,771          192,058           193,601          1.7           1.0          0.8
Queensland               4,111,018         4,569,863        4,848,877         4,928,457         1.8           1.5          1.6
Source: ABS 3218.0, Regional Population Growth, Australia, various editions

The ERP growth for Townsville and Queensland is illustrated in Figure 2 below. After 5 years of average growth
relative to Queensland, Townsville has experienced lower growth for the five years to June 2017.

Figure 2: Estimated Residential Population Growth, Townsville and Queensland

                                                          Page 4 of 21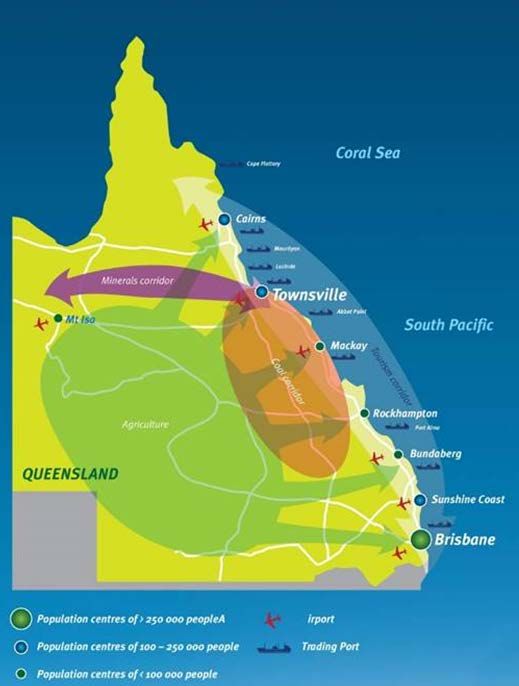
Regional Inequality in Australia
                                                        Submission 118

Table 2 outlines the median age for Townsville and Queensland as at 30 June 2016. Townsville had a median
age of 33.8 years. This is 3.2 years younger than Queensland’s average age and represents an increase of 1.0
year from median age of 32.8 years as at 30 June 2006.

Table 2: Median Age, Townsville and Queensland
                                                                      As at 30 June                                          Change
                LGA / State                   2006                         2011                        2016pr           2006–2016pr
                                                                       — years —                                           Years
Townsville                                         32.8                     33.2                      33.8                       1.0
Queensland                                         36.1                     36.6                      37.0                       1.0
Source: ABS 3235.0, Population by Age and Sex, Regions of Australia data and Queensland Treasury estimates unpublished

Table 3 presents ERP by age for Townsville and Queensland as at 30 June 2016.

Table 3: Estimated Resident Population by age, Townsville and Queensland
         LGA/State                                                                    Age group
                                   0–14                15–24                         25–44                     45–64                     65+
                              number        %        number           %      number            %             number       %            number     %

Townsville                    39,270       20.4      30,611        15.9       54,759           28.5           45,174      23.5          22,244   11.6
Queensland                   954,598       19.7     649,335        13.4     1,334,934          27.5      1,196,357        24.7         713,653   14.7
Source: ABS 3235.0, Population by Age and Sex, Regions of Australia

Compared to Queensland, Townsville has a higher proportion of the population aged 0 – 44 and a lower
proportion aged 45- 65+.

Table 4 outlines births and deaths for Townsville and Queensland for calendar year 2016.

Table 4: Registered Births and Deaths, Townsville and Queensland 2016
                     LGA / State                                   Births                        Deaths                   Natural Increase
                                                                                 a                                 a
                                                          Number          Rate          Number           Rate                 Number

Townsville                                                 2,679          13.9            961                5.0                 1,718
Queensland                                                61,841          12.8           29,690              6.1              32,151
Source: ABS 3301.0 Births Australia 2016; ABS 3302.0 Deaths Australia 2016. QGSO. (a) Crude rate per 1,000 persons.

Townsville’s population naturally increased (Births – Deaths) by 1,718 persons during 2016. With a birth rate of
13.9 people per 1,000 persons and a death rate of 5.0 people per 1,000 persons, Townsville’s natural rate of
population growth, at 8.9 persons per 1,000 persons, is 2.4 people per 1,000 persons higher than that
recorded for Queensland (6.5 persons per 1,000).

Table 5 presents population projections for Townsville and Queensland through to 2036.

Table 5: Projected Population, Townsville and Queensland
                                                                                                                                          Average
       LGA / State                                                  As at 30 June                                                      annual growth
                                   2011             2016           2021        2026                     2031             2036           2011–2036
                                                                       — number —                                                           %
Townsville                         180,114 199,358                 219,643           241,872           265,015          288,593            1.9
Queensland                       4,476,778 4,853,048           5,250,292         5,730,062            6,240,546        6,763,153           1.7
Source: Queensland Government Population Projections, 2015 edition (medium series)

The resident population of Townsville is projected to be 249,898 persons as at 30 June 2036. This represents
an average increase of 1.9 percent per annum over 25 years.

                                                                Page 5 of 21
Regional Inequality in Australia
                                                         Submission 118

Table 6 presents unemployment and labour force for Townsville and Queensland as at December Quarter
2017.

Table 6: Unemployment and labour force, Townsville and Queensland, December 2017
               LGA /Queensland                           Unemployed       Labour force                      Unemployment rate
                                                                  — number —                                       %
Townsville                                                       7,840                    96,155                      8.2
Queensland                                                     156,785                 2,573,166                      6.1
Source: Department of Employment, Small Area Labour Markets Australia, December 2017

At 8.2 percent, Townsville’s unemployment rate was 2.1 percent higher than that recorded for Queensland
(6.1%) for the December quarter 2017.

Table 7 outlines Indigenous Status for Townsville and Queensland as at Census 2016. 7.0 percent of residents
of Townsville identified as being indigenous.

Table 7: Indigenous Status, Townsville and Queensland
                               Indigenous Persons                                                                                       Total
  LGA / State Aboriginal Torres Strait Islander                                                              Non-indigenous
                                                  Both                               Total                                              Persons
                 - Number -                 - Number -                                            %         - Number -          %         Number
Townsville              9,591                  1,893                   1,549        13,040        7.0       160,539            86.0               186,757
Queensland          148,943                   21,053                   16,493      186,482        4.0     4,211,020            89.5            4,703,193
Source: ABS. Census of Population 2016. Indigenous Profile. Usual Residence. GSO

Table 8 provides selected median and average measures from the 2016 Census for Townsville and Queensland.

Table 8: Select medians/averages, Townsville and Queensland, 2016
                                                         Median / Average
        LGA /State          Median          Median    Median       Median total Average                                      Average
                                      mortgage              total          total             personal              household number of
                                      repayment            family          household         income                size      persons per
                                                           income          income                                            bedroom
                                         $/month             $/week             $/week            $/week            persons           number
Townsville                                 1,733               1,705              1,424               703             2.6               0.8
Queensland                                 1,733               1,661              1,402               660             2.6               0.8
Source: ABS, Census of Population and Housing, 2016, General Community Profile - B02

At Census 2016, Townsville residents recorded higher median personal, family and household income than
Queensland residents/households, while median monthly mortgage repayments were the same as for
Queensland.

Table 9 presents the index of relative socio-economic disadvantage for Townsville and Queensland.

Table 9: Population by Index of Relative Socio-Economic Disadvantage, 2016
                                           Quintile 1                                                                          Quintile 5
           LGA/State                         (most                  Quintile 2       Quintile 3         Quintile 4               (least
                                        disadvantaged)                                                                      disadvantaged)
                                                                                     —%—
Townsville                                     21.2                    26.0             20.7                15.7                 16.5
Brisbane                                       16.6                    15.2             18.3                21.0                 28.9
Queensland                                     20.0                    20.0             20.0                20.0                 20.0
Source: ABS 2033.0.55.001, Census of Population and Housing: Socio-Economic Indexes for Areas (SEIFA), Australia - Data only, 2016, (Queensland
Treasury derived)

With 47.2 percent of residents in the most disadvantaged quintiles, Townsville has a higher level of
disadvantage than that recorded for Queensland (40%).

                                                               Page 6 of 21
Regional Inequality in Australia
                                                  Submission 118

As at December 2017, the Townsville North Queensland region had Gross Regional Product of $15.946 billion.
This equates to $69,622.00 per capita or $153,999.00 per worker. A breakdown of the region’s gross
production is outlined in Table 9.

Table 9: Gross Regional Product – Townsville, December 2017
GRP Expenditure Method                                                   $M
Household Consumption                                            $10,213.072
Government Consumption                                            $3,255.864
Private Gross Fixed Capital Expenditure                           $3,985.899
Public Gross Fixed Capital Expenditure                             $797.899
Gross Regional Expenses                                          $18,252.655
plus Regional Exports                                             $8,078.049
minus Domestic Imports                                           -$8,650.901
minus Overseas Imports                                           -$1,733.871
Gross Regional Product                                           $15,945.931
Source: Remplan

Figure 3 outlines value-added by industry sector for Townsville North Queensland as at December 2017.

Figure 3: Value-Added (%) – Townsville North Queensland (Dec 2017)

                  2.00%
                            Value-Added Townsville North Queensland
                                 1.90%                                     Public Administration & Safety
                    2.40%      2.00%   0.60%                               Rental, Hiring & Real Estate Services
              2.60%                                                        Health Care & Social Assistance
                                                                           Construction
              3.10%                                                        Education & Training
                                                16.20%
           3.50%                                                           Manufacturing
                                                                           Transport, Postal & Warehousing
                                                                           Retail Trade
                  3.80%                                                    Electricity, Gas, Water & Waste Services
                                                          13.40%           Financial & Insurance Services
                  4.40%
                                                                           Agriculture, Forestry & Fishing
                  4.50%                                                    Professional, Scientific & Technical Services
                                                                           Accommodation & Food Services
                    4.60%                                8.70%             Wholesale Trade
                                                                           Administrative & Support Services
                      4.90%                                                Other Services
                              5.90%             7.90%
                                                                           Information Media & Telecommunications
                                      [VALUE]                              Mining
                                                                           Arts & Recreation Services

Source: Remplan

The Townsville North Queensland Region has a diversity of economic drivers with no one sector contributing
more than 16 percent to the region’s economy.

Public Administration and Safety is Townsville North Queensland’s largest industry sector, contributing
$2,416M or 16.2% to Gross Regional Product.

Other significant contributing sectors include Health Care and Social Assistance ($1,299M), Construction
($1,261M), Education and Training ($1,051M) and Manufacturing ($942M).

                                                          Page 7 of 21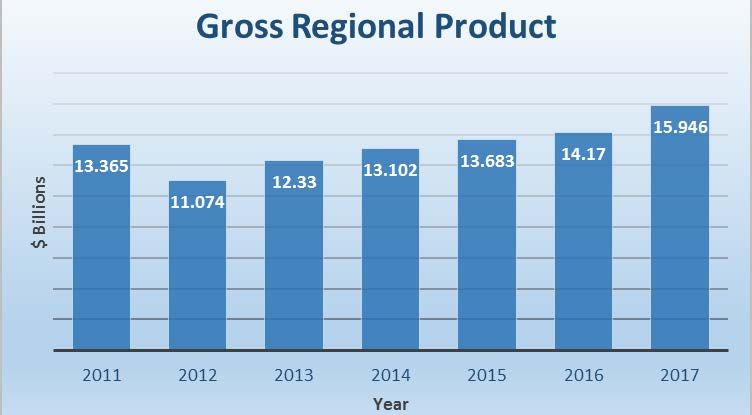
Regional Inequality in Australia
                                                   Submission 118

3.          Townsville Situation Analysis
                                                                                               1
There is broad consensus that, post mining boom, Australia’s “next economic wave” will be derived from:

       •    Agribusiness
       •    Tourism
       •    International Education
       •    Gas
       •    Health Services
       •    Financial Services (banking, wealth management, insurance etc.)

Demand for these services will be driven by increasing prosperity throughout the Indo-Pacific region and the
tropics generally. This area accounts for more than 50 percent of global population and 60 percent of the
world’s children. Most live in poor but rapidly improving economic circumstances.

Townsville and the North Queensland region has strategic connections to Agribusiness and Tourism and
competitive advantages in International Education and Health Services. It is well connected logistically to the
Indo-Pacific region.

Figure 4: Townsville Strategic Location
                                                                            With direct links to mining, agriculture and
                                                                            tourism, no region is better placed to take
                                                                            advantage of Australia’s natural resources
                                                                            and global trade opportunities than
                                                                            Townsville North Queensland.

                                                                            The city’s estimated resident population of
                                                                                                             th
                                                                            193,946, makes it Australia’s 13 largest
                                                                            major urban area behind Geelong,
                                                                                            th
                                                                            Queensland’s 4 largest major urban area
                                                                            behind the Sunshine Coast and the largest
                                                                            city in Northern Australia.

                                                                            Located approximately 1,200 kilometres
                                                                            north of the State capital – Brisbane,
                                                                            Townsville is Australia largest urban area,
                                                                            not directly linked to its capital by
                                                                            proximity.

                                                                            Linkages, size and location provide the
                                                                            Townsville North Queensland Region with a
                                                                            diversity of economic drivers with no one
                                                                            sector contributing more than 16 percent to
                                                                            the economy.

                                                                            As       outlined     previously, Public
                                                                            Administration and Safety is Townsville’s
                                                                            largest industry sector.

Central to the public sector’s contribution’s is Defence. Home to more than 15,000 Defence personnel and
dependents, Townsville is regarded as Australia’s largest garrison city. The region hosts four major defence
establishments: Lavarack Barracks; RAAF Base Townsville; Townsville Field Training Area; and the Port of
Townsville’s Berth 10 (designed for the Royal Australian Navy).

1
    Termed coined by Deloitte Access Economics in its publication Positioning for Prosperity

                                                        Page 8 of 21
Regional Inequality in Australia
                                                  Submission 118

Townsville’s growth and prosperity has been heavily influenced by government investment including:

       •    the establishment of James Cook University, Australian Institute of Marine Science, the CSIRO and the
            Great Barrier Reef Marine Park Authority in the 1960s and 1970s;
       •    the establishment of Lavarack Barracks and RAAF Base Townsville in the 1960s and 1970s; the
            Burdekin Dam construction in the 1980s;
       •    the relocation and redevelopment of Townsville General Hospital as a tertiary teaching hospital; and,
       •    the redevelopment of the Strand and Jezzine Barracks in the 1990s and 2000s.

Figure 5 graphs Gross Regional Product for the Townsville North Queensland Region for the period 2011 to
2017.

Figure 5: Townsville North Queensland Gross Regional Product

Source: Remplan

After 16 years of continuous rapid growth, predominately driven by mining, manufacturing, health and
education, the Townsville North Queensland economy suffered a major recession (17.1 percent decline) in
2012. While nominally the region took almost three years to return to pre-recession levels, in real terms, it
took more than five years to recover, only returning to pre-recession levels of production in 2017.

Significant contributing factors to this downturn are a combination of market-driven changes (mining industry
demand shocks) and structural change, particularly within the manufacturing sector.

These economic factors are not unique to Townsville. The end of the mining investment boom significantly
impacted both Western Australia and Queensland, with regional centres such as the Pilbara, Mackay and
Townsville the most impacted. The decline in manufacturing is a national phenomenon, particularly impacting
regional centres.

Figure 6 outlines Australia’s sectoral share of employment for the period 1890 through to 2016. As in other
                                                                                       2
countries, Australians are spending a growing share of their income on services . The long-term trend
continued over the past two decades, with fewer working in agriculture and manufacturing and more working
in services. Since the mid-1980s, the share of jobs in agriculture has fallen from 6.1 per cent to 2.5 per cent
and in manufacturing from 16.1 per cent to 7.5 per cent. Townsville is highly exposed to these, particularly the
shift in manufacturing.

2
    Regional patterns of Australia’s economy and population. Grattan Institute 2017

                                                        Page 9 of 21
Regional Inequality in Australia
Submission 118
Figure 6: Sectoral Share of Employment
Source: Grattan Institute 2017
Contributing $942 million, or 5.9 percent of total value-added, Manufacturing is a long established and valued
sector within Townsville’s economy.
Critical to the sector is Townsville’s connection to mining and agriculture. Metals manufacturing contributes
$277.1 million (down from $365 million with the closure of the Yabulu Nickel Refinery). Chemical and plastics
manufacturing contributes $93 million. Transport equipment and parts manufacturing contributes $91.6
million and food products (Abattoir, bakeries etc.) manufacturing contributes ~$85.1 million annually.
It is estimated that Manufacturing employs 5,500 Townsville residents and contributes $531 million in salaries
and wages to the Townsville economy annually.
Townsville has three minerals refining/smelting facilities:
• Queensland Nickel; nickel, cadmium and cobalt
• Glencore Copper Refinery: copper cathode
• Sun Metals: zinc, and sulphuric acid
These facilities use both local and imported product to produce high value-added goods traded on global
markets. They are significant contributors to Australia’s national accounts.
In January 2016, Queensland Nickels Yabulu Refinery was placed in administration. At the time, the refinery
employed approximately 780 people. In the two years leading up to the closure, a further 237 employees were
3
made redundant . It is estimated that the refinery’s closure resulted in the following impacts to the Townsville
North Queensland economy:
• $1.1 billion in output (including $680 million directly and $400 million indirectly)
• $220 million in Gross Regional Product per annum ( $40 million directly and $180 million indirectly)
• $150 million in incomes and salaries paid to workers ( $70 million directly and $80 million indirectly)
• 1,970 Full-Time Equivalent (FTE) jobs (including 780 directly and 1,190 indirectly)
The Glencore Copper Refinery is scheduled to close, potentially within the next five years. The Copper Refinery
directly employs approximately 400 people.
3
AEC 2016
Page 10 of 21Regional Inequality in Australia
Submission 118
The impact on employment is evident in Figures 8 and 9.
Figure 7 presents the quarterly unemployment rate for Townsville and Queensland for the period ending
December 2010 through to March 2017.
Figure 7: Unemployment Rate, Townsville and Queensland.
Unemployment Rate
15
10
%
5
0
Mar-17
Mar-15
Mar-16
Dec-17
Jun-15
Jun-16
Jun-17
Sep-16
Dec-16
Sep-17
Mar-11
Mar-12
Mar-13
Mar-14
Jun-13
Jun-14
Sep-14
Dec-14
Sep-15
Dec-15
Jun-11
Jun-12
Sep-13
Dec-13
Dec-10
Sep-11
Dec-11
Sep-12
Dec-12
Quarter Ending
Townsville Queensland
Source: Department of Employment, Small Area Labour Markets Australia, various editions
From a low of 4.1 percent recorded in the March Quarter 2013, Townsville’s unemployment rate more than
doubled (x 2.5) over the 4 years to record a 22 year high of 10.8 percent in March 2017. The significant
contributing factor was the closure of Queensland Nickel’s Yabulu Refinery in 2016. The downturn in mining
investment (from 2013) also significantly contributed to unemployment. Over the three quarters to December
2017, the unemployment rate declined to 8.2 percent, an outcome last seen in the March quarter of 2016.
Figure 8 outlines the impact on Townsville’s labour force.
4
Figure 8: Labour Force , Townsville LGA
Labour Force # (Smoothed)
110,000
105,000
People Employed
100,000
95,000
90,000
85,000
80,000
Mar-15
Mar-16
Mar-17
Jun-16
Jun-17
Sep-17
Dec-17
Mar-13
Mar-14
Jun-14
Jun-15
Sep-16
Dec-16
Mar-11
Mar-12
Jun-13
Sep-14
Dec-14
Sep-15
Dec-15
Jun-11
Jun-12
Dec-12
Sep-13
Dec-13
Dec-10
Sep-11
Dec-11
Sep-12
Quarter Ending
Source: Department of Employment, Small Area Labour Markets Australia, various editions
From a high of 106,077 people recorded in the quarter ending 31 December 2011, Townsville’s labour force
trended down to 89,577 people in the quarter ending 30 December 2016 (loss of 16,500 or 15.5%). Since the
December quarter, Townsville’s labour force has recovered to reach 96,155 as at the December quarter 2017.
The combination of increasing unemployment and decreasing labour force participation suggests a level of
unemployment greater than the rate recorded with about 10,000 people giving up on employment or leaving
the city.
4
4 quarter smoothed
Page 11 of 21Regional Inequality in Australia
Submission 118
A significant contributing factor to regional industry decline is energy affordability with price increases over
the past ten years putting business and residential consumers under pressure. This is due in significant part to
successive Australian and state governments failing to balance competing priorities of competition, security,
reliability and emissions targets, without regard to the impacts on affordability and business viability. As is
evident in Figure 9, policy, regulatory and market decisions have led to dramatically higher prices.
Figure 9: Retail price index (inflation adjusted) – Australian capital cities
Source: ACCC Retail Electricity Inquiry Preliminary Report 2017.
These large price increases have not been matched across the economy or in wage growth. Figure 10 below
indicates that between 2007 and 2017, electricity prices had a compound annual growth rate of 8 per cent
which was more than twice that for wages (3.1 per cent) and triple the CPI rate (2.4 per cent) for the
corresponding period.
Figure 10: CPI, electricity, capital cities (general) and wages growth
Source: ACCC Retail Electricity Inquiry Preliminary Report 2017
This situation is exacerbated in North Queensland due to our proximity to generation and subsequent reliance
on transmission. Since the introduction of a national electricity market, the delivered price of electricity in the
North has been up to 25% higher than comparable areas in the State. Significant factors contributing to higher
input costs include high transmission use of system (TUOS) and marginal loss factor (MLF) charges levied by
Energy Queensland (Powerlink). This significantly impacts the competitiveness of industry and is a major
disincentive to investment resulting in the loss of opportunity.
Page 12 of 21Regional Inequality in Australia
Submission 118
North Queensland’s largest industrial power user, Sun Metals, have noted that their power costs (around $50-
60M pa) have tripled over the last 15 years, and the additional cost associated with energy and its transmission
are impacting their competitiveness. Sun Metals has noted that if their plant had been in Gladstone rather
than Townsville they would save approximately $10.5M per annum on transmission charges alone.
Electricity prices have gone from a source of regional competitive advantage to a drain on business
productivity. Townsville, with its exposure to energy intensive metals processing and refining, is at the leading
edge of the shift from manufacturing to services. This is occurring however without recognition or structured
support from government to mitigate and facilitate the transition.
Outcomes in energy are similar to those experienced within other critical regional markets including insurance
and telecommunications.
Figure 11 outlines the relative size of Northern Australian home and content markets for 2016/17. As
illustrated, North Queensland makes up approximately 4 per cent of policies nationally, yet accounts for about
8 per cent of national premium revenue.
Figure 11: Northern Australia Home and Contents Markets 2016/17
Source: ACCC Northern Australia Insurance Inquiry Update Report – June 2018
In 2016/17 the average annual home and contents insurance premium in North Queensland was
approximately $2,000, which is double the average premium reported for the rest of Australia at $1000 per
5
year. The average in premiums per sum insured (per $1,000 insured) illustrate even greater disparity at more
than double the rate for the rest of Australia.
Figure 12: Average annual premium and premium per $1000 sum insured 2016/17
Source: ACCC Northern Australia Insurance Inquiry Update Report – June 2018
5
ACCC Northern Australia Insurance Inquiry Update Report – June 2018
Page 13 of 21Regional Inequality in Australia
Submission 118
For low income or vulnerable households, meeting increases in electricity and insurance costs often results
reducing expenditure on household basics like food, children’s educational needs or healthcare, or deferring
household repairs or basic transport costs.
The loss of high paying jobs in mining and manufacturing has had a marked impact on the level of social and
economic disadvantage experienced within Townsville. Figure 13 compares the relative socio-economic
disadvantage experienced over the inter-censual period 2011-2016.
Figure 13: Index of Relative Socio-Economic Disadvantage – 2011 and 2016
Index of Relative Socio-Economic Disadvantage
28.2
26
23
21.2 20.17
19.7
%
15.8 15.7 16.5
13.4
Quintile 1 Quintile 2 Quintile 3 Quintile 4 Quintile 5
2011 13.4 28.2 19.7 15.8 23
2016 21.2 26 20.17 15.7 16.5
Source: ABS 2033.0.55.001, Census of Population and Housing: Socio-Economic Indexes for Areas (SEIFA), Australia - Data only, 2011 & 2016,
(Queensland Treasury derived)
The Socio-Economic Indexes for Areas (SEIFA) focuses on low-income earners, relatively lower education
attainment, high unemployment and dwellings without motor vehicles. Low index values represent areas of
most disadvantage and high values represent areas of least disadvantage.
The impact is most evident in the changes in Quintile 1 (most disadvantaged) and Quintile 5 (least
disadvantaged). Residents within the most disadvantaged quintile (1) went from a below Queensland average
level of 13.4 percent in 2011 to an above Queensland average of 21.2 percent in 2016 (increase of 7.8% of the
population). Conversely, those within the least disadvantaged quintile (5) have gone from an above average
level of 23 percent in in 2011 to a below average level of 16.5 percent in 2016.
Based on 2016 census SEIFA estimates, 21.2 per cent of Townsville residents are in the most disadvantaged
quartile and at significant risk of having trouble in meeting high electricity and insurance costs.
High levels of disadvantage often translate to higher levels of criminality. Table 10 presents the reported
offences for both Townsville and Queensland for 2016/17.
Table 10: Reported Offences, Townsville and Queensland, 2016/17
Type of Offence
LGA/ State Offences against Offences against Other Offences Total
. the Person Property
1 1 1 1
number rate number rate number rate number rate
Townsville 2,315 1,197 12,246 6,322 12,707 6,571 27,268 14,100
Queensland 34,349 699 230,473 4,691 233,510 4,753 498,332 10,142
Source: Queensland Police Service; 1 rate per 1000 people
Townsville’s rate of total reported offences per 1,000 people is 39 per cent higher than that recorded for
Queensland in the corresponding period.
Page 14 of 21Regional Inequality in Australia
Submission 118
Figure 14 examines Townsville Estimated Resident Population for the period 2001 to 2017.
Figure 14: Estimated Resident Population – Townsville 2001 - 2017
Estimated Resident Population - Townsville
186,808 190,726 193,601
180,114
163,509 173,067
147,964 155,330
142,012
2001 2002 2003 2004 2005 2006 2007 2008 2009 2010 2011 2012 2013 2014 2015 2016 2017
Source: ABS 3218.0, Regional Population Growth, Australia, various editions
The average rate of population increase has declined from 1.8 percent per annum over the 10 years to 2017,
to 0.8 percent for the year ending 30 June 2017.
Changes in population occur due to a combination of natural increase/decreases (Births minus Deaths) and net
migration increase/decreases (immigration minus emigration). Figure 15 illustrates the components to
population increase for the period 2001 through to 2017.
Figure 15: Components to Population Increase – Townsville, 2001 – 2017.
Source: ABS 3218.0, Regional Population Growth, Australia, various editions. ABS 3301.0 Births Australia; ABS 3302.0 Deaths Australia various
editions. QGSO.
Over the 17 years to 2017, Townsville averaged net migration of 1,858 per annum. Recent net migration
peaked in 2007 (pre-GFC) at 3,180 with a sharp decline coinciding with the end of the mining boom in 2013. In
2017, net migration was -761. This was the second consecutive year of negative migration. The downturn in
mining investment and the closure of Queensland Nickel’s Yabulu Refinery were significant contributing
factors to declines in net migration. This has also been compounded by recent restructuring of Australian
Public Service functions within Townsville, resulting in the estimated loss of 200 full-time equivalent positions.
Given the physical and emotional effort involved in moving inter-regionally, there is a significant lag between
loss of employment and emigration. This is evident in Figure 16, with net migration going into decline in 2016
(-412) and 2017 (-761). This decline will continue until Townsville returns to pre-recession employment levels
of approximately 100,000 jobs. This requires the addition of approximately 10,000 jobs (10%).
Page 15 of 21Regional Inequality in Australia
Submission 118
4 Address of Inquiry Terms of Reference
This section addresses the Inquiry’s terms of reference relevant to Townsville.
4.1 Inequality between Capital and Regional Cities
Economic opportunities, population and employment growth are not distributed evenly. As outlined, output
and employment are shifting from manufacturing, agriculture and mining to the services sectors. Skilled
service jobs are in high demand and tend to cluster in capital cities.
The ensuing increase in capital city population results in congestion and rising demand for goods and services
and infrastructure investment. This further pump-primes the capital city economies with influxes of
government infrastructure and service funding and private investment and consumption.
An example of government funding favouring capital cities is evident in the 2018/19 Federal budget, the
centrepiece of which is a $75 billion commitment to transport infrastructure over 10 years. New federal
initiatives, as illustrated in figure 16, are overwhelmingly within capital cities. Few come near Townsville, with
Bruce highway funding almost exclusively being allocated to South-East Queensland.
Figure 16: New Major Projects – Transport Infrastructure
Source: Federal Budget Paper 2018/19.
Other initiatives include: $5.3 billion towards the Western Sydney Airport; $9.3 billion for the Melbourne to
Brisbane Inland Rail; and, $4.2 billion and $2.1 billion for New South Wales and Victoria respectively from the
sale of Snowy Hydro, the proceeds of which will be channelled into productive infrastructure.
6
Townsville North Queensland’s 2018/19 Federal Budget submission is attached at Appendix A . Despite the
identified need for government support, none of these initiatives were taken up. The city received no
additional funding and was not specifically included in any capital works initiatives. This is despite Townsville
being the beneficiary of a federal government “City Deal”.
6
Townsville Enterprise Limited 2018
Page 16 of 21Regional Inequality in Australia
Submission 118
4.2 What causes regions to prosper?
Long-term regional prosperity is intrinsically linked to:
• access to markets and competitively priced inputs of production
• scale (population and industry)
• diversity of, or the ability of the region to diversify
• Skills and education
• amenity (lifestyle and services)
Agglomeration economics explains that already concentrated populations tend to grow faster because they
have access to markets, high quality human capital, and the infrastructure that facilitates economic
7
interactions .
The development of knowledge-based service industries relies on the concentration of firms and services.
Government has a role in developing the infrastructure and architecture (physical and soft) necessary for
people to acquire knowledge and for businesses to innovate and develop. This includes facilitating access to
markets and creating the liveability needed to attract and retain skilled people. It also includes equitable
availability of government services and distribution of government expenditure.
Where a region’s economy is significantly centred on an historic advantage, and one or more factors of
production change over time, then that region is at risk of structural decline and subsequent socioeconomic
disadvantage. This was the situation for Newcastle in the 1980s and 90s with its economy founded on
competitive advantages in natural resources (coal & iron ore & steel manufacturing). The transition for
Newcastle was centred on economic diversification with a focus on service industries. Initiatives focused on
the architecture for innovation and entrepreneurship and creating the urban environment (CBD) attractive to
industry.
Newcastle’s economic adjustment was lead, managed and coordinated through local, state and federal
partnerships, with funding significantly provided by the Commonwealth and New South Wales governments. It
played a significant part in facilitating the necessary economic transition, while revitalising the CBD and
mitigating the social and personal costs of adjustment.
Newcastle’s situation in the 1980s and 1990s is not dissimilar to Townsville’s today.
Successful adjustment and transition requires that all levels of government, the private sector and community
work together to achieve shared goals and objectives. This needs a well communicated multilateral strategic
approach, working across government and electoral cycles, with a focus on employment creation, economic
diversification and re and upskilling initiatives.
7
Grattan 2011
Page 17 of 21Regional Inequality in Australia
Submission 118
4.3 Policy settings: addressing regional inequality
Broadly speaking, regional development policy should provide a practical response to state and national
growth management needs. It should extend the focus of state and federal governments beyond capital cities
to more evenly, efficiently and equitably spread growth, to provide regional development opportunities and
address socioeconomic disadvantage. Practical measures to achieve this could include, inter alia:
• Subsidised and/or supported essential service provision (energy, insurance, labour etc.)
• Decentralisation of government services. This should be more than moving a department or office
from Sydney to Paramatta or from Melbourne to Geelong
• Regional location incentives – (e.g. business and individual tax incentives, including meaningful zonal
tax offsets that recognise regional inequality and the additional cost of living within regional and
remote areas)
• Local procurement processes – local industry engagement policies and procedures
• funded regional development plans
• Budgeted regional infrastructure plans
Infrastructure investment does play an important role in mitigating disadvantage and redirecting growth to
targeted locations. Provision of quality infrastructure and services in regional centres is a vital element of any
strategy to attract investment and population growth.
The process of addressing regional inequality starts with a commitment from all levels of government to work
together to deliver common goals. These partnerships, and the initiatives enacted within them, must recognise
the relative capacity of partners, with the federal government taking the significant resourcing role.
At a targeted level, policies and programs to address regional industry adjustment and inequality need to be
developed and implemented at the local level through inter-governmental and community partnerships. This
requires whole-of-government partnerships working together to identify barriers, develop agreed goals and
implement specific initiatives and programs.
In December 2016, the Commonwealth, Queensland Government and Townsville City Council enacted
Australia's first City Deal.
The Townsville City Deal is a 15-year inter-governmental commitment focused on improving the lives of
Townsville residents. It provides an approach for government and the community to work together to deliver
transformative outcomes for Townsville. The framework has been designed to transform Townsville and drive
economic growth. Over 15 years the Townsville City Deal will:
• revitalise development, particularly in the city and Waterfront PDA
• activate industry and export growth
• support long term growth of local businesses
• enhance liveability
• improve planning, coordination and governance.
The process and timelines for the City Deal are outlined below.
Page 18 of 21Regional Inequality in Australia
Submission 118
The objectives of the Townsville City Deal will be delivered through the following broad initiatives:
Capital of North Queensland Innovative and Connected City
Industry Powerhouse for the North Defence Hub
Port City Enabling Infrastructure
Details of the City Deal are available at: https://cities.infrastructure.gov.au/townsville-city-deal .
The Townsville City Deal is in its second year of implementation. While Townsville City Council is encouraged
with progress made in establishing the deal, further work must be done to drive outcomes under the deal. The
level of funding commitment and practical implementation to drive investment and social equality, particularly
at the federal level, has been disappointing. This lack of commitment is evident in the 2018/19 Federal Budget
outcomes as discussed in section 4.1 above, and Townsville City Council looks forward to the opportunity to
redress this situation.
The Townsville City Council has identified a number of priorities requiring federal support.
Regionalisation Policy:
• Relocation of federal government functions to Townsville and the devolution of
authority and decision making to regional Australia
• Supported regional immigration schemes
• Supported foreign student programs
• Improved availability of reliable regional social, economic and demographic data and
analysis
Defence:
• Revisit and elevate the Defence Working Group under the City Deal
• Development and implementation of Townsville focus defence procurement strategy
• Townsville to be developed as a deep maintenance, sustainment and logistic hub
• Co-location/relocation of defence trade training schools to Townsville
• Establish a permanent navy presence in support of 2 RAR’s role as the Australian army’s
principal amphibious force
• Acceleration of capital works programs
Water:
• Army to partner with Council in the proposed water reuse scheme for Lavarack Barracks
• Funding support for green energy (solar) water pipeline pumping upgrade
• Medium term support for future water security infrastructure developments and
upgrades
Port Channel Widening:
• $75 million towards contribution towards Townsville Port Channel widening
Page 19 of 21Regional Inequality in Australia
Submission 118
Transport Infrastructure:
• Acceleration of North Queensland Bruce Highway initiatives
• Increased investment in upgrades to the Mount Isa Rail Line
Knowledge and Innovation:
• Development of Australian Tropical Marine and Aquaculture Centre within the CBD
• Support for Townsville implementing its Smart City Strategy to capitalise on the next
wave of digital infrastructure, skills and jobs
• Employment re and upskilling initiatives
• Support for innovative economic investment opportunities and partnerships with the
private sector such as those presented by a Lithium Ion Battery Plant or construction of
a major lagoon on the Strand
Price Parity
• Investment in new energy generation in the north
• Introduction of energy retail competition to North Queensland
• Supported access to solar PV, smart meters and energy efficient appliances to reduce
energy demand for low income households
• Greater regulatory scrutiny on insurance pricing and encouragement of regional
insurance market reform
Page 20 of 21Regional Inequality in Australia
Submission 118
5. Conclusion
Regional inequality does exist. A significant contributing factor is the shift from resource (agriculture, mining,
and manufacturing) to service industries. This shift has profound geographic consequences with the loss of
jobs in manufacturing and agriculture most acutely experienced in regional centres. Skilled service jobs are in
high demand, but these cluster in capital cities. Governments respond by increasing scarce infrastructure
investment in these cities. The resultant inequalities are impacting the political climate with the influence of
minor parties increasing, particularly in regional Australia. This is a logical response to the perception of
political biases.
Townsville is being impacted by synchronised cyclical (mining) and structural (manufacturing) industry decline.
This is being compounded by Federal Government fiscal decisions resulting in the loss of Australian Public
Service jobs within the city. These forces underlie deterioration in confidence, investment, employment,
income and growth. The subsequent economic and demographic effects are cause for government
intervention to allow the region, its industries and residents, to adjust effectively and take advantage of new
opportunities arising from the Indo-Pacific region.
A significant contributing factor to regional decline is energy affordability. This is due in significant part to
successive Australian and state governments failing to balance competing priorities of competition, security,
reliability and emissions targets, without adequate regard to the impacts on affordability and business
viability. Like energy, significantly higher cost of household and business insurance and travel is creating
regional inequality and cost of living pressures for Townsville residents.
The Townsville City Deal is a 15-year commitment focused on improving the lives of Townsville residents
through job creation, economic growth, investment in local infrastructure, a revitalised urban centre, and a
more vibrant and liveable city. It provides an approach for government to work together to deliver
8
transformative outcomes for Townsville . Enacted in December 2016, the Townsville City Deal has spent much
of the ensuing time in understanding the economic climate and the factors impacting it and in developing and
implementing plans to redress these.
Given the economic climate, increasing social disadvantage and the commitment provided under the City Deal,
Townsville and North Queensland are very disappointed with the 2018/19 Federal budget. Townsville received
no additional funding and was not specifically included in any capital works initiatives. Nothing was delivered
under the City Deal.
Governments hold a central role in mitigating disadvantage and redirecting growth to targeted locations. The
City Deal provides the basis to achieving this for Townsville. We look forward to working with the Federal
Government in achieving the objectives of the Townsville City Deal in a timely and tangible way.
8
Townsville City Deal 2016.
Page 21 of 21Regional Inequality in Australia
Submission 118
Federal Government Budget Submission
townsvilleenterprise.com.auRegional Inequality in Australia
Submission 118
FOREWORD
Townsville North Queensland encompasses five Projects and policies that promote economic
major regional centres: Townsville, Charters diversification and growth are key and leading those
Towers, Burdekin, Palm Island and Hinchinbrook. priorities is a major focus on the issues of Water and
The region contributes over $15.94B annually to Energy. For a region abundant with natural resources,
the Queensland economy and is home to nearly it is no longer acceptable for our businesses and
240,000 people. Townsville itself is now Australia’s our community to live with the unsustainable costs
13th largest city and is acknowledged by State and of accessing these basic necessities and this budget
National Governments as the ‘Capital of Northern submission strongly focuses on addressing these two
Australia’. The region has one of the most diverse economic development inhibitors.
economic bases in Australia and enjoys a stunning
natural environment that provides tourism growth Supporting the Water and Energy priorities are a
opportunities and an attractive lifestyle for its package of projects and policies that will drive new
residents. job generation, create economic opportunity and
encourage business and industry to invest.
Key state and national policy documents highlight
the critical importance of Townsville and North Townsville Enterprise is calling on the Federal
Queensland as a driver of national economic Government to commit to the following:
growth and job creation. The signing of Australia’s
first ever City Deal for Townsville is testament to Enabling Infrastructure
the commitment of three levels of Government
to drive economic growth, unlock potential for Water Security for Townsville
the broader region and encourage business and
industry development to help Townsville and North S
ustainable North Queensland Energy Pricing and
Queensland become: Infrastructure
t he economic gateway to Asia and Northern Port City
Australia;
Port of Townsville Channel Capacity Upgrade Project
a
global leader in tropical and marine research and
innovation; T
ownsville Eastern Access Rail Corridor (TEARC) and
the Mount Isa to Townsville Rail Connection
a
prosperous and highly-liveable city for residents
and visitors. Defence
But Townsville and its immediate region has been T
ownsville – Australia’s Northern Defence Deep
doing it tough in recent years and needs targeted Maintenance, Sustainment and Logistics Hub
government investment and policy support to reverse
economic decline. Centre for ADF Amphibious Capability
Investment in projects such as the North Queensland Capital of Northern Australia
Stadium and the Singapore-Australia Comprehensive
Strategic Partnership are welcome initiatives that are T
ownsville population target and relocation of
applauded in the region, but much more needs to be Government bodies
done if the region’s true potential is to be unlocked for
local, state and national benefit. Destination Development
As a community we have all worked hard to secure A
ustralian Tropical Marine and Aquaculture Centre
major investments into projects and, to their credit,
Local, State and Federal Governments have played M
useum of Underwater Art (MOUA)
major roles in the economic recovery of the North
Queensland region. As a result, the region is proud to R
eef HQ Upgrade
boast a multimillion dollar pipeline of projects that is
driving renewed confidence and investment and more Supporting the Regions
than 10,000 jobs have been created in the past 12
months. Use of Macro-Algae to Remediate Sewerage Effluent
Warren’s Gully System Capacity Upgrade
Page 2 of 24Regional Inequality in Australia
Submission 118
TOWNSVILLE NORTH QUEENSLAND
LOCAL CONTEXT
SHORT TERM ECONOMIC SNAPSHOT
UNEMPLOYMENT 5.5% AUSTRALIA
JANUARY 2018
QUEENSLAND
5.8% QUEENSLAND
6.5% 3 MONTH AVERAGE
NOV 17, DEC 17, JAN 18 TOWNSVILLE NORTH
8.4%
QUEENSLAND
Australian Bureau of Statistics
12.5% AUSTRALIA
13.0% QUEENSLAND
TOWNSVILLE
NORTH QUEENSLAND
IN THE NATION 3,000 TOWNSVILLE NORTH
13.6%
9.6%
Australian Bureau of Statistics 3 month moving average QUEENSLAND
Nov 17, Dec 17, Jan 2018
Confidence for the March Quarter 2018
AUSTRALIA – 6.0%
BUSINESS CONFIDENCE
is -1.5 which is the largest ever drop in
Business Confidence over two quarters.
Australian Bureau of Statistics
PVW Partners Quarterly Business Confidence Index
LONG TERM GROWTH FUNDAMENTALS
PORT AIRPORT
229,031 Northern Australia’s most direct trade
gateway to the Asia Pacific and the
1.63 MILLION
Townsville North Queensland has country’s largest sugar, copper,
maintained a population growth lead and zinc export port.
rate of 1.0% over the last 5 years
$10 BILLION The centre of aviation in
ST
O
North Queensland
LM
A
Census 2016
Townsville Airport Dec 2016 – Nov 2017
TOWNSVILLE IS HOME TO Townsville Hospital is the only
3 WORLD CLASS tertiary hospital outside of
an Australian capital city
EDUCATIONAL INSTITUTIONS
$15.946 James Cook University (JCU)*
LEADING
INTERNATIONAL
ENTITIES OF MARINE
Central Queensland University (CQU)
TAFE Queensland North
AND REEF RESEARCH:
Size of the economy James Cook University, Australian
*JCU is ranked in the top 2% of
Institute of Marine Science, Great
REMPLAN Dec 2017 world tertiary institutions
Barrier Reef Marine Park Authority
Page 3 of 24You can also read