Population Ageing DO WE UNDERSTAND AND ACCEPT THE CHALLENGE? - Chartered Accountants

Page created by Diane Zimmerman
 
CONTINUE READING
Population Ageing DO WE UNDERSTAND AND ACCEPT THE CHALLENGE? - Chartered Accountants
TM

PERSPECTIVES ON PROSPERITY

Population Ageing
DO WE UNDERSTAND AND ACCEPT
THE CHALLENGE?

charteredaccountantsanz.com/futureinc
Population Ageing DO WE UNDERSTAND AND ACCEPT THE CHALLENGE? - Chartered Accountants
Chartered Accountants Australia and New Zealand
Chartered Accountants Australia and New Zealand is a professional body comprised of over 120,000 diverse,
talented and financially astute members who utilise their skills every day to make a difference for businesses
the world over.
Members are known for their professional integrity, principled judgment, financial discipline and a forward-
looking approach to business, which contributes to the prosperity of our nations. We focus on the education and
lifelong learning of our members, and engage in advocacy and thought leadership in areas of public interest that
impact the economy and domestic and international markets.
We are a member of the International Federation of Accountants, and are connected globally through the
800,000-strong Global Accounting Alliance and Chartered Accountants Worldwide, which brings together
leading Institutes in Australia, England and Wales, Ireland, New Zealand, Scotland and South Africa to
support and promote over 320,000 Chartered Accountants in more than 180 countries.
We also have a strategic alliance with the Association of Chartered Certified Accountants. The alliance
represents 788,000 current and next generation accounting professionals across 181 countries and is one of the
largest accounting alliances in the world providing the full range of accounting qualifications to students
and business.

About NZIER
NZIER is a non-profit incorporated society and its aim is to be the premier centre of applied economic research
inNew Zealand.
NZIER employs the largest team of economists in New Zealand outside of government. We undertake a
wide range of consulting activities for clients in the public and private sectors. We have clients throughout
New Zealand and Australia, as well as further afield.
We provide regular and comprehensive economic forecasts to our members. Members also benefit from our
long-standing survey of business opinion and other member services.
We undertake and publish research in the national interest, and aim to encourage debate on economic issues
affecting New Zealand.
We are independent of government and any other organisation, and conduct our work on an impartial and
non-ideological basis.
For further information please see our website, www.nzier.org.nz

Copyright © May 2018. Chartered Accountants Australia and New Zealand. All rights reserved.
Chartered Accountants Australia and New Zealand ABN 50 084 642 571. All rights reserved. This document was prepared by Chartered Accountants Australia
and New Zealand. This document contains general information only. Before making any decision or taking any action that may affect you, you should consult a
professional and do your own research. No warranty is given as to the accuracy of the information contained in this document or its suitability for use by you.
Chartered Accountants Australia and New Zealand reserves the right to amend any details at any time. To the fullest extent permitted by law, no liability is accepted
by Chartered Accountants Australia and New Zealand for any statement or opinion, for an error or omission or for any loss whatsoever sustained by any person
who relies on any material in this document. All matters in this document are subject to Chartered Accountants Australia and New Zealand terms and conditions,
available at www.charteredaccountantsanz.com. 563

ISBN number ISBN: 978-0-6482276-2-5
Population Ageing DO WE UNDERSTAND AND ACCEPT THE CHALLENGE? - Chartered Accountants
PERSPECTIVES ON PROSPERITY

Executive Summary
FACING THE FISCAL CHALLENGE             BOTH COUNTRIES HAVE A LONG
FROM AN AGEING POPULATION               HISTORY OF PUBLICLY-FUNDED
Chartered Accountants Australia         PENSIONS: THE ONLY CONSTANT
and New Zealand (CA ANZ)                IS CHANGE
commissioned New Zealand                Public pension systems funded
Institute of Economic Research          from general taxation have
(NZIER) to investigate attitudes to     been in place in both countries
retirement income policies in New       since the beginning of the 19th
Zealand and Australia in light of the   century. Public pension spending is
fiscal consequences of population       relatively low by OECD standards
ageing and both countries’ fraught      but so are poverty rates amongst
history of reforms in this space.       the aged.
Both countries face an ageing           Where the two countries’ regimes
population increasing the cost          differ is in the second-tier
of their Pillar 1 superannuation/       occupational superannuation:
pension schemes. While the main         Australia has compulsory private
focus of the work was looking           superannuation, New Zealand a
forward, we briefly surveyed the        voluntary scheme with automatic
two countries’ experience with          enrolment and a limited opt-out
pension reform to understand            opportunity. Both private schemes,
the starting point. We then             particularly in Australia, have been
explored the fiscal outlook in both     the target of repeated reforms
jurisdictions.                          over more than three decades.
We worked with ResearchNow
to produce the first survey that        DESPITE SIMILAR POPULATION
compares New Zealanders’ and            FORECASTS THE FISCAL
Australians’ attitudes to retirement    OUTLOOK IS QUITE DIFFERENT
income and their preferences on         Both New Zealand and Australia
how retirement incomes policies         face similar ageing populations but
should be reformed.                     the future settings for retirement
                                        policy, and their fiscal outlooks, are
                                        different.
                                        In New Zealand, the National
                                        Government under John Key and
                                        now the Labour Government under

charteredaccountantsanz.com/futureinc
Population Ageing DO WE UNDERSTAND AND ACCEPT THE CHALLENGE? - Chartered Accountants
Jacinda Ardern have pledged            In New Zealand, with the notable
to retain the age of eligibility for   exception of the short-lived
New Zealand Super at age 65.           changes announced by the Bill
In Australia, an increase to 67 is     English administration, there
underway with a planned further        have been no significant changes
increase to 70.                        announced to retirement income
                                       policy since the introduction of
As a result, the medium term fiscal
                                       KiwiSaver and moving to part-
impact of population ageing is
                                       funding of the NZ Super Fund in
quite different, with the pension
                                       the 2000s.
cost to GDP ratio in New Zealand
projected to rise by 60% in 40
years. In Australia by contrast, the   HIGH AWARENESS OF NEW
corresponding increase is around       ZEALAND SUPER AND THE
25% under current policies and         AUSTRALIAN AGE PENSION
a small decline if the announced       BUT LESS OF THE DETAILED
entitlement age increase to 70 is      OPERATION
enacted.                               Our survey shows around half of
                                       Australians and New Zealanders
NEW ZEALAND AND AUSTRALIA              are ‘thinking somewhat’ about
HAVE OPTED TO TAKE DIFFERENT           retirement planning and
APPROACHES TO THE FISCAL               awareness of the Age Pension and
CHALLENGE                              New Zealand Super is high (92%
                                       in Australia, 87% in New Zealand).
Across the OECD around half the
                                       For example, in both countries, four
governments have undertaken
                                       in five people know that almost
major pension reform. In Australia,
                                       anyone aged over 65 can receive
it is widely accepted that older
                                       the Age Pension/New Zealand
citizens suffer from reform fatigue
                                       Super payments.
and are sick of constant change.
There are strongly held views          However, respondents are less
about increases in the minimum         familiar with the level of payment,
pension age, protection of the         how the schemes were funded
family home from asset testing,        and in the case of New Zealand
and that the Age Pension is an         whether income and asset testing
entitlement.                           is applied.
Population Ageing DO WE UNDERSTAND AND ACCEPT THE CHALLENGE? - Chartered Accountants
REMARKABLE SIMILARITIES                89%, respectively for the over
IN NEW ZEALANDERS’ AND                 65s. Nonetheless there is still a
AUSTRALIANS’ ATTITUDES TO              significant minority of younger
RETIREMENT INCOMES POLICIES            people who believe the scheme will
Across a range of questions there      continue.
were remarkable similarities           Overall New Zealanders were more
between New Zealanders’ and            confident than Australians about
Australians’ attitudes. This was       policy stability, which presumably
quite striking given how the two       reflects the frequency of changes
regimes have diverged over time        to the policy regime in Australia
with very different approaches         compared to New Zealand.
to Pillar 2 and income and asset
testing in Pillar 1. For example, at   WE WILL NEED MORE THAN
least two-thirds of Australians        PUBLIC EDUCATION TO CHANGE
and almost three-quarters of New       THE DEBATE
Zealanders are aware that New
                                       The survey split respondents into a
Zealand Super/Age Pension will
                                       group that received supplementary
cost more in the future.
                                       information before answering
                                       the questions on their policy
YOUNG PEOPLE LESS LIKELY
                                       preferences and those that didn’t.
TO BELIEVE THAT THE AGE
                                       Yet there was no real difference
PENSION/NEW ZEALAND SUPER
                                       between the answers of the two
WILL EXIST IN ITS CURRENT FORM
                                       groups.
WHEN THEY RETIRE
Unsurprisingly younger people’s        The lack of daylight between
responses differed from those          information and non-information
of currently retired regarding         responses suggests public
the continuity of the scheme.          education on population ageing
33% of younger Australians             is unlikely on its own to move the
survey respondents and 39%             debate forward.
of New Zealanderssaid that the
scheme will exist in its current       LITTLE CONSENSUS ON
form compared to 77% and               PREFERRED POLICY OPTIONS TO
                                       MANAGE RISING COSTS…
                                       Faced with rising costs both New
                                       Zealanders and Australians were
                                       reluctant to contemplate major
Population Ageing DO WE UNDERSTAND AND ACCEPT THE CHALLENGE? - Chartered Accountants
changes to the Pillar 1 scheme       THE INTERGENERATIONAL
and were divided about tax           COMPACT IS INTACT
increases.                           We found little evidence of a
The strongest opposition is          distinct generational divide in the
to reductions in the amount          views on the policy options for
paid across the board. There         dealing with the increased costs of
is mixed support for increasing      New Zealand Super and the Age
the age of entitlement,              Pension. This is consistent with a
amending how adjustments             range of studies which found weak
occur (by linking to prices rather   effects or no evidence of self-
than wages) or pre-funding           interested responses. Among the
through increased current            young there was strong support
taxes.                               for the continuation of the current
                                     policy settings even though the
… ALTHOUGH MEANS TESTING             aged benefitted at their expense.
IS THE OPTION WITH THE               For example, support for increasing
HIGHEST SUPPORT                      the age or lowering the amount
                                     paid was lowest amongst 25-54
The least unpopular option
                                     year olds and highest amongst
with New Zealanders and
                                     those 65+.
Australians was the use of
income and asset testing             Age did have some influence
to determine how much                on policy preferences however.
government should pay to NZ          For example, amongst
super/Age pension recipients.        New Zealanders support for
However, respondents were            continuing New Zealand Super at a
strongly against the family          universal amount (with no income
home being used in means             or assets testing) increased very
testing.                             gradually with age: 25-34 years
                                     (39%), 45-55 (45%), 55-64 (64%),
The depth of support for
                                     over 65 (78%).
means testing is doubtful
in New Zealand at least, as
the Treasury study (Au et al
(2015)), which used a different
approach, found limited support
for it.
Population Ageing DO WE UNDERSTAND AND ACCEPT THE CHALLENGE? - Chartered Accountants
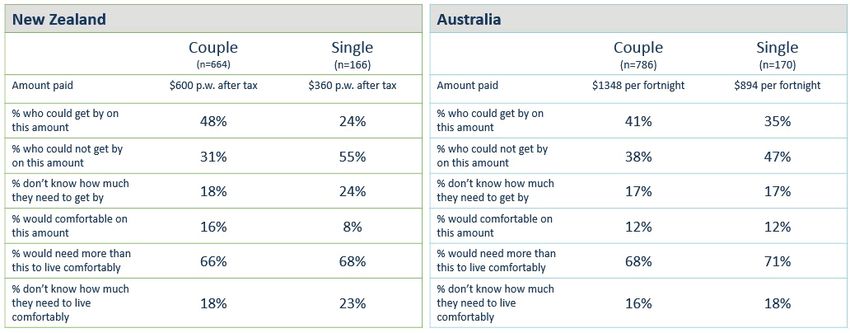
OUR SURVEY INDICATES THAT           STRONG POLITICAL AND
POLITICIANS ARE BETWEEN             TECHNOCRATIC LEADERSHIP
A ROCK AND A HARD PLACE:            CRUCIAL FOR PENSION REFORM
THE PUBLIC RESISTS CHANGES          Key supporting conditions likely to
DESPITE KNOWING IT WILL COST        sustain pension reform include an
SIGNIFICANTLY MORE IN THE           electoral mandate, government
FUTURE                              leadership and cohesion, and
Politicians face the problem that   persistence. These need to
there is no strong support for      be accompanied by research
any one option for reform. The      and analysis and effective
public are resistant to changes     communication. Both New Zealand
and divided over the prospect of    and Australian governments have
an increase in taxes to fund the    demonstrated in the past the
inevitable increase in costs.       ability to drive through successful
                                    reform.
The public’s dominant preference
is that the status quo persists     We trust this study contributes
and that the government pension     supporting the momentum by
should be provided universally,     providing the research and analysis
without a means-test in New         about what Australians and New
Zealand and with continued means    Zealanders believe and want from
testing in Australia.               the public pension system.
Opposition to making changes,
such as increasing the age and
changing the basis of indexation,
reduced if the policy changes
are phased in over 10-20 years.
Younger and older cohorts were
more open to considering changes
perhaps because they either had
time to adjust to new rules or
because any changes would not
impact them.
Population Ageing DO WE UNDERSTAND AND ACCEPT THE CHALLENGE? - Chartered Accountants
PERSPECTIVES ON PROSPERITY

                      Contents
       01             Our approach                       9           Policy options for dealing with   31
                                                                     the increased cost

       02             A history of pension
                      policy
                                                        10

                                                               05    The political economy of
                                                                     pension reform           34
                      The current systems                12

                                                               06
                                                                     Reflections on
       03             The common fiscal
                      challenge                         14
                                                                     trans-Tasman experiences
                                                                     with retirement income
                      Demographic change                 16          reform                 39
                      On average, we are living a
                                                                     What are the similarities and
                      lot longer                         16
                                                                     differences between New Zealand
                      And families are having                        and Australia?                    41
                      fewer children                     17
                                                                     What is blocking discussion?      42
                      Sizing up the challenge            19
                                                                     What can clear the roadblocks?    43
                      Crisis, what crisis?               22
                                                                     Australia                         45

       04             Survey results
                      New survey comparing
                                                        25
                                                                     New Zealand                       48

                      New Zealand attitudes
                      across time with those                         Conclusion                        52
                      of Australians                     27          Appendix A                        45

                      Thinking and planning for                      Appendix B                        54
                      retirement                         28          Appendix C                        57
                      Public understanding of                        Appendix D                        58
                      New Zealand Super or the
                                                                     Appendix E                        61
                      Age Pension                        29

                      Understanding of the increased      30
                      cost retirement incomeless policies

                                                                    charteredaccountantsanz.com/futureinc
Population Ageing DO WE UNDERSTAND AND ACCEPT THE CHALLENGE? - Chartered Accountants
1. Our approach
The project involved four overlapping phases:
    •   Phase 1: The literature scan focused on the existing research on
        the attitudes of New Zealanders and Australians to retirement
        income policy. The literature scan identified an unpublished
        survey commissioned by the New Zealand Retirement
        Commissioner and undertaken by Colmar Brunton in 2014
        that investigated New Zealanders’ attitudes in some detail.
        No corresponding information was available for Australia on the
        Age Pension. This phase also included a brief scan looking back
        to draw out the lessons learnt from previous retirement policy
        reform attempts in both jurisdictions and the findings are
        discussed in Section 2.
    •   Phase 2: The modelling stream focused on a comparison of
        existing modelling undertaken by the Australian Treasury and
        New Zealand Treasury discussed in Section 3.
    •   Phase 3: The attitudinal research phase involved undertaking
        a survey that compared the attitudes of Australians and
        New Zealanders to retirement income policies and their policy
        preferences. We used the 2014 Colmar Brunton survey as a
        base. We worked with ResearchNow to repeat this survey for
        New Zealand as well as undertake a similar survey in Australia.
        The headline results are discussed in Section 4.
    •   Phase 4: Articulation of the research findings involved pulling
        together the modelling and the attitudinal research into this
        report.
At the conclusion of each key phase we discussed of initial findings with
an experts group consisting of Ross Guest, Kirsten MacDonald and
Malcolm Menzies.

                                                                            future[inc]
                                                                                          9
02
        A history of
        pension policy
                        Australian and New Zealand
                        governments have both
                        provided publicly-funded
                        pensions for retired people for
                        over a century.

10   Population Ageing
                Aging ––Do
                         Dowe
                            weunderstand
                               understandand
                                          andaccept
                                              acceptthe
                                                     thechallenge?
                                                         challenge?
future[inc]
              11
2. A history of pension policy
                        2.      Aandhistory
                        Australian                     of pension
                                      New Zealand governments                   policy
                                                                   have both provided
                        funded pensions for retired people for over a century.
                                                                                      publicly-

                        In 1898, New
                        Australian   andZealand   became
                                          New Zealand         one of the first
                                                           governments         havecountries  in the world
                                                                                      both provided          to
                                                                                                       publicly-
                        introduce   a state-funded
                        funded pensions     for retired age  pension.
                                                          people  for overThe initial modest pension was
                                                                                a century.
                        subject to a means, assets and character test. It was non-contributory
                        In 1898, New Zealand became one of the first countries in the world to
                        and paid for entirely out of current revenues.
                        introduce a state-funded age pension. The initial modest pension was
                        At  the Federal
                        subject          level, assets
                                 to a means,    a means-tested,
                                                         and character  flat-rate   aged
                                                                             test. It waspension    was
                                                                                           non-contributory
                        introduced
                        and paid forinentirely
                                        Australiaoutinof
                                                       July  1909,revenues.
                                                         current      superseding State age pension
                        schemes which had been introduced in New South Wales (1900), Victoria
                        At the Federal level, a means-tested, flat-rate aged pension was
                        (1900) and Queensland (1908). Almost uniquely within the OECD, New
                        introduced in Australia in July 1909, superseding State age pension
                        Zealand and Australia continue to fund their state pension systems via
                        schemes which had been introduced in New South Wales (1900), Victoria
                        general taxation, rather than use some form of separate tax or
                        (1900) and Queensland (1908). Almost              uniquely within the OECD, New
                        contribution system. (OECD 2017b).1, 2
                        Zealand and Australia continue to fund their state pension systems via
                        In parallel,
                        general      privaterather
                                  taxation,  provisionthanofuse
                                                             retirement
                                                                some form    income    via tax-preferred
                                                                                 of separate    tax or      and
                        increasingly   regulated   employment-based
                        contribution system. (OECD 2017b).         1, 2
                                                                               superannuation     has   also
                        been common, although in both countries, coverage was largely
                        In parallel, private provision of retirement income via tax-preferred and
                        restricted to higher-paid private sector employees and public servants
                        increasingly regulated employment-based superannuation has also
                        (Australian Prudential Regulation Authority (2007) and Preston (2008)).
                        been common, although in both countries, coverage was largely
                        Tax concessions have been progressively reduced and otherwise
                        restricted to higher-paid private sector employees and public servants
                        reformed. Both countries operate a Taxed, Taxed, Exempt (TTE) tax
                        (Australian   Prudential Regulation Authority (2007) and Preston (2008)).
                        system.3
                        Tax concessions have been progressively reduced and otherwise
                        reformed. Both countries operate a Taxed, Taxed, Exempt (TTE) tax
                        The current systems
                        system.3

                        Using the World Bank’s “Three Pillar” classification system,4 Table 1 sets
                        The current systems
                        out a high-level summary of the current retirement income systems in
                        Australia and New Zealand.
                        Using the World Bank’s “Three Pillar” classification system,4 Table 1 sets
                        out a high-level summary of the current retirement income systems in
                        Australia and New Zealand.
                           1
                               Denmark is the only other OECD member without a dedicated social security tax of some sort. Ireland operates a taxpayer-
                               funded, means-tested pension scheme as well as a scheme based on mandatory employee and employer contributions.
                           2
                               Both Australia and New Zealand at various times have had an earmarked tax to fund the Pillar 1 scheme which led to the
                           1   widespread belief in a separate ‘super fund’. In fact, Australia did have a notional super fund that was in practice merely an
                               Denmark is the only other OECD member without a dedicated social security tax of some sort. Ireland operates a taxpayer-
                               accounting device until its abolition in 1985. ‘New Zealand’s Pillar 1 scheme never had a separate fund until the NZ Super
                               funded, means-tested pension scheme as well as a scheme based on mandatory employee and employer contributions.
                               fund was established in 2001.
                           2
                           3   Both Australia and New Zealand at various times have had an earmarked tax to fund the Pillar 1 scheme which led to the
                               Under TTE or “income tax” treatment, retirement savings are taxed like other savings vehicles like a bank account. Under
                               widespread belief in a separate ‘super fund’. In fact, Australia did have a notional super fund that was in practice merely an
                               TTE, contributions to schemes are made from taxed income (no deductions), the funds are taxed and withdrawals are
                               accounting device until its abolition in 1985. ‘New Zealand’s Pillar 1 scheme never had a separate fund until the NZ Super
                               exempt from tax. The current New Zealand system is close to pure TTE, while Australia provides capped deductions for
                               fund was established in 2001.
                               contributions and superannuation funds are taxed at a concessional rate. Australia, New Zealand and Turkey are the only
                           3
                               Undercountries
                               OECD    TTE or “income     tax” atreatment,
                                                  to operate      TTE system.retirement
                                                                                 While theresavings  are taxed
                                                                                                is a wide       like other
                                                                                                          variation,  mostsavings     vehicles like
                                                                                                                             OECD members           a bank
                                                                                                                                                 operate  anaccount.    Under
                                                                                                                                                              EET system,
                               TTE, contributions
                               under                 to schemes are
                                       which both contributions         made
                                                                      and      fromontaxed
                                                                           returns            incomeare
                                                                                        investment     (noexempted
                                                                                                            deductions),
                                                                                                                       fromthetaxation
                                                                                                                                funds are    taxed
                                                                                                                                         while     and withdrawals
                                                                                                                                                benefits  are treated are
                                                                                                                                                                        as
                               exempt income
                               taxable   from tax.   Thewithdrawal.
                                                  upon    current NewSee  Zealand
                                                                             OECD system
                                                                                    (2015). is close to pure TTE, while Australia provides capped deductions for
                           4   contributions and superannuation funds are taxed at a concessional rate. Australia, New Zealand and Turkey are the only
                               In its 1994 report “Averting the Old Age Crisis”, the World Bank recommended that governments develop a national
                               OECD countries to operate a TTE system. While there is a wide variation, most OECD members operate an EET system,
                               retirement income system based on three “pillars”: a publicly managed system with mandatory participation and the limited
                               under which both contributions and returns on investment are exempted from taxation while benefits are treated as
                               goal of reducing poverty among the old; a privately managed, mandatory savings system and voluntary saving. Subsequent
                               taxable income upon withdrawal. See OECD (2015).
                               work by the Bank has seen their recommended system expand to include five pillars: a non-contributory “zero pillar”
                           4
                               In its 1994atreport
                               targeted             “Averting
                                              poverty            the aOld
                                                       alleviation;       Age Crisis”,
                                                                       mandatory        thepillar”
                                                                                     “first  Worldwith
                                                                                                     Bankcontributions
                                                                                                            recommended      thattogovernments
                                                                                                                         linked      earnings with develop   a national
                                                                                                                                                     the objective    of
                               retirementsome
                               replacing     income   system
                                                  portion      based on
                                                           of lifetime     three “pillars”:income;
                                                                        pre-retirement        a publicly managed system
                                                                                                      a mandatory    “secondwith    mandatory
                                                                                                                                pillar”           participation
                                                                                                                                        of individual            and the limited
                                                                                                                                                      savings accounts     (i.e.
                               goal  of reducing
                               defined             poverty
                                         contribution        among
                                                        plans);       the old; aflexible
                                                                  a voluntary,    privately
                                                                                          andmanaged,    mandatory
                                                                                               discretionary           savingsand
                                                                                                               “third-pillar”;   system   and voluntary
                                                                                                                                     a non-financial       saving.
                                                                                                                                                      “fourth       Subsequent
                                                                                                                                                                pillar” which
                               work   by the
                               includes        Bank
                                          access  tohas  seen their
                                                     informal         recommended
                                                                support   (such as familysystem   expand
                                                                                             support),     to include
                                                                                                        other  formal five  pillars:
                                                                                                                       social        a non-contributory
                                                                                                                               programs     (such as health“zero
                                                                                                                                                             care),pillar”
                                                                                                                                                                     and other
                               targeted
                               individualatfinancial
                                              povertyand
                                                       alleviation;  a mandatory
                                                           non-financial             “firstas
                                                                            assets (such    pillar”
                                                                                               home with contributions
                                                                                                      ownership).        linked Bank
                                                                                                                    See World     to earnings
                                                                                                                                        (2008).with the objective of
                               replacing some portion of lifetime pre-retirement income; a mandatory “second pillar” of individual savings accounts (i.e.
                               defined contribution plans); a voluntary, flexible and discretionary “third-pillar”; and a non-financial “fourth pillar” which
                               includes access to informal support (such as family support), other formal social programs (such as health care), and other
                               individual financial and non-financial assets (such as home ownership). See World Bank (2008).

12   Population Ageing – Do we understand and accept the challenge?
Table 1 Different approaches to retirement incomes

 Feature                     Australia                                           New Zealand
 Pillar 1                    Means-tested public age pension,                    Universal public age pension,
                             financed via general revenue.                       financed via general revenue.
                             Pension included in taxable income,                 Pension included in taxable income
                             but may be eliminated by tax offsets                at the marginal rate (so with a
                             available to seniors.                               progressive tax system there is a very
                                                                                 mild form of income testing).
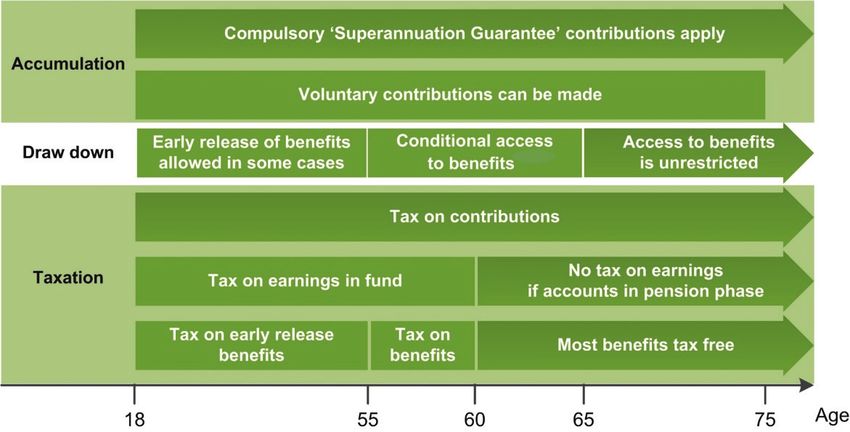
 Pillar 2                    Compulsory private superannuation,                  KiwiSaver (but the scheme is a hybrid
                             via the Superannuation Guarantee                    Pillar 2 and Pillar 3 scheme, because
                             system.                                             membership is optional, but on an
                                                                                 opt-out basis).5
 Pillar 3                    Voluntary private superannuation.                   Voluntary private retirement
                                                                                 schemes separate from KiwiSaver.

Source: Guest (2013)

These current systems are the result of considerable policy reform
over the last 30 to 40 years on both sides of the Tasman, in both
retirement incomes specifically, but across all economic policy in general.
In Australia, much reform has focused around the Pillar 2 system of
workplace-based occupational superannuation, although there have
been significant changes to the taxation of both Pillars 2 and 3. In
New Zealand, by comparison, there has been much more focus
on Pillar 1.

Further information – we provide further historical information about
New Zealand and Australia’s pension systems in Appendix A.

   5
        All new employees are automatically enrolled with their preferred KiwiSaver provider or the provider of their employer (or
        with a default provider allocated by Inland Revenue if their employer has not selected a provider), with minimum employee
        contributions of 3% and employer contributions of 3%. Members can either opt-out of the scheme or elect to be a member
        of any other registered provider’s scheme. A government subsidy, in the form of a tax credit paid to the fund, equal to 50
        cents for every dollar of member contribution annually up to a maximum payment of $521.43, is paid into each fund.
        Members can elect to contribute either 3%, 4% or 8% of their pay. Member and employer contributions are made via the
        PAYE tax system.

                                                                                                                                     future[inc]
                                                                                                                                                   13
03
        The common
        fiscal challenge
                        While more New Zealanders
                        and Australians are living into
                        old and very old age, at the
                        other end of the life-course,
                        fewer children are being born.

14   Population Ageing
                Aging ––Do
                         Dowe
                            weunderstand
                               understandand
                                          andaccept
                                              acceptthe
                                                     thechallenge?
                                                         challenge?
future[inc]
              15
3. The common fiscal
                           challenge
                        3.1. Demographic change
                        Demographic change is projected to increase future spending on
                        retirement incomes in Australia and New Zealand. That Australia, New
                        Zealand and, indeed, most of the western world, is going through a
                        period of demographic change is clear to see.
                        Driving this change is a combination of:
                               •       reductions in mortality rates across the whole age spectrum, but
                                       especially infant mortality, and
                               •       a reduction in fertility, which is the combined effect of both a fall
                                       in family size and a delay in the timing of child-bearing: women
                                       are having fewer children, later in life.

                        3.2. On average, we are living a lot longer
                        The reduction in mortality can be illustrated using data from life tables
                        produced by the Australian Bureau of Statistics and Statistics New
                        Zealand. In Figure 1, we combine the actual mortality experience of
                        people born in 1876 (called a cohort life table) with that occurring across
                        the whole population in 2012 (called a period life table)6 to show the
                        pattern of survivorship over time: what proportion of a group of people
                        (in this case 100,000) live to a given age.
                        The 1876 data shows what happened to a cohort of 100,000 people
                        born in 1876. The 2012 data shows what would happen to a similar
                        cohort of 100,000 people if they experienced the age-specific mortalities
                        that applied across the whole population in that year. This is not a
                        prediction of what will happen to a cohort born in 2012, since that group
                        will most likely continue to experience improvement in mortality. It does
                        however, illustrate the effects of the current mortality rate compared to
                        those in the past.
                        In the context of this report, a key point is that the number of people
                        living to the age of eligibility for government-funded pensions, is set to
                        increase significantly. For people born in 1876, only 47.4% lived to age
                        65. For a cohort experiencing current mortality, a staggering 87.5% will
                        live to 65.

                           6
                                   Cohort life tables have the advantage of showing the actual experience of a group of people. The disadvantage is that they
                                   require data over many years, theoretically until the death of the last survivor. Period life tables, on the other hand, are
                                   based on the experience of the population during a specific period of time. The data presented below for the 2012 period is
                                   a hypothetical survivorship assuming people experience the age-specific death rates of that period over their lifetime.

16   Population Ageing – Do we understand and accept the challenge?
Living longer does not necessarily mean living with increased disability.
Australian data suggests increased life expectancy does not mean that
rates or level of disability will increase (Negline 2017). New Zealand data
points to a ‘good news bad news’ story. “We may be living longer, and
living longer in good health, but we are also living longer in poor health”
(Ministry of Health, 2016, p. ix).7

Figure 1 New Zealand men are living much longer
Number surviving to a given age

 100,000

     90,000

     80,000

     70,000

     60,000

     50,000

     40,000

     30,000

     20,000

     10,000

          0
              0         10         20         30         40         50         60         70         80          90        100

                                                          1876                2012

Source: Statistics New Zealand

3.3. And families are having fewer children
While more New Zealanders and Australians are living into old and very
old age, at the other end of the life-course, fewer children are being
born.
There are two effects at work here: a delay in starting families and a fall
in the size of families.
These two effects are shown in Figure 2 (New Zealand) and Figure 3
(Australia), which show the total fertility rate (the number of children a
woman can be expected to have) and age-specific rates, by five-year
bands from 20-14 to 35-39.

 7
         To elaborate “New Zealanders are living longer, and are living longer in good health (i.e. both life expectancy and health
         expectancy are increasing). Health loss, measured in DALYs, is declining by an estimated 1.2% per year, once adjusted for
         changes in population size and age structure – a major achievement for the health and wider social sectors. Yet because the
         population is growing and ageing, the absolute number of DALYs is still increasing. This finding suggests that improvements
         in health do not necessarily reduce health care expenditure.” (2016 ibid).

                                                                                                                                       future[inc]
                                                                                                                                                     17
In New Zealand, while the total has been reasonably stable, the age-
                        specific rates for 30-34 and 35-39 women have increased, while those
                        for younger groups have fallen.
                        Figure 2 New Zealand women are having fewer children, later in life
                        Total (per capita) and age-specific (per 1,000) fertility rates, New Zealand

                          200                                                                                             3
                          180
                          160
                          140
                                                                                                                          2
                          120
                          100
                           80
                                                                                                                          1
                           60
                           40
                           20
                            0                                                                                             0
                             1975      1980       1985       1990     1995         2000     2005     2010        2015

                                        20-24            25-29           30-34             35-39         Total (RHS)

                        Source: Statistics New Zealand

                        In Australia, although the fertility rates themselves are slightly different,
                        the pattern is the same.

                        Figure 3 Australian women are also delaying child bearing
                        Total (per capita) and age-specific (per 1,000) fertility rates, Australia

                          200                                                                                             3
                          180
                          160
                          140
                                                                                                                          2
                          120
                          100
                           80
                                                                                                                          1
                           60
                           40
                           20
                            0                                                                                             0
                             1975      1980       1985        1990     1995         2000      2005     2010        2015

                                       20 - 24           25 - 29         30 - 34           35 - 39          Total (RHS)

                        Source: Australian Bureau of Statistics

18   Population Ageing – Do we understand and accept the challenge?
3.4. Sizing up the challenge
An ageing population raises challenges to both fiscal sustainability and
fiscal resilience. Gill (2012, p7) defines fiscal sustainability as “the ability
to predictably raise sufficient revenue over time to meet financial
commitments and sustain a certain level of services”.
Measuring sustainability requires making judgements about political
acceptability of raising taxes and cutting spending, and the public
legitimacy of government rather than making purely technical
assessments. Fiscal resilience refers to the ability to withstand shocks
and avoid unnecessary risks.
Forecasts of how pension and health spending will change over the long
term (40 to 50 years) provide a starting point for assessing fiscal
sustainability and fiscal resilience. The comparison in this section is
based on the ‘2015 Intergenerational Report – Australia in 2055’8 (IGR
Australia) with the Long-Term Fiscal Model 22 November 2016’9 (LTFM
New Zealand). Unless otherwise stated these are the data sources used
for comparison in this section.
The IGR Australia is a narrative report with supporting data for charts
and tables. Results are presented as ratios of spending to GDP with
current and proposed policy change for pension eligibility age. In
contrast, the LTFM New Zealand is a detailed spreadsheet model that
projects current policy settings forward. An alternative fiscal policy
setting ‘Stabilise Net Debt’ is included but this does not alter the eligibility
age for New Zealand Super.
For our comparison, we have focused on the modelling of forecast
pension and aged care health spending and real Gross Domestic
Product (GDP) as this is the approach used in the IGR Australia and
there is insufficient published data to construct other measures.
Appendix B contains a discussion on the model structure as well as the
uncertainty about the results. Below is our comment on the key model
results.

3.4.1. Model results – retirement income
In addition to health spending as a share of GDP, the key challenge is to
forecast public pensions under a ‘no policy change’ assumption. The
LTFM New Zealand estimate of gross10 pension costs assume the
eligibility age remains constant. The IGR Australia report included two
policy options for the Age Pension:11

   8
        Available at https://treasury.gov.au/publication/2015-intergenerational-report/
   9
        Available at http://www.treasury.govt.nz/government/longterm/fiscalmodel
   10
        The LTFM New Zealand includes assumptions includes ‘gross’ and ‘net’ per person payments but only the gross rate is used
        to forecast total New Zealand Superannuation payments.
   11
        The Age Pension is a means-tested payment for people over 65. From 1 July 2017, the qualifying age for the Age Pension will
        gradually increase to 67 by 1 July 2023.

                                                                                                                                      future[inc]
                                                                                                                                                    19
•
                                current policy to increase the eligibility age gradually from 65 (in
                                •
                                current
                                2017) topolicy
                                            67 byto    increase
                                                    1 July   2023the eligibility age gradually from 65 (in
                                2017) to 67 by 1 July 2023
                             •  proposed policy to increase the age gradually from 65 (in 2017)
                             •  proposed
                                to 70 by 1 Julypolicy2035.
                                                      to increase the age gradually from 65 (in 2017)
                                to 70 by 1 July 2035.
                        The proposed increase in eligibility age has not been implemented but is
                        The  proposed
                        included in theincrease
                                          followinginchart
                                                        eligibility age has
                                                              to indicate       not
                                                                              the    been implemented
                                                                                   change                    but is
                                                                                            in eligibility age
                        included
                        required in
                                 to the   following
                                     stabilise        chart
                                                 pension      to indicate
                                                            payments      asthe    change in of
                                                                               a proportion    eligibility
                                                                                                  GDP. age
                        required to stabilise pension payments as a proportion of GDP.
                        On current Pillar 1 policy settings, gross New Zealand Super is forecast to
                        On  current
                        increase fromPillar  1 policy
                                          4.8%  of GDPsettings,
                                                          in 2015  gross  New
                                                                     to 7.5%    ofZealand
                                                                                   GDP by Super
                                                                                             205512is– forecast
                                                                                                         an       to
                        increase in
                                 from     4.8%  of  GDP   in 2015    to 7.5%    of GDP   by
                                    share of GDP of almost 60%. In contrast Australia’s Age
                                                                           13
                                                                                             2055   12
                                                                                                       – an
                        increasewill
                        Pension  in share
                                      increaseof GDP
                                                  fromof2.9%
                                                           almost    60%.in
                                                                of GDP
                                                                           13
                                                                              In contrast
                                                                               2015  to 3.9%Australia’s
                                                                                               of GDP by   Age
                                                                                                            2055
                        Pension  will increase
                        – an increase    in sharefrom    2.9%
                                                    of GDP    ofof  GDP
                                                                  just    in 2015
                                                                       under     25%.to
                                                                                      14
                                                                                         3.9% of GDP by 2055
                        – an increase in share of GDP of just under 25%.14

                        Figure 4 Forecast pension payments
                        Figure
                        NZ Super4and
                                  Forecast
                                     Australianpension  payments
                                                Age Pension (current and proposed15) as a proportion of GDP
                        NZ Super and Australian Age Pension (current and proposed15) as a proportion of GDP
                         10.0%
                         10.0%
                          9.0%
                          9.0%
                          8.0%
                          8.0%
                          7.0%
                          7.0%
                          6.0%
                          6.0%
                          5.0%
                          5.0%
                          4.0%
                          4.0%
                          3.0%
                          3.0%
                          2.0%
                          2.0%
                          1.0%
                          1.0%
                          0.0%
                          0.0%                  2015                    2025            2035                         2045             2055
                                                2015                    2025            2035                         2045             2055
                                                 NZ Super              Age pension (current)                   Age pension (proposed)
                                                 NZ Super              Age pension (current)                   Age pension (proposed)
                        Source: NZIER
                        Source: NZIER

                        Two key drivers of the difference between the forecast change in
                        Two   key drivers
                        retirement        of the
                                     pensions  asdifference between
                                                  a percentage       thefor
                                                                of GDP   forecast change
                                                                            Australia     in
                                                                                      and New
                        retirement   pensions  as a  percentage of GDP  for Australia and
                        Zealand do not relate to differences in retirement income policy. New
                        Zealand do not relate to differences in retirement income policy.

                           12
                                    Source: Long-Term Fiscal Model’ downloaded from http://www.treasury.govt.nz/government/longterm/fiscalmodel 17 Dec
                           12       2017.
                                    Source: Long-Term Fiscal Model’ downloaded from http://www.treasury.govt.nz/government/longterm/fiscalmodel 17 Dec
                           13       2017.
                                    The  New Zealand Superannuation Fund Contribution Rate Model (14 Dec 2017) (available at
                           13       http://www.treasury.govt.nz/government/assets/nzsf/contributionratemodel)
                                    The New Zealand Superannuation Fund Contribution Rate Model (14 Dec 2017)forecasts
                                                                                                               (availablenet
                                                                                                                          at New Zealand Superannuation
                                    to 4.12% of GDP in 2018 and 6.4% by 2055 and increase of 55%.
                                    http://www.treasury.govt.nz/government/assets/nzsf/contributionratemodel) forecasts net New Zealand Superannuation
                           14       to 4.12%  of GDP
                                    Guest  (2013 p27)in  2018 and 6.4%
                                                       comparison   of thebyoverall
                                                                             2055 and   increase
                                                                                    effect         of 55%.
                                                                                           of Pillars 1 and 2 combined concluded “NZS is fiscally more expensive than
                           14       Australia’s
                                    Guest  (2013Age
                                                 p27)Pension  but KiwiSaver
                                                       comparison            is cheaper.
                                                                    of the overall  effectIn
                                                                                           ofnet  terms
                                                                                              Pillars    New
                                                                                                      1 and    Zealand’s retirement
                                                                                                            2 combined               income
                                                                                                                         concluded “NZS        systemmore
                                                                                                                                           is fiscally   is currently more
                                                                                                                                                               expensive  than
                                    expensive
                                    Australia’s by
                                                Ageabout  1 per
                                                     Pension    cent
                                                              but     of GDP.isThe
                                                                  KiwiSaver        gap between
                                                                                cheaper.           the cost
                                                                                          In net terms   Newof Zealand’s
                                                                                                               NZS and Australia’s
                                                                                                                         retirementAge   Pension
                                                                                                                                     income         will is
                                                                                                                                               system    grow,  but will
                                                                                                                                                            currently    be
                                                                                                                                                                      more
                                    offset by lower  relative cost of KiwiSaver  due  to tax free  super pay  outs available at an earlier age   in Australia
                                    expensive by about 1 per cent of GDP. The gap between the cost of NZS and Australia’s Age Pension will grow, but will be   (age 60).”
                           15       offsetpension
                                            by lower  relative is
                                                               cost of KiwiSaver  due to tax
                                    ‘Age            (current)'    based on the eligibility agefree super pay
                                                                                               increasing     outs
                                                                                                          to 67 by available
                                                                                                                   2023. ‘Ageat pension
                                                                                                                                an earlier age in Australia
                                                                                                                                         (proposed)'        (age
                                                                                                                                                     is based  on60).”
                                                                                                                                                                  the
                           15       eligibility
                                    ‘Age pension (current)' is based on the eligibility age increasing to 67 by 2023. ‘Age pension (proposed)' is based on but
                                                age increasing  to 70 by 2035. This ‘Age   pension  (proposed)' policy was  proposed   in the 2014-2015   Budget  the was
                                    not  implemented.
                                    eligibility age increasing to 70 by 2035. This ‘Age pension (proposed)' policy was proposed in the 2014-2015 Budget but was
                                    not implemented.

20 Population Ageing – Do we understand and accept the challenge?
Rather they are assumptions about the forecast rate of economic
growth and the ageing of the population. The IGR Australia forecasts
assume:

     •    a faster rate of economic growth than the LTFM New Zealand so
          that by 2055 the ratio of Australia’s GDP to New Zealand’s GDP
          is forecast to increase by 30%
     •    a younger population than is forecast for New Zealand – the
          proportion of adults ‘aged 65 and over’ are almost equal for
          Australia and New Zealand at the beginning of the comparison
          period (2015) but for most of the forecast period (2025 to 2055)
          the proportion of adults ‘aged 65 and over’ in Australia varies
          between 87% and 92% of the proportion for New Zealand.
Table 2 shows the individual and combined effects of the differences
between the forecast assumptions on the forecast ratio retirement
pension payments to GDP. It shows the effects of applying the Australian
forecast assumptions about GDP and population growth to the New
Zealand Treasury forecasts.

Table 2 Effect of key assumptions on forecasts
Retirement income to GDP ratio based on Australian growth and population assumptions

 Retirement income/GDP       2015       2025         2035         2045          2055
 LTFM New Zealand (start)    4.8%       5.6%         6.8%         7.2%          7.5%

 GDP difference adjustment
 Aus. GDP/ NZ GDP            100%       107%         115%         124%          130%
 LTFM NZ (Aus. GDP growth)   4.8%       5.2%         5.9%         5.8%          5.7%

 65 and over adjustment
 Aus. >=65/ NZ >=65          99%        92%          87%          87%           91%
 LTFM NZ (Aus. >=65)         4.7%       5.1%         5.9%         6.3%          6.8%

 Combined GDP and >=65       4.7%       4.8%         5.1%         5.1%          5.2%
 Difference                  0.1%       0.8%         1.7%         2.1%          2.3%

Source: NZIER

3.4.2.           Model results – health spending
Health care spending (including aged care spending) as a proportion of
GDP is forecast to increase at approximately the same rate in Australia
(41%) and New Zealand (46%) over the period 2015 to 2055. However,
Australia’s aged care spending share of GDP is forecast to increase by
almost 90% over the period 2015 to 2055 compared with 30% growth
for narrowly defined health care spending.

                                                                                       future[inc]
                                                                                                     21
Figure 5
                       Figure 5 Health
                                Health care
                                       care plus
                                            plus aged
                                                 aged care
                                                      care spending
                                                           spending
                       As
                       As a
                          a proportion
                            proportion of
                                       of GDP
                                          GDP

                         10.0%
                         10.0%
                          9.0%
                          9.0%
                          8.0%
                          8.0%
                          7.0%
                          7.0%
                          6.0%
                          6.0%
                          5.0%
                          5.0%
                          4.0%
                          4.0%
                          3.0%
                          3.0%
                          2.0%
                          2.0%
                          1.0%
                          1.0%
                          0.0%
                          0.0%
                                       2015
                                       2015           2025
                                                      2025              2035
                                                                        2035            2045
                                                                                        2045    2055
                                                                                                2055
                                                   Health
                                                   Health NZ
                                                          NZ        Health
                                                                    Health &
                                                                           & Aged
                                                                             Aged Care
                                                                                  Care (Aust)
                                                                                       (Aust)

                       Source:
                       Source: NZIER
                               NZIER

                       The
                       The differences
                           differences in
                                        in GDP
                                           GDP growth
                                               growth assumptions
                                                       assumptions discussed
                                                                      discussed in
                                                                                 in the
                                                                                    the previous
                                                                                        previous
                       section
                       section on the retirement income results also apply to forecasts for
                               on the retirement  income  results also apply to forecasts  for
                       health spending
                       health spending growth
                                         growth relative
                                                relative to
                                                         to GDP.
                                                            GDP.

                       3.5. Crisis, what crisis?
                       While
                       While the
                             the models
                                 models used
                                        used by
                                              by treasury
                                                 treasury departments
                                                          departments on
                                                                      on both
                                                                         both sides
                                                                              sides of
                                                                                    of the
                                                                                       the
                       Tasman  are robust, we must  remember  what they are showing.
                       Tasman are robust, we must remember what they are showing.
                       What
                       What they
                               they do,
                                    do, and
                                        and do
                                            do well,
                                               well, is
                                                     is provide
                                                        provide information
                                                                 information about
                                                                              about the
                                                                                     the effects
                                                                                         effects of
                                                                                                 of
                       likely demographic
                       likely demographic change
                                            change onon the
                                                         the fiscal
                                                             fiscal positions
                                                                    positions of
                                                                              of both
                                                                                 both countries.
                                                                                      countries.
                       They are
                       They are not
                                not models
                                    models ofof wellbeing
                                                wellbeing and
                                                          and say
                                                               say nothing
                                                                   nothing about
                                                                           about the
                                                                                 the benefits
                                                                                     benefits of
                                                                                              of
                       spending, at either the individual or aggregate level.
                       spending, at either the individual or aggregate level.
                       By
                       By presenting
                          presenting their
                                        their results
                                               results as
                                                       as shares
                                                          shares ofof GDP,
                                                                      GDP, the
                                                                            the models
                                                                                models tend
                                                                                         tend to
                                                                                               to disguise
                                                                                                  disguise
                       the fact that  both   treasury  departments     are projecting
                       the fact that both treasury departments are projecting consistentconsistent
                       productivity growth
                       productivity  growth overover the
                                                     the modelling
                                                         modelling period.
                                                                     period. This
                                                                              This growth
                                                                                   growth could
                                                                                            could provide
                                                                                                  provide
                       ever-increasing     capacity  to provide  the  higher  health and  retirement
                       ever-increasing capacity to provide the higher health and retirement
                       costs while
                       costs while still
                                    still providing
                                          providing higher
                                                     higher living
                                                            living standards.
                                                                   standards. They
                                                                                They also
                                                                                      also disguise
                                                                                            disguise the
                                                                                                      the
                       downside   risk  that  the current  productivity  slowdown    is sustained,
                       downside risk that the current productivity slowdown is sustained, in        in
                       which
                       which case
                             case the
                                    the ageing
                                          ageing population
                                                  population provides
                                                               provides an
                                                                         an even
                                                                             even larger
                                                                                   larger fiscal
                                                                                           fiscal
                       challenge.
                       challenge.
                       They are
                       They  are also
                                 also deterministic:
                                      deterministic: they
                                                       they show
                                                            show the
                                                                  the effects
                                                                      effects of
                                                                              of the
                                                                                 the combination
                                                                                     combination of
                                                                                                 of
                       many   inputs on fiscal  outcomes,   rather than being  based  on any
                       many inputs on fiscal outcomes, rather than being based on any theory theory
                       of optimal
                       of optimal outcomes.
                                  outcomes. Unlike
                                                Unlike other
                                                       other economic
                                                              economic models,
                                                                        models, they
                                                                                 they do
                                                                                      do not
                                                                                         not predict
                                                                                             predict
                       that the economy    will settle into a steady state pattern.
                       that the economy will settle into a steady state pattern.
                       The
                       The models
                           models also
                                   also do
                                        do not
                                           not contain
                                               contain feedback
                                                       feedback loops,
                                                                 loops, where
                                                                        where the
                                                                               the outcome
                                                                                   outcome inin
                       one
                       one sector of the economy has an impact on others. For example, in
                           sector of the economy  has  an impact  on others. For example, in

22 Population Ageing – Do we understand and accept the challenge?
neither
neither model
         model is is economic
                     economic growth
                                growth a a function
                                           function of
                                                     of the
                                                        the size
                                                            size of
                                                                 of the
                                                                     the tax
                                                                         tax take,
                                                                              take,
which
which it probably should be given deadweight losses increase at
      it probably     should  be  given deadweight    losses  increase   at the
                                                                             the
square
square ofof the
            the tax
                 tax rate
                      rate (Creedy
                            (Creedy (2003)).
                                     (2003)). At
                                               At the same time,
                                                  the same   time, neither
                                                                    neither model
                                                                              model
considers the
considers   the option
                 option value
                          value of
                                 of delaying
                                    delaying policy
                                              policy action
                                                     action in
                                                            in the
                                                               the face
                                                                    face of
                                                                          of
uncertainty
uncertainty over
               over the
                     the forecast
                          forecast period
                                    period or
                                            or shows
                                               shows the
                                                      the effect
                                                           effect of
                                                                  of expected
                                                                      expected
increases   in health   status  on labour  productivity.
increases in health status on labour productivity.
The
The models
    models areare essentially
                   essentially silent
                               silent on
                                      on the
                                         the impact
                                              impact of
                                                     of housing
                                                        housing affordability.
                                                                affordability.
In both
In both New
        New Zealand
               Zealand and
                        and Australia
                             Australia home
                                         home ownership
                                                ownership provides
                                                          provides an
                                                                    an implicit
                                                                       implicit
fourth pillar for retirement  incomes.    A recent Australian report (AIST,
fourth pillar for retirement incomes. A recent Australian report (AIST,
2018,
2018, p.
       p. 4)
          4) noted
             noted that
                    that if
                         if housing
                            housing affordability
                                     affordability continued
                                                   continued to
                                                             to deteriorate
                                                                deteriorate
          an
          an increasing
             increasing proportion
                          proportion ofof retirees
                                          retirees would
                                                    would bebe living
                                                                living in
                                                                       in
         less secure   accommodation      than   in previous
         less secure accommodation than in previous decades,   decades,
         having to
         having   to spend
                     spend aa greater
                              greater proportion
                                        proportion of of their
                                                         their income
                                                               income on on
         housing.
         housing.
We
We therefore
    therefore need
                need toto be
                          be careful
                             careful in
                                      in being
                                         being too
                                                too categorical
                                                     categorical about
                                                                    about there
                                                                            there
being    serious  economic   or social
being a serious economic or social problem resulting from population
      a                                 problem    resulting from    population
ageing
ageing that
        that must
              must bebe addressed.
                        addressed. That
                                     That population
                                           population ageing       has fiscal
                                                          ageing has    fiscal
consequences
consequences is undoubtedly true. But whether those consequences are
                 is undoubtedly   true.  But  whether    those  consequences      are
undesirable,
undesirable, compared
              compared to  to some
                              some feasible
                                     feasible alternative,
                                               alternative, isis not
                                                                 not something
                                                                      something
that
that the
     the models
          models both
                   both treasury
                         treasury departments
                                  departments use   use are
                                                         are designed
                                                             designed to  to
address.
address.
Figure 6
Figure 6 Pension
         Pension spending
                 spending in
                          in Australasia
                             Australasia compared
                                         compared to
                                                  to the
                                                     the OECD
                                                         OECD
average
average
Public pension
Public pension as
               as a
                  a percentage
                    percentage of
                               of GDP
                                  GDP

 9
 9

 8
 8

 7
 7

 6
 6

 5
 5

 4
 4

 3
 3

 2
 2

 1
 1

 0
 0
  1980
  1980         1985
               1985       1990
                          1990          1995
                                        1995         2000
                                                     2000           2005
                                                                    2005   2010
                                                                           2010
                                                                           2010
                                 AUS
                                 AUS           NZL
                                               NZL          OECD
                                                            OECD Average
                                                                 Average

Source:
Source: OECD
        OECD Statistics
             Statistics

Compared
Compared with
           with the
                 the OECD
                     OECD average,
                           average, both
                                      both Australia
                                           Australia and
                                                      and New
                                                           New Zealand
                                                                Zealand
have low
have low levels
         levels of
                of spending
                   spending on
                             on public
                                 public pensions
                                        pensions.. Figure
                                                   Figure 6
                                                          6 compares
                                                            compares
New
New Zealand’s
     Zealand’s and
                and Australia’s
                     Australia’s public
                                 public pension
                                        pension spending
                                                spending (excluding
                                                           (excluding

                                                                                        future[inc]
                                                                                                      23
taxation subsidies) to the OECD average, while Figure 7 compares
                        Australasian spending with other OECD countries.

                        taxation
                        Figure 7 subsidies)     to the OECD
                                   Pension spending              average, while
                                                          in Australasia  is lowFigure
                                                                                by OECD7 compares
                                                                                          standards
                        Australasian    spending
                        2013, Public pension         with other
                                             as a percentage      OECD countries.
                                                             of GDP

                         18

                        Figure 7 Pension spending in Australasia is low by OECD standards
                         16
                        2013, Public pension as a percentage of GDP
                         14
                         18
                         12
                         16
                         10
                         14
                          8
                         12
                          6
                         10
                          4
                          8
                          2
                          6
                          0
                               LS   R L S N R L L                               E K R X EZ           U LE                      T
                          4     I   O H            L R
                                        U A S Z IR D
                                                       R E TS
                                                       B H
                                                                      A
                                                                      S K
                                                                        V A                          E B    P   IF P
                                                                                                            N N N  SE   N TU A
                                                                                                                             R R
                                                                                                                                   A
                                                                                                                                   TI
                                    K C A C I N    N O
                                                     N G C E          U S V
                                                                          L        N U U
                                                                                SW D T L C           D      J U
                                                                                                              H
                                                                                                                        V
                                                                                                                        S A F P
                          2
                        Source: OECD Statistics
                          0
                              LS    R   L S N R LZ   L D R R   E TS   A   K A   E   K   R   X   EZ   U LE       I P
                                                                                                            N N N       N TU A T   A
                              OI        H U   S
                                    A I N I N O      R L   B   H      S   V                          E      P     S          R R   T
                        Governments
                              K C A C have choices
                                               N G about S LV W
                                                   C E U what    N TU LU C
                                                              S they
                                                                 D    spend  B J U F E SV A F P I
                                                                           D taxpayers’
                                                                                 H      money on,
                        and those choices have consequences that should be made transparent.
                        Source: OECD Statistics
                        If either government wants to reduce the growth in spending on
                        retirement incomes,
                        Governments           then our
                                        have choices   new what
                                                     about  research
                                                                  theyprovides some useful
                                                                       spend taxpayers’    newon,
                                                                                        money
                        evidence
                        and   thosethat can have
                                    choices inform the policy choices.
                                                 consequences    that should be made transparent.
                        If either government wants to reduce the growth in spending on
                        retirement incomes, then our new research provides some useful new
                        evidence that can inform the policy choices.

24   Population Ageing – Do we understand and accept the challenge?
04
        Survey results
                       This section summarises
                       the key conclusions that
                       emerged from an internet
                       panel survey undertaken in
                       late 2017 in New Zealand
                       (1,005 respondents)
                       and Australia (1,228
                       respondents).

25 Population Ageing – Do we understand and accept the challenge?   future[inc]
                                                                                  25
26 Population Ageing
              Aging ––Do
                       Dowe
                          weunderstand
                             understandand
                                        andaccept
                                            acceptthe
                                                   thechallenge?
                                                       challenge?
4. Survey results
4.1. New survey comparing New Zealanders
     attitudes across time with those of
     Australians
Section 2 discussed the similarities of the Pillar 1 publicly-funded
component of the New Zealand and Australian retirement income
regimes and the marked differences between the Australian Pillar 2
system and New Zealand Pillar 2/3 KiwiSaver scheme.
This section summarises the key conclusions that emerged from an
internet panel survey undertaken in late 2017 in New Zealand (1,005
respondents) and Australia (1,228 respondents) focused on Pillar 1. This
unique survey allowed a comparison across time as well as across
countries in attitudes to retirement income policies.
The survey was modelled on the 2014 Colmar Brunton survey, but for
obvious reasons we limited the scope to Pillar 1 superannuation issues to
ensure comparability between jurisdictions. Essentially it was possible to
ask New Zealanders and Australians largely the same questions with
only minor wording changes such as the term ‘Age Pension’ in Australia
rather than ‘New Zealand Super’.16
The survey had four parts:
           1.        Thinking and planning for retirement
           2.        Public understanding of New Zealand Super or the Age
                     Pension
           3.        Understanding of the increased cost of public pensions
           4.        Policy options for dealing with the increased cost.
There is a wealth of interesting insights on how New Zealanders and
Australians think about planning for their own retirement and how much
they understand about the retirement policy regimes in their respective
countries.
We have published separately the detail of the individual questions and
summary of the responses. Where possible, the New Zealand data for
2017 was compared with the 2014 responses.
In the last part of the survey we divided the sample in half.
One half were given additional information on the extent and the drivers
of the increased cost of retirement income policies.
We had expected to see different responses from the information group
relative to the non-information group. This was based on the 2014
Colmar Brunton survey where respondent policy preferences changed
once the magnitude of the impact of an ageing population was evident.

  16
       Colmar Brunton augmented their telephone survey with an on- line discussion forum, an addition that could be explored in
       subsequent research. We added in one additional question in the Australian surveying only on the deeming option for the
       income and asset testing regime.

                                                                                                                                  future[inc]
                                                                                                                                                27
Across a range of questions there were remarkable similarities between
                       New Zealanders’ and Australians’ attitudes. This was quite striking given
                       how, as section 2 above discussed, the two regimes have diverged over
                       time with very different approaches to Pillar 2 and income and asset
                       testing in Pillar 1.

                       4.2. Thinking and planning for retirement
                       Consideration of retirement increases markedly as it approaches
                       The survey asked people about the extent people had thought about
                       retirement and how much they would need as well as sources of
                       retirement income.
                       Around half of Australians and New Zealanders are thinking somewhat
                       about retirement, as well as the amount required, and the remainder
                       only a little or not at all.
                       Unsurprisingly, thinking about retirement increases markedly with age.
                       Around 40% of 18-24 year olds compared to over 70% of those over 65
                       had thought a great deal or a fair amount about retirement.

                       Looking to augment the public pension
                       Australians and New Zealanders identified four main sources of income:
                                             1.      Compulsory Superannuation/KiwiSaver (Pillar 2)
                                             2.      Age Pension/New Zealand Super (Pillar 1)17
                                             3.      Private Savings
                                             4.      Part time earnings.

                       The main change in the 2017 NZ survey is the growing awareness of
                       KiwiSaver. In the 2014 survey, New Zealand Super was most commonly
                       identified as the source of retirement income and KiwiSaver was second.
                       We asked about the level of income needed in retirement “just to get by”
                       and “to live comfortably”. Overall based on respondents’ own estimates
                       most Australians and New Zealanders thought they would need income
                       from sources other than the government pension.

                                •       in New Zealand 48% of couples and 24% of singles believe they
                                        could ‘get by’ on current New Zealand Super levels. In the 2014
                                        survey the corresponding results were 48% and 12%,
                                        respectively. In addition, only 16% of couples and 8% of singles
                                        feel they could ‘live comfortably’ on New Zealand Super at
                                        current levels.
                                •       in Australia 41% of couples and 35% of singles feel they could
                                        ‘get by’ on Age Pension income levels. In addition, only 12% of
                                        couples and 12% of singles feel they could ‘live comfortably’ at
                                        that level.

                           17
                                    Interestingly NZ Super (like the Age Pension) is only listed second as a source of retirement income in New Zealand (by 62%
                                    of respondents) even though it is essentially universal after 65.

28 Population Ageing – Do we understand and accept the challenge?
However a significant minority of people, across all income earning
demographics, said they could ‘get by’ on the respective Pillar 1 schemes.

Figure 8 NZ Super/Age Pension - how many can ‘get by’ and how many
could ‘live comfortably’?

Source: ResearchNow

These results are consistent with other surveys such as the Association
of Superannuation Funds of Australia's (ASFA) 2011 survey which found
most Australian respondents thought that they would need more than
$750k in retirement saving to live comfortably, taking into account the
Age Pension. The similarity in the responses from New Zealanders and
Australians is even more striking given the level of the Age Pension is
notably higher than New Zealand Super.

4.3. Public understanding of New Zealand
     Super or the Age Pension
Reasonable awareness of NZ Super and the Australian Age
Pension but less of the detailed operation
There was high awareness of the existence of New Zealand Super and
Age Pension (87% in New Zealand, 92% in Australia,). For example, in
both countries, four in five people know that almost anyone aged over
65 years can receive the national super/pension payments.
However, there was much less understanding about the operation of the
Age Pension/New Zealand Super regimes amongst younger people in
particular.
In both Australia and New Zealand while the majority identify current
taxes as the main source of funding, there is still widespread belief in a
‘super fund’. Thirty percent of Australians and 50% of New Zealanders
think ‘the Age Pension/New Zealand Super comes from money the
government has saved and invested over time’.

                                                                             future[inc]
                                                                                           29
You can also read