Discussion Paper Series - CDP 22/20
←
→
Page content transcription
If your browser does not render page correctly, please read the page content below
Discussion Paper Series
   CDP 22/20

      The Role of Schools in Transmission of the SARS-CoV-2 Virus:
      Quasi-Experimental Evidence from Germany

      Clara von Bismarck-Osten, Kirill Borusyak, and Uta Schönberg

Centre for Research and Analysis of Migration
Department of Economics, University College London
Drayton House, 30 Gordon Street, London WC1H 0AX

w w w .c re a m -mi grati on. org
The Role of Schools in Transmission of the SARS-CoV-2 Virus:
                         Quasi-Experimental Evidence from Germany1

                  Clara von Bismarck-Osten*, Kirill Borusyak*†, and Uta Schönberg*‡
                    *
                        University College London; † CEPR; ‡ IAB, RWI, and CReAM

                                               March 19, 2021

                                                   Abstract
         This paper considers the role of school closures in the spread of the SARS-CoV-2
         virus. To isolate the impact of the closures from other containment measures and
         identify a causal effect, we exploit variation in the start and end dates of the summer
         and fall school holidays across the 16 federal states in Germany using a difference-
         in-differences design with staggered adoption. We show that neither the summer
         closures nor the closures in the fall had a significant containing effect on the spread
         of SARS-CoV-2 among children or a spill-over effect on older generations. There
         is also no evidence that the return to school at full capacity after the summer
         holidays increased infections among children or adults. Instead, we find that the
         number of children infected increased during the last weeks of the summer holiday
         and decreased in the first weeks after schools reopened, a pattern we attribute to
         travel returnees.

                   Keywords: Covid Economics, School Closures, Public Health
                   JEL codes: I10, I18, I28

1
  Corresponding author: Clara von Bismarck-Osten (clara.bismarck-osten.19@ucl.ac.uk). Borusyak acknowledges
financial support from the European Research Council (ERC) under the European Union’s Horizon 2020 research and
innovation programme (grant agreement Number 949995). We thank three anonymous referees for helpful comments.
Mirko Vintar provided outstanding research assistance.
1 Introduction
The coronavirus pandemic has sparked an international debate on the efficiency of school
closures as a containment measure. Despite a “second wave” of infections by the SARS-CoV-2 virus
(causing the “COVID-19” disease) starting in the early fall of 2020 and a surge in the representation
of children among new cases after the start of the new academic school year (The New York Times,
2020; The Guardian, 2020; Die ZEIT, 2020), most European countries have kept their schools open
throughout the fall. However, as infections rose sharply (as in the U.K.) or remained at stubbornly
high levels (as in Germany) over the course of winter, many countries reconsidered the alleged
“measure of last resort”: the closing of schools. With the mounting concerns about the new strains of
the virus, several European countries, including the United Kingdom and Germany, did not reopen
schools after the end of the winter holiday – adding to the pressure to understand their role in the
transmission of the SARS-CoV-2 virus.
Because of their widespread consequences, school closures are among the most controversial
containment policies. Prolonged school closures may have a negative effect on the psychological and
emotional development of children, and unequal remedial measures have been found to widen
learning inequalities (Engzell et al., 2020; Andrew et al., 2020). School closures also negatively
impact the careers of parents obliged to take on more educational responsibilities and reduce the
number of hours supplied in the labor market (Fuchs-Schündeln et al., 2020). Since women typically
shoulder most of the childcare responsibilities, it is also feared that school closures will widen the
gender wage gap in the long run (Alon et al., 2020).
These costs are weighed against the effectiveness of school closures as a strategy to contain
the spread of SARS-CoV-2. The main mechanism through which school closures are expected to be
effective is by preventing social interactions among children in schools. Reduced contact between
children may further break the chain of infection from child to parent and grandparent, thereby
reducing infection rates in the adult population. School closures may also induce a series of either
offsetting or reinforcing behavioural adjustments. On the one hand, children may substitute school
interactions with other activities that introduce additional risks of transmission. On the other hand,
school closures could force parents to work from home, reducing their work-related contacts and,
thereby, their risk of contagion.2
We aim to identify the effect of school closures on children as well as various age groups of
adults. Understanding the “spill-over” effects on adults is of central importance, as the severity of the
2
A more worrying labour force response would constitute in the reduction of the health-care workforce available. A study
in the United States estimates that a total of 28.8% of healthcare providers have childcare obligations (Bayham and
Fenichel, 2020).
1disease has been found to be closely linked to age. Adults are relatively overrepresented among
confirmed COVID-19 cases and have a higher risk of dying from the disease, with 94% of the deaths
in Germany attributed to the group aged 60 and above. Children under the age of 15, by contrast,
account for only 9.6% of cumulative confirmed SARS-CoV-2 cases, despite making up 13.6% of the
country’s population.3 They almost always experience mild symptoms (Wang et al., 2020), although
recent reports suggest a small increase in the incidence of children experiencing severe inflammatory
symptoms, which could be linked to SARS-CoV-2 (Pouletty et al., 2020).
In this paper, we consider school closures and openings as “treatments” and apply modern
econometric tools to identify the “causal” effects of school closures and reopenings on SARS-CoV-
2 infections among children, as well as their potential spill-over effects on adults. We exploit variation
in the start and end dates of school summer and fall school holidays across the federal states
(“Bundesländer”) of Germany for difference-in-differences identification, building on the strategy
developed by Adda (2016) in the context of influenza, gastro-enteritis, and chickenpox in France.
The sixteen states of Germany have staggered summer holidays to avoid overcrowding the national
travel infrastructure. In 2020, children in the state of Mecklenburg-Western Pomerania began their
summer holiday on June 20, whereas children in Baden Wurttemberg had to wait a further six weeks,
until July 30. Similarly, the fall holidays, which are typically two weeks long, started on October 3
in the states of Schleswig-Holstein children and Hesse, but not until October 24 and 31 in the states
of Baden Wurttemberg and Bavaria. We exploit this quasi-experimental variation using an estimator
developed by Borusyak et al. (2021) for difference-in-differences settings with staggered adoption of
treatment and heterogeneous treatment effects, which offers advantageous robustness and efficiency
properties.
Two features of the German summer and fall holidays make them attractive as the source of
causal identification. First, whether the holiday starts early or late in each state is decided upon years
in advance and was unaltered by the pandemic. Therefore, the variation in the start and end date of
the holidays across German states was not confounded by the spread of SARS-CoV-2 within the
state. Second, in contrast to school closures during the first lockdown in March, the start and end of
the summer school holidays did not coincide with the introduction of other containment measures,
such as the closing of bars, restaurants and non-essential shops, allowing us to isolate the impact of
school closures. This was also the case for the fall holidays, with the exception of a partial lockdown
announced at the federal level implemented November 2, which is why we focus on the fall holiday
3
These estimates were computed on our own, based on the data described in Section 2.3 and covering June 1 through
October 28, 2020.
2closures (but not subsequent reopening) and restrict the empirical analysis to the period preceding the
lockdown announcement, October 28.4
Difference-in-differences estimation of the effects of school closures and reopenings on the
incidence of SARS-CoV-2 at the regional level is also attractive from a policy perspective. These
estimates identify an overall impact, encompassing all the behavioural adjustments that school
closures bring about, such as increased activities of children outside school and the reduced work-
related contacts of parents. Moreover, the baseline against which school closures are evaluated is not
the status quo before the pandemic, but a situation in which various other containment measures are
in place. By analysing the effects of both school closures and reopenings, we evaluate whether
schools that operated at partial capacity (as it was the case before the summer holidays) play a more
limited role in spreading SARS-CoV-2 than schools that reopened to full capacity, with additional
hygiene rules and other restrictions, at the end of the summer holidays. By comparing the effects of
the summer and fall holiday closures, we assess whether closures are more effective at containing the
spread of SARS-CoV-2 in situations when cases in the population are high (as in the fall) compared
to situations when they are low (as in the summer). A heterogeneity analysis that compares the effects
of summer reopenings in districts with below and above median infection rates provides additional
insights into the same question. Our estimates are, therefore, directly informative on the trade-offs
that policymakers may face in the future – an important advantage of our design over those pursued
by some existing studies (summarized in Section 2.1).
At the same time, some limitations of our methodology are worth pointing out. The summer
holidays are a time of increased travel for families. Most likely, this increased the risk of infection,
either because infection rates in typical destination regions were higher than in Germany or because
travelling itself poses a risk. With our strategy, it is challenging to disentangle any rise in confirmed
COVID-19 cases due to travel from a rise due to school reopenings per se. To tackle this difficulty,
we leverage the exact timing of the increases in cases around the date of school reopening after the
summer holidays and draw on state-level data on the share of confirmed positive cases to determine
the most likely explanation. Our analysis of the fall holidays is less likely to be contaminated by travel
behavior since families travel considerably less during the fall than the summer. Yet, this analysis is
limited by the short duration of the fall holidays and sparser cross-state variation in their timing,
preventing us from considering fall school closures and reopenings as separate events.
We find little evidence that school closures in the summer lowered SARS-CoV-2 infection
4
The lockdown implemented on November 2 involved closures of cultural entertainment venues, restaurants, pubs and
bars. Schools and day care centers were set to remain open. By October 28, the fall holidays have ended in most states
with the exceptions of Thuringia, Saxony, Baden Wuerttemberg, and Bavaria.
3rates among school-aged children or elder generations. At best, according to the lower bound of the
95% confidence interval of our baseline estimates, only 0.335 infections per 100,000 school-aged
children (ages 5-14) and 0.026 infections per 100,000 adults aged 60 and above have been prevented
per day in the first three weeks of the school summer holidays.
Similarly, we do not find that the return to full-time schooling after the summer break led to
an increase in infections among school-aged children. Instead, we find that SARS-CoV-2 infection
rates tend to increase in the last weeks of the summer holidays and to decline in the first days after
schools open, a pattern visible in all age groups, but more pronounced in the younger population. We
consider this to be best explained by a higher risk of infection of families returning home from their
travels shortly before the summer holidays ended and increased testing of them.5
Our analysis of the fall holidays confirms that school closures did not significantly reduce
COVID-19 cases among either children or adults, even in situations of higher incidence levels. These
results are, however, limited to two weeks after the holiday began and may therefore not capture
spillover effects that take longer to appear. They are also less precisely estimated.
In sum, our findings suggest that schools have played a limited role in the transmission of
SARS-CoV-2 over the summer and fall of 2020. Importantly, our results provide little support for the
hypothesis that school openings at the start of the academic year substantially contributed to the
second wave of infections, or to the surge in the representation of children among new cases. We
acknowledge that both the summer and fall holidays in Germany precede the spread of new variants
of SARS-CoV-2, most importantly the “British” B.1.1.7, the “South-African” 501Y.V2, and the
“Brazilian” P.1 and P.2 strains, that may be more infectious or more resistant to available vaccines
than the previous strains. Our findings based on the summer and fall holidays may therefore
understate the containing effect of school closures in countries where such variants are widespread.
On the other hand, as the share of vaccinated adults in the population grows, the spillover effects on
infection rates of adults and, in particular, deaths may also be smaller than those we uncover.
The remainder of this paper is organised as follows. Section 2 summarizes related literature,
provides background information on the containment measures implemented, the scheduling of the
school holidays as well as the spread of the SARS-CoV-2 virus in Germany, and introduces the data.
The empirical strategy is described in Section 3. Section 4 reports the empirical results, and Section
5 concludes.
5
This explanation is supported by the finding of Isphording et al. (2020) that incoming mobility, but not outcoming
mobility, increased during the last two weeks of the summer holidays in Germany.
42 Background
2.1 Related Literature
The effectiveness of school closures as an important “non-pharmaceutical intervention”6 has
been studied by a wide range of disciplines, including epidemiology, virology, paediatrics,
psychology, and economics, with mixed empirical findings.
Most papers can be attributed to the category of correlational studies, studying the relationship
between in-person schooling and the incidence of COVID-19 across counties or states within a
country (e.g., Auger et al., 2020, Goldhaber et al., 2021 and Harris et al. 20201 for the US and
Dehning et al., 2020 for Germany) or across countries (Liu et al., 2021). These studies have reached
conflicting conclusions, ranging from no measurable impact of in-person schooling on infection rates
(e.g., Harris et al., 2021) to important containing effects (e.g., Liu et al., 2021).7 One important
drawback of these correlational studies is that schools often open or close in response to rising or
declining infections in the local area or country, impeding a causal interpretation. A second drawback
is that in some studied cases (e.g., Dehning et al., 2020) school closures were enforced at the same
time as other lockdown measures, making it impossible to isolate the impact of school closures from
the impact of these alternative containment measures.
Quasi-experimental studies, such as ours, overcome both drawbacks. School holidays offer
an interesting source of quasi-experimental variation. Adda (2016) first leveraged them to study the
transmission of viral diseases such as gastro-enteritis and influenza among both children and adults
and found schools to be successful at curbing the spread of these viral diseases.8 However, the paper
closest to ours is the contemporaneous work by Isphording et al. (2020), in which a similar research
design was used to estimate the impact of school reopenings after the end of the German summer
holiday. While our results are broadly in line with theirs, two differences are worth noting. Their
analysis exclusively focuses on the reopening of schools at the end of the summer holiday, while we
evaluate school closures and reopenings in the summer as separate events and provide complementary
evidence on the closures induced by the fall holiday. In addition, we pay extra attention to the period
6
Epidemiological term for containment measures which do not involve medication or vaccination. For the economics
literature on other non-pharmaceutical interventions see, for example, Fetzer (2020) and Mangrum and Niekamp
(forthcoming) who study the effects of keeping restaurants and universities open, respectively.
7
In one of the analyses, Harris et al. (2021) also leverage variation in teacher bargaining power across counties in the
U.S., which is correlated with whether or not schools in the county operate in person, to obtain causal effects. This quasi-
experimental approach is closer to the small literature we describe next.
8 One explanation for the difference in Adda’s and our findings could lie in the differences between SARS-CoV-2 and
other viruses. Alternatively, the difference could stem from the hygiene rules and procedures currently in place in schools
to avoid contagion, which are not typically implemented during the seasonal outbreaks of other diseases studied by Adda
(2016).
5just before schools reopened in the summer and identify a significant temporary increase in infection
rates during that time. This leads us to conclude that travel returnees exposed to a higher risk of
infection may have contributed to the spread of SARS-CoV-2. Another relevant quasi-experimental
study on the question of the role of schools in the spread of COVID-19 is the paper by Vlachos et al.
(2021). The “experiment” exploited is that lower secondary schools in Sweden remained open,
whereas upper secondary schools moved online. While they found a greater risk for in-person
teachers of contracting the virus, the spillover effects to the general population were small, leaving
the authors to conclude that schools play a minor role in the spread of the SARS-CoV-2 virus.
A separate and complementary strand of studies conducted by epidemiologists and virologists
informs about the effectiveness of school closures in a more indirect way: by analysing infection rates
among children and, in turn, their own infectiousness. One common approach is to study infection
rates and antibody prevalence in a single school or a set of schools where infections have been
reported.9 Such studies, commonly referred to as “cohort” studies, have reached different conclusions
on plausible infection rates among children. Fontanet et al. (2020) found a high infection rate among
pupils in an early outbreak in a French high school, while more recent larger-scale studies generally
reported smaller infection rates (Berner 2020; Ulyte et al. 2020; Ladhani et al. 2021).10 Contact
tracing studies go a step further, analysing the extent to which infected children spread the virus to
members of their immediate network, such as their parents and siblings. While a small-scale study
for Trento, Italy found that children under 15 years were the most contagious of any age group (Fateh-
Moghadam et al. 2020, with a sample size of 14), two larger-scale studies for South Korea and
Australia did not find schools to be risky when infection rates are low (Yoon et al., 2021; Macartney
et al., 2020). An alternative approach to evaluate the infectiousness of children is taken in studies that
compare the viral load in the upper respiratory tract in test samples of infected children and adults.
Most such studies published in the summer 2020 found no evidence of a smaller viral load in children
than in infected adults (e.g., Jones et al., 2020; Heald-Sargent et al., 2020) and concluded that children
may be as infectious as adults.
Cohort, contact tracing and viral concentration studies often come with a host of caveats,
including small and not representative samples; neither do these studies provide direct evidence on
the role of schools in the transmission of SARS-CoV-2. An important advantage of our approach is
that we provide direct estimates of the effects of school closures, drawing on data comprising all
9
Typically, those estimates subsequently feed into models that project the spread of the virus in the general population.
10
Berner et al. (2020) survey schools in and around Dresden, Germany. Ulyte et al. (2020) study seroprevalence in 55
randomly selected schools in the canton of Zürich, Switzerland. Finally, Ladhani et al. (2021) test children across 131
schools in England.
6infections in a country. Our estimates are policy relevant as they capture the overall impact,
encompassing all behavioural adjustments that school closures bring about, and take into account the
current situation under which schools operate.
2.2 The Institutional Setting in Germany
Germany’s Policy Response to the Pandemic
Drawing on the experience with influenza where school closures proved particularly effective
(Viner et al., 2020; Adda 2016), all German states proceeded to closing schools early in the outbreak
of SARS-CoV-2, around March 16, 2020. Around the same time, other containment measures such
as the closing of bars, restaurants, and non-essential shops, as well as social distancing rules were
implemented, and these measures were often timed similarly across states (see the see IAB database
on the containment measures in Germany11; Bauer and Weber, 2020). Schools gradually reopened
after the Easter holidays (around April 27), prioritising the cohorts having examinations. This
reopening similarly tended to coincide with lifting other containment measures (Federal Government
of Germany, 2020). This policy environment makes the spring period unsuitable for our analysis: the
variation in the timing of school closures is limited, and it appears difficult to disentangle the various
containment measures.
In the first period of our interest – from the June 1 to the respective start of the summer
holidays – the focus was placed on ensuring social distancing of 1.5m between children and teachers
both in the classroom and buildings; shifts were also introduced in many schools (Frankfurter
Allgemeine Zeitung, 2020). This was accompanied by a set of policies introduced similarly across
states: ventilation in schools at regular intervals, hygiene standards, and the exclusion from lessons if
a student develops symptoms (Tagesschau, 2020b). On the other hand, it was the task of every school
to gauge how best to guarantee compliance with social distancing rules and government guidelines.
Moreover, the handling of outbreaks in school and the quarantine enforcements were (and still are)
in the authority of the 375 local health authorities, and nothing suggests systematic variation across
states in that regard.
After the last states entered school holiday, the Federal Government introduced new policies
concerning the testing of travel returnees. On August 1, the federal government waived the cost of
testing for these returning travellers, and on August 8, it introduced compulsory testing for travellers
11
The database can be found under the following link: https://iab.de/de/daten/corona-eindaemmungsmassnahmen.aspx.
7returning from high-risk countries. These policies were enforced nationwide, and during the school
holiday of most states (with the exception of Mecklenburg Western Pomerania).12
Upon the start of the new academic year, the state governments and ministers of educations
coordinated to ensure schools across Germany would return to teaching at full capacity (Handelsblatt,
2020). As the 1.5m social distancing rule was impossible to impose with schools fully open, all states
advised that schools should set “contact groups” (usually classes or cohorts) within which mixing is
allowed. Most states refrained from making masks compulsory in classrooms (with two temporary
exceptions: Bavaria and North-Rhine-Westphalia for the first two to three weeks after holiday; see
Bayerischer Rundfunk, 2020 and ZDF Heute, 2020a). Guidelines regarding ventilation, hygiene
standards, and exclusion from lessons if a student develops symptoms remained in place while local
health authorities continued to be responsible for the handling of confirmed cases.
In the fall, as cases started to increase, some additional measures were implemented. Most
importantly, Germany announced on October 28 and implemented on November 2 a partial nation-
wide lockdown, involving closures of for example entertainment venues and restaurants. Schools and
day care centres, however, were set to remain open. This partial lockdown does not affect our analysis
on the closures and reopenings in the summer but overlaps with the fall holiday in Bavaria (and
marginally in three other states where the holiday ended on November 2). When analysing the impact
of fall holiday closures on COVID-19 cases, we therefore restrict our analysis to infections up to
October 28, the day the lockdown was announced. Another reason to discard this period is that the
return to school after the fall holidays coincided with several states making masks mandatory.13
To summarize, the summer holiday school closures happened in an environment where
schools are only partially open, social distancing is encouraged, and guidelines regarding ventilation,
hygiene standards and how to handle confirmed cases are in place. In contrast, summer holiday school
reopenings and fall holiday school closures correspond to a situation where schools operate under
full capacity, social distancing within classrooms is impossible, masks are not compulsory but plans
regarding ventilation, hygiene standards and handling of confirmed cases are in place.
The Summer and Fall School Holidays
Since our empirical strategy will exploit the variation in the start and end dates of the
summer and fall holiday across the 16 German states, it is important to explain the process
12
In Mecklenburg-Western Pomerania the summer holidays ended on August 2, and tests were made compulsory at the
state level beforehand (Deutschlandfunk, 2020).
13
These states are: Baden-Württemberg, North Rhine-Westphalia, Schleswig Holstein, Brandenburg, Bremen and
Hamburg (ZDF heute, 2020b).
8generating this variation. In Germany, both summer and fall school holiday dates are planned
several years in advance, with most states alternating between early and late summer holiday
starting dates.
Figure 1 offers an overview of the holiday start and end dates in the summer (Panel A) and
fall (Panel B) of 2020. Summer holidays last six weeks in all German states. There are also six
weeks between the states with the earliest and latest start of the school summer holidays. The
summer holiday period stretches across almost three months, with the first schools closing on June
20 and last schools reopening on September 13 (where we define holidays as including the
surrounding weekends). The fall holiday starts as early as October 3 in the states of Mecklenburg
Western Pomerania, Schleswig-Holstein, Hesse, and Hamburg and as late as October 24 and 31 in
the states of Baden Wurttemberg and Bavaria. In 12 out of the 16 states, fall holidays last two
weeks; in four states, they last one week only.
Figure 2 illustrates the geographic variation in the summer holiday start date, showing that
summer school holidays started first in one of Germany’s most Northern states (Mecklenburg
Western Pomerania) and last in Germany’s most Southern states (Baden Wurttemberg and Bavaria).
The predetermined order in which states enter the fall holiday is generally similar to that in the
summer (see Panel B of Figure 1).
2.3 Data
We obtain the key data on infections from the Robert Koch Institute (RKI), a federal
government agency responsible for the prevention and control of epidemics in Germany, as well
as for epidemiological research. Their database has recorded all confirmed positive cases in
Germany on a daily basis since the first COVID-19 case was reported on January 15, 2020.14 In
our empirical analysis, we use data up until October 28, 2020. The data are available at the county
(“Landkreis” or “Stadtkreis”) level. Berlin constitutes an exception, where the data are available
by borough (“Bezirk”). Altogether, the dataset comprises 415 regional entities which we refer to
as districts.
We process the original case-level data to construct a daily panel of regions. The time
dimension is given by the “reporting date”: the date when a case became known to the local health
department, which is generally the same day the test results were received.15 The regional
14
Retrieved on March 14, 2020 from:
https://www.arcgis.com/home/item.html?id=f10774f1c63e40168479a1feb6c7ca74.
15
Source: RKI, phone interview. For around 60% of cases a “reference” date is also provided, when the first symptoms
appear. However, due to a large fraction of missing data (in particular, because of asymptomatic cases), we do not use
9dimension corresponds to the district in which the positive case is registered, i.e., in which the
person is staying on the reporting date and where the quarantine regulation is enforced. While this
district may not always correspond to the place of residence, it is to be expected that the wide
majority get tested in their place of residence.16
Each case is classified into age brackets of 0–4, 5–14, 15–34, 35–59, 60–79 and over 80-
years-old. We will consider the 5–14 group that roughly corresponds to children in primary and
lower secondary school, two groups of adults (with the 15–34 group including high school and
college students), and a combined group of seniors, i.e. 60 years and older. Cases are further
classified into either recovered or deceased, allowing us to count deaths.17 We note that the deaths
are coded according to the reporting date – the day on which the deceased person tested positive
for the virus – and not the day of death.
We then normalize the cases by the age-bracket specific regional population (in 100,000
people) before the pandemic, retrieved from the regional database (“Regionaldatenbank”) and
corresponding to December 31, 2018.18 For the boroughs of Berlin, the data were instead obtained
from the Statistical Office of Brandenburg-Berlin as of December 31, 2019.19
We note that confirmed cases as reported by the RKI may understate the true infection
rates as some asymptomatic cases may remain undetected. This may lead to an
underrepresentation of children who are more frequently asymptomatic (Robert-Koch Institut,
2020) among confirmed cases. However, it is to be expected that confirmed cases capture nearly
all cases that led to serious disease. Moreover, we are not aware of any reasons for why the
underrepresentation of asymptomatic children should systematically vary across districts or states.
Thus, our estimates for the effects of school closures and openings on infection rates of children
may be somewhat attenuated but not otherwise biased.
For our robustness checks and heterogeneity analyses, we further leverage additional data
sources. We use a database on the number of administered positive polymerase chain reaction
(PCR) tests and the fraction of positive tests by state and date (but not age) based on a sample of
these reference dates in the analysis.
16
That is because the states in Germany typically advise for (or require) testing upon return from travels, as well as before
travels at the place of residence (Tagesschau, 2020a).
17
Cases which are still ongoing are classified as neither recovered nor deceased. Since our analysis is restricted to reported
dates up to October 28, the censoring problem from such cases is negligible.
18
Retrieved on August 7, 2020 from:
https://www.regionalstatistik.de/genesis/online?language=de&sequenz=tabelleAufbau&selectionname=12411-04-02-
4#astructure.
19
Retrieved on October 12, 2020 from: https://www.statistik-berlin-brandenburg.de/datenbank/inhalt-datenbank.asp.
10laboratories across Germany, voluntarily reporting to the RKI.20 These data capture 35.7% of all
confirmed cases between June 1 and October 28, 2020. We approximate the total number of
administered PCT tests (including laboratories that are not participating) as the ratio of the total
number of cases from our main data to the share of positive tests.
We also construct several control variables. We retrieve data on average daily temperature
from 580 weather stations.21 For each district and day, we then average the temperature reported
by the five stations closest to the district centroid, placing a higher weight on the closest ones.22
Furthermore, we measure district-specific tourist intensity in two ways: (i) as the number of guest
arrivals in accommodation facilities in 2019, as reported by the regional database
(“Regionaldatenbank”),23 and (ii) as the exposure to an international airport, measured as
20/(20 + &'()*+,-), where distance is the distance in kilometers between the district centroid
and the closest international airport.24 The coordinates of the district centroids are from the Federal
Agency for Cartography and Geodesy25 and the coordinates of the 22 international airports stem
from Google Maps. Finally, we use population density by district for year 2019, as reported by
the RKI.26
2.4 A Descriptive Outlook on the Spread of SARS-CoV-2 in Germany
Before proceeding to the analysis, we provide an overview of the dynamics of the SARS-
CoV-2 spread in Germany. Figure 3 contrasts daily cases (Panel A) and daily deaths (Panel B) per
100,000 inhabitants in Germany, the United States, as well as four selected European countries
(France, Italy, Sweden and the United Kingdom), based on the data from the European Centre for
Disease Prevention and Control (ECDC).
In Germany, the peak of daily cases in the first wave of new infections was reached on the
March 27, 2020, with 8.27 reported cases per 100,000 inhabitants (6,933 overall), and the peak of
20
The data were provided to us by the RKI by request. The fraction of positive tests is rounded to two digits. Since 0.00
indicates “below 0.005,” we replace such zeros with 0.0025.
21
Retrieved on February 10, 2021 from:
https://opendata.dwd.de/climate_environment/CDC/observations_germany/climate/daily/kl/recent/.
22
Specifically, the weights are proportional to 1/(1+distance in km).
23
Retrieved on February 10, 2021 from:
https://www.regionalstatistik.de/genesis//online?operation=table&code=45412-03-02-
4&bypass=true&levelindex=0&levelid=1615732773390#abreadcrumb.
24
We follow the German Airport Association’s (“Flughafenverband ADV”) definition of international airports in Germany.
25
Retrieved on February 10, 2021 from: https://gdz.bkg.bund.de/index.php/default/digitale-geodaten/nicht-administrative-
gebietseinheiten/gebietseinheiten-1-250-000-ge250.html.
26
Retrieved on August 24, 2020 from: https://npgeo-corona-npgeo-
de.hub.arcgis.com/datasets/917fc37a709542548cc3be077a786c17_0?geometry=-20.631%2C46.211%2C42.650%2C55.839.
11daily deaths on April 15 with 0.61 deaths per 100,000 (510 overall).27 Daily cases remained relatively
low – fewer than one reported case per 100,000 – throughout May and June when lockdown measures
were gradually eased. Since late-July, reported cases have been steadily increasing, with a noticeable
uptick in cases in early October. For the first time on October 14, the ECDC reported more cases per
100,000 than at the peak of the first wave. Daily cases have remained high, around 20 per 100,000,
throughout November, December and January and have declined moderately in February 2021.
By international comparison, Germany showed a similar trend in newly reported cases as
other European countries such as Italy, France and the United Kingdom between March and June.
While most European countries experienced an acceleration in daily reported cases during the fall,
the increase and subsequent decline have been less pronounced in Germany than in France, the United
Kingdom, and Italy. The United States followed a different time pattern, in that new cases per 100,000
never fell below 9 per day since April 2020 reached a first peak of about 20 in late July, and started
increasing again in September, albeit at a slower pace than in most European countries.
Relative to other countries, Germany stands out in terms of the relatively low death toll during
the first wave of the pandemic. At the peak of the first wave, the death rate per 100,000 inhabitants
was about 0.61 in Germany, but above 1 in Italy, France, the United Kingdom and Sweden.
Throughout fall and early winter, Germany experienced similar death rates per 100,000 as other
countries. In Germany, and likewise for other countries, adults aged 60 and above have a considerably
higher risk of dying from the COVID-19 disease. They make up 94% of all deaths in Germany in our
study period.
Figure 4 shows daily SARS-CoV-2 cases per 100,000 over time by six age brackets for the
period of our empirical analysis. Strikingly, during the first wave of the pandemic in March and
April—when, for the most part, schools were closed due to general lockdown measures—infection
rates among children (aged 14 and below) were low, both in absolute terms and relative to other age
groups. In contrast, during the “second wave” of the pandemic in September and October—when
schools were open—infection rates among children rose at a similar pace to those of adults, although
infection rates continue to be lower among children than adults. The resulting increase in the share
of children among newly confirmed cases appears to coincide with the end of the summer school
holiday and has been linked to school openings by the press (The New York Times, 2020; Die ZEIT,
2020). The quasi-experimental variation in the school holiday dates in Germany offers a unique
27
These numbers are based on the data from the European Centre for Disease Prevention and Control (ECDC). According
to the RKI database (which our empirical analysis relies on), the peak of daily new cases and daily new deaths were both reached
on the April 2, 2020, with 7.88 reported cases per 100,000 inhabitants (6,553 overall) and 0.50 deaths per 100,000 (415 overall).
Note that the RKI database reports the date the deceased person was reported positive, and not the date of death.
12setting to investigate that relationship in a rigorous manner.
3 Methodology
We build on Adda (2016) and exploit the variation in the timing of summer and fall school
holidays across German states to isolate the impact of school closures and reopenings from other
factors on the spread of SARS-CoV-2. As outlined in Section 2.2, the schedule of school holidays
in 2020 was unaltered by the pandemic and did not coincide with other state-specific lockdown
measures. The German setting is particularly interesting in this context, since the variation in the
timing of both summer and, to a smaller extent, fall school holidays is larger than in other countries.
For identification, we rely on a difference-in-differences design with staggered adoption of
treatment. This methodology assumes that the true causal model for the outcome of interest reported
in district ' on day ) is
/!" = 1! + 2" + 3!" 4!" + 5!" . (1)
Here 1! and 2" capture the district and day fixed effects and 4!" = 1[) ≥ :! ] is the indicator that the
district is “treated” (i.e., schools have closed or reopened, depending on the analysis), where :! is the
day when district ' is treated. We separately consider three treatments: school closures and openings
in the summer and the closures in the fall. Further, 3!" captures the “treatment effect”—that is, the
impact of the school closures and openings on the spread of SARS-CoV-2—while 5!" is the residual
such that : [ 5!" ∣ 1! , 2" , 4!" ] = 0. The model in (1) incorporates the parallel trends assumption,
whereby the expected outcome absent the treatment is 1! + 2" . It also allows for heterogeneous
treatment effects by district and time, and thus by the number of days since treatment.
To characterize treatment effects, we use the “imputation estimator” of Borusyak et al. (2021).
A recent literature has shown that estimating equation (1) as a conventional event study, i.e. by
Ordinary Least Squares (OLS) with two-way fixed effects and some lags and leads of treatment,
produces estimates that are not reliable in presence of effect heterogeneity and potentially even have
a wrong sign.28 Several robust estimators have been recently proposed (e.g., de Chaisemartin and
D’Haultfœuille, 2020; Sun and Abraham, forthcoming). Relative to these estimators, the imputation
estimator possesses attractive efficiency properties, is transparent, and conservative standard errors
are available for it, which can be computed analytically.29
28
Borusyak and Jaravel (2017), de Chaisemartin and D’Haultfœuille (2020), Goodman-Bacon (2020), and Strezhnev
(2018) establish this result in slightly different ways.
29
We implement the analysis using the did_imputation Stata command provided by Borusyak et al. (2021).
13The imputation estimator is constructed in three steps. First, the district and day fixed effects
1! and 2" in equation (1) are estimated by OLS on the subsample of untreated observations only, i.e.
those with 4!" = 0. In the case of the school closures we, therefore, estimate 1! and 2" using the data
until the last day of school before the start of the holiday in each state. Second, we obtain an unbiased
estimate 3̂ !" = /!" − 1A! − 2B" for each treated observation. While treatment effects for each day and
district cannot be estimated consistently, Borusyak et al. (2021) show that averages of 3̂ !" across many
observations can, under appropriate regularity conditions. Any such average of interest can therefore
be reported in the third step. We focus here on the average effect a given number ℎ days since
treatment (ℎ ≥ 0):
$
3̂ # = |& | ∑!∈&! 3̂!,(" )# , (2)
!
where E# is the set of districts ' observed in period :! + ℎ.
For each horizon ℎ, the imputation estimator leverages all difference-in-differences contrasts
between some district ' in period :! + ℎ (i.e., on a day ℎ days after treatment) relative to periods
before treatment, ) < :! (reference periods), and relative to other districts which have not been
treated yet by :! + ℎ. This estimator is only available for ℎ < G, where G is the gap between the
earliest and latest event dates observed in the sample (six weeks in our case for summer holidays, or
five weeks with a reasonable sample size). This is in contrast to OLS estimates which are in principle
possible to estimate for any long horizons but may not be reliable: there are no difference-in-
differences contrasts that can directly identify those effects, and the estimates are obtained solely by
extrapolations appropriate only under constant treatment effects. We focus on the effects of the school
closures and openings in the summer up to three weeks after the beginning and end of the summer
holiday (i.e., for ℎ = 0, … ,20).
In our baseline specification, we define the outcome variable /!" as the number of confirmed
COVID-19 cases per 100,000 inhabitants in some age bracket. We distinguish between children aged
from 5 to 14 years old, whose infection risks may be directly reduced by school closures, and adults,
for whom the effects are indirect. Limited by our data, we consider three adult age groups: a group
of young adults between 15 and 34 years old; a group of middle-aged adults between 35 and 59 years
old, in which most parents of school-aged children will fall; and a group of vulnerable adults older
than 60 years of age. We also consider the number deaths per 100,000 inhabitants in the 60+ age
group only, since 94% of the deaths are concentrated in that group.
We start out by estimating the effects of the school closures in the summer on the spread of
SARS-CoV-2. To provide empirical support for the assumption of parallel trends, we follow
Borusyak et al. (2021) and estimate the regression on the set of untreated observations only:
14,$
/!" = 1! + 2" + I J+ 1[) = :! + K] + 5!" . ( 3)
+-,.
Here, 1[) = :! + K] are indicator variables of being treated 1 to M days later; we set M = 14. The
comparison group here includes all observations for which treatment happens more than P days later.
A conventional joint test of J+ = 0 is then performed, and the magnitude of JA+ can be visually
examined. It is important to note that this approach for pre-trend testing differs from the convention
where pre-trend or placebo coefficients are estimated jointly with the treatment effects 3̂ # . Borusyak
et al. (2021) explain three advantages of this approach. First, it clearly separates validation of the
design (i.e., of the ex-ante assumption of parallel trends) from estimation given the design. Second,
by imposing no pre-trends at the estimation stage, it improves efficiency of treatment effect
estimation: all untreated observations are used in the imputation. Third, it removes the correlation
between the treatment effect and the pre-trend estimators; such correlation introduces bias when the
researcher follows the conventional practice of trusting the results only conditionally on the pre-trend
test passing (Roth, 2020).
When turning to the effects of school reopenings in the summer, we additionally allow for
“anticipatory” effects of treatment present up to O days before treatment; we set O = 14. We do this
to allow for the possibility that SARS-CoV-2 infection rates may increase prior to school openings
due to travel returnees and increased testing. Families often return home in the last two weeks of the
summer holiday and typically spend their vacation in regions where infection rates were higher than
in Germany and were tested upon returning home. The imputation estimator extends directly to the
case of anticipation effects, with the treatment indicator redefined to switch to one O days before
treatment: 4!" = 1 [) ≥ :! − O]. We (re)estimate district and day fixed effects 1! and 2" in equation
(1) using only those observations that are assumed to be unaffected by the school opening treatment
(i.e., observations more than two weeks before the end of the summer school holiday). We also check
for “pre-trends” in a similar way as for school closures, by estimating equation (3) on a set of
untreated observations and by testing whether the J+ coefficients are individually and jointly equal to
zero.
It should be noted that when examining the effects of school reopenings on the spread of
SARS-CoV-2, we implicitly assume that the preceding school closures in the summer have had no
impact on SARS-CoV-2 infection rates. We explicitly investigate and provide empirical support for
this assumption in the first part of the empirical analysis, where we study the effects of summer school
closures on the spread of SARS-CoV-2.
15In the final step of the empirical analysis, we estimate the effects of fall holiday closures on
the spread of SARS-CoV-2. We consider anticipatory effects due to travelling behavior unlikely in
this context and therefore test for differential pre-trends in the 14 days prior to the start of the school
holiday (i.e., we set O = 0 and M = 14). As Panel B of Figure 1 shows, the difference in the start
dates of the fall holidays between states that introduced them first and last is four weeks (compared
to six weeks for the summer holidays), so that we could in principle estimate the effects of fall school
closures up to four weeks since the start of the fall holiday. However, the state in which fall holidays
started latest (Bavaria) appears to exhibit a different time trend in infection rates from other states
and thus is not a reliable control group. Hence, estimates for the impact of fall school closures on the
spread of SARS-CoV-2 beyond the first two weeks rest on a single state (Baden Wuerttemberg). We
therefore focus on effects in the first two weeks after the start of the fall holiday and do not consider
fall school closures and reopenings as separate events.
We probe the robustness of our results to alternative estimation methods including a
conventional event study and the de Chaisemartin and D’Haultfœuille (2020) estimator, and to the
inclusion of additional control variables in Section 4.4. We report standard errors clustered at the
level of NUTS-2 regions (“Regierungsbezirke,” 38 clusters) throughout the paper. Standard errors
clustered at the level of 16 states turn out to be smaller than standard errors clustered at the NUTS-2
level, prompting us to display the more conservative standard errors instead.
4 Empirical Findings and Discussion
4.1 The Effect of Summer School Closures on the Spread of SARS-CoV-2
The Impact of School Closures on Infection Rates among Children
We begin by examining the impact of the school closures induced by the summer holidays on
infection rates among school-aged children. In Panel A of Figure 5, we group states into six cohorts
according to their school summer holiday start date, ranging from June 20 (thick black line) to July
30 (thin green line), and display COVID-19 cases per 100,000 children, smoothed using a moving
average filter with three lags and three leads, from June 1 until schools reopen at the end of the
holiday. The vertical lines indicate the respective starts of the summer holiday. The infection rates
among children do not show systematic variation in the three weeks leading up to the summer holiday,
as well as the first three weeks of holiday.30 Panel A therefore already provides little descriptive
30
We acknowledge that the trajectories of infections are not literally parallel across cohorts, which may simply reflect
random noise or may be due to differential (persistent or transitory) trends. By using clustered standard errors, we take
into account the uncertainty in the estimates driven by such trends. In Section 4.4 we further show robustness to deviations
from parallel trends, such as allowing for controls that enter the no-treatment potential outcome.
16evidence to support the hypothesis that school closures helped bring down rates of infection among
children.
In Panel B of Figure 5, we plot the pre-trend estimates obtained from regression equation (3)
(the red squares) and “treatment” effects for three weeks following school closures, estimated by the
imputation method of Borusyak et al. (2021) according to equation (2) (the blue dots), together with
95% confidence intervals. The figure validates the empirical design: the pre-trend coefficients are
small and, with one exception, statistically insignificant from zero.31 Moreover, the figure confirms
the pattern observed in Panel A, namely that the school closures have had little impact on infection
rates: the treatment effects are small and typically statistically indistinguishable from zero.
We report the corresponding treatment effects averaged over the first three weeks of the
summer holiday in the first row of Table 1. The point estimate for the entire three-week period
is - 0.126 (column (4)), with a 95% confidence interval of [-0.335, 0.082]. Thus, taking the uncertainty
of the estimate into account, the lower bound of the confidence interval implies that the school
closures have – at best – prevented 0.335 infections per 100,000 children daily. This is a rather small
effect in terms of absolute magnitude. It should be noted, however, that the mean daily infection rate
of children in the week before the start of the summer holiday was also very low (0.680, see column
5 of Table 1).
The Impact of School Closures on Infection Rates among Adults
Next, we turn to the impact of the school closures on SARS-CoV-2 infection rates among
adults, where we distinguish between adults in the age ranges of 15-34, 35-59, and 60+. Figure 6
repeats the structure of Figure 5 for each of these groups, with rows (2) to (4) of Table 1 providing
the corresponding averages. Overall, they provide little support for the hypothesis that school closures
would help bring down infection rates. For example, the lower bound of the confidence interval for
the most vulnerable group of adults – the population older than 60 (row (4) and column (4) in Table
1) – signifies that school closures prevented at most 0.026 infections per 100,000 per day in this
group. As before, there is no evidence of pre-trends, although the precision of the pre-trend estimates
tends to be low.
In Figure 7 and in row (5) of Table 1, we repeat the analysis of deaths per 100,000. Here, we
restrict the analysis to adults aged 60 and above, the age category comprising 94% of all COVID-19
deaths in Germany. Not surprisingly, given our previous findings, there is no indication the closures
31
It should be noted that the F-test weakly rejects the hypothesis that coefficients are jointly equal to zero with a p-value
of 0.011. However, coefficients are sometimes below and sometimes above zero and do not exhibit a clear upward or
downward trend.
17helped prevent deaths.
To summarize, the summer closures appear to have had little impact on SARS-CoV-2
infections among children and adults. To put these results into perspective, it is important to bear
in mind that schools typically operated at lower capacity before the summer holiday. Moreover, in
the weeks before the start of the school holiday, SARS-CoV-2 infection rates were generally low
in all states, with an incidence of around 0.7 per 100,000 inhabitants per day. In such a situation, it
may not be surprising that school closures in the summer did not help reduce the infection rate
further.
4.2 The Effect of School Reopenings after the Summer Holidays on the
Spread of SARS-CoV-2
Having established that the school closures in the summer have had little impact on the spread
of SARS-CoV-2, we turn to the impact of school reopenings on infection rates. As we described in
Section 2.2, after the summer holiday schools started to operate at full capacity, although strict
hygiene rules and clear procedures specifying what to do in the event of a school outbreak were
introduced. The effects of the school closures and reopenings may therefore not be negatively
symmetric. Moreover, there may be “anticipation” effects of school reopenings at play, driven by
families returning from their vacation during the last two weeks or so of the summer holiday.
The Impact of School Reopening on Infection Rates among Children.
In Panel A of Figure 8, we display daily infection rates per 100,000 children, smoothed
using a moving average filter with three lags and three leads, from June 1 until the fall school
holiday started. The figure distinguishes between six groups of states with differing school
reopening dates, indicated by the vertical lines. A striking pattern emerges. Infection rates among
children systematically tend to increase in the two weeks before the end of the summer holiday and
decline shortly after schools have reopened.
We report treatment estimates based on the imputation method by Borusyak et al. (2021) in
Panel B of Figure 8, where we allow for two weeks of “anticipation effects” of school reopenings
(blue dots). The estimates confirm the pattern visible in Panel A: point estimates increase and are
statistically different from zero in the last two weeks of the summer holiday; they then decline from
the third day of schools being open and turn negative from the second week. Pre-trend estimates
prior to two weeks before schools reopened (red squares) are generally small in magnitude
(compared with the effects on and around the treatment date) and not statistically significant
18different from zero – in line with our findings that the school closures in the summer had little
impact on the spread of the SARS-CoV-2 virus in the child population.32
While the significant negative effects in the second and third weeks after school reopenings
may appear puzzling, we do not place much emphasis on this finding. The negative effects stem
from the two states which reopened their schools last (Baden Wuerttemberg and Bavaria, the thin
blue and green lines in Panel A of Figure 8), where cases seem to have increased four weeks before
the end of the holiday rather than two. Removing these two states from our sample in Panel C of
Figure 8 causes the negative effect to disappear and allows us to confirm the increase in cases before
reopening, which dissipates shortly after.33
The fact that SARS-CoV-2 infection rates among children start to increase before schools
reopen makes it highly unlikely that increased contact with other children, caused by the reopening
of schools, is responsible for the uptick in cases among children. In our view, the most plausible
explanation for the pattern of treatment effects relates to travel behavior. Families often spend their
summer holiday in areas where infection rates were higher than in Germany and traveling itself is
likely to increase the risk of infection. At the same time, the cost of testing was waived for returning
travelers on August 1 and testing became compulsory for travelers returning from high-risk
countries on August 8. Findings reported in a complementary paper by Isphording et al. (2020)
support this interpretation. Drawing on proprietary data on mobile phone usage, these authors show
that incoming mobility steadily grows during the last two weeks of the summer holiday and drops
to a lower and stable level once schools reopen (Appendix Figure A1 in their paper). Similar
patterns are not visible for outgoing mobility, supporting the association of this pattern with school
holidays.
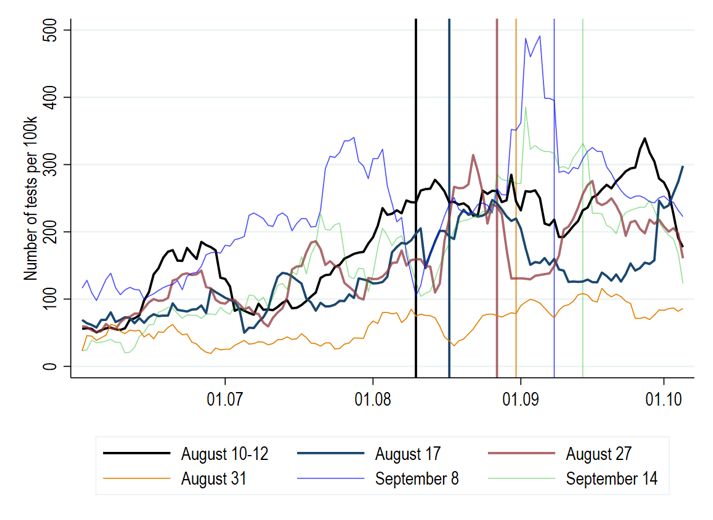
To provide further evidence on the reasons behind the increased infection rates before school
reopenings, we display the evolution of the (estimated) number of PCR tests per 100,000 inhabitants
in Panel A of Appendix Figure A1. Testing intensity tends to increase in the last two weeks of the
summer holiday, in line with both increased testing of asymptomatic travel returnees and increased
infections and symptoms among those returning from vacations. To distinguish between the two
explanations, Panel B plots the evolution of the share of positive cases. If broad testing is the key
mechanism, this share should decline before schools reopen, while if infections grow without a
special effort to test, the share of positive cases should grow. The figure does not show a visible
32
It should be noted, however, that the F-test rejects the hypothesis that coefficients are jointly equal to zero with a p-
value of 0.005, which is in part related to the patterns for late-treated states described below. Note that coefficients are
sometimes below and sometimes above zero and do not exhibit a clear upward or downward trend.
33
Removing these states from our sample reduces the time horizon over which treatment effects can be reliably estimated,
which is why we present treatment effects only up to 10 days before and after treatment.
19You can also read