Molecular analyses of triple-negative breast cancer in the young and elderly
←
→
Page content transcription
If your browser does not render page correctly, please read the page content below
Aine et al. Breast Cancer Research    (2021) 23:20
https://doi.org/10.1186/s13058-021-01392-0

 RESEARCH ARTICLE                                                                                                                                     Open Access

Molecular analyses of triple-negative breast
cancer in the young and elderly
Mattias Aine1, Ceren Boyaci2, Johan Hartman3, Jari Häkkinen1, Shamik Mitra4, Ana Bosch Campos1,
Emma Nimeus1,5, Anna Ehinger1,6, Johan Vallon-Christersson1, Åke Borg1 and Johan Staaf1*

  Abstract
  Background: Breast cancer in young adults has been implicated with a worse outcome. Analyses of genomic traits
  associated with age have been heterogenous, likely because of an incomplete accounting for underlying molecular
  subtypes. We aimed to resolve whether triple-negative breast cancer (TNBC) in younger versus older patients
  represent similar or different molecular diseases in the context of genetic and transcriptional subtypes and immune
  cell infiltration.
  Patients and methods: In total, 237 patients from a reported population-based south Swedish TNBC cohort
  profiled by RNA sequencing and whole-genome sequencing (WGS) were included. Patients were binned in 10-year
  intervals. Complimentary PD-L1 and CD20 immunohistochemistry and estimation of tumor-infiltrating lymphocytes
  (TILs) were performed. Cases were analyzed for differences in patient outcome, genomic, transcriptional, and
  immune landscape features versus age at diagnosis. Additionally, 560 public WGS breast cancer profiles were used
  for validation.
  Results: Median age at diagnosis was 62 years (range 26–91). Age was not associated with invasive disease-free
  survival or overall survival after adjuvant chemotherapy. Among the BRCA1-deficient cases (82/237), 90% were
  diagnosed before the age of 70 and were predominantly of the basal-like subtype. In the full TNBC cohort, reported
  associations of patient age with changes in Ki67 expression, PIK3CA mutations, and a luminal androgen receptor
  subtype were confirmed. Within DNA repair deficiency or gene expression defined molecular subgroups, age-
  related alterations in, e.g., overall gene expression, immune cell marker gene expression, genetic mutational and
  rearrangement signatures, amount of copy number alterations, and tumor mutational burden did, however, not
  appear distinct. Similar non-significant associations for genetic alterations with age were obtained for other breast
  cancer subgroups in public WGS data. Consistent with age-related immunosenescence, TIL counts decreased
  linearly with patient age across different genetic TNBC subtypes.
  Conclusions: Age-related alterations in TNBC, as well as breast cancer in general, need to be viewed in the context
  of underlying genomic phenotypes. Based on this notion, age at diagnosis alone does not appear to provide an
  additional layer of biological complexity above that of proposed genetic and transcriptional phenotypes of TNBC.
  Consequently, treatment decisions should be less influenced by age and more driven by tumor biology.
  Keywords: Triple-negative breast cancer, Age at diagnosis, Gene expression, Mutations, Mutational signatures,
  PD-L1, TILs, Patient outcome

* Correspondence: Johan.staaf@med.lu.se
1
 Division of Oncology, Department of Clinical Sciences Lund, Lund
University, Medicon Village, SE-22381 Lund, Sweden
Full list of author information is available at the end of the article

                                          © The Author(s). 2021, corrected publication 2021. Open Access This article is licensed under a Creative Commons Attribution
                                          4.0 International License, which permits use, sharing, adaptation, distribution and reproduction in any medium or format, as
                                          long as you give appropriate credit to the original author(s) and the source, provide a link to the Creative Commons licence,
                                          and indicate if changes were made. The images or other third party material in this article are included in the article's Creative
                                          Commons licence, unless indicated otherwise in a credit line to the material. If material is not included in the article's Creative
                                          Commons licence and your intended use is not permitted by statutory regulation or exceeds the permitted use, you will need
                                          to obtain permission directly from the copyright holder. To view a copy of this licence, visit http://creativecommons.org/
                                          licenses/by/4.0/. The Creative Commons Public Domain Dedication waiver (http://creativecommons.org/publicdomain/zero/1.
                                          0/) applies to the data made available in this article, unless otherwise stated in a credit line to the data.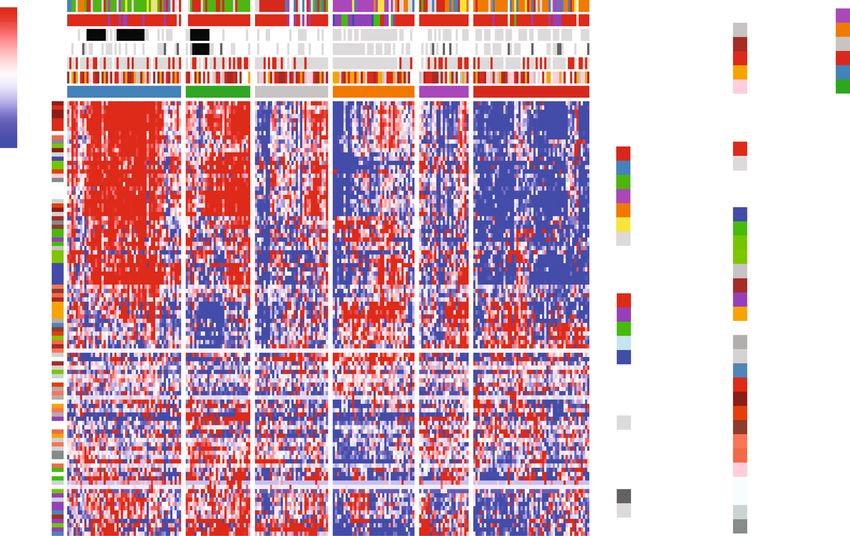
Aine et al. Breast Cancer Research   (2021) 23:20                                                              Page 2 of 19

Introduction                                                  Sweden [9]. To further generalize specific findings, we
Triple-negative breast cancer (TNBC; defined by ER, PR,       also analyzed an additional 560 reported WGS analyzed
and HER2/ERBB2-negativity) is a clinically defined sub-       cases representative of all molecular breast cancer
group of breast cancer, constituting approximately 10–        subtypes.
15% of cancers in Western countries. TNBC is over-
represented among younger women, African-American             Methods
women, and women with inherited mutations in high-            Ethics approval and consent to participate
penetrance breast cancer susceptibility genes [1, 2].         All included patients were enrolled in the Sweden Can-
TNBC tumors are highly heterogeneous on the molecu-           cerome Analysis Network – Breast (SCAN-B) study
lar level, involving differences in genetic features, germ-   (ClinicalTrials.gov ID NCT02306096) [22–24], approved
line alterations (e.g., BRCA1 mutations), DNA repair          by the Regional Ethical Review Board in Lund, Sweden
deficiency, epigenetic alterations, gene expression pat-      (Registration numbers 2009/658, 2010/383, 2012/58,
terns, but also morphological features [3–9]. Several of      2016/742, 2018/267, and 2019/01252) as previously de-
these features have been associated with prognosis and/       scribed [9]. All patients provided written informed con-
or therapy response in TNBC patients. Despite the over-       sent prior to enrollment. All analyses were performed in
representation in younger women, large registry studies       accordance with local and international regulations for
have suggested that young age (< 40 years) is not an in-      research ethics in human subject research.
dependent risk factor in women with TNBC when ad-
justed for other prognostic variables [10–14], in contrast    Unselected population-based TNBC cohort
to other breast cancer subgroups [15].                        A previously reported unselected population-based TNBC
   Previous studies have attempted to address the mo-         cohort comprised of 237 patients analyzed by RNAseq
lecular landscape of breast cancer in the context of pa-      and WGS formed the study material [9]. The cohort is
tient age [16–21], with the recent study by Ma et al.         hereafter referred to as SCAN-B. Clinicopathological char-
focusing specifically on TNBC [19]. Overall in breast         acteristics for included patients versus stratified age at
cancer, results concerning specific molecular traits or       diagnosis (10-year intervals, < 40, 40–50, 50–60, 60–70,
patterns associated with age at diagnosis appear hetero-      70–80, and ≥ 80 years) are summarized in Table 1. The
geneous. This may in part be due to inconsistent age          analyzed patient cohort has previously been shown to be
group definitions between studies and that highly se-         representative of the underlying healthcare population
lected cohorts have often been used for molecular ana-        from which it was recruited based on comparison with the
lyses. Concerning the latter, analyses have often not         Swedish national breast cancer quality registry (NKBC)
been performed within a relevant clinical subgroup or         [9].
molecular phenotype, or that appropriate adjustments
for other important clinical or molecular disease param-      Copy number and mutational analyses
eters have not been performed. As an example of the lat-      From existing WGS data [9], we extracted calls of copy
ter, an initial study by Anders et al. [21] reported          number alteration, tumor ploidy, loss of heterozygosity
transcriptional differences in breast cancer associated       (LOH), breast cancer driver gene mutation calls, and
with patient age that subsequently disappeared when           genome-wide mutational and rearrangement signatures
later correcting for clinical and proposed molecular sub-     [3, 9]. DNA promoter hypermethylation status for BRCA1
types [17]. Considering these common confounding fac-         and RAD51C were obtained from [9]. BRCA1-null,
tors, a more complete understanding of whether age at         BRCA2-null, and PALB2-null status was defined as either
diagnosis in breast cancer is intrinsically linked to spe-    a somatic or germline loss of function variant with LOH,
cific genetic, epigenetic, and transcriptional differences    or a loss of function germline mutation only [9]. BRCA1
requires studies to be performed in representative            deficiency was defined as either BRCA1-null or BRCA1
population-based cohorts that account also for the rele-      promoter hypermethylation, as these are mutually exclu-
vant underlying genetic and transcriptional phenotypes        sive and impart an identical genomic phenotype in TNBC
of TNBC.                                                      [25]. As estimates of homologous recombination defi-
   In the current study, we aimed to resolve whether          ciency (HRD), we used the WGS-based HRDetect [26]
TNBC in younger versus elderly patients represent simi-       and the copy number based HRD score (genomic scars)
lar or different molecular diseases in the context of pro-    [27] classifications available from [9]. In addition, we cal-
posed genetic and transcriptional TNBC subtypes. To           culated weighted genomic instability index scores [28],
this end, we used comprehensive whole-genome sequen-          and mutant-allele tumor heterogeneity scores [29] as out-
cing (WGS) data, RNA sequencing (RNAseq), and in              lined in original studies.
situ immunohistochemistry data from 237 TNBC pa-                 Mutational signatures were refitted for specific group
tients recruited from a population-based study in south       analyses using all substitutions with a PASS filter flag
Aine et al. Breast Cancer Research      (2021) 23:20                                                                        Page 3 of 19

Table 1 Patient characteristics and clinicopathological variables of the study cohorts
                                All      Patients   Patients    Patients    Patients    Patients    Patients   Statistical difference
                                patients < 40 years 40–50 years 50–60 years 60–70 years 70–80 years ≥ 80 years between age groupsE
N                               237       28           24       55           53          40           37
                      A
ER IHC % (1–10%)                12.3%     10.7%        16.7%    9.3%         15.1%       10.3%        13.5%     p = 1.0
Tumor size > 20 mm              49.4%     46.4%        37.5%    40.0%        50.9%       42.5%        78.4%     p = 0.09
Grade 3 (%)                     87.9%     96.3%        100%     94.3%        78.4%       80%          86.5%     p = 0.29
Median Ki67%                    70        87           78       70           70          58           60
Node positive (%)               34.6%     37.0%        29.2%    32.1%        34.0%       37.5%        37.8%     p = 1.0
Adjuvant chemotherapy (%)       72.8%     100%         100%     94.5%        84.9%       59.0%        0%        p = 4e−15
Outcome
    Death events (%)            26.6%     17.9%        0%       12.7%        32.1%       27.5%        62.2%     p = 3e−6
    IDFS events (%)             32.5%     25.0%        12.5%    16.4%        39.6%       35.0%        62.2%     p = 0.0007
    Distant metastases (%)      20.7%     21.4%        8.3%     14.5%        28.3%       20.0%        27.0%     p = 1.0
                           B
    BRCA1-germline (%)          8.0%      28.6%        4.2%     12.7%        1.9%        5.0%         0%        p = 0.003
BRCA1 status
    BRCA1-null C (%)            10.5%     32.1%        4.2%     16.4%        7.5%        5.0%         0%        p = 0.006
    BRCA1 hypermethylation (%) 24.1%      50.0%        41.7%    21.8%        28.3%       10.0%        5.4%      p = 0.001
                       D
    BRCA1 wildtype              65.4%     17.9%        54.1%    61.8%        64.2%       85%          94.6%     p = 2e−8
HRD status                                                                                                      p = 1e−6
    HRDetect-high (%)           58.6%     92.9%        83.3′%   67.3%        60.4%       27.5%        35.1%
    HRDetect-intermediate (%)   5.5%      0%           4.2%     5.5%         1.9%        5.0%         16.2%
    HRDetect-low (%)            35.9%     7.1%         12.5%    27.3%        37.7%       67.5%        48.6%
    PD-L1 positivity (%)        51.8%     65.4%        54.5%    62.7%        46.0%       40.0%        44.1%     p = 1.0
TILs (%)                                                                                                        p = 1.0
    < 30%                       61.5%     46.2%        40.9%    51.0%        73.5%       76.5%        69.7%
    30–50%                      17.8%     19.2%        31.8%    24.5%        10.2%       11.8%        15.2%
    > 50%                       20.7%     34.6%        27.3%    24.5%        16.3%       11.8%        15.2%
PAM50 subtypes (%)                                                                                              p = 0.001
    Basal-like                  79.9%     100%         95.7%    94.3%        73.5%       57.1%        63.9%
    HER2-enriched               14.7%     0%           4.3%     1.9%         16.3%       28.6%        36.1%
    Luminal A                   1.3%      0%           0%       0%           2.0%        5.7%         0%
    Luminal B                   0.4%      0%           0%       0%           0%          2.9%         0%
    Normal-like                 3.6%      0%           0%       3.8%         8.2%        5.7%         0%
TNBC subtypes (%)                                                                                               p = 0.22
    BL1                         20.2%     14.3%        26.1%    26.4%        20.4%       14.7%        16.7%
    BL2                         9.9%      10.7%        8.7%     11.3%        10.2%       5.9%         11.1%
    IM                          20.2%     25.0%        21.7%    28.3%        14.3%       17.6%        13.9%
    LAR                         13.0%     0%           0%       3.8%         16.3%       23.5%        30.6%
    M                           18.4%     17.9%        21.7%    18.9%        20.4%       8.8%         22.2%
    MSL                         6.3%      7.1%         13.0%    1.9%         4.1%        17.6%        0%
    UNS                         12.1%     25.0%        8.7%     9.4%         14.3%       11.8%        5.6%
IntClust10 subtypes                                                                                             p = 0.07
    1                           0.9%      0%           4.3%     0%           0%          0%           2.8%
    10                          64.7%     89.3%        87.0%    79.2%        57.1%       40.0%        44.4%
    3                           2.2%      0%           4.3%     1.9%         2.0%        5.7%         0%
Aine et al. Breast Cancer Research (2021) 23:20 Page 4 of 19
Table 1 Patient characteristics and clinicopathological variables of the study cohorts (Continued)
All Patients Patients Patients Patients Patients Patients Statistical difference
patients < 40 years 40–50 years 50–60 years 60–70 years 70–80 years ≥ 80 years between age groupsE
4 25.0% 3.6% 4.3% 17.0% 30.6% 40.0% 44.4%
5 0.9% 0% 0% 0% 2.0% 2.9% 0%
8 0.4% 0% 0% 0% 0% 2.9% 0%
9 5.8% 7.1.% 0% 1.9% 8.2% 8.6% 8.3%
Proportions calculated excluding missing data. Groups are defined as, e.g., ≥ 40 and < 50
A
Proportion of cases with an ER IHC staining of 1–10%, which is classified as ER-negative in Sweden
B
Germline alteration according to WGS analysis
C
BRCA1-null: germline and/or biallelic inactivation of BRCA1 determined by WGS
D
Patients that are not defined as BRCA1-null or show somatic BRCA1 promoter hypermethylation based on available data for the study
E
Chi-square test, with multiple testing correction by Bonferroni adjustment (n = 18 tests)
from the original study [9] using the latest version of was performed according to antibody instructions on
the SigFit algorithm [30] with default parameters, except immune cells by a board-certified breast cancer path-
for using 8000 iterations. Only the signatures reported ologist, using a ≥ 1% cut-off for positivity. Cases nega-
in our original WGS study [9] were refitted. Tumor mu- tive in both TMA cores were set to score 0. CD20
tational burden was calculated as the sum of somatic immunohistochemistry was performed on TMA slides
substitutions and indels per Mb sequence. Publicly avail- using the CD20 L26 clone (Dako/Agilent cat no
able mutational and copy number data from 560 breast M0755) with a 1:500 dilution incubated 30 min at room
cancers of all subtypes analyzed by WGS and RNAseq temperature. Deparaffinization and antigen retrieval
were obtained from Nik-Zainal et al. [3]. This cohort is was performed using the Dako PT-Link buffer. Staining
hereafter referred to as Nik-Zainal. was performed using the Dako Envision™ Flex K8010
kit in an Autostainer Plus (Dako/Agilent) instrument.
Gene expression analyses Scoring was performed by a breast cancer pathologist
Processed RNA sequencing data (fragments per kilo- into four groups (0,1,2,3) based on presence of stained
base million, FPKM) for 232 SCAN-B cases, including cells from low to high.
gene expression subtype classifications of PAM50 Tumor-infiltrating lymphocytes (TILs) were scored on
using a nearest centroid classifier (n = 224 obtained available whole section formalin-fixed paraffin-
from [31]), IntClust 10 (n = 224) [32, 33], and re- embedded hemotoxylin and eosin-stained slides by a
ported TNBC subtypes (n = 223) [6, 34] were obtained board-certified breast cancer pathologist and summa-
from [9, 31]. Supervised Significance Analysis of Mi- rized as a percentage per sample. Scoring was performed
croarrays (SAM) analysis was performed on FPKM according to the international consensus scoring recom-
data for the 232 cases after: (i) offsetting all FPKM mendations of the International Immuno-Oncology Bio-
values with + 0.1, (ii) log2 transformation, and (iii) marker Working Group on Breast Cancer (www.
mean-centering. Pathway analysis was performed tilsinbreastcancer.org). When multiple slides were avail-
using the PANTHER Classification System (http:// able, per patient scores were averaged. All pathology
pantherdb.org/geneListAnalysis.do) and the overrepre- scorings were performed blinded to downstream
sentation test application. Default settings were used, analyses.
and gene ontology terms with a false discovery rate
(FDR) adjusted Fisher’s exact test p < 0.05 were con- Neoantigen prediction
sidered significant. Principal component analysis was NeoPredPipe [37] was used to predict putative neoanti-
performed using the R swamp package (ver 1.5.1) and gens with substitution mutation calls provided by CaVE-
all available refseq genes [35]. RNAseq-based immune Man (https://cancerit.github.io/CaVEMan/) and HLA
cell deconvolution was obtained for 230 cases using typing done with Polysolver [38] as input, as detailed in
CIBERSORTx [36] as described [25]. Glodzik et al. [25].
PD-L1 and CD20 immunohistochemistry and tumor- Survival analyses and statistical methods
infiltrating lymphocyte scoring (TILs) Survival analyses were performed in R (ver 3.6.0) using
PD-L1 immunohistochemistry using the SP-142 anti- the survival package with overall survival (OS), invasive
body (Roche) was performed on a tissue microarray in- disease-free survival (IDFS), or distant relapse-free inter-
cluding 218 SCAN-B tumors (two 1 mm cores / tumor) val (DRFI), as endpoints defined according with the
on a Ventana instrument (Roche) according to the STEEP criteria [39]. Hazard ratios were calculated
manufacturer’s recommendations. PD-L1 assessment through univariable Cox regression and verified to fulfillAine et al. Breast Cancer Research (2021) 23:20 Page 5 of 19
assumptions for proportional hazards. Survival curves the estimated tumor cell content by WGS between the
were compared using Kaplan-Meier estimates and the six age groups that could explain the RNAseq observa-
log-rank test. Survival analyses were performed using tion (Kruskal-Wallis p = 0.15, Additional file 1F). Overall,
the 149 eligible cases (62.8%) from the 237-sample co- analysis of the molecular and clinicopathological features
hort treated with standard-of-care adjuvant chemother- listed in Table 1 revealed that the strongest associations
apy according to national guidelines (in 96% of cases a with the stratified age groups were related to BRCA defi-
FEC-based [combination of 5 fluorouracil, epirubicin, ciency, HRD, and PAM50 subtypes.
and cyclophosphamide] treatment ± a taxane). Full de-
tails on the exclusion criteria for outcome analysis and Age at diagnosis is not associated with outcome after
individual patient treatments are available in [9]. Trends adjuvant chemotherapy in TNBC
of decreasing or increasing estimates versus age at diag- To test the association of age at diagnosis with outcome
nosis were tested using linear regression modeling with after adjuvant standard-of-care chemotherapy, we ana-
age as a continuous variable. All p values reported from lyzed the 149 treated SCAN-B patients using OS, IDFS,
statistical tests are two-sided if not otherwise specified. and DRFI as clinical endpoints. Three different clinical
Box-plot elements corresponds to (i) center line = me- endpoints were assessed to provide the most compre-
dian, (ii) box limits = upper and lower quartiles, and (iii) hensive view, as both OS and IDFS include death from
whiskers = 1.5× interquartile range. other causes, for which higher age is a risk factor. For
this patient subset, the median age at diagnosis was 56
Data availability statement years (range = 27–76 years). Univariate Cox regression
Genomic data used in the current study is available in analysis using patient age (years) as covariate did not re-
open repositories as described in the original studies. veal significant hazard ratios for any of the three clinical
endpoints (Table 2). This non-significant finding was re-
Results peated also in HRD-high (HRDetect-high) patients, as
An outline of the study, including performed analyses well as HRD-low (HRDetect-low/intermediate) patients
and sample group sizes, is shown in Fig. 1. (Table 2). Univariate Cox regression using the six age
groups did also not show any statistically significant re-
Clinicopathological differences between young and old sults when tested using all chemotherapy-treated pa-
TNBC patients tients (all Cox regression p values > 0.05 for all clinical
In the SCAN-B cohort (n = 237), the median age at diag- endpoints).
nosis was 62 years with a range of 26–91 years. Clinico-
pathological and molecular characteristics for cases are Age at diagnosis in TNBC subgroups defined by BRCA1
summarized in Table 1 for patients stratified into six age and DNA repair deficiency
groups based on 10-year intervals; < 40, 40–50, 50–60, Younger patients showed higher proportions of BRCA1
60–70, 70–80, and ≥ 80 years. No statistical difference in germline alterations, BRCA1-null tumors, and
ER immunohistochemistry levels (< 1% stained cells ver- HRDetect-high tumors (a proxy for HRD) (Table 1).
sus 1–10% stained cells) was observed between the six Strikingly, in patients < 40 years, 82.1% had a BRCA1-de-
age groups (chi-square test p = 0.91, Table 1). This find- ficient phenotype (BRCA1-null tumor or somatic BRCA1
ing was supported by ESR1 gene expression levels promoter hypermethylation). In older patients, only 4.6%
(FPKM) that did also not show significant differences of patients ≥60 years had a BRCA1-null tumor, while
between the six groups (Kruskal-Wallis test p = 0.34, 16.2% showed BRCA1 promoter hypermethylation. For
Additional file 1A). Similarly, no statistically significant patients ≥ 70 years, corresponding values were 2.6% and
difference in ESR1 FPKM levels versus age groups were 7.8%. We have previously shown the genomic equiva-
found in patient subgroups defined by HRD status lency of the phenotypes associated with BRCA1 inactiva-
(HRDetect-high or low/intermediate) (Additional file 1A). tion by DNA methylation or mutations [25]. The higher
In contrast, Ki67 immunohistochemistry levels, as well proportion of hypermethylated cases in older patients
as Ki67 (MKI67) mRNA expression, were overall higher would suggest that a HRD phenotype brought on by epi-
in younger patients with a decreasing trend with increas- genetic silencing represents a more long-tailed process
ing age (Kruskal-Wallis p = 4e−05 and p = 0.0009, re- compared to the same phenotype induced by germline
spectively, Additional file 1B-C). When considering the alterations. However, clinical testing in known breast
genetic background of HR deficiency (HRD), this de- cancer families may bias this view. Among the 237
crease in Ki67 gene expression was, however, only statis- SCAN-B patients, 46 patients had undergone clinical
tically significant in HRDetect-low/intermediate patients germline screening with nine BRCA1 positive cases.
(Kruskal-Wallis p = 0.03, linear regression p = 0.09, Add- WGS analysis identified 10 additional cases with germ-
itional file 1D-E). There was no statistical difference in line BRCA1 alterations and also six cases with biallelicAine et al. Breast Cancer Research (2021) 23:20 Page 6 of 19 Fig. 1 Study scheme. a Analyses performed in the SCAN-B TNBC cohort together with investigated main sample groups. b Analyses performed in the external Nik-Zainal et al. [3] cohort together with investigated main sample groups. In both panels, sample size numbers for patient groups refer to the largest set of patients available for at least one of the specified analyses. Specific sample size numbers are provided in the detailed results and the “Methods” section. References to the main figures and tables presenting results are provided for each analysis. HRD+: HRDetect- high, HRD-: HRDetect-low, TILs: tumor-infiltrating lymphocytes, TMB: tumor mutational burden, CNA: copy number alteration, Lum A: Luminal A, Lum B: Luminal B
Aine et al. Breast Cancer Research            (2021) 23:20                                                                                               Page 7 of 19

Table 2 Results of univariate Cox regression survival analysis in patients treated with adjuvant chemotherapy
Subset of patients                 N        OS                                         IDFS                                      DRFI
All patients                       149      HR = 1.04, 95% CI = 0.996–1.078,           HR = 1.02, 95% CI = 0.991–1.05,           HR = 1, 95% CI = 0.967–1.036, p = 0.98
                                            p = 0.08                                   p = 0.18
HRDetect-high                      99       HR = 1.046, 95% CI = 0.989–1.106,          HR = 1.008, 95% CI = 0.968–1.049,         HR = 0.977, 95% CI = 0.928–1.028,
                                            p = 0.12                                   p = 0.71                                  p = 0.365
HRDetect-low/intermediate          50       HR = 1.0, 95% CI = 0.938–1.067,            HR = 1.003, 95% CI = 0.954–1.055,         HR = 0.983, 95% CI = 0.928–1.042,
                                            p = 0.99                                   p = 0.90                                  p = 0.565
OS overall survival, IDFS invasive disease-free survival, DRFI distant relapse-free interval, HR hazard ratio, CI confidence interval

somatic inactivation [9]. Due to small sample groups, it                                has been previously associated with higher age at diagnosis
could not be determined whether clinically screened pa-                                 and expression of, e.g., the androgen receptor (AR) [6, 19].
tients with germline BRCA1 alterations had different                                    Across age groups for all SCAN-B patients, AR gene expres-
clinicopathological characteristics or different variant                                sion increased with higher age (Kruskal-Wallis p = 0.025),
distribution compared to germline cases detected by                                     but the increase in expression was restricted to HRDetect-
WGS. While BRCA1 germline-screened patients were                                        low/intermediate cases when the analysis was substratified
notably younger (potentially due to participation in                                    (Kruskal-Wallis p = 0.07) (Additional file 1H). A similar re-
screening programs or presence of other unknown risk                                    sult was obtained when using a six-gene (AGR2, SLC44A4,
factors not known to this study), hypermethylated pa-                                   TBC1D9, FOXA1, GATA3, and CA12) breast cancer steroid
tients had similar age at diagnosis as BRCA1 germline                                   response module [40] (Kruskal-Wallis p = 0.01 across all pa-
and somatic patients detected by WGS (Add-                                              tients, p = 0.94 in HRDetect-high patients, and p = 0.02 in
itional file 1G). This suggests a potentially similar intrin-                           HRDetect-low/intermediate patients) (Additional file 1I). Ex-
sic pace of tumor development for hypermethylated and                                   clusion of LAR classified cases in HRDetect-low/intermediate
mutation inactivated cases deserving validation in larger                               cases further reduced the association for both AR gene ex-
cohorts. Figure 2a shows the cumulative summary of                                      pression and the steroid response module with patient age
BRCA1 inactivated cases by mutation or hypermethyla-                                    (Additional file 1H-I). Additionally, within the 29 LAR sub-
tion versus age. It illustrates that 80% of detected BRCA1                              typed samples, there was no statistical trend of changes in
alterations occur before the age of 65, and 90% of alter-                               AR mRNA expression with stratified patient age (Kruskal-
ations in patients ≤ 69 years. Similarly, for patient subsets                           Wallis p = 0.41) (Additional file S1H).
defined by DNA repair deficiency, patients with HRD-                                       In summary, we found that while a higher age at diag-
high tumors (assessed by HRDetect) showed a trend to-                                   nosis was significantly associated with steroid response
wards a younger age at diagnosis compared to non-HRD                                    module and AR expression as well as a non-HRD
patients (Fig. 2b).                                                                     phenotype, these observations are likely driven by these
                                                                                        samples belonging to the LAR molecular subgroup ra-
Transcriptional breast cancer subtypes versus TNBC                                      ther than age per se.
patient age
To investigate the impact of patient age on the overall tran-                           Age at diagnosis does not by itself represent a distinct
scriptional variation in TNBC, we first performed an un-                                gene signature in TNBC
supervised principal component analysis, including different                            To test whether an age-related gene expression signal
clinicopathological and molecular variables, and 19,102                                 exists in TNBC, we performed a supervised multiclass
refseq genes from 232 SCAN-B cases with matching gene                                   SAM analysis using the stratified age groups as class la-
expression data and classifications (Fig. 2c). Neither when                             bels and the top 10,000 most variable refseq genes in the
used as a continuous variable (years) or stratified into six age                        cohort as input. At a false discovery rate (FDR) of p =
groups could age strongly capture transcriptional variation in                          0.01, 1179 genes were differentially expressed between
the cohort. In contrast, we found that specific gene expres-                            the groups. Of these, 528 had a maximum median
sion subtypes in the PAM50, IntClust 10, and TNBC                                       absolute difference in log2 expression > 1 across all
(TNBCtype) classification schemes differed significantly be-                            groups, but only 76 had an absolute log2 expression dif-
tween age groups (Table 1) and appear to capture true tran-                             ference > 2, indicating that the significant transcriptional
scriptional variation (Fig. 2c). Cumulative subtype plots                               alterations detected between groups are in the lower
versus patient age further illustrate that non-basal-like                               fold-change range. Pathway enrichment analysis of the
(PAM50), IntClust 4 (IntClust 10), and the luminal androgen                             528 genes identified almost exclusively cell cycle-related
receptor (LAR) (TNBCtype) subtypes are predominantly ob-                                gene ontology biological processes (Additional file 2).
served in older TNBC patients, increasing rapidly in patients                           This is consistent with the previous observation of dif-
aged 60 or more (Fig. 2d–f). Consistently, the LAR subtype                              ferent Ki67 expression levels across the age groups.
Aine et al. Breast Cancer Research (2021) 23:20 Page 8 of 19 Fig. 2 (See legend on next page.)
Aine et al. Breast Cancer Research      (2021) 23:20                                                                                     Page 9 of 19

 (See figure on previous page.)
 Fig. 2 Patient age versus BRCA1 deficiency and gene expression subtypes in TNBC. a Cumulative proportion of patients with BRCA1 deficiency
 (BRCA1 hypermethylation or BRCA1-null tumors) and non-BRCA1-deficient patients versus age at diagnosis. Red triangles indicate age at diagnosis
 for 50%, 80%, and 90% of BRCA1-deficient patients. b Cumulative proportions of patients in HRDetect groups versus age at diagnosis. c Principal
 component analysis of gene expression data for 232 SCAN-B cases using 19,102 RefSeq genes and different molecular and clinicopathological
 factors, including age at diagnosis (years: Age) and stratified age groups (10-year intervals: Age groups). d Cumulative proportions of PAM50
 subtypes versus age at diagnosis. e Cumulative proportions of IntClust 10 subtypes versus age at diagnosis. f Cumulative proportions of
 TNBCtype subtypes versus age at diagnosis. g Heatmap of 1179 genes differentially expressed between six 10-year interval age groups in 232
 SCAN-B cases. Hierarchical clustering of cases (columns) and genes (rows) were performed using Pearson correlation as distance metric and
 ward.D linkage on mean-centered log2 transformed data with an offset of 0.1. The six top clusters were identified and labeled. MKI67: Ki67.
 Steroid response: Scores according to the steroid response metagene [40]. h From left to right: Estimations of tumor cell content from WGS
 (ASCAT method), epithelial, stromal, B cell lymphocyte, and endothelial cell proportions from CIBERSORTx versus the hierarchical clusters in g. For
 age group definitions, “[” equals ≥, “)” equals  0.05 for both tests in subgroups) (Additional file 1
infiltration estimates, and neoantigen expression and                        N). We observed a decreasing trend of TILs assessed
tumor mutational burden (TMB) estimates from WGS.                            from whole-slide sections with age at diagnosis (n = 213,
Analyses were performed in the complete SCAN-B co-                           Kruskal-Wallis p = 0.001 and linear regression modeling
hort, HRDetect-high cases only, HRDetect-low only, and                       p = 0.0001) (Fig. 3c). This trend remained significant
PAM50 basal-like cases (other molecular subtypes were                        when stratifying TIL evaluable cases into HRDetect-high
not large enough to allow 10-year age binning).                              (n = 126, p = 0.008 and p = 0.001, respectively) and
  For CIBERSORTx, which estimates proportions of six                         PAM50 basal-like (n = 165, p = 0.051 and p = 0.001, re-
cell types (epithelial, macrophage, stroma, T and B cell,                    spectively), but not in HRDetect-low/intermediate cases
and endothelial), stratified age group testing (Kruskal-                     (Fig. 3c). To further analyze the difference in immune
Wallis test) combined with linear regression modeling                        cell infiltration, we compared tumor mutational burden
for trend (increase/decrease) showed that only the esti-                     and expressed neoantigens modeled from somatic sub-
mated B cell proportion per sample appeared to decrease                      stitutions versus patient age. For tumor mutational bur-
with patient age in tested subgroups (albeit with a non-                     den, there was no consistent change in the number of
significant trend for HRDetect-low/intermediate cases)                       substitutions and indels per Mb sequence between age
(Fig. 3a). To test whether these observations could be                       groups that was matched with a significant trend
Aine et al. Breast Cancer Research   (2021) 23:20   Page 10 of 19

 Fig. 3 (See legend on next page.)
Aine et al. Breast Cancer Research (2021) 23:20 Page 11 of 19
(See figure on previous page.)
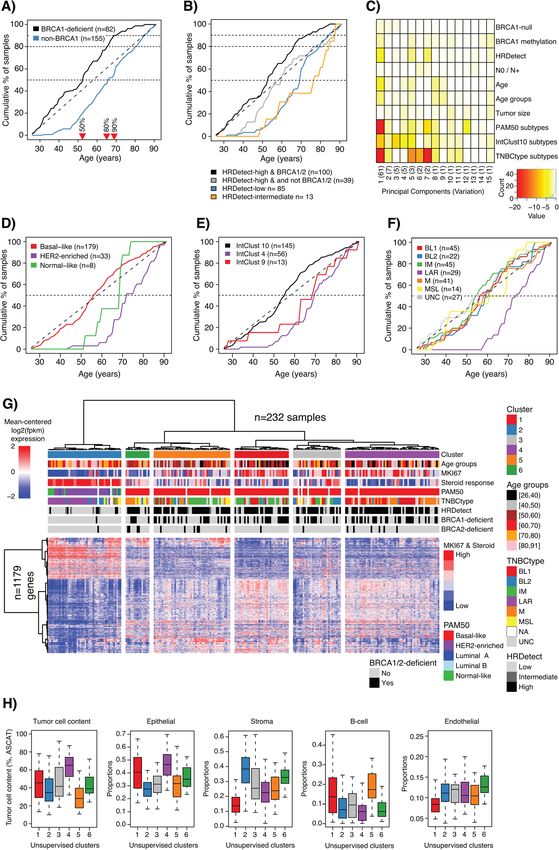
Fig. 3 Immune cell landscape of TNBC with respect to age at diagnosis. a CIBERSORTx estimated B cell proportions per sample versus stratified
age groups in all cases (left), HRDetect-high, HRDetect-low, and PAM50 basal-like cases (right). Top axes indicate group sizes. Two-sided p values
calculated using Kruskal-Wallis test. Linear regression modeling showing p value and slope coefficient (k) when using B cell proportion and
continuous age in the model. b Heatmap of 102 immune cell marker genes in 232 SCAN-B cases using Pearson correlation and ward.D linkage.
Hierarchical clustering of cases (columns) and genes (rows) was performed using Pearson correlation as distance metric and ward.D linkage on
mean-centered log2 transformed data with an offset of 0.1. c TIL percentage estimated from whole-slide hemotoxylin and eosin-stained sections
versus stratified age groups in all cases (left), HRDetect-high, HRDetect-low, and PAM50 basal-like cases (right). Top axes indicate group sizes.
Two-sided p values calculated using Kruskal-Wallis test. Linear regression modeling showing p value and slope coefficient (k) when using TIL
percentage and continuous age in the model. For age group definitions, “[” equals ≥, “)” equals 70-year cohort and the
p > 0.05 and linear regression modeling p > 0.05, Add- LAR-classified patients showed more copy number simi-
itional file 1O). Similarly, no significant results were larities with basal-like tumors than luminal B-like cases
obtained for the number of expressed neoantigens per (Additional file 3C).
sample when modeled using the NeoPredPipe pipeline Finally, we analyzed whether the frequency of reported
for the same patient groups (Additional file 1P). amplifications and driver mutations in breast cancer [3]
differ between the age groups in the total SCAN-B co-
Difference in copy number alterations and driver hort. With higher age, trends of increasing amplification
mutations between young and elderly TNBC patients frequencies of CCND1, CCNE1, EGFR, and increasing
To analyze the copy number landscape of TNBC with mutation frequency of PIK3CA mutations were ob-
respect to age at diagnosis, we first calculated and com- served, while frequencies of MCL1 amplifications and
pared (i) the fraction the of genome affected by copy TP53 mutations decreased (Fig. 4b, c). The alterations
number gain or loss, (ii) the fraction the of genome af- are however also significantly associated with HR status
fected by LOH, (iii) weighted genome integrity index es- as well as PAM50 and TNBC subtypes (Fig. 4d, e). Un-
timates [28], (iv) mutant-allele tumor heterogeneity fortunately, the low number of amplified samples per
scores [29], and (v) the individual components of the age group precluded robust age stratified analysis within,
HRD score algorithm (LST, AI, HRD) [27]. With excep- e.g., HRD phenotypes.
tion of the HRD score, there was no statistical difference
for the different estimates in (i) all SCAN-B patients, (ii)
HRDetect-high cases only, (iii) HRDetect-low cases only, Mutational and rearrangement signatures versus patient
or (iv) PAM50 basal-like cases when stratified by age age
groups (Kruskal-Wallis p > 0.05, linear regression model- To provide a composite view on clinical characteristics,
ing for trend p > 0.05, Additional file 1Q-T). For the gene expression subtypes, driver alterations, HRD status,
HRD score components, decreasing trends with age were and mutational and rearrangement signatures, we
observed across all cases as well as the PAM50 basal-like merged data for the 237 SCAN-B cases, subdivided by
group (Additional file 1 U). These observations can, HRDetect and BRCA status and ordered by age at diag-
however, be explained by that these patient groups are nosis (Fig. 5a). Interestingly, Fig. 5a illustrates that con-
mixtures of HRD-high and HRD-low cases as previously cordance between HRD algorithms appear to decrease in
shown [9]. patients without BRCA1/2 deficiency. For instance,
Overall, age at diagnosis does not appear associated across all 237 cases, agreement in HRD classification
with the overall amount of copy number alterations in (high/low) between HRDetect and HRD score [27] was
TNBC tumors. Illustrations of this are shown in Fig. 4a 83%, 94% in BRCA1/2-deficient cases, but only 74% in
for HRDetect-high patients younger than 50 years (n = patients with no known BRCA1/2 deficiency. This differ-
46) versus HRDetect-high patients older than 70 years ence is likely due to the tuning of the methods’ cut-offs
(n = 24) and in Additional file 3A-B, both showing simi- and that the WGS-based HRDetect method captures
lar copy number landscapes between the groups. Con- additional levels of information compared to the copy
sidering the previously described association of older age number based HRD score. For patients with no known
at diagnosis with the LAR gene expression subtype BRCA1/2-deficiency, HRD agreement varied between 65
(Fig. 2, Table 1, and [6]), we compared the copy number and 81% across age groups (median = 75%, standard
landscape between older SCAN-B patients (> 70 years), deviation 6%).Aine et al. Breast Cancer Research (2021) 23:20 Page 12 of 19 Fig. 4 Copy number alterations versus age at diagnosis in TNBC. a Copy number landscape of HRDetect-high patients < 50 years at diagnosis versus > 70 years at diagnosis. b Difference in amplification frequency of CCND1, CCNE1, EGFR, and MCL1 with age groups when analyzed in the total SCAN-B cohort. Two-sided p values calculated using chi-square test for trends in proportions. c Difference in mutation frequency of PIK3CA and TP53 with age groups when analyzed in the total SCAN-B cohort. Two-sided p values calculated using chi-square test for trends in proportions. d Proportions of amplified cases for CCND1, CCNE1, EGFR, and MCL1 according to HRDetect classification. e Proportions of mutated cases for PIK3CA and TP53 according to HRDetect (left), PAM50 (center), and TNBCtype (right) classifications. For age group definitions, “[” equals ≥, “)” equals
Aine et al. Breast Cancer Research   (2021) 23:20   Page 13 of 19

 Fig. 5 (See legend on next page.)
Aine et al. Breast Cancer Research       (2021) 23:20                                                                                        Page 14 of 19

 (See figure on previous page.)
 Fig. 5 Composite view of molecular and genetic phenotypes versus age at diagnosis in TNBC. a Integrative view of gene expression subtypes
 (PAM50 basal-like, LAR, IntClust 4, 10), HRD classification, BRCA1, BRCA2, PALB2, RAD51C, MCL1, CCND1, CCNE1, EGFR, PIK3CA, and TP53 alterations,
 mutational signatures (S1-S26), rearrangement signatures (RS1-RS6), patterns of insertion, and deletions versus age groups stratified by an
 underlying BRCA1 deficiency, BRCA2 deficiency, and HRDetect classification. BRCA1-null, BRCA2-null, and PALB2-null imply biallelic loss of the gene
 based on WGS. b Illustration of signature patterns in BRCA1-deficient tumors (light gray) and HRDetect-low/intermediate cases (white) stratified by
 age for proportion of insertions (left), rearrangement signature 6 (RS6, center), and mutational substitution signature 3 (S3, right, refitted by SigFit).
 RS6 is characterized by clustered rearrangements typically found in cases with driver amplifications, while S3 is associated with BRCA1/2 deficiency
 [41]. Top axes indicate group sizes. Top axes indicate group sizes. Two-sided p values are calculated by Kruskal-Wallis test per group. For age
 group definitions, “[” equals ≥, “)” equals  0.01)                      to account for underlying genetic HRD-high or low/
(Fig. 5b and Additional file 4B-D). These non-significant                       intermediate phenotypes), as well as basal-like, luminal
results were further supported by linear regression mod-                        A and B subtype-classified cases.
eling of proportions as a function of age (p > 0.01) (Add-                         When comparing the different signature proportions
itional file 4E-F). The significance of the underlying                          stratified by age groups (statistically evaluated by
genetic phenotype(s) was further evident when perform-                          Kruskal-Wallis’s test) or using linear regression model-
ing the same analyses for the PAM50 basal-like, IntClust                        ing of signature proportions as a function of age, only
10, and TNBCtype gene expression subtypes (mainly the                           three significant observations were made across the pa-
BL1 subtype). Here, typical features of HRD [26], such                          tient subgroups after Bonferroni correction for multiple
as the proportion of deletions with junctional microho-                         testing (summarized in Additional file 6 and shown in
mology, mutational signature 3 proportions, and re-                             detail in Additional file 7A). Significant associations were
arrangement signature 3 proportions, decreased with                             all based on linear regression modeling, with corre-
increasing patient age (Additional file 4G-I). However,                         sponding age group stratifications not reaching signifi-
these observations may be explained by the PAM50                                cance     after   adjustment      for    multiple     testing
basal-like, IntClust 10, and TNBCtype basal-like (BL1                           (Additional file 7A). Significant associations included an
and BL2) gene expression subtypes being mixtures of                             increase of insertions with patient age in PAM50 basal-
both HRD-high and HRD-low cases as shown in [9] and                             like cases and increases of mutational signature 5 pro-
of the four genetic subtypes in Fig. 5a as shown in Add-                        portions with age in PAM50 basal-like and luminal A
itional file 5A. Similar to the total cohort (Fig. 2c), age at                  cases. For the two mutational signatures (signatures 1
diagnosis did not capture transcriptional variation in the                      and 5) previously associated with age at diagnosis [42],
Aine et al. Breast Cancer Research   (2021) 23:20                                                               Page 15 of 19

signature 5 appeared most consistent with increasing            features, trends of increasing/decreasing proportions
proportions with higher age across tested subgroups             may be observed in the total cohort and even across dif-
(Additional file 7B). Based on the copy number data             ferent transcriptional subtypes (PAM50, IntClust10, and
available for the Nik-Zainal cohort, we could also con-         TNBCtype) if one does not acknowledge that these rep-
clude that the proportion of the tumor genome affected          resent mixtures of genetic phenotypes.
by copy number gain or loss and the proportion of                  For mutational and rearrangement signatures, tumor
the genome affected by LOH did not differ for the differ-       mutational burden, mutant-allele tumor heterogeneity
ent patient subsets listed in Table 2 in an age-related         scores [29], and the fraction of the genome affected by
fashion. This held true irrespective of whether the ana-        copy number alterations, patient age did not appear as-
lysis was performed using stratified age groups or linear       sociated with consistent decreasing/increasing trends
regression modeling (Additional file 7C).                       when accounting for the genetic background of the
                                                                tumor. Thus, for these genome-wide characteristics,
Discussion                                                      TNBC tumors appear shaped by specific mutational pro-
In the current study, we tested the hypothesis that             cesses like DNA repair deficiency rather than age at
TNBC in young and old breast cancer patients repre-             diagnosis. A similar conclusion was reached in ER-
sents different molecular entities in the context of            positive disease based on analysis in the Nik-Zainal data-
underlying genomic phenotypes, based on integration of          set. Moreover, despite the apparent lack of HR defi-
multiple layers of genomic profiling by state-of-the-art        ciency (as defined by [26, 27]) in older TNBC patients
sequencing techniques and in situ analysis of immune            (including LAR subtype cases), these still resembled
cell infiltration, CD20, and PD-L1 expression.                  basal-like breast cancer more than, e.g., ER-positive lu-
   Above all, our study demonstrates the importance of          minal B disease with respect to genome-wide copy num-
analyzing age-related alterations in TNBC, as well as           ber alterations (Additional file 3), albeit with an increase
breast cancer in general, in the context of underlying          of amplification drivers and PIK3CA mutations as previ-
genomic phenotypes. Considering the molecular hetero-           ously noted [19]. Concerning the latter, the small num-
geneity of TNBC, this may appear self-evident, but has          ber of affected cases unfortunately precludes a
not previously been reported in a population-based co-          conclusive statement of whether such specific alterations
hort comprehensively profiled on as many levels as in           are associated with age at diagnosis within a specific
the current study. In TNBC, the importance of a com-            genetic or transcriptional TNBC subtype. The clearest
prehensive approach is particularly highlighted by the          exceptions for mutational signatures involved the two
genetic phenotypes caused by DNA repair deficiency,             signatures previously associated with patient age at diag-
foremost BRCA1/2-deficiency that confers a characteris-         nosis (mutational signatures 1 and 5 often referred to as
tic HRD phenotype. Despite the size of the current study        “clock” signatures) [42]. In both SCAN-B and the Nik-
some limitations are apparent for specific subgroup ana-        Zainal WGS data, signature 5 showed the most trend-
lyses. This applies primarily to HRDetect-low/intermedi-        like pattern of increasing mutational proportion with pa-
ate patients where the stratified group sizes for younger       tient age. Interestingly, trends (estimated by regression
patients (< 50 years) are small and care needs to be taken      coefficients) for both signatures appeared different
in interpretation of their characteristics. To address this,    across molecular subgroups, raising the question of
sensitivity analyses are provided for features reported in      whether the replicative “clock” has different rates in
Additional file 1 and Fig. 3a, c. In this study we show         breast cancer subgroups, or alternatively is affected by
several examples for which trends appear significantly          conditions like replication stress.
associated with age at diagnosis in general and even               While younger TNBC patients predominantly present
within/between molecular subtypes, but where substrati-         with a typical basal-like transcriptional subtype (PAM50:
fied analyses reveal that the significance is restricted to a   basal-like, IntClust10: cluster 10), exceptions exist
specific genomic phenotype. One such example is the             (Table 1). With increasing patient age, non-basal-like
Ki67 proliferation marker, for which levels have been re-       subtypes gain in proportion, illustrated by the LAR sub-
ported to be lower in elderly patients [14, 19]. This is in     type originally proposed by Lehmann et al. [6] and the
agreement with our findings in the full SCAN-B cohort,          IntClust10 cluster 4 subtype proposed by Curtis et al.
but when stratified by HRD status, the decrease appears         [32] (Fig. 2). Still, these non-basal-like subtypes only rep-
restricted to HRD-low/intermediate cases and not to             resent a subset of elderly patients as also noted by Ma
HRD-high or BRCA1/2-deficient cases. Other examples             et al. [19] (Table 1). The heterogeneity in gene expres-
include genome-wide mutational and rearrangement sig-           sion subtype classification across age groups was further
natures, HRD score [27] components indicative of large-         illustrated by both unsupervised and supervised analyses.
scale transitions and allelic imbalance, specific copy          The latter identified a weaker gradient-like signal of
number alterations, and driver mutations. For these             tumor proliferation consistent with Ki67 differences [14,
Aine et al. Breast Cancer Research (2021) 23:20 Page 16 of 19 19] and findings by Ma et al. [19]. However, when age- mediated immune function as well as reduced humoral related differentially expressed genes were used to clus- immune responses, including reduction of mature B ter samples, the obtained clusters recapitulated the pri- cells, is well-established in healthy human subjects [51]. mary biological subdivision of HRD-positive and basal- The clinical significance of patient age in TNBC remains like TNBCs from HRD-negative, less-proliferative, and controversial [10–14]. In our cohort, long-term outcome non-basal-like tumors (Fig. 2g). Moreover, it is mainly after adjuvant chemotherapy was not associated with age at within the HRD-low/intermediate genetic phenotype diagnosis. It needs to be acknowledged that elderly patients that a steroid/androgen-driven transcriptional subtype in our cohort often did not receive adjuvant chemotherapy appears in a subset of elderly patients, which also coin- due to national guidelines and regional practice at the time, cided with differences in tumor microenvironment cell representing a potential source of bias. Based on that the composition (e.g., higher stromal content, Fig. 2h). genetic features of, e.g., BRCA deficiency and HRD (which While TNBC-specific subtypes (e.g., [4, 6, 43, 44]) have both appear prognostic after adjuvant chemotherapy treat- been associated with tumor and microenvironment char- ment [9, 25]) do not change with age, it may be argued that acteristics [5, 45], it remains unclear if these sub- withholding treatment based on age alone could for some types are all tumor intrinsic or whether the observed patients at least be reconsidered. Moreover, for a subset of differences are more reflective of the tumor microenvir- HRD-negative elderly patients with mainly the LAR subtype onment. Taken together, our results demonstrate that alternative therapies like anti-androgens may be considered age at diagnosis by itself does not define the transcrip- [52, 53]. In contrast, while young age at diagnosis is tional or genetic landscape of TNBC. strongly associated with HRD (Table 1), it appears particu- An observation that appeared more consistent also in larly important to identify young/middle aged patients different genetic backgrounds was a trend of decreasing without an HRD phenotype, as these may derive greater TIL counts with patient age (Fig. 2 and Add- benefit from other types of treatment than conventional itional file 5E). The analysis is however limited by a low chemotherapy. In this context, our observation of a greater number of cases in certain age groups and thus requires discrepancy between HRD methods for particularly non- additional validation especially for subgroups defined by, BRCA1/2-deficient patients becomes a relevant issue to e.g., HRD status. This observation has been reported be- consider for the choice of HRD classification method in a fore in both TNBC and, e.g., lobular breast carcinoma diagnostic setting (Fig. 5a). [46, 47]. Interestingly, in our cohort, the TIL decrease From a genetic perspective, TNBC represents at mini- was not mirrored by clear linear decreases of lymphocyte mum two types of disease, a DNA repair-deficient dis- PD-L1 expression, tumor mutational burden, number of ease with genetic scars strongly associated with BRCA1/ expressed neoantigens, or an immune-associated tran- 2 deficiency and a basal-like phenotype, and a second scriptional signature in unsupervised and supervised entity in which there is a larger heterogeneity concern- gene expression analyses. Immune infiltration in breast ing transcriptional subtypes [9]. For genetic subtypes (il- cancers has been suggested to be T cell predominant lustrated by the decline of BRCA1 deficiency), a switch [48] and with prognostic associations [49]. But the is apparent at 60–70 years of age coinciding with the underlying causes of the infiltration and the heterogen- median age of diagnosis of ER+ disease. Considering eity between tumors remains largely unknown. Loi et al. previous studies, it has been hypothesized that molecular identified increasing TIL levels with high histological differences between younger and older women may be grade in TNBC suggesting genomic instability as a pos- more related to the differences in the tissue microenvir- sible trigger [47, 50]. However, in our data, older onment of a pre-menopausal and post-menopausal pa- HRDetect-high patients with generally lower TIL levels tient rather than intratumoral biological differences [15]. had no signs of a less unstable genome compared to A limitation is however that we are currently unable to younger patients, and no trends of different in silico esti- assess at which time and in which cell type a tumor mated T cell proportions in all patients or analyzed sub- forms, representing an intriguing but challenging re- groups were observed. A weaker trend of decreasing B search area. Moreover, strong associations with specific cell proportions, based on in silico deconvolution of microenvironmental, transcriptomic, and genetic pheno- RNAseq data and in situ immunohistochemistry analysis type in addition to patient age for certain subgroups, of CD20 expression, with increasing patient age was ob- e.g., the LAR subtype, make definitive conclusions re- served. This observation warrants confirmation in larger garding causality challenging. An additional caveat with materials, especially for subgroups based on HRD status a population-based cohort such as ours is the influence due to small sample sizes. Moreover, how this B cell of screening, particularly if biased towards specific high- trend is associated with the TIL decrease in tumor tissue risk groups such as families with known hereditary risk remains to be further examined. Notably, age-related factors for breast cancer. In most cases however, excep- immunosenescence characterized by a decrease in cell- tions exist wherein features of old patients’ tumors
Aine et al. Breast Cancer Research         (2021) 23:20                                                                                           Page 17 of 19

present in a young patient and vice versa, arguing in                            JVC and JH. JS and MA drafted the manuscript. All authors read and ap-
favor of the primacy of tumor-intrinsic rather than                              proved the final manuscript.

patient-level characteristics in tumor evolution.
                                                                                 Funding
                                                                                 Financial support for this study was provided by the Swedish Cancer Society
                                                                                 (CAN 2018/685 and a 2018 Senior Investigator Award [JS]), the Mrs. Berta
Conclusions                                                                      Kamprad Foundation (FBKS-2018-4-146 and 2020-5-282), the L2 Bridge Bil-
Our study demonstrates that in TNBC, age at diagnosis                            tema Foundation, the Mats Paulsson Foundation, the Crafoord Foundation
alone does not appear to provide an additional layer of                          (grant 20180543), the National Society of Breast Cancer Associations in
                                                                                 Sweden, the Swedish Breast Cancer Group (SweBCG), the Swedish Research
biologic complexity above that of proposed genetic and
                                                                                 Council, BioCARE a Strategic Research Program at Lund University, the Gustav
transcriptional phenotypes. It may thus be argued that                           V:s Jubilee Foundation, the research foundation at Department of Oncology
decisions regarding treatment regimens should be less                            in Lund, Region Skåne Regional funds, and Swedish governmental funding
                                                                                 (ALF, grant 2018/40612). Open Access funding provided by Lund University.
influenced by age and more driven by actual tumor biol-
ogy that needs to be carefully assessed through modern                           Availability of data and materials
molecular diagnostics.                                                           Genomic data used in the current study is available in open repositories as
                                                                                 described in the original studies.

Supplementary Information                                                        Ethics approval and consent to participate
The online version contains supplementary material available at https://doi.     All included patients were enrolled in the Sweden Cancerome Analysis
org/10.1186/s13058-021-01392-0.                                                  Network – Breast (SCAN-B) study (ClinicalTrials.gov ID NCT02306096) [22–24],
                                                                                 approved by the Regional Ethical Review Board in Lund, Sweden
 Additional file 1. A PDF file with supplementary Figure 1 showing               (Registration numbers 2009/658, 2010/383, 2012/58, 2016/742, 2018/267 and
 different associations of molecular and clinicopathological variables with      2019/01252) as previously described [9]. All patients provided written
 patient age at diagnosis.                                                       informed consent prior to enrolment. All analyses were performed in
                                                                                 accordance with local and international regulations for research ethics in
 Additional file 2. A Microsoft Excel file (.xlsx) including supplementary
 Table 1 showing PANTHER gene ontology results for supervised SAM                human subject research.
 analysis.
                                                                                 Consent for publication
 Additional file 3. A PDF file with supplementary Figure 2 showing copy
                                                                                 Not applicable.
 number alterations in subgroups of TNBC.
 Additional file 4. A PDF file with supplementary Figure 3 showing
                                                                                 Competing interests
 mutational and rearrangement signatures in SCAN-B TNBCs.
                                                                                 The authors declare that they have no competing interests with exception of
 Additional file 5. A PDF file with supplementary Figure 4 showing               Johan Hartman who has received speakers’ honoraria and travel support
 molecular characteristics of genetic subtypes of SCAN-B TNBCs related to        from Roche, advisory board fees from MSD, Novartis, and Roche, and
 the main Fig. 5.                                                                institutional research grants from Cepheid and Novartis, and is the co-
 Additional file 6. A PDF file including supplementary Table 2 showing           founder and shareholder of Stratipath AB.
 patterns of mutational and rearrangement signatures in the general Nik-
 Zainal et al. breast cancer cohort.                                             Author details
                                                                                 1
                                                                                  Division of Oncology, Department of Clinical Sciences Lund, Lund
 Additional file 7. A PDF file with supplementary Figure 5 showing
                                                                                 University, Medicon Village, SE-22381 Lund, Sweden. 2Department of Clinical
 mutational and rearrangement signatures in 560 WGS analyzed breast
                                                                                 Pathology and Cytology, Karolinska University Laboratory, Stockholm,
 cancers.
                                                                                 Sweden. 3Department of Oncology and Pathology, Karolinska Institute,
                                                                                 Stockholm, Sweden. 4Division of Clinical Genetics, Department of Laboratory
                                                                                 Medicine, Lund University, Lund, Sweden. 5Division of Surgery, Department
Abbreviations
                                                                                 of Clinical Sciences, Lund University, Lund, Sweden. 6Department of Genetics
DRFI: Distant relapse-free interval; FDR: False discovery rate;
                                                                                 and Pathology, Laboratory Medicine, Region Skåne, Lund, Sweden.
HRD: Homologous recombination deficiency; IDFS: Invasive disease-free sur-
vival; IntClust10: Integrative cluster subtype; LAR: Luminal androgen receptor
                                                                                 Received: 19 October 2020 Accepted: 11 January 2021
subtype; OS: Overall survival; SCAN-B: Sweden Cancerome Analysis Network
– Breast study; TIL: Tumor-infiltrating lymphocyte; TNBC: Triple-negative
breast cancer
                                                                                 References
                                                                                 1. Gluz O, Liedtke C, Gottschalk N, Pusztai L, Nitz U, Harbeck N. Triple-negative
Acknowledgements                                                                     breast cancer--current status and future directions. Ann Oncol. 2009;20(12):
The authors would like to acknowledge Kristina Lövgren, Division of                  1913–27.
Oncology for assistance with immunohistochemistry experiments, patients,         2. Foulkes WD, Smith IE, Reis-Filho JS. Triple-negative breast cancer. N Engl J
and clinicians participating in the SCAN-B study, the SCAN-B steering group,         Med. 2010;363(20):1938–48.
personnel at the central SCAN-B laboratory at the Division of Oncology and       3. Nik-Zainal S, Davies H, Staaf J, Ramakrishna M, Glodzik D, Zou X,
Pathology, Lund University, the Swedish national breast cancer quality regis-        Martincorena I, Alexandrov LB, Martin S, Wedge DC, et al. Landscape of
try (NKBC), Regional Cancer Center South, RBC Syd, and the South Sweden              somatic mutations in 560 breast cancer whole-genome sequences. Nature.
Breast Cancer Group (SSBCG).                                                         2016;534(7605):47–54.
                                                                                 4. Jiang YZ, Ma D, Suo C, Shi J, Xue M, Hu X, Xiao Y, Yu KD, Liu YR, Yu Y, et al.
Authors’ contributions                                                               Genomic and transcriptomic landscape of triple-negative breast cancers:
JS conceived and designed the study and provided financial support                   subtypes and treatment strategies. Cancer Cell. 2019;35(3):428–40. e425
together with ÅB. JVC, JH, JS, AE, ABC, and EN participated in the collection    5. Bareche Y, Venet D, Ignatiadis M, Aftimos P, Piccart M, Rothe F, Sotiriou C.
and assembly of study data provided by ÅB through the SCAN-B study. CB,              Unravelling triple-negative breast cancer molecular heterogeneity using an
JH, and AE performed in situ scoring of TILs and immunohistochemistry data.          integrative multiomic analysis. Ann Oncol. 2018;29(4):895–902.
JS and MA performed genomic and statistic data analyses with support from        6. Lehmann BD, Bauer JA, Chen X, Sanders ME, Chakravarthy AB, Shyr Y,
SM regarding CIBERSORTx analyses, and with administrative support from               Pietenpol JA. Identification of human triple-negative breast cancer subtypes
You can also read