Bacterial diversity and predicted enzymatic function in a multipurpose surface water system - from wastewater effluent discharges to drinking ...
←
→
Page content transcription
If your browser does not render page correctly, please read the page content below
Tiwari et al. Environmental Microbiome
https://doi.org/10.1186/s40793-021-00379-w
                                          (2021) 16:11
                                                                                                                      Environmental Microbiome

 RESEARCH ARTICLE                                                                                                                                    Open Access

Bacterial diversity and predicted enzymatic
function in a multipurpose surface water
system – from wastewater effluent
discharges to drinking water production
Ananda Tiwari1* , Anna-Maria Hokajärvi1, Jorge Santo Domingo2, Michael Elk2,3, Balamuralikrishna Jayaprakash1,
Hodon Ryu2, Sallamaari Siponen1, Asko Vepsäläinen1, Ari Kauppinen1,4, Osmo Puurunen5, Aki Artimo5,
Noora Perkola6, Timo Huttula7, Ilkka T. Miettinen1 and Tarja Pitkänen1,8

  Abstract
  Background: Rivers and lakes are used for multiple purposes such as for drinking water (DW) production,
  recreation, and as recipients of wastewater from various sources. The deterioration of surface water quality with
  wastewater is well-known, but less is known about the bacterial community dynamics in the affected surface
  waters. Understanding the bacterial community characteristics —from the source of contamination, through the
  watershed to the DW production process—may help safeguard human health and the environment.
  Results: The spatial and seasonal dynamics of bacterial communities, their predicted functions, and potential
  health-related bacterial (PHRB) reads within the Kokemäenjoki River watershed in southwest Finland were analyzed
  with the 16S rRNA-gene amplicon sequencing method. Water samples were collected from various sampling points
  of the watershed, from its major pollution sources (sewage influent and effluent, industrial effluent, mine runoff)
  and different stages of the DW treatment process (pre-treatment, groundwater observation well, DW production
  well) by using the river water as raw water with an artificial groundwater recharge (AGR).
  The beta-diversity analysis revealed that bacterial communities were highly varied among sample groups (R = 0.92,
  p < 0.001, ANOSIM). The species richness and evenness indices were highest in surface water (Chao1; 920 ± 10)
  among sample groups and gradually decreased during the DW treatment process (DW production well; Chao1:
  320 ± 20). Although the phylum Proteobacteria was omnipresent, its relative abundance was higher in sewage and
  industrial effluents (66–80%) than in surface water (55%). Phyla Firmicutes and Fusobacteria were only detected in
  sewage samples. Actinobacteria was more abundant in the surface water (≥13%) than in other groups (≤3%).
  Acidobacteria was more abundant in the DW treatment process (≥13%) than in others (≤2%). In total, the share of
  PHRB reads was higher in sewage and surface water than in the DW treatment samples. The seasonal effect in
  bacterial communities was observed only on surface water samples, with the lowest diversity during summer.
  (Continued on next page)

* Correspondence: ananda.tiwari@thl.fi
1
 Finnish Institute for Health and Welfare, P.O. Box 95, 70701 Kuopio, Finland
Full list of author information is available at the end of the article

                                         © The Author(s). 2021 Open Access This article is licensed under a Creative Commons Attribution 4.0 International License,
                                         which permits use, sharing, adaptation, distribution and reproduction in any medium or format, as long as you give
                                         appropriate credit to the original author(s) and the source, provide a link to the Creative Commons licence, and indicate if
                                         changes were made. The images or other third party material in this article are included in the article's Creative Commons
                                         licence, unless indicated otherwise in a credit line to the material. If material is not included in the article's Creative Commons
                                         licence and your intended use is not permitted by statutory regulation or exceeds the permitted use, you will need to obtain
                                         permission directly from the copyright holder. To view a copy of this licence, visit http://creativecommons.org/licenses/by/4.0/.
                                         The Creative Commons Public Domain Dedication waiver (http://creativecommons.org/publicdomain/zero/1.0/) applies to the
                                         data made available in this article, unless otherwise stated in a credit line to the data.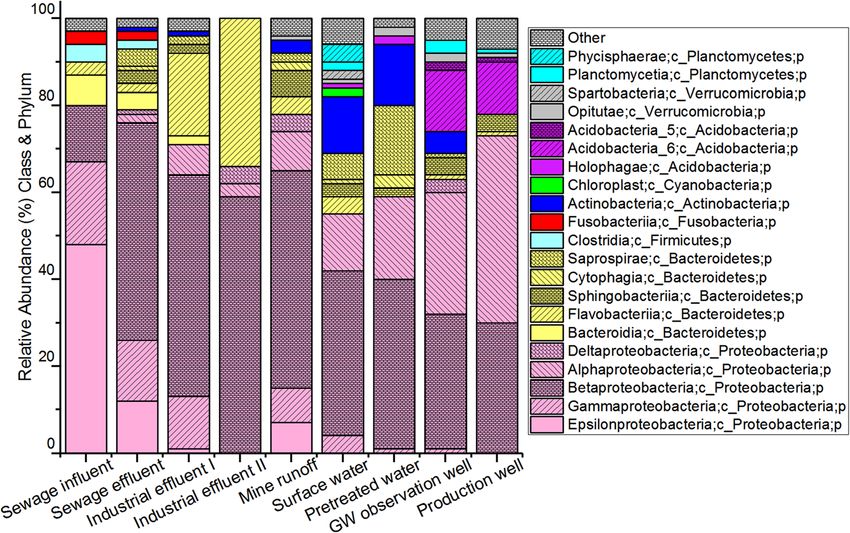
Tiwari et al. Environmental Microbiome   (2021) 16:11                                                           Page 2 of 17

 (Continued from previous page)
 Conclusions: The low bacterial diversity and absence of PHRB read in the DW samples indicate AGR can produce
 biologically stable and microbiologically safe drinking water. Furthermore, the significantly different bacterial
 communities at the pollution sources compared to surface water and DW samples highlight the importance of
 effective wastewater treatment for protecting the environment and human health.
 Keywords: Bacterial communities, Sewage effluent, Surface water, Seasonal effects, Predicted biological function,
 16S rRNA amplicon sequencing

Introduction                                                    analysis [55], including studies in engineered water sys-
Assuring an adequate supply of high-quality raw water           tems (i.e., drinking water systems) [17, 27] and natural
for the production of drinking water (DW) is a challenge        aquatic ecosystems [30, 35, 48]. The 16S rRNA gene
worldwide. In most cases, surface waters such as rivers         amplicon analysis is the most often used to describe the
and lakes near cities fulfill the demand for raw water [2].     composition of bacterial communities, but it may also
However, anthropogenic sources of pollution via dis-            provide information about the presence of PHRB [28,
charges of treated municipal and industrial effluents           53] and may be used to predict the enzymatic function
often pose a threat to the surface water quality. Despite       of aquatic bacterial communities [1, 32, 34]. However,
the highly developed wastewater treatment techniques,           comprehensive information about how the bacterial
not all pollutants are sufficiently removed [22]. Occa-         community changes from sources of contamination to
sionally, raw sewage from combined sewer overflows              surface waters and into drinking water production is
may also contaminate river water [19]. In addition,             lacking, especially in regards to boreal regions.
diffuse sources of pollution—such as runoff from agri-            The aim of the study was to find out if (a) the bacterial
cultural land, forest areas, and urban flow during heavy        community structure and function—specifically diversity,
rains and snowmelt may—deteriorate surface water qual-          taxonomy, predicted enzymatic function, and PHRB—
ity. Overall, the protection of raw water quality from mul-     change significantly from the sources of contamination
tiple sources of pollution is a critical task for maintaining   through the surface water to drinking water production;
environmental health. Besides surface waters, groundwater       (b) the AGR process can produce biologically stable and
can be a good source of high-quality raw water for DW           microbiologically safe drinking water. To reach the study
production. However, the high drinking water demand in          aims, water samples were systematically collected in
some geographical locations may require the use of artifi-      each season (autumn, winter, spring, and summer) in
cial groundwater recharge (AGR) [29]. In Finland, for ex-       two consecutive years from a surface water ecosystem
ample, AGR and groundwater together fulfill about 60%           consisting of lakes and rivers, its major point pollutant
of the raw water demand for DW production, and the rest         sources all the way to drinking water production with
of the demand is fulfilled from surface waters [2].             the AGR process, a path rarely followed before. Then,
   Bacterial communities play a central role in aquatic         bacterial diversity, taxonomy, predicted enzymatic func-
ecosystems and can be affected by various ecological fac-       tions, and changes in the read abundance of potential
tors in water such as temperature and light conditions,         health-related bacteria (PHRB) over time and sites were
UV radiation, pH, the concentrations of available oxy-          evaluated with the 16S rRNA gene sequencing method.
gen, nitrogen, phosphorous, and metal ions [49], the
presence of biodegradable pollutants [52], predator in-         Materials and methods
teractions and the presence of bacteriophages [33], and         Description of the study area
land-use patterns of the catchment area [48]. Further-          The study sites were in the Kokemäenjoki River water-
more, the bacteria introduced from pollutant sources            shed in the southwestern part of Finland (Supplemental
may shape both the taxonomic and functional diversity           Table S1, [19, 44]). The Nordic conditions of the study
of the recipient water [26, 52]. While many of the eco-         area consist of four distinct seasons with a high variation
logical factors may differ depending on geographical lo-        in daylight hours, temperature, and precipitation (Sup-
cation, these may also vary even seasonally at a single         plemental Table S2). The natural discharge in Finnish
location [54], affecting the rate of photosynthesis and         rivers is usually highest in the spring and early summer
ecosystem productivity. Moreover, due to the unidirec-          due to snowmelt, despite this period having the lowest
tional flow of water, ecological factors within a river eco-    mean precipitation.
system can be almost unique.                                      The Kokemäenjoki River flows from Lake Pyhäjärvi
   Recently, many bacterial community studies have used         near the city of Nokia, towards the southwest coast of
high-throughput 16S ribosomal RNA gene sequencing               Finland. It drains water from diverse sources such as
Tiwari et al. Environmental Microbiome   (2021) 16:11                                                          Page 3 of 17

treated municipal and industrial sewage discharges and        the current study followed the path from surface water
runoff from urban areas, mines, agricultural fields, and      to the DW production well. Water samples were trans-
forest areas. The river water is used for bathing and         ported in coolers to the laboratory of the Finnish Insti-
recreational purposes and serves as raw water for DW          tute for Health and Welfare (Kuopio, Finland) and
production (23 million m3 / year) in the Turku region         processed within 24 h.
(southwest part of Finland) [19, 29]. The AGR technique
is used for the drinking water production process. Ini-
tially, the raw water from the river is pretreated using      DNA extraction, amplification, and sequencing
sieving, dissolved air flotation, and sand filtration prior   Collected samples were stored by filtering the samples of
to infiltration into the sand/gravel esker aquifer located    surface water (75 ml – 400 ml), sewage effluent (50 ml –
in the Virttaankangas managed aquifer area [29]. The          100 ml), and groundwater (500 ml – 1000 ml) onto nylon
AGR production plant consists of seven infiltration           membranes with a pore size of 0.2 μm (N66, Ultipor, Pall
areas, each having two to four infiltration ponds. The        Corporation, Ann Arbor, Michigan, USA). Immediately
average residence time of the infiltrated water in the es-    after filtration, the membranes were treated with RNAla-
ker aquifer is 4 months, and the water quality is moni-       ter (Qiagen, Hilden, Germany) and kept at 4 °C over-
tored from groundwater (GW) observation wells.                night before freezing at − 75 °C [44].
Potable water is pumped from the DW production wells             DNA was extracted from stored filters, which were
and supplied to consumers after UV and chloramine             first transferred to microcentrifuge tubes with acid-
disinfection.                                                 washed DNase and RNase free glass beads (Mo Bio
   A total of seven municipal wastewater treatment            Laboratories, Inc., Carlsbad, California, USA). Storage
plants (WWTPs) discharging treated wastewater efflu-          tubes containing RNAlater were centrifuged for 3 min at
ents into the Kokemäenjoki watershed were included in         maximum speed, and the pellet was resuspended with
the study: Rahola and Viinikanlahti in the city of Tam-       500 μl lysis buffer (Buffer RLT Plus (Qiagen, Hilden,
pere; Kullaanvuori and Siuro in the city of Nokia; and        Germany) containing β-mercaptoethanol (Sigma-Aldrich
Mouhijärvi, Vammala, and Äetsä in the city of Sasta-          Co., St. Louis, MO) and added to the microcentrifuge
mala. Viinikanlahti is the largest WWTP of the study,         tube containing the filter. The tubes were then bead-
serving about 200,000 inhabitants, and Mouhijärvi is the      beated for 40 s at maximum speed (Mini-Bead-Beater,
smallest, serving about 1300 inhabitants [2, 19]. All these   Biospec Products, Inc., Bartlesville, Oklahoma, USA) and
WWTPs use primary and secondary treatment pro-                centrifuged 3 min at maximum speed. The DNA fraction
cesses, including screening, grit removal, and ferric salt    was extracted using AllPrep DNA/RNA Mini Kit (Qia-
addition followed by conventional activated sludge treat-     gen GmbH, Germany) following the manufacturer’s
ment with the addition of flocculants. Industrial effluents   protocol.
were collected from two industrial treatment plants prior        The DNA extracts were shipped on dry ice to the
to discharge into the river. The mine runoff water was        laboratory of the United States Environmental Protec-
collected from a mining area discharge.                       tion Agency (Cincinnati, Ohio) for community sequen-
                                                              cing, as previously described [5, 27]. Specifically, DNA
Water samples                                                 extracts were used as templates for 16S rRNA gene
A total of 243 water samples were collected from 30           metabarcoding primers. We used barcoded primers
sampling locations in each season for 2 years from the        515F and 806R [10] to construct 16S rRNA gene se-
Kokemäenjoki watershed, its point sources of pollution,       quence libraries for each sample tested. The PCR assays
and the DW production process (Table 1). Surface water        used for the sequencing libraries were performed in 25-
samples were collected from 15 sampling locations, of         μl volumes using the Ex Taq kit (TaKaRa) with 200 nM
which two were in the lake region, four in tributary riv-     concentrations (each) of the forward and reverse primers
ers, and nine in the main river.                              and 2 μl of DNA extracts and using the following cycling
  All surface water samples were collected with a grab        conditions: an initial 5 min denaturing step at 95 °C,
sampler from one meter below the surface except at Site       followed by 35 cycles at 95 °C for 45 s, 50 °C for 60 s, and
2 (located on the deepest region of the lake), where the      72 °C for 90 s, and a final elongation step at 72 °C for 10
samples were collected from one meter, 10 m, and 40 m         min. Each barcode corresponded to an eight-base se-
below the surface to assess if sampling depth had an ef-      quence unique to each sample. Amplicons were visual-
fect on lake bacterial communities. Also, groundwater         ized on an agarose gel to confirm product sizes, and
samples of infiltrated water from observation and pro-        aliquots of each amplicon of the expected size were
duction wells and wastewater samples from WWTPs               pooled and sequenced using an Illumina MiSeq sequen-
were collected as grab samples. The DW production well        cer and 250-bp paired-end kits at the Cincinnati Chil-
samples were collected before adding any disinfection, as     dren’s Hospital DNA Core facility.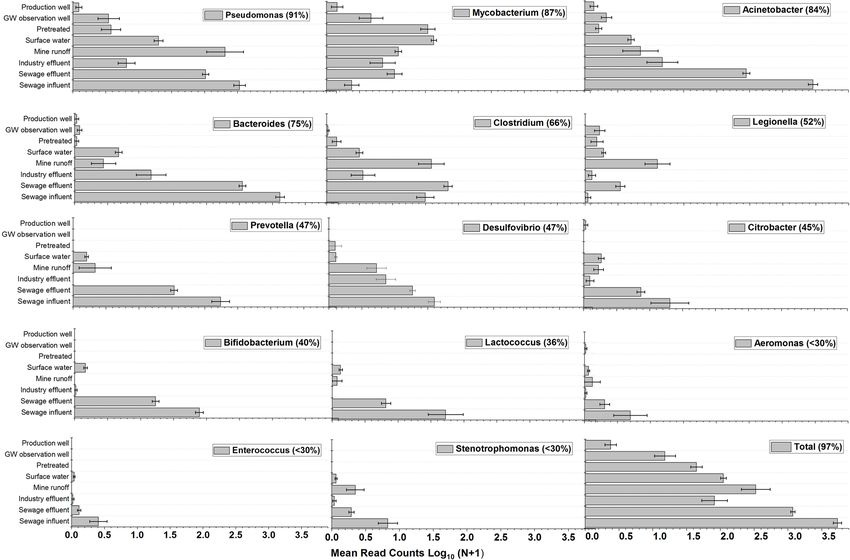
Tiwari et al. Environmental Microbiome         (2021) 16:11                                                                                  Page 4 of 17

Table 1 Summary of water samples collected in 2012–2014
Site number                                    Sampling location                                                                   Number of samplesa
Municipal sewage effluent (n = 57)
  1                                            Tampere, Viinikanlahti                                                              8 (1b)
  2                                            Tampere, Rahola                                                                     8
  3                                            Nokia, Kullaanvuori                                                                 8 (1b)
  4                                            Nokia, Siuro                                                                        8 (1b)
  5                                            Sastamala, Mouhijärvi                                                               8 (1b)
  6                                            Sastamala, Vammala                                                                  9
  7                                            Sastamala, Äetsä                                                                    8 (1b)
Municipal sewage influent (n = 7)
  1                                            From the sewage effluent sampling sites (1 to 7)                                    7
Industrial effluent and mine runoff (n = 20)
  1                                            Industry I                                                                          7 (1b)
  2                                            Industry II                                                                         9
  3                                            Mine                                                                                4
Surface water (n = 119)
  1                                            Ratinanvuolle (tributary)                                                           8 (1b)
  2                                            Pyhäjärvi, depth 1 m (lake region)                                                  8
                                               Pyhäjärvi, depth 10 m (lake region)                                                 5
                                               Pyhäjärvi, depth 40 m (lake region)                                                 5
  3                                            Rajasaari (lake region)                                                             4
  4                                            Sotkanvirta (tributary)                                                             8 (1b)
  5                                            Nokiankoski (upstream)                                                              8
  6                                            Nokiankoski (downstream)                                                            8 (1b)
  7                                            Siuronkoski (tributary)                                                             8
  8                                            Hiedanvuolle                                                                        8
  9                                            Rautavesi                                                                           8
  10                                           Liekovesi                                                                           8 (1b)
  11                                           Keikyä                                                                              8
  12                                           Karhiniemi (raw water)                                                              5
  13                                           Karhiniemi                                                                          8
  14                                           Loimijoki (tributary)                                                               8
  15                                           Kojo, Kolsi                                                                         4
Drinking water treatment process with AGR (n = 40)
  1                                            Pretreated water                                                                    11
  2                                            Groundwater observation well 1                                                      9
  3                                            Groundwater observation well 2                                                      9 (2b)
  4                                            Production well                                                                     11 (1b)
Total [N = 243] (13b)
a
  n = total number of samples in each sample group. Drinking water treatment samples were collected in each season between autumn 2012 and autumn 2014.
The rest of the sample groups were sampled from autumn 2012 to spring 2014 except the municipal sewage influent sample, which was collected only once
during the autumn 2013 sampling campaign. The samples marked as b had low sequence reads and were not included for further analysis. The total number of
samples remaining for further analysis was 230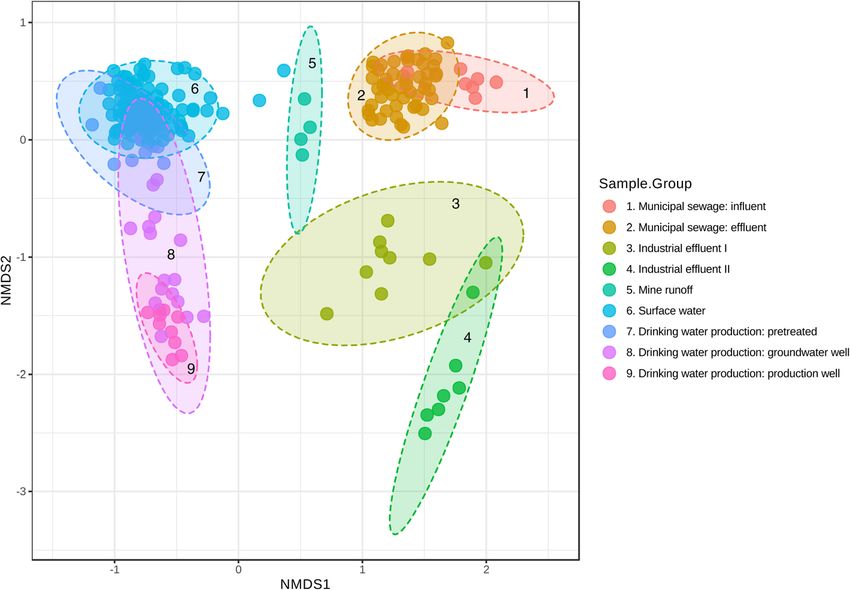
Tiwari et al. Environmental Microbiome              (2021) 16:11                                                                                             Page 5 of 17

Sequence data processing and bacterial community                                        diversity analysis was not statistically significant (R =
analysis                                                                                0.07, p < 0.196, ANOSIM; Table 2).
The fastq files with forward and reverse reads of bacterial                                Herein, the core microbiome refers to the set of taxa
16S rRNA gene obtained from 300 bp paired-end Illumina                                  that have higher relative abundance above a given abun-
MiSeq sequencing were merged with Flash software ver-                                   dance threshold. The core bacterial communities were
sion 1.1 [37]. Trimming of bad quality reads, removal of                                calculated with MicrobiomeAnalyst in a way that an
primer and adapter sequences, and removal of ambiguous                                  OTU with a relative read abundance of more than 0.01%
and short-length sequences was done using Quantitative                                  of total reads in a sample was defined as the core com-
Insights Into Microbial Ecology (QIIME) bioinformatics                                  munity of that sample. The core OTUs detected in more
pipeline version 1.8.0 [9] with split_libraries_fastq.py                                than 20% of samples (sample prevalence > 20%) in a
script. Chimeras were removed with the usearch61 [15]                                   studied group was reported as the core community of
method using the identify_chimeric_seqs.py script. After                                that sample group. The core bacterial OTUs were classi-
chimera removal, the preprocessed reads were aligned                                    fied into the deepest possible taxonomic level with the
with the Greengenes database [12] version 13_8 [38] and                                 Greengenes OTU annotation library.
sorted with > 97% similarity alignment with PyNAST [8]                                     The predicted enzymatic function of bacterial commu-
into operational taxonomic units (OTUs) using the closed                                nities was calculated with 16S rRNA gene sequence
reference OTU picking approach with the UCLUST                                          library-based OTUs with PICRUSt [34] with Microbio-
algorithm [16]. An attempt to filter out the mitochondrial                              meAnalyst. The PICRUSt produced a Kyoto
and chloroplast reads was made along with the singleton                                 encyclopedia of genes and a genomes orthology (KEGG
OTUs.                                                                                   Orthology) matrix. The KEGG Orthology (KO) refers to
  The bacterial communities were further analyzed with                                  groups linked to molecular functions represented in the
MicrobiomeAnalyst [13]. A total of 230 samples out of                                   KEGG database (www.genome.jp/kegg). The KO analysis
243 samples had total read counts higher than the rar-                                  for 230 water samples was performed as follows: (a) a
efaction value (i.e., 4860) and were used for further                                   total KO list was obtained from MicrobiomeAnalyst; (b)
study. Bacterial communities in the surface water sample                                for each ortholog, the KO with the highest number was
subgroups originating from the lake region, watershed                                   identified; and (c) all orthologs were re-arranged to se-
tributaries, and the main river region demonstrated no                                  lect only the orthologs that had the highest value of 500
distinct beta-diversity values (R = 0.10, p < 0.002, ANO-                               or more in Step b for the further identification of KEGG
SIM; Table 2), and therefore these samples were handled                                 pathways. The total number of each functional category
as a single group in the further analysis. Furthermore,                                 was calculated with a simple sum [13] and compared on
the samples collected from three different depths in the                                different sample groups and seasons.
Pyhäjärvi Lake sampling location (Site 2) were handled                                     The list of screened potential health-related bacteria
together as one sampling site, although the beta-                                       (PHRB) is shown in Supplemental Table S3. The

Table 2 Significance of the bacterial community differences between sample types and sampling seasons
Samples included                      Experimental grouping                                                                                Rb                     p-value
                                                       a
All samples                           Sample groups                                                                                        0.92                   < 0.001
                                      Seasons                                                                                              0.04                   < 0.003
Sewage                                Effluent and Influents                                                                               0.34                   < 0.001
Sewage effluent                       Seasons                                                                                              0.20                   < 0.001
Industrial effluents                  Industry I and Industry II                                                                           0.67                   < 0.001
                                      Seasons                                                                                              −0.09                  < 0.737a
Surface Water                         Lake region, tributaries, and main river                                                             0.10                   < 0.002
                                      Seasons                                                                                              0.38                   < 0.001
                                      Sampling depth 1 m, 10 m, and 40 m in Site 2 of surface water (Pyhäjärvi)                            0.07                   < 0.196a
Treated samples                       Pretreated water and AGR process water (combining groundwater                                        0.96                   < 0.001
                                      observation well and production well samples)
                                      Seasons                                                                                              −0.06                  < 0.970a
a
  Ordination method: PCoA, distance method: Bray-Curtis index, taxonomic level: OTU, statistical method: analysis of group similarities (ANOSIM). Sample groups
are presented in Table 1 and Fig. 2. bEvaluation criteria: (a) 0.75 < R < 1, highly separate; (b) 0.5 < R < 0.75, separate; (c) 0.25 < R < 0.5, separate with some overlap;
(d) 0.1 < R < 0.25, similar with some differences; (e) R < 0.1, similar [46]. The experimental groups having separate and significantly different bacterial communities
are highlighted in bold and underlined. Sample groups showing p-value with * had low sample numbers, so they did not have sufficient itineration
during analysis
Tiwari et al. Environmental Microbiome (2021) 16:11 Page 6 of 17
detection frequency of total reads of each PHRB genus Results
was analyzed within the whole data (n = 230 retained A total of 6,052,510 high-quality reads were obtained
after removing 13 low read samples) and in addition for after sequencing, aligning, and chimera removal. The
each sample group in different seasons of the year. The average read count per sample was 26,320 (median 23,
detection frequency of tentative PHRB genus Arcobacter 190), ranging from 4860 to 65,480 reads. The rarefaction
spp. [43] was high (92% in the whole data), and the curves of all sample groups are presented in the Supple-
genus had high relative abundance in sewage influent mental Material (Figure S1). The average read counts
(44% of total reads), sewage effluent (11% of total reads), from the drinking water treatment process samples, the
and mine runoff (4% of total reads). Therefore, the genus GW observation well, and the production well were
was not included in the PHRB analysis intended for rare lower than from surface water, sewage influent, sewage
species. effluent, and industrial effluents (Table 3; p < 0.001,
Kruskal-Wallis). No significant changes were observed in
Statistics the average read counts between the seasons of the year
Alpha-diversity was calculated by MicrobiomeAnalyst (p = 0.51, Kruskal-Wallis).
using OTU counts, observed species index, Chao1 index,
and abundance-based coverage estimator (ACE) as taxo- Taxonomic diversity (alpha-diversity)
nomic richness indices [39]. The observed species index A total of 3823 OTUs were observed in the samples in-
measures the total numbers of possible unique species. cluded in the analysis (n = 230). Specifically, 3388, 2554,
The Chao1 index, a non-parametric measure, analyzes 962, 1269, and 1711 OTUs were recorded for surface
the ratio of singleton reads (n = 1) to doubleton reads water (n = 115), municipal sewage (n = 59), industrial ef-
(n = 2) and assigns more weight to the rare species [39]. fluents (n = 15), mine runoff (n = 4), and drinking water
Shannon and Simpson diversity indices were used as (n = 37), respectively. The geometric mean (± standard
measures for taxonomic richness and evenness. error) of diversity indices in each sample group is shown
Analysis of similarity (ANOSIM) method from Micro- in Table 3, and the box-plot comparison is shown in
biomeAnalyst was used for non-metric multi- supplemental Figures S2 and S3. The geometric mean of
dimensional scaling (NMDS) of beta-diversity with the richness indices increased after sewage treatment (i.e.,
Bray-Curtis index distance method. The comparison was influent vs. effluent), while the indices were lower in in-
made following the criteria reported by Ramette [46]: (a) dustrial effluent than in municipal sewage and mine run-
0.75 < R < 1, highly separate; (b) 0.5 < R < 0.75, separate; off samples (Table 3). All richness indices were gradually
(c) 0.25 < R < 0.5, separate with some overlap; (d) 0.1 < reduced from surface water (Chao1: 920 ± 10) to the
R < 0.25, similar with some differences; and (e) R < 0.1, DW production well (Chao1: 320 ± 20) during the drink-
similar. ing water treatment process (Table 3, supplemental Fig-
The significance of the difference between the sample ures S2 and S3). The taxonomic richness and evenness
groups and seasons was studied with the Kruskal-Wallis indices had a positive correlation to each other (Supple-
test followed by the Dunn-Bonferroni post-hoc test in mental Table S4).
IBM SPSS Statistics for Windows version 25. The p- Among the surface water sample subgroups (tributary
values < 0.05 were considered statistically significant. river, lake, and river water), river water had a signifi-
The normality of data was tested by the Shapiro-Wilk cantly higher Shannon diversity index (p = 0.002,
test. Because many PHRB reads had zero read counts in Kruskal-Wallis) and Chao 1 Index (p < 0.001, Kruskal-
samples, the bacterial read counts were log-transformed Wallis) (Supplemental Figure S4 B). The season of the
by (Log10 N + 1) before statistical analysis. Since the data year affected taxonomic diversity indices only within the
were highly skewed even after the logarithmic trans- surface water samples (Table S5, supplemental Figures
formation, the 95% confidence limit of median reads of S5 and S6). The alpha-diversity of the bacterial commu-
PHRB was calculated with the following equations [7] nity was significantly lower in the summer than in the
from PHRB read counts arranged in ascending order: other seasons (Chao1; autumn: 950 ± 20, winter: 990 ±
pffiffiffith 30, spring: 960 ± 30, summer: 790 ± 20; p < 0.001,
n n Kruskal-Wallis).
Lower confidence limit ¼ −1:96 observation
2 2
Bacterial community variation in the sample groups
pffiffiffith
n n (beta-diversity)
Upper confidence limit ¼ 1 þ þ 1:96 observation
Based on the nonmetric multidimensional scaling
2 2
(NMDS) and the beta-diversity of bacterial taxa, five
where n is the total number of observations in the stud- major clusters were noted—municipal sewage, industrial
ied sample group. effluent, mine runoff, surface water, and the samplesTiwari et al. Environmental Microbiome (2021) 16:11 Page 7 of 17
Table 3 Geometric mean (±standard error) of sequencing reads and alpha-diversity indices in sample groups
Parameter Sewage Sewage Industrial Mine runoff Surface Pre-treated GW observation Production
influent effluent effluent water well well
Reads 34,300 ± 4300 26,200 ± 1800 20,600 ± 3700 13,300 ± 2200 24,200 ± 1100 32,700 ± 5400 15,900 ± 2600 11,300 ± 2100
OTUs 700 ± 40 800 ± 20 290 ± 40 1120 ± 50 890 ± 20 630 ± 40 470 ± 30 370 ± 10
Observed 490 ± 30 580 ± 10 170 ± 20 640 ± 20 730 ± 10 530 ± 30 320 ± 30 250 ± 10
ACE 940 ± 60 1080 ± 30 510 ± 40 1490 ± 60 1230 ± 20 880 ± 60 590 ± 40 480 ± 20
Chao1 630 ± 40 720 ± 10 300 ± 30 810 ± 30 920 ± 10 710 ± 40 410 ± 30 320 ± 20
Shannon 3.96 ± 0.15 4.15 ± 0.07 2.74 ± 0.26 5.35 ± 0.22 4.91 ± 0.02 3.99 ± 0.10 4.60 ± 0.07 4.15 ± 0.09
Simpson 0.91 ± 0.01 0.92 ± 0.01 0.78 ± 0.03 0.97 ± 0.01 0.98 ± 0.00 0.94 ± 0.01 0.96 ± 0.00 0.93 ± 0.01
from the AGR production process (Fig. 1). Furthermore, However, although the samples from GW Observation
within municipal sewage, there were significant differ- Well I seemed to overlap with the pretreated samples in
ences in bacterial communities between effluent and in- the two-dimensional plots (Fig. 1), these samples were
fluent (R = 0.34, p < 0.010, ANOSIM)—and within highly separate on a three-dimensional scale (data not
industrial effluent—between Industry I and Industry II shown).
(R = 0.67, p < 0.010, ANOSIM; Table 2). Bacterial com-
munities were similar within the surface water sample Bacterial community at the phylum, class, and family
subgroups (tributary river, lake, and river water, R = 0.10, levels
p < 0.002; ANOSIM; Supplemental Figure S4 A). Among A total of 38 bacterial phyla from the Greengenes data-
the three different drinking water production steps, base were identified via high-throughput 16S rRNA gene
there were considerable differences between the pre- sequence analysis. All these phyla were present in sur-
treated samples and the AGR samples (R = 0.96, p < face water samples, but only 25, 30, 32, 20, and 22 phyla
0.010; ANOSIM). Following the water flow in the AGR were recorded from industrial effluent (both I and II),
process, the sample collected from the GW Observation mine runoff, sewage (both effluent and influent), pre-
Well I was closer to the pretreated samples, while the treated water, and AGR samples, respectively. About
sample collected from GW Observation Well II over- 40% of phyla from each sample group had a read contri-
lapped with the production well samples (Fig. 1). bution of more than 0.1% out of all reads in that sample
Fig. 1 Nonmetric multidimensional scaling and analysis of dissimilarities between bacterial communities in sampling groups [ANOSIM] R = 0.92; p-
value < 0.001 [NMDS] Stress = 0.11567. Ordination method: NMDS, distance method: Bray-Curtis index, taxonomic level: OTU, statistical method:
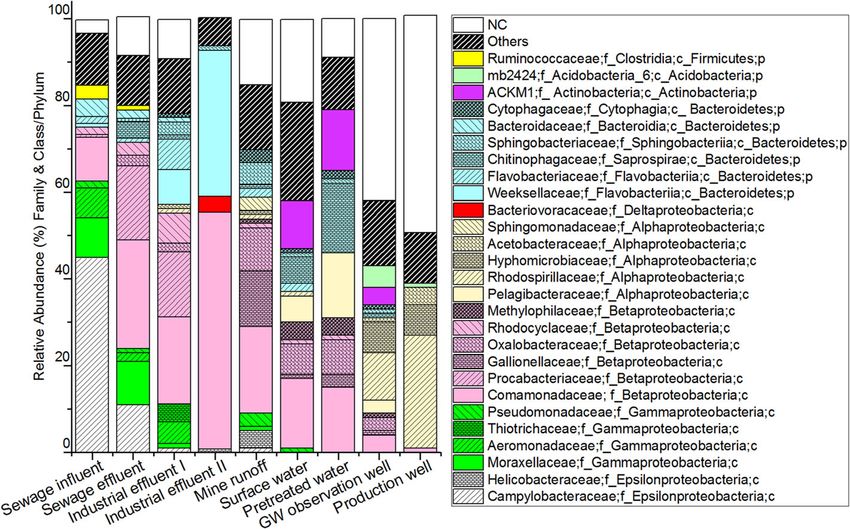
analysis of groups similarities (ANOSIM)Tiwari et al. Environmental Microbiome (2021) 16:11 Page 8 of 17 group. Hereafter, we report bacterial community com- Gammaproteobacteria was less than 2%, except in the position at the phylum, class, and family levels. effluent from Industry I, mine runoff, and surface water, The bacterial phylum Proteobacteria was omnipresent, where their abundance was 12, 8, and 4%, respectively. but the relative abundance of this phylum was signifi- Betaproteobacteria was detected in all sample groups, cantly higher in sewage samples (influent and effluent: with the highest abundance in Industrial Effluent II 79 and 80%), industrial effluent (I and II: 66 and 71%), (59%). The read proportion of class Alphaproteobacteria mine runoff (78%), GW observation well (63%), and GW increased gradually as the drinking water treatment production well (73%) compared to surface water (55%) process proceeded (Fig. 2). The Alphaproteobacteria samples (Fig. 2; p < 0.001, Kruskal-Wallis). The read pro- reads were more abundant in the AGR process samples portion of Proteobacteria gradually increased through (GW observation well: 28%, production well: 43%) than the DW production process. As demonstrated in Table in the other groups (sewage: < 1%, industrial effluents: 2, the seasonal effect on bacterial communities was sig- 2–7%, and mine runoff: 9%; surface water: 13%, pre- nificant only in surface water (R = 0.38, p < 0.001, ANO- treated: 19%) (Fig. 2; p < 0.001, Kruskal-Wallis). SIM). The seasonal variation of bacterial communities in The taxonomic classification was not possible for all surface water at the phylum and class levels is shown in reads at the family level, although the reads were Figure S7. The relative abundance of the Proteobacteria assigned to the phyla and class levels (Fig. 3). The phylum was highest in the spring samples (64%) and families Campylobacteraceae (influent: 45%, effluent: lowest in the summer samples (45%). The difference was 11%, other sample groups: < 2%) and Moracellaceae most visible in the relative abundance of the Betaproteo- (sewage: ~ 10%, other sample groups: < 1%) were bacteria class—the highest share in spring (49%) and the mostly detected in the sewage samples. Among the lowest in summer (28%). Betaproteobacteria, the Comamonadaceae family was Overall, within the Proteobacteria phylum, there was a detected in all sample groups (Fig. 3), although it was large variation in bacterial classes in different sample more abundant in effluent and surface water than in groups (Fig. 2). Epsilonproteobacteria and Gammapro- samples from the DW production process (Fig. 3). teobacteria were more abundant in sewage influent (48 Furthermore, the relative abundance of Pelagibactera- and 19%, respectively) and effluent (12 and 14%, respect- ceae (Alphaproteobacteria) was 6% in surface water, ively) samples than in surface water and DW production 15% in pretreated water, and 3% in GW observation process (Fig. 2; p < 0.001, Kruskal-Wallis). The abun- well samples. The relative abundance of members of dance of Epsilonproteobacteria was less than 1% in the the Rhodospirillaceae family (Alphaproteobacteria) rest of the sample groups, except for mine runoff (7%). was high in the production well (26%) and the GW Furthermore, in most sample groups, the abundance of observation well (11%) samples. Fig. 2 Bacterial taxonomic structure at the class and phylum level in the sample groups. Others: Classes having read contribution less than 2% in all the samples
Tiwari et al. Environmental Microbiome       (2021) 16:11                                                                                 Page 9 of 17

 Fig. 3 Bacterial taxonomic structure at the family level in the sample groups. Others: Families having a read contribution of less than 2% in all the
 samples. NA: Not assigned

   Among the studied samples, Bacteroidetes was the                          Core bacterial communities
second-most abundant phylum (Fig. 2). Their reads were                       Core bacterial communities are reported here as the
more abundant in the industrial samples (I: 25%, II:                         number of core OTUs at the class level (Fig. 4), while
34%) than in the surface water samples (14%). Their pro-                     the OTUs having the highest sample prevalence or high-
portion increased from surface water to pretreated water                     est detection frequency in the sample group are reported
(21%) but gradually decreased in the GW observation                          at the family level (Table S6). Further details for different
wells (6%) and production well (5%) samples. Within the                      taxa levels are presented in supplementary data sheets
Bacteroidetes phylum, some relative abundance patterns                       S1, S2, S3, S4, S5, S6, S7, S8, S9 and S10.
were noted at the class level: Flavobacteriia was solely                        At the class level, Betaproteobacteria was identified
detected in industrial effluent (I: 19%, II: 34%), while                     as a core member in all sample groups (Fig. 4). In
Bacteroidia was common in sewage (influent: 7%, efflu-                       the sewage influent samples, eight out of the 17 total
ent: 4%); Saprospirae was detected in surface water (6%)                     core OTUs belonged to the class Epsilonproteobac-
and pretreated water (16%). At the family level (Fig. 3),                    teria, seven belonged to Gammaproteobacteria, and
Weeksellaceae (Flavobacteriia) was dominant in the in-                       two belonged to Betaproteobacteria (Fig. 4, Supple-
dustrial effluent (I: 8% and II: 34%).                                       mental Data Sheet S1). Regarding detection frequency,
   Actinobacteria was the third-most dominant phylum                         OTUs belonging to the Campylobacteraceae and
(Fig. 2), and most sequences belong to the ACKM1 fam-                        Aeromonadaceae families were detected in all sewage
ily (Actinobacteria class). The relative abundance of                        influent samples (Table S6). In the sewage effluent sam-
members of this phylum was higher in surface water                           ples of the 22 total core OTUs, Betaproteobacteria had
(13%) and pretreated water (14%) than in the rest of                         ten, Gammaproteobacteria had five, and Epsilonproteo-
the samples (≤5%). Of the other phyla, Acidobacteria                         bacteria had four core OTUs (Fig. 4, Supplemental Data
was significantly more abundant in the GW observa-                           Sheet S2). Based on the highest detection frequency in the
tion well (16%) and production well (13%) samples                            sewage effluent, OTUs belonging to families Campylobac-
than in other samples where the relative abundance                           teraceae (Epsilonproteobacteria class, 83%), Comamona-
of Acidobacteria was ≤2% (Fig. 2). Other less repre-                         daceae      (Betaproteobacteria      class,   73%),       and
sented phyla were Planctomycetes (6%), Verrucomicro-                         Moraxellaceae (Gammaproteobacteria class, 73%) were
bia (3%), and Cyanobacteria (2%) in surface water                            the most prevalent (Table S6).
and Fusobacteria and Firmicutes, which were solely                              From surface water, fourteen Betaproteobacteria and
detected in municipal sewage samples with a relative                         five Actinobacteria core OTUs had the highest preva-
abundance of ≤4%.                                                            lence among the total number of core OTUs (n = 33;
Tiwari et al. Environmental Microbiome     (2021) 16:11                                                                 Page 10 of 17

 Fig. 4 The number of core communities OTUs classified into class and phylum level

Fig. 4 and Supplemental Data Sheet S6). OTUs from                        samples were in common (supplemental data sheets S8,
families Methylophilaceae (98%), Pelagibacteraceae                       S9, and S10). From these samples, the majority of the
(96%), and Comamonadaceae (96%) had the highest de-                      core OTUs belonging to the Betaproteobacteria class
tection frequency in surface water samples (Table S6).                   were not identified at the lower taxonomic levels.
Among the pretreated water, Betaproteobacteria (21),
Actinobacteria (9), and Saprospirae (6) had the highest                  Predicting functional diversity
number of core OTUs (n = 43, Fig. 4 and Supplemental                     A total of 6885 KEGG orthologs were obtained from the
Data Sheet S7). Core OTUs from families Chitinophaga-                    PICRUSt analysis. Among them, 1741 orthologs had
ceae, Oxalobacteraceae, Pelagibacteraceae, and Methylo-                  zero KO hits in all samples. Furthermore, 3344 KEGG
philaceae were detected in all pretreated samples (Table                 orthologs (99% KO hits out of a total of 6885) had KO
S6). Pretreated water and surface water had some                         hits of 500 or more in at least one sample out of the 230
common core OTUs from families ACK-M1, Methylo-                          studied samples. The orthologs were identified and
philaceae, Comamonadaceae, and Pelagibacteraceae                         grouped into three subgroups based on different KEGG
(supplemental data sheets S6 and S7).                                    functional gene ontology affiliations (i.e., metabolism,
  In the GW observation well samples, classes Betapro-                   cellular process, and environmental process) and further
teobacteria (16) and Alphaproteobacteria (8) and phyla                   divided into 21 different functional categories in each
Acidobacteria (6) and Bacteroidetes (4) had the highest                  sample group (Fig. 5) and each season (Table S7). All
core OTU numbers out of a total of 38 core OTUs (Fig.                    predictive functional categories identified were higher in
4). OTUs from families mb2424 (76%), Rhodospirillaceae                   industrial effluents than in the rest of the sample groups.
(71%), and an unidentified family OTU from the Beta-                     The categories of predictive functions did not differ sig-
proteobacteria class (76%) had the highest detection fre-                nificantly between surface water, pretreated water, GW
quency (Table S6). From production well samples,                         observation well, and production well sample categories
classes Betaproteobacteria (19) and Alphaproteobacteria                  (Fig. 5). When all samples were considered (n = 230),
(10) and phyla Acidobacteria (6) and Bacteroidetes (4)                   KO hits for most of the predicted functions were signifi-
had the highest core OTU numbers out of a total of 40                    cantly lower in the spring samples than in the other sea-
core OTUs (Fig. 4). OTUs from families Rhodospirilla-                    sons, while the KO hits were not significantly different
ceae, Acetobacteraceae, and an unidentified family OTU                   among these three seasons (Table S7).
from the Betaproteobacteria class had the highest detec-
tion frequency and were detected from all samples of                     Detection of potential health-related bacteria - PHRB
this group (Table S6). More than half of the core OTUs                   Among a total of 42 PHRB genera screened, 20 were de-
from the GW observation well and production well                         tected (Supplemental Table S3). The variation of PHRB
Tiwari et al. Environmental Microbiome       (2021) 16:11                                                                              Page 11 of 17

 Fig. 5 Mean KO hits of each function category in different sample categories. NuM = Nucleotide metabolism, SM = Sulfur metabolism, NM =
 Nitrogen metabolism, MM = Methane metabolism, LFM = Lipid and Fatty acid metabolism, AM = Amino acid metabolism, CM = Carbohydrate
 Metabolism, UM = Unclassified metabolism, GBM = Glycan Biosynthesis and Metabolism, MTP = Metabolism of Terpenoides and Polyketides,
 BSM = Biosynthesis of Secondary Metabolites, XBM = Xenobiotics Metabolism, PM = Pyrimidine Metabolism, MCV = Metabolism of cofactors and
 Vitamins, ASNSM = Amino Sugar and Nucleotide Sugar Metabolism, T_KO = Total KO hits, ND = new to dataset, PC = poorly characterized, HD =
 Human disease related, GIP = Genetic Information processing, EIP = Environmental Information processing, SCP = Signaling and cellular process. In
 the sample category, SI = Sewage Influent, SE = Sewage Effluent, IE = Industrial Effluent, ME = Mine Effluent, SW = Surface Water, P = Pretreated,
 PDT = Production Tube, PDW = Production Well. Error bar is calculated as σ/√n

in different sample groups is shown in Fig. 6. Within                         The numbers of all detected PHRB reads were sig-
all samples (n = 230), a total of 145,116 bacterial                         nificantly different between the sample groups (p <
reads (2.4% of the total bacterial reads) were deter-                       0.001, Kruskal-Wallis). All detected PHRB genera ex-
mined to belong to PHRB. Pseudomonas spp., Myco-                            cept Legionella spp. and Mycobacterium spp. had
bacterium spp., and Acinetobacter spp. were the most                        higher read counts in the sewage influent samples
frequently detected PHRB genera and were detected                           compared to the other sample groups (Fig. 6). The
in 210, 200, and 193 samples, respectively. When the                        highest read counts of Legionella spp. and Mycobac-
read counts were considered, Acinetobacter spp., Bac-                       terium spp. were detected in the mine runoff and
teroides spp., and Pseudomonas spp. had the three                           surface water samples, respectively. Clostridium spp.
highest read counts at 470370, 37765, and 25,540, re-                       reads were more abundant in sewage effluent, sewage
spectively. Acinetobacter, Bacteroides, and Pseudo-                         influent, and mine runoff samples than in the rest of
monas also had the top three in OTU numbers with                            the samples. Overall, the number of PHRB reads was
47, 45, and 57 OTUs, respectively, out of a total of                        lower in the production well samples than in the
221 OTUs belonging to PHRB detected in this study.                          other samples. Most of the PHRB genera had a clear
Arcobacter spp. was among the most prevalent                                seasonal pattern (Table S8). The median read counts
groups in sewage influent and sewage effluent sam-                          of most PHRB genera were lower in the summer
ples. Most of the Campylobacteraceae family reads                           samples than in the other seasons.
from these groups of samples belonged to Arcobacter
spp. (Fig. 3). Furthermore, Arcobacter spp. was                             Discussion
among the most commonly found core OTUs from                                This study demonstrated the distinct bacterial diversity,
municipal sewage samples (supplemental data sheets                          taxonomic structure, predicted enzymatic function, and
S1 and S2).                                                                 PHRB in different water sample types (e.g., mainly
Tiwari et al. Environmental Microbiome     (2021) 16:11                                                                           Page 12 of 17

 Fig. 6 The mean read counts (with standard error) of PHRB in sample groups. The percentage shows the detection frequency within the whole
 dataset (number of samples, n = 230). See Supplementary Table S3 for further information about the potential health-related bacteria (PHRB)

sewage, industrial effluents, surface water, mine runoff,                diversity in industrial samples [24]. In such cases,
and AGR-based drinking water). These findings are in                     bacterial groups having a wide metabolic capacity
accordance with earlier studies [26, 30, 55], where dis-                 may survive, such as members of the Comamonada-
tinct bacterial communities found in groundwater, sur-                   ceae and Rhodocyclaceae families (Betaproteobacteria
face water, treated effluent, treated drinking water, mine               class) detected in the industrial effluent samples (Fig.
runoff, and household tap water.                                         3). In future studies, coupling the nutrient analysis re-
  Ecological conditions affect bacterial diversity and                   sults to the fecal microbial analysis could provide
community structure [55]. For example, surface water                     additional information about the surface water con-
experiences large changes in temperature and daylight                    tamination events [6].
hours in different seasons of the year. However, such                      Surface water samples had a high taxonomic diversity,
changes did not affect the other water types in the                      as determined by the Shannon diversity index (Table 3).
present study as the surface water was the only sam-                     The higher taxonomic diversity in surface water than in
ple group where seasonal changes affected the bacter-                    the drinking water treatment process samples was con-
ial composition. In contrast, groundwater (i.e.,                         sistent with earlier findings [17, 30]. In addition to
observation and production wells sampled in this                         higher alpha-diversity in raw water than in treated
study) may have more uniform physico-chemical con-                       drinking water (Table 3), Gülay et al., [17] reported the
ditions—such as anoxic, dark, and oligotrophic—with                      negative relationship between bacterial diversity and en-
a constant temperature. Furthermore, the sewage                          ergy input. Thus, the noted lowest alpha-diversity of
samples and industrial effluents have a lower dis-                       bacteria in GW observation and production wells in our
solved oxygen concentration due to high biological                       study is expected, as the available energy sources for
and chemical oxygen demand. Also, the controlled                         bacterial cells decrease consistently during the water
and uniform environment may shape the bacterial                          purification process. The low alpha-diversity in the
communities. For example, the chemical toxicity due                      drinking water samples may imply biologically stable
to the use of biocides may explain the low taxonomic                     water [45]. Traditionally, the biological stability is mainly
Tiwari et al. Environmental Microbiome   (2021) 16:11                                                       Page 13 of 17

regulated by monitoring the heterotrophic plate count        oxidizer, photoautotroph, photo-heterotroph, or fer-
(HPC [51];), the parameter being able to detect only cul-    menter [50]. Industrial and sewage effluent also had
turable micro-organisms [45]. The use of alpha-diversity     reads of the Rhodocyclaceae family (Betaproteobacteria
may provide a better idea of the biological stability of     class), which are photo-heterotrophs, plant-associated,
water than HPC as high-throughput sequencing mea-            nitrogen-fixing aerobes capable of utilizing varying
sures both culturable and difficult to culture autotrophic   sources of organic carbon and energy [41]. Members of
and heterotrophic bacteria [45].                             the Weeksellaceae family (Bacteroidetes phylum), known
  The lower taxonomic diversity of surface water in the      to be aerobic and free-living environmental bacteria
summer season (Table S5) and seasonal variation in the       [42], were present in industrial effluent samples (Fig. 3).
community structure have previously been reported [35,       Earlier studies reported this group from sewage and acti-
54]. The lower alpha-diversity in the summer season can      vated sludge [3, 42]. Wang et al. [48] suspected the
be due to bacterial predation [33]. The Finnish river eco-   higher organic carbon may favor the growth of the Fla-
system can become more active during summer and              vobacteriia class in aquatic systems.
may increase the eukaryotes that graze on bacteria,             The detection of the bacterial phyla Proteobacteria,
which can control bacterial diversity. Another explan-       Actinobacteria, and Bacteroidetes in surface water
ation can be inactivation due to higher solar radiation      (Fig. 2) was consistent with earlier findings [26, 48,
and longer daylight exposure.                                54]. In contrast, Abia et al. [1] reported a higher rela-
                                                             tive abundance of Alphaproteobacteria than Betapro-
Characteristics of the detected bacterial community          teobacteria in surface water samples. Additionally,
members                                                      they reported relatively higher (70%) Proteobacteria
Bacterial communities belonging to classes Epsilonpro-       reads of river water samples than in our study. The
teobacteria, Gammaproteobacteria, Fusobacteriia, Ba-         relatively lower proportion of Proteobacteria phylum
cilli, Clostridia, and Bacteroidia were mostly detected      in surface water and pretreated samples than in other
from municipal sewage samples and were reduced dur-          sample groups can be due to the presence of environ-
ing the sewage treatment process (Fig. 2). These bacter-     mental bacteria like Actinobacteria. The Actinobac-
ial classes have also been detected previously in raw and    teria phylum was the most abundant among the
treated sewage [33, 48]. The significant reduction of        Gram-positive bacteria in surface water. The identi-
these bacterial groups during the sewage treatment           fied reads were mostly heterotrophic or symbiotic
process is not surprising. Many of these bacteria prefer     with plants such as nitrogen-fixing bacteria belonging
to grow in the anaerobic gut environment, while waste-       to the family ACKM1 [18]. Although an attempt was
water treatment with activated sludge is an aerobic          made to filter out the chloroplast reads, it was detected
process. The detection of these bacterial groups in mine     in surface water samples (Fig. 2). The Chloroplast se-
runoff may indicate the poor management of sanitary          quences are closely related to Cyanobacteria; they can ori-
waste in the mine area (Fig. 2).                             ginate from cyanos and are therefore difficult to remove
   Most Epsilonproteobacteria detected in sewage sam-        from the data completely. There could be classification
ples are related to the genus Arcobacter, many of which      problems in the taxonomic databases related to these 16S
may be considered commensal, pathogenic, or free-            rRNA sequences. Chloroplast reads have also been re-
living. These bacteria can grow in micro-aerobic, anaer-     ported in earlier 16S rRNA gene amplicon sequencing
obic, or aerobic conditions. Their optimum temperature       studies [56].
ranges from 25 to 42 °C. The majority of the Gamma-             Other major groups found in surface water were the
proteobacteria reads of sewage effluent samples were         families Oxalobacteraceae and Methylophilaceae (Beta-
from the families Aeromonadaceae and Moraxellaceae.          proteobacteria class). These are free-living environmen-
Aeromonadaceae was also abundant in industrial sam-          tal bacteria groups known for their wide range of
ples (Fig. 3). Members of these two groups can be patho-     phenotypic properties and include aerobic or micro-
genic, commensal, or free-living [25, 47]. Some              aerobic, facultative anaerobic, heterotrophic, and meso-
Aeromonadaceae are strict aerobes, while others are fac-     philic members [4, 14]. The Methylophilaceae can utilize
ultative anaerobes. This group can be mesophilic or psy-     methanol or methylamine as a source of carbon and en-
chrophilic [25].                                             ergy and have been reported in numerous environments
   Members of the Comamonadaceae family (Betaproteo-         including activated sludge [14]. The close similarity in
bacteria class) were detected in all sample groups but       bacterial communities in surface water samples with
were most abundant in industrial effluents, municipal ef-    pretreated samples implies that the pretreatment process
fluent, and mine runoff (Fig. 3). Many are free-living and   does not effectively change the bacterial communities.
exhibit wide metabolic capabilities such as aerobic orga-    The seasonal variation in the taxonomic profile in sur-
notroph, anaerobic denitrifier, iron reducer, hydrogen       face water was consistent with an earlier study [54].
Tiwari et al. Environmental Microbiome (2021) 16:11 Page 14 of 17
The relatively high proportion of the Proteobacteria Bifidobacterium and Lactococcus are gut commensal
phylum (73%) in the AGR production well samples was communities with limited pathogenicity [23].
higher than the 47% reported in Ma et al. [36] from
samples originating from drinking water production Variation in predicated functions
with river water with a traditional treatment process. The highest mean KO values of all types of pre-
The gradual increase in Proteobacteria reads from sur- dicted functions were detected in the industrial efflu-
face water, pretreated water, GW observation well, and ent samples. Indeed, in industrial water systems,
(finally) the production well (Fig. 3) suggests that other microbes might need to activate more pathways to
bacterial groups may not tolerate the change in the en- enable their survival in that environment [11]. For
vironment. The majority of the bacterial reads belonged example, activation of terpene and secondary metab-
to Betaproteobacteria classes from groundwater sam- olite pathways was observed. This suggests a selec-
ples (observation and production wells) that were not tion towards bacterial groups capable of degrading
identified at deeper taxonomic levels than class and some toxic compounds that may be present in in-
order (Fig. 3). Rhodospirillaceae (within the Alphapro- dustrial waste. This selection possibly explains the
teobacteria class) was one of the most abundant relatively lower diversity recorded in the industrial
families in groundwater. This group is anaerobic che- effluents. Additionally, other toxic components of in-
moheterotrophic under dark conditions and hetero- dustrial waste may promote the production of the
trophic under aerobic conditions [40]. Members of the secondary metabolites (such as antibiotics and bacte-
metabolically diverse soil bacterial groups Acidobac- riocins) used by the producing bacteria to eliminate
teria-5 and Acidobacteria-6 were also found in ground- competitors [21]. The other predicted functions,
water samples (Fig. 2), which were also previously such as those that relate to nitrogen, sulfur, amino
observed by Kielak et al. [31]. acid, and lipid metabolisms, were relatively higher in
the industrial effluents, suggesting that some of the
enriched bacterial groups are engaged in the
The distribution of bacteria with public health relevance utilization of many available carbon and energy
in the samples sources needed for growth. In contrast, in our data,
The use of the 16S rRNA gene-based high-throughput sewage influent and mine runoff samples dramatic-
method offers the possibility to simultaneously get infor- ally reduced these predicted functions, suggesting
mation from multiple PHRB groups. However, in gen- that the bacterial communities in these samples are
eral, a much larger volume of water is analyzed when facing greater environmental perturbations. While
enumerating pathogens from environmental samples. these communities formed different clusters, the pre-
Therefore, the resolution of the taxonomic assignment dicted functions and taxonomic groups observed
of the 16S rRNA gene sequence might not be high suggest that these are relatively complex communi-
enough to reliably identify and quantify the pathogens ties capable of withstanding seasonal changes, in part
[23]. In the present study, the abundance of PHRB read due to the diversity of functional redundancies.
counts in sewage samples illustrates municipal sewage as Furthermore, surprisingly, we did not notice that the
a source of PHRB. The abundance of Mycobacterium predictive ecological functions of bacterial communities
and Legionella reads in environmental samples was not were independent of the sample groups and taxonomic
surprising as these two genera are independent of fecal variation. Although our study did not determine the ac-
contamination. Although the high-throughput sequen- curacy of the prediction, the developers of the PICRUSt
cing method used here gives information only up to the tool [34] claimed about 80% accuracy of the truth for
genus level, the detection of genera that house some the prediction. These results imply that a wide bacterial
pathogens can raise the suspicion that the ecological community range in the aquatic ecosystem performs
conditions may also be favorable for some of the patho- similar ecological functions, and taxonomic variation
genic species to survive. In addition, the bacterial diver- may have a low effect on overall ecological functions.
sity in drinking water can also have some human health Furthermore, the poorly classified OTUs at the genus
benefits. For example, Hertzen et al. [20] claimed that level—38% overall; lowest in groundwater (10%) and
bacterial diversity in drinking water may reduce atopy highest in mine runoff (60%)—may have an effect on
among the public. Furthermore, the PHRB listed in this similar KO hits on various types of sample groups.
study necessarily does not have to have any negative PICRUSt can help to predict the presence of genetic
public health impacts. Of the included genera, Citrobac- functions in difficult-to-classify lower taxonomic groups,
ter, Klebsiella, Escherichia, and Enterobacter are better even if representative full genomes have not been com-
known as a fecal indicator bacteria of water quality and pletely characterized by using gene sequences found in
not considered pathogens. Additionally, genera like closely related bacterial groups. The reason behind theYou can also read