Egypt's water budget deficit and suggested mitigation policies for the Grand Ethiopian Renaissance Dam filling scenarios
←
→
Page content transcription
If your browser does not render page correctly, please read the page content below
LETTER • OPEN ACCESS

Egypt’s water budget deficit and suggested mitigation policies for the
Grand Ethiopian Renaissance Dam filling scenarios
To cite this article: Essam Heggy et al 2021 Environ. Res. Lett. 16 074022

View the article online for updates and enhancements.

                               This content was downloaded from IP address 46.4.80.155 on 22/08/2021 at 22:17
Environ. Res. Lett. 16 (2021) 074022 https://doi.org/10.1088/1748-9326/ac0ac9
LETTER
Egypt’s water budget deficit and suggested mitigation policies for
OPEN ACCESS
the Grand Ethiopian Renaissance Dam filling scenarios
RECEIVED
25 February 2021 Essam Heggy1,2,∗, Zane Sharkawy3 and Abotalib Z Abotalib1
REVISED 1
6 May 2021 University of Southern California, Viterbi School of Engineering, Los Angeles, CA 90089, United States of America
2
Jet Propulsion Laboratory, California Institute of Technology, 4800 Oak Grove Drive, Pasadena, CA 91109, United States of America
ACCEPTED FOR PUBLICATION 3
11 June 2021
Cornell University, Charles H. Dyson School of Applied Economics and Management, Ithaca, NY 14853, United States of America
∗
Author to whom any correspondence should be addressed.
PUBLISHED
1 July 2021 E-mail: heggy@usc.edu
Keywords: Nile River, water budget, water stress, Grand Ethiopian Renaissance Dam
Original content from
this work may be used Supplementary material for this article is available online
under the terms of the
Creative Commons
Attribution 4.0 licence.
Any further distribution Abstract
of this work must
maintain attribution to
The Nile River is a unique environmental system and essential water resource for its basin riparian
the author(s) and the title nations. Population growth, changes in precipitation patterns, damming and usage rights disputes
of the work, journal
citation and DOI. present extreme challenges in utilizing and managing the basin’s primary water resource. These
stress factors are of particular concern for highly populated Egypt, the furthest downstream
recipient of the Nile’s water flow. Previously, colonial agreements had granted Egypt and Sudan the
majority of water use rights on the Nile without neighboring Ethiopia receiving any specific
allocation. Today, Ethiopia plans to increase its energy production through its Nile-powered Grand
Ethiopian Renaissance Dam (GERD). While the 74-billion cubic meter (BCM) dam presents
promising development opportunities for Ethiopia, the Nile’s altered flow will increase the existing
water deficit for Egypt—the quantification and mitigation of which are still largely unconstrained
and under intense debate. To address this deficiency, we estimate that the median total annual
water budget deficit for Egypt during the filling period, considering seepage into the fractured
rocks below and around the GERD reservoir, as well as the intrinsic water deficit and assuming no
possible mitigation efforts by Egyptian authorities, will be ∼31 BCM yr−1 , which would surpass
one third of Egypt’s current total water budget. Additionally, we provide a feasibility index for the
different proposed solutions to mitigate the above deficit and assess their economic impact on the
GDP per capita. Our results suggest that the unmet annual deficit during the filling period can be
partially addressed by adjusting the Aswan High Dam (AHD) operation, expanding groundwater
extraction and by adopting new policies for cultivation of crops. If no prompt mitigation is
performed, the short-term three-year filling scenario would generate a deficit that is equivalent to
losses to the present cultivated area by up to 72% resulting in a total loss of the agricultural GDP by
$51 billion during the above-mentioned filling period. Such figures are equivalent to a decrease in
the total national GDP per capita by ∼8%, augmenting existing unemployment rates by 11%,
potentially leading to severe socioeconomic instability.
1. Introduction main tributaries of the Nile are the White Nile, ori-
ginating in the Great Lakes region in Central Africa,
The Nile, the longest and one of the oldest rivers and the Blue Nile, Sobat, and Atbara rivers, streaming
on Earth, is a unique environment and ecosystem from the Ethiopian Highlands (Melesse et al 2014).
that crosses four climatic zones (Dumont 2009). It Conversely, the exploitation of the Nile is mostly
is also an important source of water for 11 coun- concentrated in the downstream riparian countries,
tries in Africa: Burundi, the Democratic Republic namely through Egypt and Sudan, which are depend-
of Congo, Egypt, Eritrea, Ethiopia, Kenya, Rwanda, ent on the Nile water for 98.26% and 96.13% of
South Sudan, Sudan, Tanzania, and Uganda. The their annual water demand, respectively (FAO 2015).
© 2021 The Author(s). Published by IOP Publishing Ltd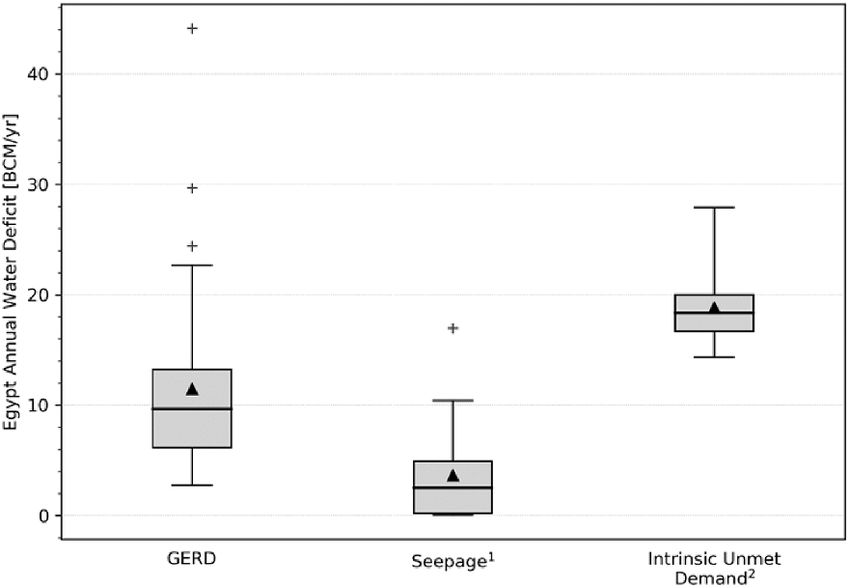
Environ. Res. Lett. 16 (2021) 074022                                                                     E Heggy et al

During the past decades, upstream riparian countries,       river, which could impact its share of water from the
which could count on a higher endowment of fresh-           Nile. Nonetheless, major efforts towards cooperation
water resources, were not actively involved in disputes     were achieved in 1999 with the foundation of the Nile
over the Nile’s water sharing rights, but the climatic      Basin Initiative (Swain 2011). All the riparian states
and anthropogenic pressures have and will potentially       joined the initiative, except for Eritrea, which remains
intensify their current and future water needs. This        an observer. Since then, a growing number of infra-
can trigger one of the largest water stress cases in        structure projects have been implemented or planned
modern era.                                                 along the Nile.
     The Nile has always been the primary source to              In 2011, the Ethiopian government announced a
sustain the irrigation practices in the basin for over      plan to construct a hydroelectric dam on the Blue
5000 years (Hughes 1992). The development of large-         Nile River named the Grand Ethiopian Renaissance
scale hydroelectric infrastructures began in the early      Dam (GERD). Ethiopia’s current stated goals are to
twentieth century. This included the Aswan Low Dam          increase its hydropower generation potential in order
in 1902, followed by the Aswan High Dam (AHD)               to produce excess energy to be exported to the neigh-
in 1961. Because of these dams, the lower part of           boring countries, to further their fishing activities and
the basin has experienced increasing environmental          to expand the local economy road network. The uni-
repercussions, particularly regarding the reduction of      lateral decision of the Ethiopian government reflects
sediment flow downstream. This has reduced soil fer-        the lack of real cooperation among the riparian states
tility of agricultural lands and the overall water pro-     and opens up the claim for the revision of the water
vision (Smith 1986) while accelerating the Nile delta       rights over the Nile. This is especially the case with
coastal erosion and seawater intrusion (Negm 2017,          such an uncertain future marked by increasing water
Rateb and Abotalib 2020).                                   stress. With the projected population growth in both
     The exploitation of the Nile is critical for ensur-    Sudan and Egypt, the regional water stress is expec-
ing water usage for more than 260 million people liv-       ted to rise (Mazzoni et al 2018). Both countries also
ing in the riparian countries and will be even more so      fear a reduction in their water shares during the initial
as populations surge in Egypt, Ethiopia, and Sudan.         filling period of the GERD.
These nations alone are expected to reach a total pop-           The Ethiopian government claims that no major
ulation of about 340 million by 2050 (Swain 2011).          effects will be observed regarding the water availabil-
This population growth, coupled with the economic           ity for the two downstream riparian countries (Abtew
development and the projected changes in precipita-         and Dessu 2019). Conversely, there is a broad con-
tion patterns and groundwater depletion induced by          sensus that there will be measurable effects caused
global warming, are expected to increase the regional       by the different filling policies of the reservoir on the
water demand and to pose additional stress and              water share for Sudan and Egypt (Hamada 2017). To
challenges on its utilization (Mazzoni et al 2018).         this day, no univocal environmental and/or economic
Moreover, the transboundary nature of the Nile basin        impact assessments highlighting the influence of the
and the uncertainties surrounding the evolution of its      impounding and future operation of the dam have
flow dynamics, with highly variable precipitation pat-      been made. During the filling phases, the downstream
terns in the recharge catchment basins, is causing an       discharge of the Blue Nile will be reduced, decreasing
increasing debate on water rights over the river water      the amount of water that flows into the Nile. This will
shares. This is most notably the case with the British      have clear, measurable effects on the water security for
colonial era, which sought to maximize Nile flow into       Egypt and Sudan in terms of both budget and quality.
their colonized Egypt and Sudan. Britain did so by               Between May 2011 and May 2013 and based
creating an agreement with the king of Ethiopia that        on an invitation from the Ethiopian government to
prevented any work on the Blue Nile that obstruc-           the downstream countries (i.e. Egypt and Sudan),
ted water flow into the Nile’s other tributaries (Abtew     an international panel of experts (IPOE) conduc-
and Dessu 2019). The agreement between two now              ted a thorough review of the design documents and
defunct monarchies is argued to be nullified.               the geotechnical characteristics of the GERD (IPOE
     Disputes over water rights over the Nile River star-   2013). However, the final report of the IPOE indic-
ted in 1959 when the two downstream riparian coun-          ated that the submitted documents by the Ethiopian
tries, Egypt and Sudan, signed the bilateral agree-         government lack the economic justification for the
ment ‘for the full utilization of the Nile water’. No       proposed power capacity of 6000 MW (Interna-
water budget was specifically allocated to any of the       tional Panel of Experts (IPOE) 2013). Following a
upstream riparian countries. Throughout the years,          few years of strong hydropolitical divergence, Egypt,
disputes were mediated by international organiza-           Sudan, and Ethiopia converged on the establishment
tions, such as the World Bank, whose funding for            of the first agreement on the management of the
any development project on the Nile is subject to           Dam in March 2015 (Tawfiq 2016). This mediation
the approval of all co-riparian states. However, Egypt      contained a ‘Declaration of Principles’ to be fol-
has often used this requirement in its favor, limiting      lowed as a guideline for what concerns the overall
the construction of any large infrastructures on the        management of water use. There is still a great deal

                                               2
Environ. Res. Lett. 16 (2021) 074022 E Heggy et al
of uncertainty regarding the effective impacts of the (2) Technical agreement on the design of the GERD
GERD on Egypt’s water supply, let alone on the eco- (seepage and spilling prevention), which relates also
system of the Nile River, especially given the lack of with the uncertainty related to the volume of water
published information regarding the technical spe- granted to Egypt and Sudan during the filling period,
cifics of the project. The international water science (3) Need for an agreement on the sale of hydropower
community has been exploring several scenarios on from the GERD, and (4) Assessment of the potential
the possible additional water deficit created by the downstream impacts on Egypt and Sudan, particu-
dam along with mitigation proposals (e.g. Bastweesy larly for the agricultural sector.
2015, Bekhit 2016, Donia and Negm 2018). Nonethe- The construction of the GERD triggered incon-
less, none of the models that have studied this issue clusive debates on the hydrological, engineering, eco-
have considered the forecasted growth of the intrinsic nomics and geopolitical perspectives of the project. It
water deficit that Egypt will experience on its own is challenging to identify where the current and future
(without accounting for external contributing factors policies for cooperation should aim since both the
such as the GERD), which has to be included when available information on the project and the poten-
considering future mitigation or adaptation solutions tial technical-scientific support are often scattered,
as addressed herein. contradictory whenever publicly available. Even at
The GERD is located approximately 500 km these final stages of the project, little data or inform-
northwest of the capital, Addis Ababa, along the Blue ation is publicly available on the GERD to allow
Nile, ∼20 km from the southern border of Sudan. proper simulation of the overall environmental and
When the dam starts operating, it will be the largest economic impacts that the establishment of the dam
hydropower project in Africa (Chen and Swain 2014) will have on the three riparian countries. Due to the
with a lateral extension of 1800 m, a max wall height nationally and internationally sensitive nature of the
of 155 m, and an overall total capacity of 74 billion m3 topic, the Ethiopian government has announced only
(BCM). The project also includes two hydroelectric the major outlines of the project with insufficient
power stations installed at the right and left banks of technical details. Nonetheless, more information is
the downstream river comprising of 13 Francis tur- becoming available as the project progresses, and thus
bines that will grant a total installed power capacity future predictions are becoming more precise. For
of 6 GW, and estimated yearly potential production these reasons, while performing a thorough literature
of 15 GWh (Salini Impregilo 2018). Among the bene- review on the GERD, we have mostly focused our ana-
fits for the downstream countries, the GERD is expec- lysis on the latest available peer-reviewed publications
ted to retain most of the sedimentary silt material that and reports.
flows with the Blue Nile. This would allow the hydro- While there is substantial uncertainty regarding
power dams in Sudan to produce up to ∼36% more the effective influence of the dam on the resulting
energy per year and greatly reduce the annual costs of outflow (Abtew and Dessu 2019), there is a broad
dredging the reservoirs and canals (Kahsay et al 2015). consensus that the major impacts in terms of water
Furthermore, the GERD will create a more regular deficit for the downstream riparian countries will be
flow regime over the whole year for the Blue Nile in mostly observed during the filling years (Negm and
Sudan, which will also be reflected in the main part Abdel-Fattah 2019). In general, the duration of the
of the? Nile River. A more continuous flow should filling period is inversely proportional to the decrease
guarantee a more stable annual electricity production of the water flow, although one has also to consider
and irrigation water supply for Sudan. As for Egypt, the different effects of seepage and evaporation. Since
the Nile flow continuity, regularity and sedimentation no official announcements on the filling policies have
control are currently achieved by the gauge control on been given yet, all the considered studies have tested
the AHD. different, but comparable, filling scenarios by estab-
This large infrastructure project has been under lishing fixed or variable impounding rates for the
construction since 2011 and is reportedly in final dam. Furthermore, other differentiating characterist-
completion phase. The first phase of the GERD filling ics include the modeling of climatic variability, the
project started during the rainy summer season of estimation of some unknown technical aspects of the
2020 (Kansara et al 2021), yet it is still uncertain when dam infrastructure, and the types of results that they
the subsequent filling phases will begin, and what provide.
regional environmental impacts the Nile’s altered We have also observed that there are no currently
flow will generate in both the short and long term published studies that consider the water budget defi-
on the downstream communities and ecosystems. As cit from a more global perspective by combining
pointed out by a recent report from the MIT Abdul the downstream effects of the GERD to the exist-
Latif Jameel World Water and Food Security Lab (Al ing significant water scarcity that countries like Egypt
Jameel 2014), four major technical concerns require are already experiencing and that will worsen in the
a resolution: (1) Planning needed for coordinating near future (Mazzoni et al 2018). Egypt is already
the operation of the AHD and the GERD during experiencing severe water stress, which it is currently
the period of filling and eventual prolonged drought, being mitigated through the repeated reuse of the
3Environ. Res. Lett. 16 (2021) 074022 E Heggy et al
agricultural drainage water. This, in turn, affects the analysis showed that annual reservoir fill rates
overall water quality by increasing its salinity and the of 8%–15% can be beneficial for hydroelectric
concentration of pollutants (Hegazy et al 2020). Fur- power generation for Ethiopia with a minimal
thermore, very few studies have accounted for the effect on stream flow into Egypt assuming no
overall analysis of the additional water supply that significant impact of climate change until 2039.
the GERD will require to cope with the losses due They also concluded that larger fill rates beyond
to the natural seepage from the reservoir (Liersch the policy of 15% will have adverse impacts on
et al 2017). The Nubian Block, on top of which the the stream inflow. For example, with a 100% fill
GERD reservoir and dam are constructed, is com- rate policy (equivalent to 2.5 years to reach full
posed of highly fractured igneous and metamorphic supply level (FSL)) will result in a 55% reduction
rocks (Mohamed and Elmahdy 2017). This hydro- of stream flow.
geological setting could cause major leakage of water (c) King and Block (2014) examined five policies;
from the reservoir, which could reach up to ∼25% three policies with impounding 5%, 10% or 25%
(Liersch et al 2017). Even though the entire reservoir of total monthly inflow, while the other two
will be built to store up to 74 BCM, the actual volume policies are conditional on exceeding the histor-
that will be needed to fill-up the basin may be even ical average streamflow (HASF) or 90% of the
higher as shown in the studies summarized in table 2 HASF. The results showed that the 5% filling
if we account for the losses due to seepage and evapor- policy will not significantly affect downstream
ation. Wheeler et al (2020) simulated the response of flow but also will not help reaching the FSL of the
the AHD during scenarios of different filling periods reservoir. On the other hand, the 25% policy, can
as well as the period after the reservoir fill including a reduce the average downstream flows by more
multi-year drought scenario and arguably concluded than 10 BCM per year.
that the risk of water shortage in Egypt, in response (d) Liersch et al (2017) assumed three scenarios
to the construction of GERD, is relatively low. Nev- based on monthly minimal discharges to be
ertheless, adoption of new agricultural policies that released downstream: 75%, 50% and 25%. Each
depend on low water-consuming crops will be feasible of these scenarios was simulated with three seep-
to avoid adverse impacts of the multi-year drought. age rate assumptions (low, medium, and high),
In the present study, we evaluate the effects of the resulting in 18 filling scenarios considering cli-
GERD on the short-term Egyptian availability of the mate change under wet and dry conditions. The
Nile streamflow by considering different filling scen- results showed that with the release of Q50 and
arios and strategies simulated in the most recent pub- Q75 of average monthly discharge, the flows
lished literature. Then, we assess Egypt’s total water might be reduced by 10%–19% and 16%–44%,
budget deficit arising from the GERD filling scen- respectively, while releasing monthly Q25 dis-
arios, seepage and the intrinsic one resulting from charges will reduce only 5%–13% of the average
population growth. We evaluate the feasibiities of the monthly discharge to downstream countries and
suggest mitigation policies to address the resulting the FSL will be reached in eight years. The sim-
deficit and discuss the socioeconomic impacts con- ulated evaporative losses during the filling pro-
sidering each of the proposed filling scenarios for the cess correspond to 6.5%–8.7% of average annual
GERD. inflows while the seepage losses ranged between
negligible to 24%–32% of inflows. The maximal
2. Methods seepage loss scenario is particularly highlighted
in the present study.
2.1. Filling scenarios of the GERD (e) Omran and Negm (2018) indicated that in a
The scenarios incorporated in our analysis of the scenario of filling the GERD in seven years, Egypt
water budget deficit in Egypt include the impact of will face a significant shortage in water quant-
the GERD filling scenarios and the associated storage ity associated with a reduction of 20% to 30% of
capacities, and are summarized as follows (table 1): electricity production from the AHD.
(f) Wheeler et al (2016) analyzed five different
(a) Donia and Negm (2018) assumed three stor- annual release scenarios: 25, 30, 35, 40, and
age capacity scenarios: 74, 35, and 18.5 BCM 45 BCM yr−1 . The results indicated that redu-
and three filling period scenarios: 5, 10, and cing the risks to stream inflow into Egypt and
20 years. The results indicated that with the five- energy generation can be achieved through com-
year filling period of the GERD at a storage capa- binations of agreed annual releases from the
city of 74 BCM, the AHD reservoir will empty GERD as well as adopting a drought manage-
and will reach its minimum water level of 147 m ment policy for the AHD.
by the fifth year. (g) Zhang et al (2015) considered five filling policies:
(b) Keith et al (2017) examined seven filling rate impounding of 5, 10, and 25% of the Blue
strategies: retaining 100%, 50%, 25%, 20%, 15%, Nile inflow and retaining quantities greater
10%, and 5% of the Blue Nile inflow. Their than HASF or 90% of HASF with possible
4Environ. Res. Lett. 16 (2021) 074022 E Heggy et al
Table 1. Filling scenarios considered in our water budget deficit analysis for Egypt.
Num. of
Reference Scenarios4 Description
Donia and Negm 6 (4) 3 storage capacities scenario: 74, 35, and 18.5 BCM.5
(2018) 3 filling period scenarios: 5, 10, and 20 years.
Keith et al (2017) 7 (6) 7 filling rate strategies: retaining 100%, 50%, 25%, 20%, 15%, 10%, and 5% of the
Blue Nile inflow6
King and Block 5 (4) 3 policies as fractions of total monthly inflow: impounding of 5, 10 or 25%
(2014) 6. 2 policies with retention rates contingent on exceeding the HASF7 retain any
quantity greater than HASF or of 90% HASF.
Liersch et al (2017) 18 (4) 3 scenarios based on monthly minimal discharges to be released downstream:
monthly exceedance probabilities of 75%, 50% and 25%8 .
3 scenarios based on seepage rate assumptions: low, medium, and high9
2 hydro-climatic scenarios: wet or dry. In our analysis we only used 4 scenarios
including Q75 and Q50 under wet and dry conditions and assuming maximal
seepage (32%) in all scenarios.
Omran and Negm 1 seven years, Egypt will face a significant shortage in water quantity associated with
(2018) a reduction of 20% to 30% of electricity production from the AHD.
Wheeler et al (2016) 5 5 annual release values: 25, 30, 35, 40, and 45 BCM yr−1 .
Zhang et al (2015) 5 (4) 5 filling policies: impounding of 5, 10, and 25% of the Blue Nile inflow and
retaining quantities greater than HASF or of 90% HASF5. 8 possible precipitation
changes −20, −10, −5, 0, +5, +10, +15, and +20% by year 206010
Zhang et al (2016) 6 2 scenarios with fractional impounding: 10 and 25% of inflow. 1 threshold filling
strategy that allows any streamflow volume in excess of the HASF to be impounded
in the reservoir. 3 absolute filling strategies: 4, 6, and 8 years.
4
In parenthesis the number of scenarios considered in our study.
5
Scenarios with 35 and 18.5 BCM capacity are not considered in this study.
6
5% fill rate is not considered in this study given their unlikeliness of adoption (>50 years filling duration).
7
HASF: historical average stream flow.
8
25% scenario not considered in our study since filling would not be reached before 20 years.
9
Seepage effects considered on a separate analysis.
10
Results averaged among different climatic scenarios.
precipitation changes of −20, −10, −5, 0, +5, population projections under the Shared Socioeco-
+10, +15, and +20% by the year 2060. The res- nomic Pathways, Regional rivalry (SSP3) scenario.
ults showed that impounding 10% or 25% of The SSP3 scenario is favorably selected because it
monthly streamflow will result in a 6% or 14% incorporates the highest challenges towards mitig-
average reduction in streamflow into Egypt dur- ation and adaptation, with strong regional rivalry
ing the first 5 years, respectively. (Mazzoni et al 2018). Moreover, we implement the
(h) Zhang et al (2016) proposed two scenarios with different filling scenarios in terms of time scales and
fractional impounding: 10 and 25% of inflow, retained volumes that we derive from a thorough lit-
one threshold filling strategy that allows any erature review and collect the most recent analysis.
streamflow volume in excess of the HASF to be Table 1 summarizes these different filling scenarios
impounded in the reservoir and three absolute or strategies adopted by each study. We then derive
filling strategies: 4, 6, and 8 years. The results the additional average annual water deficit for Egypt
indicated that the 25%, 6 years and 8 years scen- generated by the GERD filling and by the losses due
arios can provide the best scenarios for both to seepage and evaporation from Liersch et al (2017)
upstream and downstream countries. and Wheeler et al (2020). A special emphasis is given
to the water loss from the GERD due to seepage due
to two reasons. First, the seepage losses have been
In order to assess the total water budget deficit,
largely underestimated in previous studies that dealt
the best mitigation policies and the socio-economic
with evaluating the impact of the GERD and second,
impacts of each of the filling scenarios for the GERD,
the seepage-related losses can reach annually up to 15
we use three methods that are summarized herein.
BCM compared to a much lesser annual evaporation-
related losses of only 3.8 BCM (Liersch et al 2017).
2.2. Water budget deficit assessment In our analysis, we only select studies published
To constrain the ambiguity around the forecasts in on the topic in the last 5 years since some of the main
Egypt’s total water budget deficit during the sugges- technical specifications of the GERD have been pub-
ted filling periods of the GERD, we use the estim- licly released only lately (such as the dam total capa-
ates of the water budget deficit from the water budget city). Among all considered studies, different filling
model in Mazzoni et al (2018) and considering future policies have been explored by either considering an
5Environ. Res. Lett. 16 (2021) 074022 E Heggy et al
a priori fixed number of years for the duration of the to a [0,1] interval, and we finally compute the over-
filling period, by using fractional retention rates of all feasibility index as a weighted sum of the three
the total monthly stream flow entering in the reservoir components. Given that there are different ranges and
that guarantees a permanent impoundment of water values for the costs and the implementation time of
every month to fill-up the dam, or again by employing each measure, a range of values is given for the feas-
threshold-based policies, with retention rates condi- ibility index of each mitigation strategy.
tional to a certain fixed value, which instead do not
assure retention for storage in the years where the
2.4. Modelling the economic impact
stream flow is lower than the selected baseline. To be
We use a simplified economic model to assess the
able to compare the outcomes of the different studies
impacts of the total water budget deficit under the
we average their results across the climatic scenarios
different GERD’s filling scenarios on the evolution
that they have considered in their analysis to match
of Egypt’s agricultural GDP. This model presents a
our use of the SSP3 one.
first-order analysis providing a lower limit estim-
ate of the equivalent economic impact of the total
2.3. Feasibility index for the different mitigations
water budget deficit on the agricultural sector due to
In table 2, we summarize what are all the most plaus-
loss in crop productivity arising from land degrad-
ible proposed strategies that Egypt could undertake
ation from lack of irrigation) and not accounting
to mitigate the short-term and temporary effects of
for the consequences on the industrial sector that
the GERD filling in terms of water deficit in particu-
are difficult to assess due to the lack of published
lar: AHD Operation reduction (i.e. AHD rules to be
records. The model (suppl. figure S1 available online
readjusted to cope with the water reduction), ground-
at stacks.iop.org/ERL/16/074022/mmedia) uses aver-
water extraction expansion, crop type selection, mod-
age GDP growth rates projections from historical data
ernizing the irrigation system, changing fields canals
for three cases: low (1.76%), medium (4.47%), or
to pipes, increasing wastewater reuse, rain harvest-
high (7.16%) growth rates from projections of Egypt’s
ing, expanding desalination and reducing evapora-
GDP (World Bank 2016). These projections repres-
tion in lake Nasser. We then develop a correspond-
ent the non-GERD GDP estimates. We then calcu-
ing feasibility index calculated through a first-order
late the decrease in GDP for the 3, 5, 7, 10, and
duration-cost-benefit analysis of the proposed mitig-
21 years GERD filling scenarios. We finally calcu-
ation strategies to obtain a parametric indicator that
late the GDP per capita using historical data and
allows us to evaluate the practicability of each pos-
the population projections from the 2019 Revision
sible solution. The index is expressed as an inversely
of World Population Prospects (UN World Popula-
proportional function of the time required for imple-
tion Prospects 2019) for both the GERD and non-
menting the strategy (i.e. hereafter is referred to as
GERD cases. Yearly water budget loss and equivalent
implementation swiftness) and its annual costs, and
land loss are approximated using relationships from
directly proportional to the benefits in terms of water
Mazzoni et al (2018) and Hamada (2017) respect-
volume in BCM yr−1 :
ively, where the loss of each 5 BCM would result
( in total degradation of ∼0.42 million hectares (~1.2
Feasibility Index = f Duration−1 , Costs−1 ,
million feddan). Egypt’s total agricultural land area
× Benefits) ,
(∼9.1 million feddan equivalent to ∼3.822 million
hectares) is valuated as Egypt’s agricultural GDP to
( )
1 calculate the decrease in GDP due to total degradation
Feasibility Index = βD
Duration norm often expressed in the local unit feddan (one Feddan
( ) is equal to 4200 m2 ). We also assess the increase in the
1
+ βC unemployment due to land degradation in the agri-
Costs norm
cultural sector (which employ a fourth of the work
+ βB Benefitsnorm . force in Egypt) using the average number of farm-
ers per feddan from the Egyptian Ministry of Water
The three coefficients βD , βD , and βD are set equal
Resources and Irrigation (MWRI 2014).
to 1/3 to give the same weight to each variable. For
the duration variable, we select five scenarios with
their respective incremental abstract values: short 3. Results
term = 1, short-mid term = 2, mid term = 3, mid-
long term = 4, and long term = 5. For the costs, Our investigation results pertain to three findings: the
we account for both the yearly expenditure due to first is on constraining the total water budget deficit
the capital expense (CAPEX) costs depreciated over projections during the different GERD filling scen-
the lifetime span of the solution itself and the annual arios, the second is on the feasibility of mitigation
operating expense (OPEX) costs. We first derive a strategies to address this deficit and the third is on the
lower and upper bound for all the variables for each economic impact corresponding to the the total water
mitigation strategy, we then normalize each variable budget deficit as detailed below.
6Table 2. Proposed mitigation strategies.
Reference Description Duration Costs Benefits
Environ. Res. Lett. 16 (2021) 074022
Abdelhaleem and Pump stations with floating intake design No mitigation vs. water
Helal (2015) deficit
Additional intakes for existent pumps No mitigation vs. water
deficit
AHD rules to be readjusted to cope with the water reduc- Short term Loss from 11.5% to 44.3% of produced energy in 2.8–22.2 BCM yr−1 .
tion AHD per year→1026–3952 GWh yr−1 →71.8–
7
277 M$ yr−1 .11
More reliable water management policies Unknown
Water management of based on principle of equitable use Unknown
Win-win strategy by Egypt and Ethiopia Unknown
Agreement on GERD capacity Unknown
Donia and Negm Water harvesting project in the Nile basin Long term 4.05 $ m−3 (Singapore) or Current use 1 BCM,
(2018) (10–30 yrs.) 5.45 $ m−3 (Berlin)12 max 1.8 BCM yr−113 .
Reuse of wastewater Strategy 8.57 B$ CAPEX + 340 M$ OPEX14 5 BCM/yrproduced
203014 wastewater: 3.7/yr
BCM treated→1.3
BCM/yrpotential
source15 . 2030 Annual
wastewater to reach
11.7 BCM yr−1 (11.6
BCM/yr treated)14
(Continued.)
E Heggy et alTable 2. (Continued.)
Reference Description Duration Costs Benefits
Water desalination expansion Long term 10–20 $ m−3 CAPEX + 0.65–0.77 $ m−3 yrOPEX16 Planned for 268
Environ. Res. Lett. 16 (2021) 074022
(2–5 yrs.) MCM yr−1
17
Potential of 5 yrs.) losses
→could save 7.4
BCM yr−121 .
Reuse drainage water and treated wastewater See similar entry above
Water condensers next to evaporation areas Short Term Low costs Very low production
Expand the use of groundwater See similar entry above
Desalination capacity expansion See similar entry above
Ibrahim and Emara (2010) Using fixed furrow irrigation system efficiency >35%
→could save 9.36
BCM yr−1 .
(Continued.)
E Heggy et alTable 2. (Continued.)
Reference Description Duration Costs Benefits
Keith et al (2017) Construction of desalination plants See similar entry above
Technological innovation (irrigation systems, See other entries for more details on each specific solutions
farming practices, desalination)
Liersch et al (2017) Modifying the operations of the Rosaries and Sennar Short term Unknown
dams (Sudan) (1 year)
Environ. Res. Lett. 16 (2021) 074022
Omran and Negm Maximizing the use of groundwater Short Term 0.1–6 M$ yr−1 .22 Potential 3.65–4.65
(2018) BCM yr−1
(1.65 BCM from fossil
aquifers and
2–3 BCM from the
Nile Aquifer)23
9
Maximizing the use of rainwater in Egypt See above
Reduce evaporation at Lake Nasser: changing See other entries for more details on each specific solutions
water levels at AHD, cultivating special crops on
the lake surface, closure of a secondary channel
(khor), circular foam sheet.
11
Assuming an average electric price of 0.07 $ KWh−1 .
12
From Zhang et al (2017).
13
From Abdel-Shafy et al (2010).
14
From AbuZeid and Elrawady (2014).
15
From Elbana et al (2017).
16
Based on ‘The Cost of Desalination’, Advisian. Available online: www.advisian.com/en-gb/global-perspectives/the-cost-of-desalination Article accessed on [2018/11/27].
17
From Mazzoni et al (2018).
18
Retrieved from Verdier (2011).
19
Calculated based on 17 Mha of cultivated land and assuming a cost for modernizing the irrigation systems between 500 and 1000 $ ha−1 .
20
Calculated at price of 257.7 $/Tn for Rice and 40.37 $/Tn for Sugarcane→production of 6.3 MT of rice and 1.57 MT of Sugarcane in 2016.
21
Self-calculation.
22
Calculated using 3.65 and 4.65 BCM as target, with an average yield per well of 5000 to 60 000 m3 d−1 →167–2548 wells→well cost from 17 000$ to 70 000$ CAPEX and no relevant costs for OPEX→2.9–178 M$, which is
distributed on an average lifespan of 30 years.
23
From El-Nashar and Elyamany (2018).
E Heggy et alEnviron. Res. Lett. 16 (2021) 074022 E Heggy et al
Figure 1. Egypt’s total water budget deficit under the different GERD published filling scenarios. Top and right plots describe the
estimated probability distribution function (pdf) of each variable (Gaussian kernel density estimate), respectively.
3.1. Assessing the water budget deficit reuse of drainage water within the Nile Delta and
Figure 1 shows the resulting distribution of the out- by unlawful withdrawal of deep groundwater (CAP-
puts of each considered scenario in terms of years MAS 2018). Both contribute to deteriorate the over-
needed to fill the GERD and the expected annual total all water quality (Mohie and Moussa 2016). It is
water budget deficit of Egyptian renewable fresh- worth mentioning that the above-mentioned amount
water supply by this process. Clearly, each selected of water deficit in Egypt does not include the annual
filling rate will have different implications on the time groundwater recharge from Lake Nasser and north-
to fill the reservoir and thus a proportional effect ern Sudan to the Nubian Aquifer (Abdelmohsen et al
on the downstream flow reductions. As a result, we 2019, Sultan et al 2013, Abdelmohsen et al 2020).
found that the estimated required time to fill up It was estimated using a two-dimensional ground-
the GERD is distributed between a minimum of 2.5 water flow model that, at lake level of 178 meters
and a maximum of 29.6 years, with a mean value of above sea level (masl), the Nubian aquifer receives
10.86 (median: 9.19, Q1: 5.79, and Q3: 13.97 years). an annual recharge of 6 BCM yr−1 compared to
For more details on the effect on annual flows into 0.7 BCM yr−1 , when the lake level drops to 170
Egypt, figure 2 summarizes in a box-plot format masl. Collectively, the annual groundwater recharge
the statistical distribution of the resulting annual from Lake Nasser and the northern Sudan basin
water deficit caused by the GERD filling, the seep- can reach up to 8.5 BCM yr−1 during periods of
age inferred from Liersch et al (2017), and the fore- intensified precipitation on equatorial Africa (e.g. the
casted intrinsic Egyptian water budget gap derived period between 2012 and 2015; Abdelmohsen et al
from Mazzoni et al (2018). The main component of 2019). The amount of annual groundwater recharge
the overall water deficit for Egypt originates from from precipitation over the northern Sudan platform,
the intrinsic water gap between the internal demand which can be roughly estimated from the GRACE
and the presently available renewable water supply. terrestrial water storage as 2.5 BCM yr−1 (Abdel-
This difference, corresponding to 18.35 BCM yr−1 mohsen et al 2019), will not be affected by the con-
in median value, is currently compensated by the struction of the GERD, yet the different scenarios for
10Environ. Res. Lett. 16 (2021) 074022 E Heggy et al
Figure 2. The three components defining the annual total water budget deficit for Egypt during the GERD filling period by source
considered in our study. Note that for each box-plot, the line inside the box represents the median, the triangle delineates the
mean (also referred to as average), the box edges represent the 25th and 75th percentiles, the whiskers extend to the most extreme
data points not considered outliers, and outliers are plotted individually in crosses. References: 1 Liersch et al (2017); 2 Mazzoni
et al (2018). The left box (GERD) refers to the annual water deficit induced by water impounding in the GERD reservoir during
the filling period (numbers are statistically derived from available scenarios in table 1. The middle box (Seepage) refers to the
annual water deficit resulting from seepage losses in the GERD reservoir after 1 Liersch et al (2017). The right box refers to the
current intrinsic water deficit in Egypt after 2 Mazzoni et al (2018). The sum of the median value of the three is referred to as the
annual total water budget defiecit.
the GERD will consequently affect Lake Nasser levels GERD filling, 8% for seepage under GERD, and 60%
and hence the annual recharge to the deep Nubian of intrinsic water budget deficit), which corresponds
Aquifer will be significantly impeded. The response to an average +35.5% of its current internal annual
of the Nubian Aquifer to the different scenarios of the water demand. It is worth mentioning that these
GERD filling should be investigated to estimate a reli- estimates represent the worst-case scenario, where no
able total water budget deficit in Egypt. actions are taken from the Egyptian authorities to
The other two components (i.e. water impound- mitigate these expected rates of water deficits due to
ing during the filling period and seepage from the technical shortage or political instability. Addition-
GERD), which are instead directly related to the con- ally, enhanced flood events over the White Nile can
struction of the GERD, collectively create an addi- positively impact the Egyptian water budget by intro-
tional median water gap of ∼12.15 BCM yr−1 con- ducing more than 25 BCM to Lake Nasser over a
sidering all the expected lengths for the filling peri- period of three years (e.g. the flooding event between
ods of the dam. The decrease in streamflow for Egypt 1999 and 2001; Bastawesy et al 2008).
due to the seepage losses in the GERD, not consid-
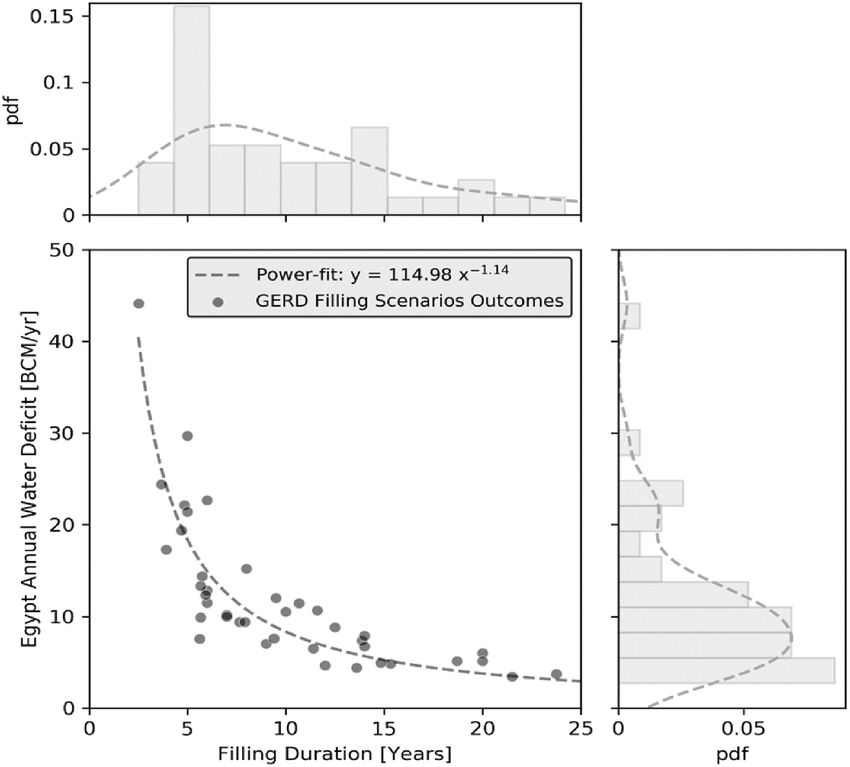
ering the outliers, could range from a minimum of 3.2. Feasibility index
43 MCM yr−1 to a maximum of 10.4 BCM yr−1 Figure 3 shows the resulting feasibility of each pro-
(median: 2.5, Q1: 0.185, and Q3: 4.9 BCM yr−1 ) posed solution and the relative contribution of each
assuming the total inflow to range between 43.2 and mitigation strategy that we considered for comput-
53.3 BCM and seepage rates of 1% and 32% (Lier- ing the index that ranges from 0 (non feasible) to 1
sch et al 2017). However, for Egypt, the actual main (feasible). Inspection of the feasibility index estima-
reduction in the annual water supply is due to the tions (figure 3) indicates that among all the proposed
filling itself of the upstream dam. The estimated loss, solutions to address the water budget deficit, the most
excluding outliers, ranges between 2.72 and 22.67 practical option (feasibility index >50%) for Egypt
BCM yr−1 (median: 9.64, Q1: 6.13, and Q3: 13.22 in the short term would be to temporarily reduce or
BCM yr−1 ). In percentage, the effects of the GERD even completely suspend the operations at the AHD
would create an additional increase of the present to partially offset the lower streamflow during the
water deficit for Egypt between +34.4% and +98.7%, filling of the GERD. The loss in the Aswan basin reser-
of which in average ∼83% is due to the filling and voir can be recovered and distributed in the follow-
the remaining ∼17% to the seepage assuming a max- ing years after the GERD starts operating when the
imal seepage rate. If we account for all the compon- main Nile streamflow will return to its regular rate.
ents, Egypt may experience in the years of filling of the This would, of course, drastically reduce the electri-
GERD a total annual water deficit from 24.7 to 36.5 city production from the Aswan hydropower plant
BCM yr−1 (distributed in percentage as: 32% due to (here accounted as cost for the proposed strategy)
11Environ. Res. Lett. 16 (2021) 074022 E Heggy et al
Figure 3. Calculated Feasibility Index for each proposed mitigation strategy, 0 being non feasible and 1 being feasible.
and to account for all the subsequent effects of this needed to irrigate the 9.1 million feddans. Replace-
option. Other effective solutions include maximizing ment of the sugarcane with sugar beet and limita-
groundwater withdrawal (feasibility index >35%), tion of the rice cultivation to the official number of
although here we do not account for the environ- feddans (almost 1 million feddan, which is 850 000
mental effects on degradation of fossil aquifers sys- feddan below the actual rice lands in Egypt 1.9 mil-
tems. However, this measure is highly cost effective lion feddan), the crop water use rate will be as low as
compared to other measures (figure 3; table 2), yet the 1 m3 m−2 yr−1 (Din et al 2016), which only requires
total production of current wells cannot bridge the 38.3 BCM to irrigate the 9.1 million feddans. Other
GERD-induced water deficit gap with a total poten- options have a feasibility index lower than 10%, which
tial of 4.65 BCM yr−1 (Omran and Negm 2018). means that they either require too much time for
This solution could be improved through the expan- their implementation or the cost is too high, again
sion of groundwater extraction from shallow aquifers resulting in a low efficacy in mitigating the water
east and west of the Nile Delta (Abotalib et al 2016, deficit. For example, modernizing the irrigation sys-
El-Saadawy et al 2020, Hegazy et al 2020, Khalil et al tem is a costly and time-consuming process, where
2021). Furthermore, the largely unexplored fractured upgrading the irrigation systems of only 3140 ha
limestone aquifers east and west of the Nile Valley rep- in Upper Egypt costs up to 11.6 million US dollars
resent valuable corridors for expanding groundwa- (Takouleu 2020). The current irrigation system is a
ter extraction due to: (1) the fractured and karstified surface irrigation system (i.e. flood irrigation) that
nature of the aquifer that results in high groundwa- depends almost entirely on the AHD to regulate water
ter yield of up to 1600 m3 d−1 (Yousif et al 2018), (2) through more than 29 000 km of canals and sub-
the abundant recharge from the deep Nubian aquifer canals leading to the loss of more than 3 BCM of
through artesian upwelling along faults and thus nat- Nile water annually through evaporation in addition
urally bringing deep water (up to 1500 m) to shal- to the water shortage at canal tail end. These negative
low levels (Environ. Res. Lett. 16 (2021) 074022 E Heggy et al
Figure 4. Projection of the equivalent losses in the agricultural GDP for Egypt under assuming no mitigation for the total water
budget deficit augmented by the different filling scenarios of the GERD.
Figure 5. Short-term projection of the equivalent losses in Egypt’s total GDP per capita in USD only considering the losses in the
agricultural sector (i.e. agricultural GDP) arising from the unmitigated total water budget deficits for the different GERD filling
scenarios.
order model suggests an equivalent agricultural GDP activities. The above reduces the existing cultivation
losses arising from the unmitigated total water budget area as explained in sections 2.4 and 3.2 and hence the
deficit, for the total filling period, of ∼$51 billion for associated agricultural GDP. The losses in the agri-
the 3 years filling scenario, ∼$28 billion for the 5 years cultural sector (i.e. Agricultural GDP) will decrease
filling scenario, ∼$17 billion for the 10 years filling the total projected GDP per capita for Egypt for the
scenario, and ∼$10 billion for the 21 year filling scen- years 2022, 2023 and 2024 from $ 2815, $ 2890 and
ario. These economical losses reflect the degradation $ 2968, for the case without the GERD, down to
in crop production due to the unmitigated deficit $ 2633, $ 2703 and $ 2777 when accounting only for
in necessary irrigation water to maintain agricultural the agricultural losses arising from the unmitigated
13Environ. Res. Lett. 16 (2021) 074022 E Heggy et al
Figure 6. Anticipated unemployment rates and increase in total unemployment resulting from the total water budget deficit
augmented by the different GERD filling scenario for Egypt. Unemployment projections based on World Bank’s historical data
and employment per acre for the agricultural areas in Egypt.
total water budget deficit under the GERD short-term population. Secondly, the model hypothesizes that for
filling scenarios. every unit loss in the Nile River inflow, its distribu-
Unemployment projections for Egypt’s agricul- taries will experience an equal unit loss of water. The
tural sector are shown in figure 6 and the supple- downstream impacts such as land loss and available
mental tables. Of Egypt’s 28.8 million employed, water for industrial and municipal use are more likely
about 5.5 million work in the agricultural sector to be manifested as a non-linear decrease at a much
(Central Agency for Public Mobilization and Statist- higher rate for every unit decrease in the Nile itself.
ics, (CAPMAS) 2018). Approximately each ∼1.4 fed- Furthermore, the model assumes that the distribu-
dan (0.6 ha) of agricultural land employ one per- tion rates of water across agriculture, industry, and
son; hence the unmitigated total water budget defi- municipal use will remain unchanged. Lastly, these
cit under the GERD proposed three-year short term figures do not include the economical impacts on the
filling scenario may degrade 2.8 million hectares of growing food manufacturing and processing sector
land, which would result in 4.75 million jobs losses which contributed to ∼6% of Egypt’s GDP in 2019
in downstream in Egypt. This would result in an (USDA, 2020). Other service industries connected to
alarming loss of over three quarters of Egypt’s agri- industry and agriculture are likely to experience sig-
cultural land and resulting in more than 60% of nificant consequences because of decreased produc-
agricultural workers unemployed. The total unem- tion capabilities. As such, the results on the equivalent
ployment rate would rise from the current 11% to a decrease in the GDP per capita and the rise of unem-
future 25%. ployment should be considered as lower limits, the
Our economic impacts model’s accuracy is lim- economic damage considering all the above factors
ited by a few key factors. Firstly, it does not account will be higher.
for time the Nile will need to restore full flow after
GERD filling ends, and as a result, does not account 4. Implications and mitigation strategies
for the economic effects in the years following the
GERD’s filling. The immediate upshoot in GDP dur- The purpose of this study is to evaluate the effects
ing the year after the filling period ends is highly of the GERD on the short-term Egyptian total water
unlikely as many of the environmental and socioeco- budget deficit by considering different filling scen-
nomic impacts could be irreversible. The 10 to arios simulated based on the most recent published
21 years filling scenarios, with the lowest net present peer-reviewed records and considering seepage and
value impact on Egypt’s GDP, thus appears to be the the growth in Egypt’s intrinsic water budget deficits.
best scenarios with long-term manageable economic Our findings concur with several studies (e.g. Zhang
impacts to a country that is already highly stressed et al 2016, Kansara et al 2021) that short-term filling
by socio-economic instabilities and rapid increase in scenarios (3–5 years) will cause measurable shortages
14Environ. Res. Lett. 16 (2021) 074022 E Heggy et al
in the water supply for Egypt during the dam filling muds and silts through dredging and constructing
phase. This additional water budget gap is estimated onshore sediment ponds that can be used for agri-
to correspond to an overall increase of the present cultural purposes and the development of small com-
water deficit in Egypt by more than one third (+34%) munities (Abulnaga 2018).
to almost double (98.7%). Of this water budget gap, We also considered numerous management
on average ∼83% would be due to the amount of actions and mitigation strategies that could secure
water needed to fill up the dam, while in an extreme Egypt’s water demands by minimizing the effects of
case, up to ∼17% could be lost to natural seepage the GERD project. By using a feasibility index defined
within the GERD reservoir. ad hoc, we find that the best option for Egypt would
These water shortages if unmitigated will have be to re-evaluate the current operation of the AHD
dire consequences for Egypt’s economy, employment hydropower plant to mitigate the upcoming water
rates, migration outflow and food sufficiency. The shortages, together with the increase of groundwater
above-modeled GDP loss does not account for unem- withdrawal as a backstop option to temporarily sus-
ployment in connected industries, such as transport- tain the water demand. Water conservation strategies
ation or tourism, nor for damage done by resulting should also be incorporated especially in the agri-
food scarcity, as these effects lie beyond the imme- culture sectors by switching the national production
diate economic impact of unemployment. Municipal towards crop types that require less water.
water loss, which is also not immediately translat- If Ethiopia’s government decides on one of the
able into monetary loss, would present significant shorter filling periods, possible compensation meth-
long-term detrimental effects to the affected popu- ods are available to offset Egypt’s agricultural losses,
lace. In the case of a large wave of unemployment, which we have identified as the primary economic
the socioeconomic stability of much of Egypt’s work- downside of the 3-year filling scenario of the GERD.
force would also be at stake, and the adverse effects of Since Ethiopia is currently leasing its agricultural land
reduced economic activity and increased unemploy- to multiple international investors, it could provide
ment have the dangerous potential to become cyclical a long-term lease, at a preferential rate, of some of
(Brand 2015). In turn, economic damage in Egypt its surplus farming land for Egypt’s use as a method
could force less spending on education, decrease small of direct compensation for the loss in crop produc-
business activity and health quality, and increase tion. Egypt in exchange can develop the needed infra-
crime rates (Irons 2009). structure in these farming lands to become highly
Water scarcity is specifically dire due to its effects productive crop areas with irrigation infrastructure
on the behaviors of populations and governments. that preserves the Nile ecosystem. In the long term,
The conflict for Zambezi Island, Mekong River dis- this solution would also be advantageous to Ethiopia
putes, the Euphrates-Tigris disputes, and water riots when the leased lands are restored back to Ethiopian
across the world in the past few decades are all indic- management.
ators that the current dispute between Egypt and Alternatively, Ethiopia could make use of some of
Ethiopia has the potential to erupt into external con- the surplus electricity generated by the GERD to fin-
flict, while civil unrest may also arise within Egypt ancially compensate Egypt for its GDP loss arising
(Guarino 2017). Water loss due to climate change is from the GERD unmitigated water budget deficit
already expected to have negative effects on North (and not the total water budget deficit that include
Africa and the Middle East, the region most vulner- the intrinsic component), even though this solu-
able to GDP loss from further water scarcity, driv- tion is unlikely as it requires mutual recognition of
ing increased migration and rekindling older conflicts the size of the financial damages arising from the
(World Bank 2016). It is essential to consider these GERD, which are unachievable in the current polit-
devastating consequences in order for Egypt to real- ical and economic context. The GERD is expected
locate its resources toward the mitigation solutions to generate ∼16 000 Gigawatt hours per year of elec-
described in figure 3 and for Ethiopia to consider tricity and 1 billion Euros in surplus sales (Pichon
slowing the GERD’s filling. 2020). Egypt currently produces on average 184,000
On the other hand, the construction of the GERD Gigawatt hours per year of electricity (Kwakwa 2017).
will have some positive impacts on the downstream Despite their similar populations, Egypt consumes
countries. In Egypt, the simulated reduction of sed- 15 times as much electricity as Ethiopia consumes.
iment accumulation in the Aswan High Dam Lake Offering subsidized electricity or an electricity allow-
(AHDL) by 90%–97% in the year 2060, compared ance to Egypt would also be a viable solution that
to the amount of sediment accumulation in the year would allow Egypt to slow the use of its own AHD
2020 without GERD operation/construction, will and increase their yearly water access on their own
arguably increase the lifetime of the AHD (Negm et al end.
2018). In Sudan, the GERD construction and con- While our study presents preliminary results, it
sequent reduction in sediment accumulation in Lake unambiguously suggests an alarming upcoming total
Nubia (i.e. the Sudanese portion of the AHDL), will water budget deficit for Egypt during a three-year
provide an opportunity for scooping out accumulated short term filling scenario. Longer-filling scenarios
15Environ. Res. Lett. 16 (2021) 074022 E Heggy et al
above 7 years will allow a more manageable defi- Abdelmohsen K, Sultan M, Save H, Abotalib A Z and Yan E 2020
cit below 10 BCM yr−1 that can be mitigated using What can the GRACE seasonal cycle tell us about
lake-aquifer interactions? Earth-Sci. Rev. 211 103392
existing resources and minimize the associated socio-
Abotalib A Z and Heggy E 2018 Groundwater mounding in
economic impacts. The more technical information fractured fossil aquifers in the Saharan-Arabian desert
that can be obtained on the GERD future operational pp 359–62
plans, the more accuracy that can be achieved in Abotalib A Z, Sultan M and Elkadiri R 2016 Groundwater
processes in Saharan Africa: implications for landscape
modeling and forecasting the water budget deficit as
evolution in arid environments Earth-Sci. Rev.
well as the associated socio-economic impacts. How- 156 108–36
ever, since all findings converge on a temporal yet Abotalib A Z, Sultan M, Jimenez G, Crossey L, Karlstrom K,
severe decrease in Egypt’s water supplies, it is plaus- Forman S, Krishnamurthy R V, Elkadiri R and Polyak V
2019 Complexity of Saharan paleoclimate reconstruction
ible that a win-win strategy can be found to mitig-
and implications for modern human migration Earth
ate the impacts on food security and socio-economic Planet. Sci. Lett. 508 74–84
stability. The above requires an accurate forecast of Abtew W and Dessu S B 2019 The Nile river and transboundary
Egypt’s total water budget deficit, its impact on the water rights The Grand Ethiopian Renaissance Dam on the
Blue Nile, Springer Geography ed W Abtew and S B Dessu
agricultural sector and the total GDP, as attemp-
(Cham: Springer) pp 13–27
ted herein, in addition to addressing the nature of Abulnaga B E 2018 Dredging the clays of the Nile: potential
the short- and long-term environmental and ecolo- challenges and opportunities on the shores of the Aswan
gical impacts of constructing mega reservoirs on the High Dam Reservoir and the Nile Valley in Egypt Grand
Ethiopian Renaissance Dam Versus Aswan High Dam (Cham:
Nile River system, which remain poorly constrained
Springer) pp 331–55
let alone understood at this stage. Bastawesy M A, Khalaf F I and Arafat S M 2008 The use of remote
sensing and GIS for the estimation of water loss from Tushka
Data availability statement lakes, southwestern desert, Egypt J. Afr. Earth Sci. 52 73–80
Bastawesy M E 2015 Hydrological scenarios of the Renaissance
Dam in Ethiopia and its hydro-environmental impact on the
The data that support the findings of this study are Nile downstream J. Hydrol. Eng. 20 04014083
available upon reasonable request from the authors. Bekhit H B M 2016 Impacts of the Upper Nile Mega Projects on
the water resources of Egypt The Nile River. The Handbook of
Environmental Chemistry ed A Negm (Cham: Springer)
Acknowledgments pp 503–29
Brand J E 2015 The far-reaching impact of job loss and
The authors are very grateful to both Annamaria unemployment Annu. Rev. Soc. 41 359–75
Mazzoni and Giovanni Scabbia of the Qatar Envir- Central Agency for Public Mobilization and Statistics, (CAPMAS)
2018 Statistical Yearbook (Cairo: Central Agency for Public
onment and Energy Research Institute for their help- Mobilization and Statistics) p 120
ful contributions to the early version of this docu- Chen H and Swain A 2014 The Grand Ethiopian Renaissance
ment, and to Dr. Elizabeth Palmer of the University Dam: evaluating its sustainability standard and geopolitical
of Southern California for helpful discussions. This significance Energy Dev. Front. 3 11–9
Din M E, Omar M and Moussa A M 2016 Water Scarcity in Egypt
research is funded under support from the Zumberge Ministry of Water Recourses and Irrigation Published Reports
Research and Innovation Fund of the University of J. Adv. Res. 7 403–12
Southern California allocated to the Arid Climates Donia N and Negm A 2018 Impacts of filling scenarios of GERD’s
and Water Research Center—AWARE. reservoir on Egypt’s water resources and their impacts on
agriculture sectorin Conventional Water Resources and
Agriculture in Egypt ed A M Negm (Cham: Springer)
ORCID iDs pp 391–414
Dumont H J 2009 A description of the Nile Basin, and a synopsis
Essam Heggy https://orcid.org/0000-0001-7476- of its history, ecology, biogeography, hydrology, and natural
resources The Nile (Dordrecht: Springer) pp1–21
2735 El-Nashar W Y and Elyamany A H 2018 Managing risks of the
Zane Sharkawy https://orcid.org/0000-0002-3903- Grand Ethiopian renaissance dam on Egypt Ain Shams Eng.
1758 J. 9 2383–8
Abotalib Z Abotalib https://orcid.org/0000-0002- El-Saadawy O, Gaber A, Othman A, Abotalib A Z, El Bastawesy M
and Attwa M 2020 Modeling flash floods and induced
5852-0370 recharge into alluvial aquifers using multi-temporal remote
sensing and electrical resistivity imaging Sustainability
References 12 10204
Fao L 2015 AQUASTAT main database-food and agriculture
Abdelhafez A A, Metwalley S M and Abbas H H 2020 Irrigation: organization of the United Nations (FAO)
water resources, types and common problems in Egypt Guarino A S 2017 The economic implications of global water
Technological and Modern Irrigation Environment in Egypt scarcity Res. Econ. Manage. 2 51–63
(Cham: Springer) pp 15–34 Hamada Y M 2017 The Grand Ethiopian Renaissance Dam, Its
Abdelhaleem F S and Helal E Y 2015 Impacts of Grand Ethiopian Impact on Egyptian Agriculture and the Potential for
Renaissance Dam on different water usages in upper Egypt Alleviating Water (Berlin: Springer)
Curr. J. Appl. Sci. Technol. 8 461–83 Hegazy D, Abotalib A Z, El-Bastaweesy M, El-Said M A, Melegy A
Abdelmohsen K, Sultan M, Ahmed M, Save H, Elkaliouby B, and Garamoon H 2020 Geo-environmental impacts of
Emil M, Yan E, Abotalib A Z, Krishnamurthy R V and hydrogeological setting and anthropogenic activities on
Abdelmalik K 2019 Response of deep aquifers to climate water quality in the quaternary aquifer southeast of the Nile
variability Sci. Total Environ. 677 530–44 Delta, Egypt J. Afr. Earth Sci. 172 103947
16You can also read