Long-term patterns of mass stranding of the colonial cnidarian Velella velella: influence of environmental forcing - Inter-Research Science Publisher
←
→
Page content transcription
If your browser does not render page correctly, please read the page content below
Vol. 662: 69–83, 2021               MARINE ECOLOGY PROGRESS SERIES
                                                                                                  Published March 18
https://doi.org/10.3354/meps13644                Mar Ecol Prog Ser

                                                                                                  OPEN
                                                                                                  ACCESS

       Long-term patterns of mass stranding of the
      colonial cnidarian Velella velella: influence of
                  environmental forcing
                        Timothy Jones*, Julia K. Parrish, Hillary K. Burgess
                 School of Aquatic and Fishery Sciences, University of Washington, Seattle, WA 98195, USA

      ABSTRACT: Velella velella is a pleustonic cnidarian noted worldwide for mass stranding of the
      colonial phase. Utilizing a 20 yr dataset (2000−2019; 23 265 surveys) collected by the COASST cit-
      izen science program, we examined the spatio-temporal occurrence of mass strandings of V.
      velella along the Pacific Northwest coast from Washington to northern California, USA. V. velella
      mass strandings were documented in 14 years, with expansive events in 2003−2006 and 2014−
      2019. Events predominantly occurred in spring and were synchronous (April) among years, con-
      current with shifts to prevailing onshore winds. Autumn mass stranding events occurred infre-
      quently, with no consistent phenology (2005: November; 2014: August). In stranding years,
      reports of V. velella were mostly synchronous throughout the surveyed area, and events consis-
      tently spanned > 400 km of coastline, with highest reporting rates in the vicinity of the Columbia
      River plume, collectively suggesting extensive V. velella blooms throughout the northern Califor-
      nia Current system in some years. Annual metrics of spring V. velella reporting rate (proportion of
      beaches; January−June) were modeled as a function of indices representing sea surface temper-
      ature anomaly (SSTa), easterly (onshore) wind speed, and regional upwelling. The best models
      (based on Akaike’s information criterion corrected for small sample size) indicated that SSTa aver-
      aged over the preceding winter (December−February) was positively correlated with spring
      reporting rate, suggesting that mass strandings of V. velella may be more prevalent in warmer
      years. As planetary warming continues, and V. velella strandings are easily recorded by citizen
      science programs globally, we suggest that stranding prevalence may be one relatively easy
      measure providing evidence for epipelagic ecosystem response.

      KEY WORDS: Jellyfish · California Current · Climate change · Citizen science · Sea surface
      temperature

                 1. INTRODUCTION                               jellyfish, have received attention worldwide due to
                                                               an apparent increase in documented population
   Increasingly dramatic responses of natural systems          explosions or blooms. Explanations vary, and include
to human-assisted top-down and bottom-up forcing               decadal oscillations which may be forced by climate
are evidenced by massive shifts in the distribution            (Condon et al. 2013) and/or specifically a warming
(Perry et al. 2005, Cheung et al. 2012), abundance             ocean (Lucas et al. 2014); release from top-down
(Last et al. 2011), population health (Burge et al.            and competitive forcing by global overfishing (e.g.
2014), biodiversity (Jones & Cheung 2015), reproduc-           Daskalov et al. 2007 but see Opdal et al. 2019); and/or
tive output (Foo & Byrne 2017), and competitive via-           anthropogenic degradation of nearshore systems
bility (Sumaila et al. 2011) of marine species. Gelati-        (Purcell 2012). In addition to recorded blooms across
nous zooplankton, including the larger scyphozoan              a wide range of large marine ecosystems, species
                                                               © The authors 2021. Open Access under Creative Commons by
*Corresponding author: timothy.t.jones@gmail.com               Attribution Licence. Use, distribution and reproduction are un-
                                                               restricted. Authors and original publication must be credited.
                                                               Publisher: Inter-Research · www.int-res.com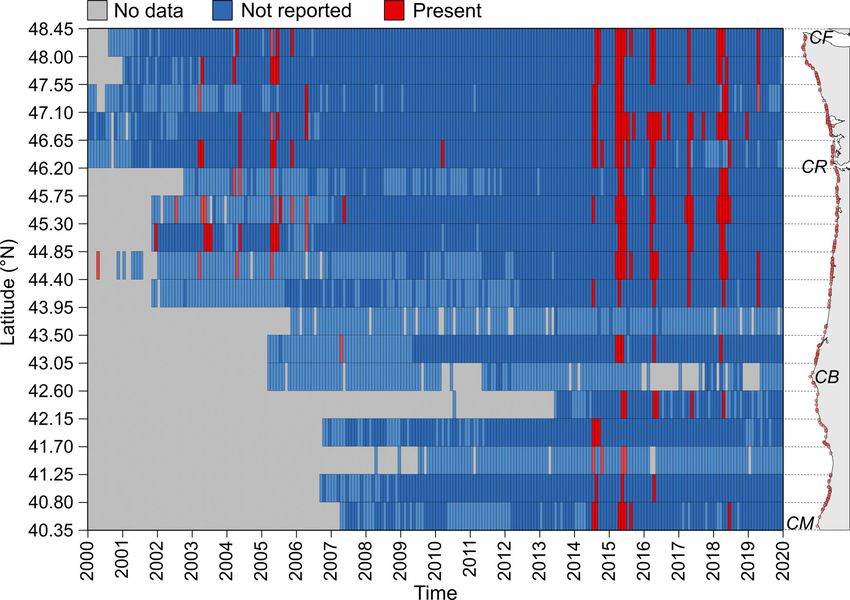
70                                          Mar Ecol Prog Ser 662: 69–83, 2021

present in coastal systems, or transported to coastal          finfish (Thorson et al. 2014), benthic marine inverte-
systems, have also been recorded in mass beaching              brates (Schultz et al. 2016), and gelatinous zooplank-
or landfall events (Purcell et al. 2007, Betti et al. 2019).   ton (Purcell et al. 2015). Collectively, these programs
  With respect to gelatinous taxa, blooms of Velella           may detect and monitor, for example, species range
velella have been recorded worldwide across tem-               extensions (Champion et al. 2018), invasions (Scyphers
perate and tropical systems, frequently evidenced by           et al. 2015), harmful algal blooms and their effects
mass stranding events. V. velella, hereafter Velella, is       (Trainer & Hardy 2015), fishery impacts (Hamel et al.
a cosmopolitan, tropical to temperate pleustonic spe-          2009), pollution (Keil et al. 2011), and population
cies (Pires et al. 2018) often found in association with       responses to a shifting climate (Parrish et al. 2007).
coastal fronts (Betti et al. 2019), Langmuir cells, and        Identification and documentation of ways in which
other convergences (Purcell et al. 2012). A cnidarian          data could be collected by hundreds to hundreds of
in the family Porpitidae, the Velella life cycle phase         thousands of people could greatly aid in the creation
most often encountered are colonies of asexual                 of rigorous longitudinal datasets needed to document
polyps, small pleustonic organisms with a ring of pur-         cyclic, catastrophic, and chronic ecosystem change.
ple tentacles and a stiff sail-like dorsal extension             In this paper, we used data from a citizen science
(maximum disk size = 80 mm; Bieri 1977). Colonies              program, the Coastal Observation and Seabird Sur-
produce pelagic medusae (the sexual phase) which               vey Team (COASST; www.coasst.org) to document
sink 600−1000 m before releasing pelagic larvae                mass strandings of Velella along the northern half of
which develop as they ascend to the surface, culmi-            the California Current large marine ecosystem
nating in the pleustonic colonial phase. Colonies are          (CCLME). Although COASST is primarily focused on
thought to be produced over deep water (Purcell et             marine birds (Parrish et al. 2017) and marine debris,
al. 2015). Bieri (1977) suggested 2 full life cycles an-       participants are invited to record unusual sightings
nually, with colonies extant in spring and autumn (see         of any nature during their monthly surveys in a
also McGrath et al. 1994, Pires et al. 2018), although         ‘Comments’ box located on their datasheet. Mass
Evans (1986) noted that in the North Pacific, ship-            strandings of by-the-wind sailors, as Velella are com-
based records of Velella were restricted to the spring         monly known, are one example of an unusual sight-
and early summer (late April through very early July).         ing of which participants are shown a photograph
  Unusually large beaching events or strandings of             during their training. Because COASST covers ~200
millions of Velella have been reported worldwide               beach sites annually in the northern CCLME, spread
(Portugal: Pires et al. 2018; Mediterranean: Betti et          from Cape Flattery at the tip of the Olympic Pe-
al. 2019; Oregon: Kemp 1986; Ireland: McGrath et al.           ninsula in Washington, to Elk, California (39.12°−
1994; South America: Carrera et al. 2019; Pacific:             48.34° N: Fig. 1), we used these data to examine the
Purcell et al. 2015). Mass strandings have been asso-          phenology and spatial distribution of mass stranding
ciated with warm waters (Pires et al. 2018, Zeman et           events across the ecosystem, as well as to model
al. 2018) including during El Niño events (Carrera et          annual patterns in reporting rate as a function of
al. 2019), as well as with onshore winds (Pires et al.         environmental forcing. Given previous literature, we
2018, Betti et al. 2019). In part because Velella mass         hypothesized that mass strandings of Velella would
beaching events are highly visible, public engage-             be associated with short-term onshore wind events,
ment in reporting them is high. Several programs               strength of upwelling, and a warming ocean.
worldwide, including Jellyfish Watch (Purcell et al.
2015) and GelAvista (Pires et al. 2018) have specifi-
cally recruited observers to report Velella beachings,                   2. MATERIALS AND METHODS
while other studies have incorporated public reports
into a wider dataset (e.g. McGrath et al. 1994).                                 2.1. Data collection
  Observations collected by citizen science programs
that employ a standard data collection protocol can               COASST is a citizen science program in which
provide a means of collating information over broad            expert-trained observers monitor a particular length
spatial and temporal scales in a cost-effective man-           of coastline on a monthly basis, searching for beach-
ner. Although marine programs are scarce relative to           cast bird carcasses or marine debris. Although sur-
terrestrial ones (Theobald et al. 2015), several biodi-        vey sites are different lengths, all are fixed in space
versity monitoring programs collect data at the scale          (i.e. permanently marked edges along the long axis
of large marine ecosystems on marine mammals                   of the beach) such that the exact same section of
(Moore et al. 2009), marine birds (Jones et al. 2018),         coastline can be repeatedly monitored for years (see
Jones et al.: Stranding events of Velella velella                                  71

                                                                    reporting of Velella is not mandatory, or subject to a
                                                                    rigorous search protocol, low-level deposition may
                                                                    be missed or not documented in survey comments.
                                                                    Consequently, our presence data likely represent
                                                                    colony presence in quantities above some unknown
                                                                    threshold. Therefore, our analyses should be inter-
                                                                    preted within the context of massive stranding events,
                                                                    as our data may not be representative of short-
                                                                    lived/less abundant deposition.
                                                                       To create a quantitative dataset, all survey com-
                                                                    ments were searched for character strings associated
                                                                    with Velella sightings (using the fuzzy matching
                                                                    search ‘grep’ in R). We searched for strings represen-
                                                                    tative of alternate spellings of Velella (e.g. ‘velel’,
                                                                    ‘vellel’, ‘velell’, ‘valel’, ‘vallel’, ‘vella’), as well as
                                                                    ‘sailor’, based on the common name ‘by-the-wind
                                                                    sailor’. Matches were screened to verify reports were
                                                                    of genuine Velella sightings.
                                                                       As our base data derive from opportunistic reports,
                                                                    we explored the possibility that variable rates of
                                                                    Velella reporting among years may be influenced by
                                                                    changes in the participant pool (i.e. due to recruit-
Fig. 1. (A) Northeast Pacific and (B) the study area, with major    ment/retirement of program participants). Specifi-
landmarks mentioned in the text and reference locations for         cally, we compared reporting rates in April, the month
wind (diamonds) and upwelling (circle) data highlighted.
                                                                    with the highest overall Velella reporting rate, among
Light blue diamonds in panel B indicate alternate locations
for which wind data were obtained from the North Ameri-             paired years (constrained to 5 years before and after
can Regional Reanalysis dataset to test for spatial variability     the focal year) and holding participant pool constant.
                 in wind speed and direction                        These calculations resulted in similar reporting rates
                                                                    to the overall (total participant population within the
Parrish et al. 2017 for an extensive description of the             focal year) reporting rate throughout. Most notably,
program, and Parrish et al. 2019 for a description of               the transition from years with no reports of Velella to
the participants). For this study, we used all surveys              those with numerous reports, and vice versa, were
from 2000 through 2019 conducted along the outer                    maintained, indicating that overall reporting rate is
coast of Washington, Oregon, and northern Califor-                  minimally affected by changes in participant popula-
nia (N = 23 265; Fig. 1). This spatio-temporal range                tion (see Table S1 in the Supplement at www.int-res.
encompasses a total of 293 survey sites, with annual                com/articles/suppl/m662p069_supp.pdf).
coverage varying from 10 sites in 2000 to 158 sites in                 In sum, our basic data consisted of survey date,
2019, and with >100 sites monitored annually since                  beach location (lat, long), and Velella report pres-
2006 when the COASST program expanded into                          ence/presumed absence. We split our analyses into:
northern California. The majority of survey sites                   (1) determination of spatio-temporal patterns in Velella
are >1 km in length (75%; median length = 1.2 km,                   reporting rates; and (2) examination of relationships
range = 0.2−4 km). In addition to their primary data,               between environmental forcing factors and Velella
participants are encouraged to report abnormal                      reporting rates expressed on an annual scale.
occurrences, including but not limited to: unusual
singular events such as stranded marine mammals,
Humboldt squid Dosidicus gigas, sharks, or finfish;                        2.2. Spatio-temporal patterns of Velella
and non-bird mass stranding events. All abnormal                                      stranding reports
occurrence data are recorded in a ‘Comments’ (text
string) field, and may be accompanied by photo-                                         2.2.1. Spatial pattern
graphs. Because abnormal occurrence data are not
required, their presence in the COASST dataset rep-                   To represent spatial patterns in Velella reporting,
resents certain occurrence whereas their lack does                  we calculated beach-specific reporting rates (num-
not necessarily represent absence. We note that as                  ber of Velella reports out of the total number of sur-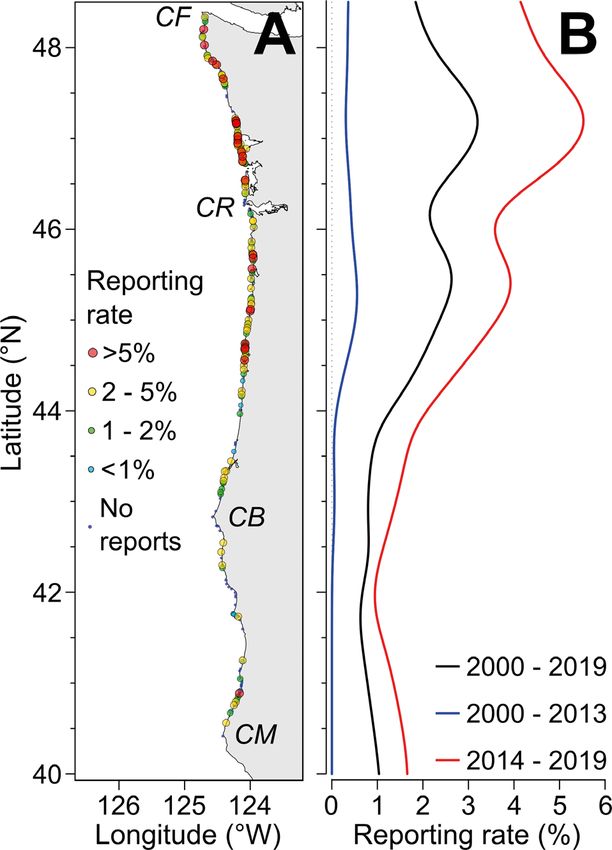
72                                       Mar Ecol Prog Ser 662: 69–83, 2021

veys for each beach) from our base survey data (i.e.        ber of surveys per 14 d window = 13, with 95% range
23 265 surveys from 293 beach sites spanning 2000           of 3−22 surveys; 2007−2019) because the majority of
through 2019). To visualize larger-scale spatial pat-       beaches south of 44° N were established post-2006.
terns across our study system, we applied a kernel          Years with low survey coverage, defined by 14 d win-
smoothing function (Gaussian, σ = 0.45° latitude, or        dows with fewer than 5 surveys, were omitted from
~50 km) to beach reporting rate as a function of lati-      this examination of seasonality due to potential unre-
tude. Due to apparent differences in reporting before       liability of inferred reporting rate at lower sample
(overall fewer reports) and after (extensive reports on     sizes.
an almost annual basis) the start of the Northeast
Pacific marine heatwave (2014−2016), the smoothing
function was applied to beach-specific reporting             2.3. Velella mass stranding reports in relation to
rates calculated across all surveys pre-2014 and post-                    environmental forcing
2014 separately, to investigate whether the spatial
distribution in reporting rate differed between these                  2.3.1. Short-term effects of wind
2 periods.
                                                               Given that Velella beachings have been docu-
                                                            mented following periods of onshore winds (Pires et
           2.2.2. Spatio-temporal pattern                   al. 2018, Betti et al. 2019), we examined the timing of
                                                            Velella reports north of 44° N (i.e. our longest data-
                                                            set) in relation to prevailing wind forcing. Wind data
  To examine the extent and duration of mass strand-        were obtained from the North American Regional
ing events through time, we processed our base sur-         Reanalysis (NARR) dataset, from 2002−2019, consist-
vey data to provide presence/assumed absence of             ing of 3-hourly measures of easterly (zonal, u) and
Velella reports each month from 2000 through 2019           northerly (meridional, v) winds on a grid (0.3° ≈ 32 km)
within 50 km latitudinal segments of coastline (seg-        arrayed across North America (Mesinger et al. 2006).
ment length = 0.45° latitude; 40.35°−48.5° N). Month        We extracted data from a grid point (46.20° N,
by 50 km segments with fewer than 4 surveys (i.e.  0), and marked
                                                            intervals where this proportion exceeded 0.6 (i.e. the
                                                            start to end of all contiguous 14 d windows) as a
   Although each beach is only surveyed on average          measure of predominantly onshore wind forcing.
once per month, there is sufficient coverage to exam-       Based on literature describing spring and autumn
ine patterns at a finer temporal resolution (i.e. 14 d)     blooms (e.g. Bieri 1977, Pires et al. 2018), we split the
due to the asynchrony of surveys (i.e. surveys are not      year into 2 halves (spring: January to June, autumn:
all performed on the same day each month, but are           July to December; offset by 1 mo relative to the
spread out dependent on participant preference) and         bloom cycles presented by Bieri 1977 and Pires et al.
the number and extent of surveyed beaches. There-           2018 to account for the COASST monthly survey
fore, we split each year into 14 d windows (n = 26)         cycle) and overlaid the earliest reports of Velella
based on day of year, and calculated window-specific        strandings, as well as the 14 d period in which report-
reporting rate (number of Velella reports as a per-         ing rate was highest, for each half-year period.
centage of the total number of surveys performed            Although wind-speed information was taken from a
within that time period) by year for the entire coast-      single location (46.20° N, 124.64° W; Fig. 1), time-
line. We performed these calculations separately for        series of wind-speed components were highly corre-
beaches north of 44° N (median number of surveys            lated (Pearson’s correlation coefficient: 0.66−0.99;
per 14 d window = 36, with 95% range of 11−70 sur-          Table S2) between our chosen location and 3 other
veys; 2001−2019) versus south of 44° N (median num-         grid points at alternate latitudes (45−48° N; distance
Jones et al.: Stranding events of Velella velella 73
offshore maintained at 45−55 km; Fig. 1), suggesting December to April window to represent environmen-
that patterns of prevailing wind-speed and direction tal conditions during the growth phase, and prior to
are broadly similar throughout the study region landfall, respectively. Indices were constructed as
(Table S2). follows:
Temperature. Sea surface temperature anomaly
(SSTa) data were obtained from the NOAA OI SST
2.3.2. Interannual variation in reporting rates V2 High Resolution Dataset (global, daily, resolution
= 0.25°; Reynolds et al. 2002) for 2002−2019. Temper-
To identify whether Velella mass strandings were ature anomalies were extracted for December to
related to interannual variability in environmental March of each year for all SSTa grid cells within 200
forcing factors, we processed our base data for the km of the coastline from 44° to 48.4° N, matching the
northern region (north of 44° N) from 2002 onwards extent of coastline represented in beach surveys. As
to provide annual measures of Velella reporting rate initial stranding reports predominantly occurred in
for spring and autumn periods defined as above, as a late March (Table S4), we excluded April SST values,
proxy for prevalence and extent (more beaches re- as they would represent oceanic conditions following
porting Velella indicative of more extensive/continu- landfall in most years. Annual temperature indices
ous mass stranding events) of mass stranding events. were created by averaging SSTa data for 2 mo (n = 3;
For each half-year, we found the number of beaches December−January, January−February, February−
where Velella was reported, as well as the total num- March), and 3 mo (n = 2; December−February, Janu-
ber of beaches surveyed within that period, which ary−March) windows spanning December to March
enabled us to calculate reporting rate as the propor- for each year, representing alternate timing, and
tion of surveyed beaches that reported Velella. We time-scales, of importance.
use beaches rather than surveys to calculate report- Upwelling. Daily upwelling data were downloaded
ing rate to avoid double reporting (i.e. participants from the NOAA Southwest Fisheries Science Center:
may report ‘re-found’ Velella in a subsequent sur- Environmental Research Division data portal
vey), and to more closely reflect spatial prevalence (https://oceanview.pfeg.noaa.gov/products/upwellin
and extent of stranding events (survey- and beach- g/dnld) between 2002 and 2019, for a location off-
based reporting rates were tightly correlated among shore of central Oregon (45° N, 125° W; Fig. 1B). The
years; Table S3). Although we present annual report- Bakun index (Bakun 1973) was used, representing
ing rates for spring and autumn periods, we restrict the daily average of wind-driven cross-shore trans-
our subsequent analyses described in the following port computed from 6-hourly surface pressure fields.
section to the spring period, as autumn strandings While this measure does not represent realized
were only reported in 5 of the 18 years examined upwelling, it does provide a measure of upwelling
(Table S3). propensity off the coast of Washington and Oregon
(García-Reyes et al. 2014). We created 3 indices of
upwelling: (1) average upwelling intensity (UI), (2)
2.3.3. Modeling environmental forcing prevalence of positive upwelling calculated as the
proportion of time with positive upwelling (UI > 0),
To examine the influence of environmental forcing and (3) cumulative positive upwelling (Σ u > 0UI).
factors on Velella beaching during the spring time Each of these indices was created for the same time
period, we constructed a series of models linking periods as described for SSTa.
indices of specific environmental conditions thought Wind. Wind data from the NARR dataset (see Sec-
to influence the extent and/or intensity of Velella tion 2.3.1) were processed as above to obtain annual-
mass strandings (i.e. those extant prior to beaching) ized measures (2002−2019) representative of prevail-
to spring annual reporting rates calculated across ing easterly wind conditions. In order to represent
beaches north of 44° N (see Section 2.3.2). Given that alternate features of wind forcing, we created 3
spring blooms are thought to be associated with a indices: (1) average easterly wind speed, (2) preva-
growth cycle lasting from December (prior year) to lence of onshore winds calculated as the proportion
May (e.g. Bieri 1977, Pires et al. 2018), and that earli- of time where winds were onshore (u > 0), and (3)
est reports (mid-March to mid-April) and peak re- cumulative onshore wind speeds (Σ u > 0u). Each of
porting rates during our spring window occurred these indices was calculated for the March, April,
prior to the end of April (Table S4), we constrained and March−April windows, respectively, as we were
our consideration of environmental conditions to the only concerned with onshore winds during the period74 Mar Ecol Prog Ser 662: 69–83, 2021 immediately prior to the predominant landfall win- forcing factor. Models containing only those proxi- dow (Table S4). We calculated the same indices for 3 mal indices for each environmental forcing factor points in space (Fig. 1), and the resulting indices were then compared based on AICc to identify the were highly correlated among locations (Table S5), best overall model of reporting rate. In addition, we suggesting that results would be unaffected by choice identified the best overall single-predictor models for of location. each environmental forcing factor (i.e. among alter- Annual reporting rates of Velella were analyzed nate indices) to examine the degree to which any using generalized additive mixed models (GAMMs, individual factor (i.e. wind, temperature, upwelling) fitted in R via the 'gamm4' package; Wood & Scheipl could explain interannual differences in reporting 2020) to account for potentially non-linear relation- rate. For a summary of the spatial and temporal ships between reporting rates and environmental extent of each analysis, refer to Table S6. factors. Our response of annual reporting rate is represented as a binomial variable, where the num- ber of trials was given as the total number of beaches 3. RESULTS surveyed and the number of successes was the num- ber of beaches reporting Velella. Each model con- Our searches returned 475 matches for Velella tained a random effect of survey year to account for search terms, or 2% of all surveys. Of these, 465 were pseudo-replication/non-independence within our re- genuine reports of Velella occurrence. Velella was sponse data (i.e. among beaches within year; Kéry & reported on 53% of all beaches within the study Royle 2015). region (n = 293). As we had alternate metrics for each of the 3 envi- ronmental forcing factors (SSTa: n = 5; Upwelling: n = 15; Wind: n = 9) we firstly constructed all possible 3.1. Spatio-temporal patterns of Velella reporting single (i.e. reporting rate = f[SSTa]; f[Upwelling]; f[Wind]), double (i.e. f[SSTa + Wind]; f[SSTa + Stranding events were reported in 14 of 20 years. Upwelling]; f[Upwelling + Wind]), and triple (i.e. Interannual patterns in Velella reporting rate ap- f[SSTa + Wind + Upwelling]) predictor models, peared to show stanzas of mass strandings (e.g. where each forcing factor was represented in a spe- 2003−2007, 2015−2019) interspersed by years where cific model by only 1 (or none) of the candidate Velella mass strandings were apparently absent indices. For each model, we calculated Akaike’s (2002, 2008−2014), a pattern particularly evident information criterion corrected for small sample size during spring (Fig. 2). For the region north of 44° N (AICc) as a measure of model fit (Burnham & Ander- where we have the most complete data, spring son 2002). We also calculated the maximum variance strandings were typically first reported from mid- inflation factor (VIF) among model predictors (VIF = March to mid-April (Fig. S1, Table S4). Autumn 1 / 1 – Ri 2, where Ri 2 is the coefficient of determina- stranding was less common and more temporally tion of predictor i, as a function of all other predictors variable than spring, with notable events in 2005 contained within the model) for each model as a (December) and 2014 (August) (Fig. S1). measure of multicollinearity, and excluded models The majority of spring events (2003−2006, 2015− with max VIF > 2.5 to avoid the selection of models 2018) were extensive, spanning > 400 km of coast- with collinear predictors (Akinwande et al. 2015). line, and occurred synchronously up and down the Following this step, we calculated Akaike weights coast (Fig. 3). In 2014 and 2015, Velella reports for each model (WAICc = e–ΔAICc/2; where ΔAICc was extended to the southern edge of COASST coverage measured relative to the best overall model), which at Cape Mendocino in northern California, essen- represents the likelihood of a particular model being tially covering the entire 900 km latitudinal extent the best model given the data and the candidate of the survey region (Fig. 3). Insufficient spatial cov- model set (Burnham & Anderson 2002, Wagenmak- erage in earlier years precludes understanding ers & Farrell 2004). As a measure of predictor impor- whether mass stranding events in 2003−2006 also tance, we then calculated the summed Akaike extended south of central Oregon (Fig. 3). Within the weight for each predictor across models in which it stranding years, reporting rates were generally was included. The proximal index for each environ- higher north of Cape Blanco (Fig. 4). The highest re- mental forcing factor was then selected as the index porting rates occurred within the region of the that had the highest summed Akaike weight across Columbia River mouth, broken only by beaches within the set of alternate indices for each environmental the immediate vicinity of the river mouth (Fig. 4A),
Jones et al.: Stranding events of Velella velella                                       75

                                                                    although this pattern appears to be driven by data
                                                                    from 2014 onwards (Fig. 4B).

                                                                                 3.2. Short-term effects of wind

                                                                       During winter (November to February), prevailing
                                                                    winds within our study region tended to be directed
                                                                    north, taking on more of an onshore component (i.e.
                                                                    directed east) in March to April (Fig. S2). From April
                                                                    onwards, the prevailing winds were directed south
                                                                    to southeast, a pattern most clearly demonstrated
                                                                    throughout the summer months (Fig. S2). Based on
                                                                    previous literature (e.g. Pires et al. 2018, Betti et al.
                                                                    2019), we expected Velella transport to be directly
                                                                    wind driven, thus onshore during/following the
                                                                    spring transition even though Ekman transport would
                                                                    be offshore during the spring and summer. Spring
                                                                    Velella strandings were first reported following the
                                                                    transition from prevailing south-easterlies in winter
Fig. 2. Interannual variability in Velella reporting rate           (wind-driven travel = offshore) to north-westerlies in
(beaches reporting Velella out of the total surveyed) for the       spring (wind-driven travel = onshore; Fig. 5), sup-
georegion north of 44° N for spring (January to June) and
         autumn (July to December) time windows                     porting the hypothesis that strandings are directly
                                                                    tied to onshore transport conditions.

Fig. 3. Spatio-temporal reporting of Velella. Presence/absence of Velella reports are shown within 50 km latitudinal bands of
coastline per month from 2000 to 2019. Bars are colored according to the presence (red) or absence (blue) of Velella reports,
with lighter shading indicative of location-times with < 4 surveys. Location-times lacking survey data are shown in gray. Map
inset is shown for illustration purposes and displays surveyed beach locations (red circles) as well as locations referred to in the
                 text; CF: Cape Flattery; CR: Columbia River mouth; CB: Cape Blanco; CM: Cape Mendocino
76 Mar Ecol Prog Ser 662: 69–83, 2021
ond ranked model, which was almost equivalent to
the best model when judged on AICc (Table 1). By
contrast, upwelling metrics were only included in
lower ranked models (Table 1).
Fitted relationships for the best overall multiple-
predictor model (Table 1) were suggestive of a positive
relationship between Velella reporting rate and win-
ter SSTa (Fig. 6). For winters where average SSTa was
< 0, annual springtime reporting rates were at or near
0, whereas warmer winters (SSTa > 0) displayed a
step-like transition in Velella occurrence (Fig. 6A), a
pattern accentuated in the single-predictor model
(Fig. 6C). The best model also suggested that lower
spring onshore wind prevalence was associated with
higher springtime Velella reporting rates when as-
sessed among years (Fig. 6B), a pattern which became
modal in the single-predictor model (Fig. 6D). The fit-
ted relationship for upwelling suggested a negative
relationship between Velella reporting rate and up-
welling prevalence in the preceding winter months
(Fig. 6E). However, models containing either upwelling
or wind as the only predictor of reporting rate were
considerably worse than models containing winter
SSTa (wind: ΔAICc = 5.9, upwelling: ΔAICc = 8.0;
Table 1), suggesting that prevailing patterns are best
described by winter SSTa (Table 1). Because Velella
reporting rate and average December−February SSTa
were both extreme in the spring of 2015, we re-ran
Fig. 4. Spatial patterns in beach-specific Velella reporting
rate. (A) Beach locations color-coded by reporting rate (per- the model selection and fitting process excluding this
cent of surveys reporting Velella as a function of total sur- year. Resultant models (Tables S7 & S8) and fitted re-
veys cumulative over all years) and (B) kernel-smoothed lationships (Fig. 6) were not manifestly different.
(Gaussian; σ = 0.45° latitude) reporting rate as a function of Not surprisingly, winter SST, upwelling, and spring
latitude, overall (black line), and before/after the northeast
Pacific marine heatwave of 2014−2016 (before: blue; dur- onshore winds were collinear, as indicated by VIF val-
ing/after: red). Text in (A) indicates locations referred to in ues (Table 1). In particular, winter SSTa (December−
the text; CF: Cape Flattery; CR: Columbia River mouth; CB: February) was negatively correlated (assessed via
Cape Blanco; CM: Cape Mendocino Pearson’s correlation coefficient) with positive upwelling
prevalence in December−January (ρ = −0.69) and with
3.3. Environmental forcing associated with Velella onshore wind prevalence in spring (March−April: ρ =
mass strandings −0.60; April: ρ = −0.27; Fig. S3). As such, disentangling
the degree to which reporting rates were affected by a
When models were constricted to only a single combination of all 3 environmental forcing factors,
predictor, the best metric for each of the environmen- beyond the effect of winter SSTa, is problematic.
tal forcing factors included average winter SSTa
(December−February), spring onshore wind preva-
lence (March−April), and positive upwelling preva- 4. DISCUSSION
lence during winter (December−January; Table S7).
Overall, winter SST was the best predictor of Velella Our data demonstrate that Velella beaching can be
reporting rate during the ensuing spring, and the extensive in the northern CCLME, arrayed along the
best overall model contained average winter SSTa coastline for >1000 km in some events. Beachings are
(December−February) and late spring onshore wind associated with predictable annual shifts in onshore
prevalence (April) as predictors (Table 1). Winter wind direction (Fig. 5), pushing massive colony
SSTa was included in all of the highest ranked mod- aggregations to shore synchronously throughout our
els, and was the only predictor included in the sec- study system (Fig. 3). The occurrence of Velella massJones et al.: Stranding events of Velella velella 77
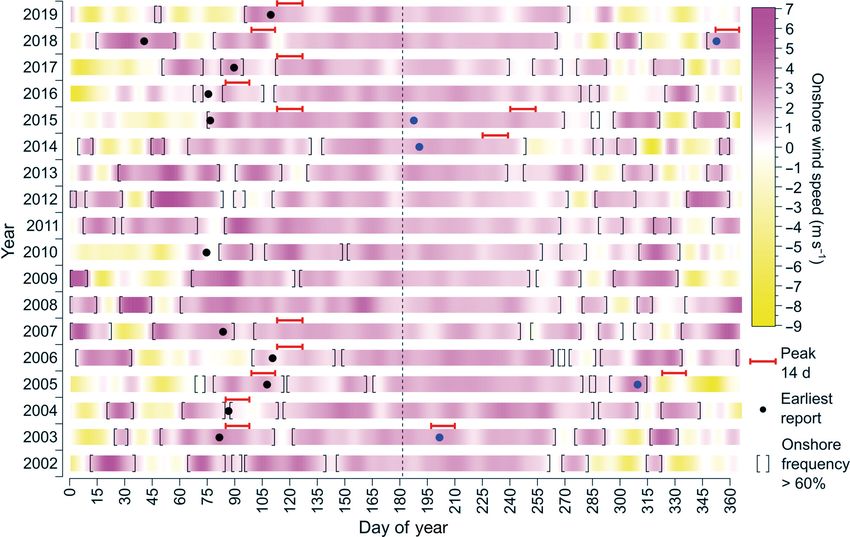
Fig. 5. Smoothed onshore wind speeds (North American Regional Reanalysis dataset; kernel smooth; Gaussian, σ = 7 d) each
year from 2002 to 2019 arrayed on a colorized intensity scale. Brackets indicate periods where the frequency of onshore winds
(14 d moving window) was > 60%. For years with Velella, first reports are indicated by dots: black for the spring half year and
blue for the autumn half year. The dashed vertical line indicates the spring−autumn division. Horizontal red bars show peak
Velella reporting rate (14 d window) for each half year
Table 1. Model selection table for generalized additive models of spring Velella reporting rate. Multiple-predictor models
were compared among all permutations of models constructed including average December to February sea surface tempera-
ture anomaly (SSTa), onshore wind speed prevalence in April, and positive upwelling prevalence in February to March, which
were identified as the best representations of each environmental forcing factor based on summed Akaike weight. Best possi-
ble models consisting of only a single predictor of SSTa, wind, or upwelling are given in the latter half of the table. For each
part of the table (multiple, single) ΔAICc (where AICc is Akaike’s information criterion corrected for small sample size) is
given relative to the best possible model in that set, and WAICc is the Akaike weight (WAICc = e–ΔAICc/2) as a measure of the ev-
idence in support of that model being the best model given the data and the candidate model set. VIFmax is the maximum vari-
ance inflation factor statistic calculated among predictors included in that model as a measure of model multicollinearity
Rank Predictors AICc VIFmax ΔAICc WAICc
Multiple-predictor model selection
1 SSTa [Dec−Feb] + Wind-prev [Apr] 101.81 1.51 0.0 0.707
2 SSTa [Dec−Feb] 103.60 1.8 0.287
3 SSTa [Dec−Feb] + Upwell-prev [Feb−Mar] + Wind-prev [Apr] 109.03 5.93a 7.2
4 SSTa [Dec−Feb] + Upwell-prev [Feb−Mar] 111.56 2.17 9.8 0.005
5 Wind-prev [Apr] 116.10 14.3 0.001
6 None 118.42 16.6 0.000
7 Upwell-prev [Feb−Mar] + Wind-prev [Apr] 124.01 1.49 22.2 0.000
8 Upwell-prev [Feb−Mar] 124.65 22.8 0.000
Best single-predictor models
1 SSTa [Dec−Feb] 103.60 0.00 0.934
2 Wind-prev [Mar−Apr] 109.50 5.90 0.049
3 Upwell-prev [Dec−Jan] 111.57 7.97 0.017
a
This model had a VIFmax value exceeding the 2.5 cut-off and is excluded from the calculation of Akaike weight due to multi-
collinearity among included predictors78 Mar Ecol Prog Ser 662: 69–83, 2021
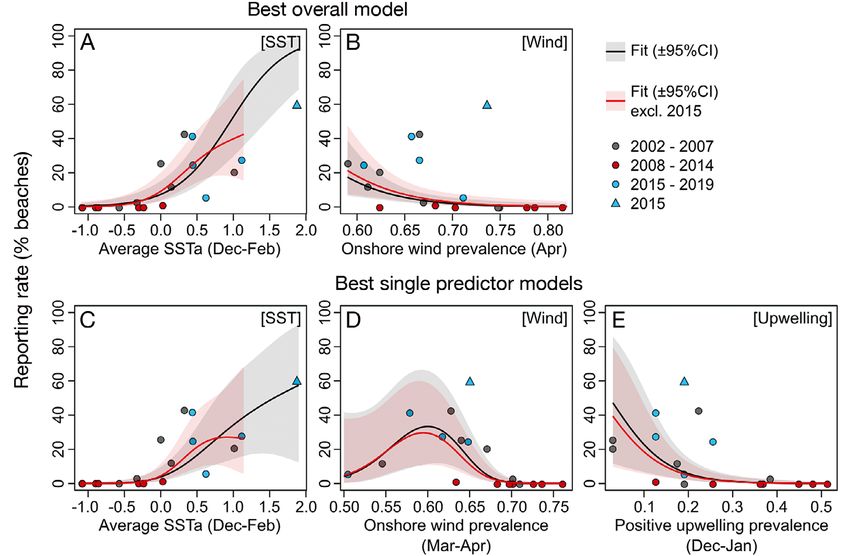
Fig. 6. Spring Velella reporting rate as a function of physical forcing factors, with fitted GAM predictions (mean ± 95% confi-
dence interval) of reporting rate. Rows denote differences in model construction called out in headings; columns denote dif-
ferent predictors, called out in the upper right of each panel. Best overall model: Reporting rate ~ f(SSTa + Wind, where SSTa:
sea surface temperature anomaly), with fitted regression lines between predicted reporting rate and (A) winter SSTa (propor-
tion onshore winds held constant at 0.66) and (B) spring onshore winds (SSTa held constant at 0) for models with and without
the inclusion of 2015. Single-predictor models: panels show the best fitting single-predictor models for each of (C) SSTa, (D)
onshore winds, and (E) upwelling for models with and without the inclusion of 2015
stranding events in spring appears to be related peated annual strandings of over 500 km in spa-
to warmer winter water temperature (Table 1), with tial extent (Fig. 3). In fact, whether Velella strand-
stranding rate appearing to increase as a step function ings extended north and south of our study system
of SSTa (i.e. > 0°C; Fig. 6A,C). Mass strandings of is an open question. McGrath et al. (1994) also
Velella may also be influenced by local oceanographic noted that Velella strandings can occur almost
features (Fig. 4), herein most prominently demon- simultaneously over large stretches of coastline, in
strated by the elevation of reporting in the region of their case a single stranding event over at least
the Columbia River plume, and potentially by the 400 km of the Irish coastline in 1992. Other studies
diminution of reporting south of Cape Blanco, a known have noted smaller spatial extents (Pires et al.
upwelling domain boundary (Huyer et al. 2005). 2018, Betti et al. 2019), mostly due to sampling
Finally, although some studies (e.g. Pires et al. 2018) constraints.
have hypothesized that years in which young colonies It is notable that while our data clearly suggest a
receive a nutrient boost may result in greater blooms, prominent spring bloom, autumn beachings were
we found no evidence that upwelling strength was much rarer and occurred at different times (2005:
associated with an increase in Velella reporting December; 2014: August) in the years in which they
rate after controlling for the effect of temperature were reported (Fig. S1). Although both spring and
(Table 1). autumn strandings of mature colonies have been
reported (e.g. Bieri 1977, Purcell et al. 2015), Purcell
et al. (2012) suggested that 2 generations per year, as
4.1. Stranding events proposed by Bieri (1977), is unlikely in cooler water
systems where declining autumn−winter tempera-
The COASST data provide a window into the tures, lower production, and increasingly rough seas
geographic scale of Velella strandings, with re- likely curtail second-generation growth and survival.Jones et al.: Stranding events of Velella velella 79
The paucity of autumn data on Velella strandings in influence of onshore wind prevalence, with years of
our study system prevented the use of modeling, pre- greater prevalence in March−April associated with
cluding definitive conclusions about the influence of few to no reports of Velella strandings. Although this
temperature or wind. However, both years of signifi- may seem contradictory, onshore wind prevalence
cant autumn Velella reporting (2005, 2014) were also values included in our models were greater than 0.5
climatologically anomalous, with delayed coastal across all years (Fig. 6B,D), indicating that onshore
upwelling in the northern CCLME in 2005 (Schwing transport conditions are present each year, as con-
et al. 2006, Barth et al. 2007, Parrish et al. 2007), and cluded above. Whether strandings occur may thus be
the formation of the northeast Pacific Marine Heat- governed by bloom formation, size, and/or persist-
wave in winter 2013/14 (Bond et al. 2015, Jones et al. ence prior to the transport window. Our limited
2018). autumn data suggest that Velella strandings also
Zeman et al. (2018) noted that the availability of occur during/following periods of onshore winds, but
fish eggs as a high-quality prey resource during similar to spring, such conditions were evident across
winter/spring may explain the apparent disparity in all years (Fig. 5), suggesting that autumn stranding
Velella abundance between spring and autumn events may also be related to factors other than solely
peaks in general, and that anomalous climate condi- favorable wind direction.
tions, such as in 2014/15, may lead to prolonged
availability of fish eggs due to alterations in spawn-
ing phenology and duration. The extension, or alter- 4.3. Role of temperature
ation, of fish spawning behavior during anomalous
years provides one possible explanation for these Our data suggest multi-year stanzas of Velella
sporadic autumn mass strandings, but other explana- mass beaching events, most prominently in 2014−
tions related to these climatological anomalies (i.e. 2018, interspersed by years where mass beaching
concurrent alterations to the physical environment) events were seemingly absent, inferred from the
cannot be ruled out. lack of reports in those years (Figs. 2 & 3). Purcell
et al. (2015) also reported on the anomalous occur-
rence of Velella on beaches in the North American
4.2. Role of wind Pacific during 2014. Their study corroborates the
larger pattern we found, as only in 2014 did their
Our results clearly indicate that wind direction data suggest that the relative occurrence (Velella
plays a crucial role in Velella beaching (Fig. 5). sightings over all gelatinous zooplankton reports)
Given the pleustonic nature of Velella colonies, this was significant (52.8% or 141 out of 267 reports).
is not surprising. Previous studies have also identi- Prior to 2014, Velella comprised no more than 3%
fied local wind speed and direction as important of all reported beachings. Our model suggests that
determinants of Velella strandings. Betti et al. (2019) one obvious factor underlying these stanzas is win-
found that spring strandings along the Ligurian ter SST (Table 1, Fig. 6), which was significantly
coastline were associated with onshore winds. Pires warmer than climatological normal during/following
et al. (2018) noted the importance of wind-driven sur- the onset of the northeast Pacific marine heatwave
face waters in determining the shoreward distribu- (2014−2017; Di Lorenzo & Mantua 2016, Oliver et
tion of Velella, and pointed to upwelling relaxation al. 2018), but also from 2003−2005. The intervening
events as the primary factor influencing the immedi- years (2006−2014) were predominantly cold (Fig. 6)
ate occurrence of Velella on Portuguese beaches, as and lacked reports of Velella, suggesting that Vel-
colonies aggregated along the coastal front were ella blooms are either restricted (i.e. lower abun-
transported inshore. dance), or prevented from beaching following colder/
Our data indicate that spring reports of Velella stormier winters.
stranding occurred following the transition to pre- Zeman et al. (2018) found that during the heat-
vailing onshore winds, which typically occurred in wave, Velella colonies along the northern CCLME
March (Fig. 5). However, this transition was observed (42.5°−46.5° N) had high ingestion rates of northern
in all years, including those without reports of Velella anchovy Engraulis mordax eggs, particularly in the
stranding. Taken together, these results suggest that region of the Columbia River plume where this fish
onshore winds are a necessary but not sufficient pre- species is known to spawn. They hypothesized that
condition for Velella stranding. Our modeling exer- during the heatwave years, the relatively warmer
cise revealed a negative (Fig. 6B) or modal (Fig. 6D) winter−spring months allowed temporal expansion80 Mar Ecol Prog Ser 662: 69–83, 2021
of spawning northern anchovy (Auth et al. 2018), ‘The majority of the beach was covered with
which may have facilitated spring blooms of Velella Velella Velella and they appeared to be smaller
via the additional food resource of anchovy eggs. Our than what we have seen in the past as well as in
spatial data support this hypothesis, as the highest larger numbers so I have attached a couple of
reporting rates of Velella in the COASST dataset photos just to document. Wrack is virtually non-
were observed in the region of the Columbia River existent now as there is a major shortage of kelp.
plume during the spring months of the heatwave CM; 28 April 2016’
years (Fig. 4).
Our results, and those of Purcell et al. (2015) and Many authors have noted the necessity to move
Zeman et al. (2018), are demonstrative of Velella from Velella as a curiosity to Velella as a bona fide
mass beaching associated with warmer tempera- object of study (Purcell et al. 2012, 2015, Pires et
tures within the northern CCLME. Other studies al. 2018, Zeman et al. 2018). Beach sampling pro-
have also pointed to the association between warmer grams such as COASST, designed to sample organ-
than normal SST and the occurrence of Velella else- isms or objects with a monthly/seasonal signal, may
where, including mass aggregations along the coast be invaluable to extending the study of Velella, as
of Portugal (Pires et al. 2018), and anomalous sight- they can direct participants to sample both pres-
ings along the Pacific coast of South America (Car- ence and absence, and could ask for basic informa-
rera et al. 2019), the latter tied to El Niño−Southern tion on disk size, colony freshness, and even colony
Oscillation. More generally, recent state space density and percent cover along prescribed tran-
modeling by Bellido et al. (2020) suggests an in- sects or quadrats (e.g. the information volunteered
fluence of positive winter SSTa on subsequent jel- qualitatively in the quote above). That these latter
lyfish swarms and mass beaching (Pelagia noctiluca measures could be collected digitally (i.e. with
along the coast of Malaga, Spain), and where data properly scaled images) makes the realistic possi-
were collected in part by the digital citizen science bility of large-scale, long-term data collection even
application ‘Infomedusa App.’ Collectively, this easier.
work suggests that further exploration of the role of
warming ocean temperatures on the occurrence
and relative abundance of jellyfish, including Vel- 4.5. Conclusion
lela, is warranted.
Current remote sensing technology is able to
detect physical signals in the marine environment
4.4. Citizen science (e.g. sea ice cover, SST, surface roughness) and lower
trophic level response (e.g. chlorophyll), as well as
Several studies of the distribution and interannual indicators of human activity (e.g. ship tracking via
abundance of Velella have relied on citizen science vessel monitoring system), making calculations of
data (e.g. METEOMEDUSE, EcoJel, JellyWatch global forcing relatively straightforward (Pettorelli et
Project: Purcell et al. 2015; GelAvista: Pires et al. al. 2018, Werdell et al. 2019). However, tracking and
2018), although the majority of these programs are understanding ecosystem response to these changes
occurrence-only and often unassociated with sys- is lacking (Rowland et al. 2018), which inhibits our
tematic sampling. Purcell et al. (2015) suggested that ability to monitor for sudden shifts in ecosystems
Velella occurrence, as proxied by beaching reports, pushed beyond resistance and resilience thresholds
is particularly suited to citizen science, as ‘such pro- (Tam et al. 2017, Bland et al. 2018).
grams can provide data over large regions at re- Given the persistence of spring onshore transport
latively low cost’ (p. 1064). The COASST dataset conditions in this region across all years such that
clearly demonstrates that even when Velella report- Velella blooms, if they existed offshore, would be
ing is not required, a systematic monthly beach transported to the beach, our study suggests that
sampling program can return Velella data at vol- winters with warmer than climatological average
ume and of a quality suitable for quantitative mod- SST appeared most favorable to the appearance and
eling. In part this is because Velella mass strand- persistence of large-scale blooms (Fig. 6A). Given
ings are difficult to miss. At the same time, program the broad spatial extent of the blooms intuited here
participants often demonstrate the ability to make (e.g. Fig. 3), the predicted increase in heatwave
astute observations in addition to simple presence. events (Meehl & Tebaldi 2004, Hobday et al. 2018,
As one COASST observer noted: Oliver et al. 2018), the presumed importance ofJones et al.: Stranding events of Velella velella 81
Velella as an epipelagic predator (Purcell et al. 2012) Bieri R (1977) The ecological significance of seasonal occur-
with potential impacts on forage fish populations rence and growth rate of Velella (Hydrozoa). Publ Seto
Mar Biol Lab 24:63−76
(Zeman et al. 2018), and the massive transport of bio- Bland LM, Rowland JA, Regan TJ, Keith DA and others
mass from the coastal fronts to the nearshore repre- (2018) Developing a standardized definition of ecosys-
sented by Velella strandings (e.g. Kemp 1986, Betti et tem collapse for risk assessment. Front Ecol Environ 16:
al. 2019), we suggest that the widespread occurrence 29−36
Bond NA, Cronin MF, Freeland H, Mantua N (2015) Causes
of Velella strandings may signal shifts in pelagic eco-
and impacts of the 2014 warm anomaly in the NE Pacific.
systems, at least in eastern boundary current systems Geophys Res Lett 42:3414−3420
such as the CCLME. When combined with other eco- Brodeur RD, Hunsicker ME, Hann A, Miller TW (2019)
system indicators of the dramatic, nonlinear effects of Effects of warming ocean conditions on feeding ecology
of small pelagic fishes in a coastal upwelling ecosystem:
marine heatwaves in these systems, including harm-
a shift to gelatinous food sources. Mar Ecol Prog Ser 617-
ful algal blooms (McCabe et al. 2016), multi-trophic 618:149−163
level shifts in community composition and productiv- Burge CA, Eakin CM, Friedman CS, Froelich B and others
ity (Cavole et al. 2016, Peterson et al. 2017, Brodeur (2014) Climate change influences on marine infectious
et al. 2019), and seabird mass mortality events (Jones diseases: implications for management and society.
Annu Rev Mar Sci 6:249−277
et al. 2018), Velella strandings fit into a larger pic- Burnham K, Anderson D (2002) Model selection and multi-
ture of sudden and persistent shifts in trophic model inference, 2nd edn. Springer, New York, NY
energy pathways, community biodiversity, and car- Carrera M, Trukillo JE, Brandt M (2019) First record of a by-
rying capacity. the-wind-sailor (Velella velella Linnaeus, 1758) in the
Galápagos Archipelago - Ecuador. Biodivers Data J 7:
e35303
Acknowledgements. We thank the thousands of participants
Cavole LM, Demko AM, Diner RE, Giddings A and others
of the COASST citizen science program; this work would
(2016) Biological impacts of the 2013−2015 warm-water
not have been possible without their dedication and curios-
anomaly in the Northeast Pacific. Oceanography 29:
ity. We particularly thank Elizabeth Kuehn and Dan Dunphy
273−285
Jr. for sending the COASST office an email remarking on
Champion C, Hobday AJ, Tracey SR, Pecl GT (2018) Rapid
the appearance of Velella earlier than usual, which inspired
shifts in distribution and high-latitude persistence of
this investigation. Funding was provided by Washington
oceanographic habitat revealed using citizen science
Sea Grant (Grant: R/RCE-9), and NSF (Grant: DRL/AISL
data from a climate change hotspot. Glob Change Biol
1322820). Additional funding for J.K.P. was provided by the
24:5440−5453
Wakefield family. We thank Francis Wiese, Bill Sydeman,
Cheung WWL, Meeuwig JJ, Feng M, Harvey E and others
Ric Brodeur, Jackie Lindsey, Charlie Wright, and 3 anony-
(2012) Climate-change induced tropicalisation of marine
mous reviewers for critical feedback that greatly improved
communities in Western Australia. Mar Freshw Res 63:
the manuscript.
415−427
Condon RH, Duarte CM, Pitt KA, Robinson KL and others
LITERATURE CITED (2013) Recurrent jellyfish blooms are a consequence of
global oscillations. Proc Natl Acad Sci USA 110:1000−1005
Akinwande MO, Dikko HG, Samson A (2015) Variance Daskalov GM, Grishin AN, Rodionov S, Mihneva V (2007)
inflation factor: as a condition for the inclusion of sup- Trophic cascades triggered by overfishing reveal possi-
pressor variable(s) in regression analysis. Open J Stat 5: ble mechanisms of ecosystem regime shifts. Proc Natl
754−767 Acad Sci USA 104:10518−10523
Auth TD, Daly EA, Brodeur RD, Fisher JL (2018) Phenologi- Di Lorenzo E, Mantua N (2016) Multi-year persistence of the
cal and distributional shifts in ichthyoplankton associ- 2014/15 North Pacific marine heatwave. Nat Clim
ated with recent warming in the northeast Pacific Ocean. Change 6:1042−1046
Glob Change Biol 24:259−272 Evans F (1986) Velella velella (L.), the ‘by-the-wind-sailor,’
Bakun A (1973) Coastal upwelling indices, west coast of in the North Pacific Ocean in 1985. Mar Obs 56:196−200
North America, 1946−71. NOAA Tech Rep NMFS SSRF- Foo SA, Byrne M (2017) Marine gametes in a changing
671 ocean: impacts of climate change stressors on fecundity
Barth JA, Menge BA, Lubchenco J, Chan F and others and the egg. Mar Environ Res 128:12−24
(2007) Delayed upwelling alters nearshore coastal ocean García-Reyes M, Largier JL, Sydeman WJ (2014) Synoptic-
ecosystems in the northern California current. Proc Natl scale upwelling indices and predictions of phyto-and
Acad Sci USA 104:3719−3724 zooplankton populations. Prog Oceanogr 120:177−188
Bellido JJ, Báez JC, Souviron-Priego L, Ferri-Yañez F, Salas Hamel NJ, Burger AE, Charleton K, Davidson P, Lee S,
C, López J, Real R (2020) Atmospheric indices allow Bertram DF, Parrish JK (2009) Bycatch and beached
anticipating the incidence of jellyfish coastal swarms. birds: assessing mortality impacts in coastal net fisheries
Mediterr Mar Sci 21:289−297 using marine bird strandings. Mar Ornithol 37:41−60
Betti F, Bo M, Enrichetti F, Manuele M, Cattaneo-Vietti R, Hobday AJ, Oliver ECJ, Sen Gupta A, Benthuysen JA and
Bavestrello G (2019) Massive strandings of Velella others (2018) Categorizing and naming marine heat-
velella (Hydrozoa: Anthoathecata: Porpitidae) in the Lig- waves. Oceanography 31:162−173
urian Sea (North-western Mediterranean Sea). Eur Zool Huyer A, Fleischbein JH, Keister J, Kosro PM, Perlin N,
J 86:343−353 Smith R, Wheeler PA (2005) Two coastal upwelling82 Mar Ecol Prog Ser 662: 69–83, 2021 domains in the northern California Current system. clusion: persistence, learning, and the social network J Mar Res 63:901−929 of citizen science. Proc Natl Acad Sci USA 116: Jones MC, Cheung WW (2015) Multi-model ensemble pro- 1894−1901 jections of climate change effects on global marine biodi- Perry AL, Low PJ, Ellis JR, Reynolds JD (2005) Climate versity. ICES J Mar Sci 72:741−752 change and distribution shifts in marine fishes. Science Jones T, Parrish JK, Peterson WT, Bjorkstedt EP and others 308:1912−1915 (2018) Massive mortality of a planktivorous seabird in Peterson WT, Fisher JL, Strub PT, Du X, Risien C, Peterson response to a marine heatwave. Geophys Res Lett 45: J, Shaw CT (2017) The pelagic ecosystem in the North- 3193−3202 ern California Current off Oregon during the 2014−2016 Keil R, Salemme K, Forrest B, Neibauer J, Logsdon M (2011) warm anomalies within the context of the past 20 years. Differential presence of anthropogenic compounds dis- J Geophys Res Oceans 122:7267−7290 solved in the marine water of Puget Sound, WA and Pettorelli N, Schulte to Bühne H, Tulloch A, Dubois G and Barkley Sound, BC. Mar Pollut Bull 62:2404−2411 others (2018) Satellite remote sensing of ecosystem func- Kemp PF (1986) Deposition of organic matter on a high- tions: opportunities, challenges and way forward. energy sand beach by a mass stranding of the cnidarian Remote Sens Ecol Conserv 4:71−93 Velella velella (L.). Estuar Coast Shelf Sci 23:575−579 Pires RFT, Cordeiro N, Dubert J, Marraccini A, Relvas P, dos Kéry M, Royle JA (2015) Applied hierarchical modeling in Santos A (2018) Untangling Velella velella (Cnidaria: ecology: analysis of distribution, abundance and species Anthoathecatae) transport: a citizen science and oceano- richness in R and BUGS. Vol 1: Prelude and static mod- graphic approach. Mar Ecol Prog Ser 591:241−251 els. Elsevier, Amsterdam Purcell JE (2012) Jellyfish and ctenophore blooms coincide Last PR, White WT, Gledhill DC, Hobday AJ, Brown R, with human proliferations and environmental perturba- Edgar GJ, Pecl G (2011) Long-term shifts in abundance tions. Annu Rev Mar Sci 4:209−235 and distribution of a temperate fish fauna: a response to Purcell JE, Uye SI, Lo WT (2007) Anthropogenic causes of climate change and fishing practices. Glob Ecol Biogeogr jellyfish blooms and their direct consequences for 20:58−72 humans: a review. Mar Ecol Prog Ser 350:153−174 Lucas CH, Jones DOB, Hollyhead CJ, Condon RH and oth- Purcell JE, Clarkin E, Doyle TK (2012) Foods of Velella ers (2014) Gelatinous zooplankton biomass in the global velella (Cnidaria: Hydrozoa) in algal rafts and its distri- oceans: geographic variation and environmental drivers. bution in Irish seas. Hydrobiologia 690:47−55 Glob Ecol Biogeogr 23:701−714 Purcell JE, Milisenda G, Rizzo A, Carrion SA and others McCabe RM, Hickey BM, Kudela RM, Lefebvre KA and oth- (2015) Digestion and predation rates of zooplankton ers (2016) An unprecedented coastwide toxic algal bloom by the pleustonic hydrozoan Velella velella and wide- linked to anomalous ocean conditions. Geophys Res Lett spread blooms in 2013 and 2014. J Plankton Res 37: 43:10366−10376 1056−1067 McGrath D, Minchin D, Cotton D (1994) Extraordinary Reynolds RW, Rayner NA, Smith TM, Stokes DC, Wang W occurrences of the by-the-wind sailor Velella velella (L.) (2002) An improved in situ and satellite SST analysis for (Cnidaria) in Irish waters in 1992. Ir Nat J 24:383−388 climate. J Clim 15:1609−1625 Meehl GA, Tebaldi C (2004) More intense, more frequent, Rowland JA, Nicholson E, Murray NJ, Keith DA, Lester RE, and longer lasting heat waves in the 21st century. Sci- Bland LM (2018) Selecting and applying indicators of ence 305:994−997 ecosystem collapse for risk assessments. Conserv Biol 32: Mesinger F, DiMego G, Kalnay E, Mitchell K and others 1233−1245 (2006) North American regional reanalysis. Bull Am Schultz JA, Cloutier RN, Côté IM (2016) Evidence for a Meteorol Soc 87:343−360 trophic cascade on rocky reefs following sea star mass Moore E, Lyday S, Roletto J, Litle K and others (2009) Entan- mortality in British Columbia. PeerJ 4:e1980 glements of marine mammals and seabirds in central Schwing FB, Bond NA, Bograd SJ, Mitchell T, Alexander California and the north-west coast of the United States MA, Mantua N (2006) Delayed coastal upwelling along 2001−2005. Mar Pollut Bull 58:1045−1051 the US West Coast in 2005: a historical perspective. Geo- Oliver ECJ, Donat MG, Burrows MT, Moore PJ and others phys Res Lett 33:L22S01 (2018) Longer and more frequent marine heatwaves over Scyphers SB, Powers SP, Akins JL, Drymon JM and others the past century. Nat Commun 9:1324 (2015) The role of citizens in detecting and responding to Opdal AF, Brodeur RD, Cieciel K, Daskalov GM and oth- a rapid marine invasion. Conserv Lett 8:242−250 ers (2019) Unclear associations between pelagic fish Sumaila UR, Cheung WW, Lam VW, Pauly D, Herrick S and jellyfish in several major marine ecosystems. Sci (2011) Climate change impacts on the biophysics and Rep 9:2997 economics of world fisheries. Nat Clim Change 1: Parrish JK, Bond N, Nevins H, Mantua N, Loeffel R, Peter- 449−456 son WT, Harvey JT (2007) Beached birds and physical Tam JC, Link JS, Rossberg AG, Rogers SI and others (2017) forcing in the California Current System. Mar Ecol Prog Towards ecosystem-based management: identifying Ser 352:275−288 operational food-web indicators for marine ecosystems. Parrish JK, Litle K, Dolliver J, Haas T and others (2017) ICES J Mar Sci 74:2040−2052 Defining the baseline and tracking change in seabird Theobald EJ, Ettinger AK, Burgess H, DeBey LB and others populations: the Coastal Observation and Seabird Sur- (2015) Global change and local solutions: tapping the vey Team (COASST). In: Cigliano JA, Ballard HL (eds) unrealized potential of citizen science for biodiversity Citizen science for coastal and marine conservation. research. Biol Conserv 181:236−244 Routledge, New York, NY, p 19−38 Thorson JT, Scheuerell MD, Semmens BX, Pattengill- Parrish JK, Jones T, Burgess HK, He Y, Fortson L, Cavalier Semmens CV (2014) Demographic modeling of citizen D (2019) Hoping for optimality or designing for in- science data informs habitat preferences and popu-
You can also read