Watchdog or Loyal Servant? Political Media Bias in US Newscasts - Lea Bernhardt Ralf Dewenter Tobias Thomas August 2020 - HHU
←
→
Page content transcription
If your browser does not render page correctly, please read the page content below
NO 348

Watchdog or Loyal Servant?
Political Media Bias in US Newscasts
Lea Bernhardt
Ralf Dewenter
Tobias Thomas

August 2020
IMPRINT

D IC E D I SCU SSI ON PAP E R

Published by:
Heinrich-Heine-University Düsseldorf,
Düsseldorf Institute for Competition Economics (DICE),
Universitätsstraße 1, 40225 Düsseldorf, Germany
www.dice.hhu.de

Editor:
Prof. Dr. Hans-Theo Normann
Düsseldorf Institute for Competition Economics (DICE)
Tel +49 (0) 211-81-15125, E-Mail normann@dice.hhu.de

All rights reserved. Düsseldorf, Germany 2020.

ISSN 2190-9938 (online) / ISBN 978-3-86304-347-6

The working papers published in the series constitute work in
progress circulated to stimulate discussion and critical comments.
Views expressed represent exclusively the authors’ own opinions
and do not necessarily reflect those of the editor.
Watchdog or Loyal Servant?
 Political Media Bias in US Newscasts

 Lea Bernhardt1, Ralf Dewenter2 & Tobias Thomas3
 August 2020

We investigate if four leading, electronic news gathering organizations in the US – ABC News, CBS
News, FOX News, and NBC News – fulfill their role as the fourth estate in the US democracy. Our
analysis, using the Political Coverage Index (PCI) introduced by Dewenter et al (2020), is based
on the tonality of their political coverage using 815,000 human-coded news items from 2001
through 2012. For our econometric analysis, we use panel regressions with media and time fixed
effects. To account for endogeneity, we cut time spans around national elections out of our data.
In the remaining data, elections can be seen as a purely exogenous event. Focusing on the entire
media set, we find robust empirical results for an anti-government bias in media reporting: Under
Republican presidents, political coverage tends to be more liberal, whereas it tends to be more
conservative if the president is a Democrat. However, when focusing on each single news
organization, interesting differences emerge: For CBS News and NBC News, we find robust
empirical evidence of anti-government-bias. In contrast, FOX News is always much more critical
of Democrats than of Republicans. Hence, FOX News can be seen as a more loyal servant to one
party rather than acting as the fourth estate. In addition, we find no evidence that ABC News
significantly changes its position depending on the presidency. Although descriptive statistics
show a certain tendency toward government-critical reporting by ABC News, the variation is not
statistically significant.

Keywords: Political Coverage Index, government bias, tonality, media capture, US newscasts

JEL: C43, D72, L82

Research Funding: This research did not receive any specific grant from funding agencies in the
 public, commercial, or not-for-profit sectors.

1 Helmut Schmidt University Hamburg, Department of Economics, Germany, lea.bernhardt@hsu-hh.de.
2 Helmut Schmidt University Hamburg, Department of Economics, Germany, dewenter@hsu-hh.de.
3 Düsseldorf Institute for Competition Economics (DICE) at Heinrich-Heine-University Düsseldorf, Germany, and Centre

of Media Data and Society (CMDS) of the Central European University (CEU), Hungary, thomas@dice.hhu.de
 1
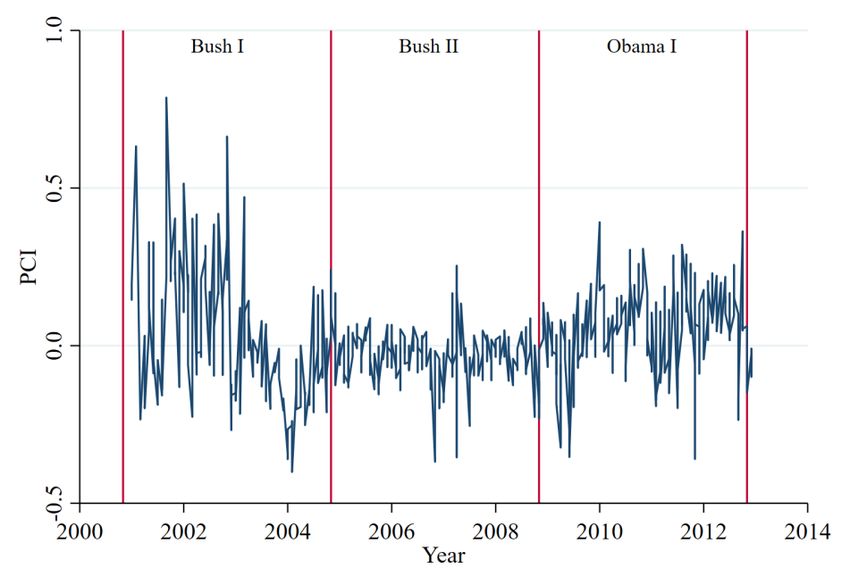
Table of Contents

1. Introduction................................................................................................................................................................3
2. Related Literature ....................................................................................................................................................5
3. The Political Positioning of the “Big Four” .....................................................................................................8
 3.1 The Data: Political Media Coverage of ABC, CBS, FOX, and NBC News .....................................8
 3.2 The Political Coverage Index (PCI): A Tonality-Based Measure of Media Bias .................. 11
 3.3 Application of the Media Data to the PCI ........................................................................................... 12
4. Do the Big Four serve as 4th Estate?............................................................................................................... 15
 4.1 Empirical Strategy ....................................................................................................................................... 15
 4.1.1 Econometric Set Up ........................................................................................................................... 15
 4.1.2 Identification Strategy...................................................................................................................... 16
 4.2 Empirical Results ......................................................................................................................................... 19
 4.2.1 Average Results on the Big Four .................................................................................................. 19
 4.2.2 Detailed Results on ABC, CBS, FOX, and NBC News ............................................................. 23
5. Conclusion ................................................................................................................................................................ 26
References .......................................................................................................................................................................... 28
Appendix............................................................................................................................................................................. 31

 2
1. Introduction

With the success of Donald Trump in the 2016 US presidential elections, the media and its role in
democracies are, once again, under scrutiny. For instance, on the one side, ABC News, CBS News,
and NBC News are often seen to be at least slightly politically left biased and are regularly accused
of spreading “fake news” from the US president’s perspective. On the other side, FOX News is often
seen as politically right biased, spreading “fake news” from the perspective of the other side of the
political spectrum. The strong and rising criticism of traditional media in the late 2010s, not just
in the US, leads us to the question the role media play in the US democracy. In this context, a rather
optimistic perspective can be traced back to parliamentary debate in 1787 in the United Kingdom
on providing media access to the parliament. In this debate, Edmund Burke claimed that media
form the “fourth estate” of government – going beyond the traditional three estates: The Lords
Spiritual, the Lords Temporal, and the House of Commons.

A less optimistic perspective is provided by Public Choice literature: For instance, Anderson and
McLaren (2012) argue that media are owned by people with political and profit motives, who use
their influence to change policy. Other authors argue that governments capture the media through
policy decisions in their favor or by access to the news stories in order to maintain “a ‘cozy’
relationship with the media” (Besley and Prat, 2006, 720). In particular, the latter explanation of
media capture implies that media outlets tend to be less critical of the government. The former
explanation would lead us to expect that such pro-government bias exists among media outlets
that are owned or edited by people aligned with the political party in power. In both cases, media
would fail in fulfilling their role as the fourth estate.

In this contribution, we analyze the role of four leading news gathering organizations in the US –
ABC News, CBS News, FOX News, and NBC News – on its democracy on the basis of a huge amount
of hand-coded media data that allows for focusing on the tonality of political reporting by the
aforementioned news organizations. The selected news organizations are relevant, as ABC News,
CBS News, and NBC News are the news divisions of the three big traditional commercial broadcast
television networks in the US. Subsequently, in 1996, FOX News was established as cable news
channel, competing, in large part, with the three aforementioned news gathering organizations.4

By applying the tonality-based Political Coverage Index (PCI), introduced by Dewenter et al.
(2020), to more than 815,000 human-coded news items on Democrats and Republicans from
2001 through 2012, we are able to identify the relative political positioning of the four newscasts
during the time span analyzed.

4 See section 3.1 for a discussion about this selection.
 3
However, as the political positioning of a newscast can change over time, in a next step we analyze
whether media coverage of politicians and parties differs depending on the party affiliation of the
president in office. If newscasts tend to be less critical of the political affiliation of the president
in office, this could be seen as a hint of media capture in the line of Besley and Prat (2006). In
contrast, if newscasts tend to be more critical of the political affiliation of the president in office,
this could be seen as an indication that the media serve as forth estate in line with Edmund Burke.

Beyond the general inquiry of the entire media data set, we will analyze the political coverage of
each individual news program in the set to investigate the existence of a government or anti-
government bias. Put differently, we analyze if ABC News, CBS News, FOX News, and NBC News
deliver as fourth estates or if they are loyal servants to only one party; if the latter is true, this can
be seen as ideologically driven.

Methodologically, our analysis is based on a panel regression set up with media and time fixed
effects as well as a multitude of economic and geopolitical controls to capture at least a part of the
factual performance of the government, which is also likely to be a major driver of the political
media coverage. However, by this measure, we cannot rule out certain serious endogeneity issues:
If, for instance, the political positioning of the media is not just affected by the party affiliation of
the president in office and the election results are also affected by the political positioning of the
media, this would lead to biased coefficients due to reverse causality. Furthermore, if both the
political positioning of the media as well as the election outcome were affected by the uncaptured
part of the performance of the government, this would lead to biased coefficients due to omitted
variables. Hence, we cut the time span around the elections out of our data. Consequently, our
analysis is mainly based on the remaining part of the data, where elections can be seen as purely
exogenous events. In doing so, we use elections as an identification tool.

The remainder of our contribution is structured as follows: Section 2 provides an overview of the
related literature and describes the research gap. In Section 3, the data are introduced and the
political positioning of the newscasts is demonstrated by the Political Coverage Index (PCI).
Section 4 econometrically investigates the role of the newscasts as the fourth estate for both the
entire media set as well as for each single newscast in the timeframe analyzed and discusses the
results. Finally, section 5 concludes.

 4
2. Related Literature

Media play an important role in the perceptions and decisions of individuals in the economic and
political contexts, because, in addition to direct communication and personal experience,
information is typically gathered indirectly through media channels. This is relevant because
media can never depict the complete reality, only painting a partial picture. In addition, media
reality is prone to various types of distortions, so-called media bias (Entman 2007). Of the various
types of media bias, the most prominent are advertising bias, when media change their news
coverage in tone or volume to favor their advertising clients (see Dewenter and Heimeshoff, 2014,
2015; Gambaro and Puglisi, 2015; or Reuter and Zitzewitz, 2006); the distance bias, when media
report more on events that take place close to their main market (Berlemann and Thomas, 2019);
the negativity bias, when media focus more on catastrophes, crime, and threatening political and
economic developments in comparison to more positive news (see Friebel and Heinz, 2014; Garz,
2013, 2014; Heinz and Swinnen, 2015 or Soroka, 2006); and the newsworthiness bias, when news
on certain issues crowd out coverage on other issues because they are seen as more newsworthy
(see Durante and Zhuravskaya, 2018 or Eisensee and Strömberg, 2007).5

In the political context, one question of interest is if media outlets favor one or another side of the
political spectrum. In addition to political science and communication sciences, this question is
analyzed in the public choice literature. For instance, Groseclose and Milyo (2005), focusing on
the US two party system, provide an index of media outlets by comparing the number of think
tanks and interest groups cited by Democratic and Republican members of US Congress with the
same groups quoted by the media. The results show a strong liberal bias among all US newscasts
examined, except FOX News’ Special Report. In contrast, Gentzkow and Shapiro (2010) compare
characteristic phrases frequently used in different media outlets. In addition, political media
biases are measured by Larcinese, Puglisi, and Snyder (2011) and Puglisi (2011) using references
to core topics, Qin et al. (2018) count references to political leaders, and Chiang and Knight (2011)
as well as Puglisi and Snyder (2015b) use newspapers' explicit endorsements and editorial
positions. Subsequently, Dewenter et al (2020), introduce a tonality-based Political Coverage
Index (PCI), apply it to 35 opinion-leading media in Germany and find empirical evidence that
media is fulfilling its role as fourth estate in the German democracy (see below).6

5 In addition, there is a large literature in communication and media science on the existence of media biases and its
foundations (see, among others, Ball-Rokeach, 1985, Ball-Rokeach and DeFleur, 1976, and Dunham, 2013).
6 There is also existing research on the political bias of German media outlets, provided by Garz et al. (2020). The authors

construct an index of media slant by comparing the language of Facebook posts by 84 German news outlets on
politicians who were investigated for criminal offenses with that of the main political parties. The results are
comparable to those of Dewenter et al. (2020).
 5
Consequently, individual perceptions and decisions based on biased political media reporting
might deviate from perceptions and decisions based on more unbiased information.7 These
deviations can affect both voters and politicians. For instance, in 1987, Page et al. show that
network television news accounts for a high proportion of changes in the policy preferences of
U.S. citizens. Benesch et al (2019) provide econometric evidence that media can affect the worries
of the population about policy relevant topics, like migration, by using media spill-overs from one
country to another as an instrument. A closer look at the impact of media coverage on political
action is provided by Snyder and Strömberg (2010).8 The authors find that voters living in regions
with insufficient political media coverage are less able to recall or evaluate their representatives.
This affects the work of politicians: Less covered congressmen are less willing to serve as
witnesses at congressional hearings or serve on committees. In addition, regions with less press
coverage of representatives receive less federal spending. The opposite causation, i.e. the impact
of government parties on media, is analyzed by Gentzkow et al (2015). In the international
political context, Eisensee and Strömberg (2007) show that media coverage of natural disasters
causally affects US disaster relief. The authors find evidence that, in times of high news pressure
caused by Olympic Games, natural disasters are less likely to be covered, which leads to lower
disaster relief.9

Another outstanding reason for the relevance of political media coverage is that is can affect voting
intentions and election outcomes: Dewenter et al. (2019) show that a less critical tonality of the
media coverage of a political party can increase the intention to vote for that party, at least in the
short term. Prat (2018) demonstrates that media organizations are able to induce voters to make
electoral decisions that they would not make if reporting were unbiased. Enikolopov et al. (2011)
focus on the impact of media coverage on election outcomes. The authors, analyzing electoral
outcomes of parliamentary elections in 1999 in Russian regions with different access to an
independent national TV channel, find that access to independent TV led to decreased votes for
the governing party and to an increased vote for major opposition parties. The results are

7 Beside inquiries regarding the impact of media reporting on perception and behavior in the political context, there is
also a huge and growing literature in the economic context. For instance, Nadeau et al. (2000), Soroka (2006), and van
Raaij (1989) show that the assessment of the state of the economy and economic expectations depends, at least in part,
on media reports. In this context, Ulbricht et al. (2017) use media data to improve economic forecasts. Alsem et al.
(2008), Goidel and Langley (1995), as well as Doms and Morin (2004) analyze the impact of media reporting on the
consumer climate. Garz (2012, 2013) investigates the impact of distorted media coverage of unemployment on the
perception of job insecurity, while Lamla and Maag (2012) analyze the impact of media reporting on inflation forecasts
of both households and professional forecasters. Chadi (2015) shows that media coverage of economic crises can even
affect life satisfaction. In addition, media coverage can also affect decisions and behavior. For instance, Dewenter et al.
(2016) find evidence that car sales depend, at least in part, on media coverage of the automotive industry.
8 Further contributions in this context are Bernhardt et al (2008), D‘Alessio and Allen (2000), Druckman and Parkin

(2005), Gentzkow et al. (2011) as well as Morris (2007).
9 More evidence on the effect of media coverage in the international political context is provided by Beckmann et al.

(2017) and Jetter (2017) with focus on terror activities and Durante and Zhuravskaya (2018) in the context of the
Israeli-Palestinian conflict.
 6
comparable to those of DellaVinga and Kaplan (2007). Based on the successive rolling out of FOX
News across US states, the authors find that Republicans gained additional votes in presidential
elections between 1996 and 2000 in cities with access to FOX News.

The demonstrated impact of media on perceptions and decisions in the political context draws
our attention to the fundamental role of the media in democracy. As mentioned in the
introduction, the perspective of Public Choice literature on the role of media in democracies is
rather sobering: Anderson and McLaren (2012) argue that media are owned by people with
political and profit motives who use their influence to change policy. However, Gentzkow and
Shapiro (2010) find that the media’s response to consumer preferences has a much higher
explanatory power for media slant than ownership structures. Other authors argue that
governments capture the media through policy decisions in their favor or by access to news
stories in order to maintain “a ‘cozy’ relationship with the media” (Besley and Prat, 2006, 720).
Specifically, the latter explanation of media capture implies that media outlets tend to be less
critical of the government. The former explanation would lead us to expect pro-government bias,
especially for those media outlets that are owned or edited by people aligned with the political
party in power. In both cases, media’s role as fourth estate would be, at least, rather restricted.

To better investigate the role of media in democracy, Dewenter et al (2020) introduce the Political
Coverage Index (PCI), which is based on the tonality of news reports, and apply it to Germany. The
result shows the relative positioning of different media outlets across the political spectrum. By
analyzing the variations of the political positioning in time, the authors tackle the question of
whether the media fulfill their role as the fourth estate or if there is empirical evidence of media
capture. They find empirical evidence that media fulfill their role as the fourth estate, at least in
Germany. In the present contribution, we apply PCI to four leading US news gathering
organizations – ABC News, CBS News, FOX News, and NBC News. In doing so, our work is connected
to Groseclose and Milyo (2005), Gentzkow and Shapiro (2010), and Greenstein and Zhu (2012).
However, in contrast to these contributions, we do not utilize quotes or characteristic phrases,
rather we use the tonality of news reports on political parties and politicians based on human-
coded media data. Thereby, our contribution addresses the gap that analyzing media bias by
“measuring the tone of articles and editorials, is relatively underutilized in economics” (Puglisi
and Snyder, 2015a, 664). In addition, we apply PCI to study government bias in news reporting.
In other words, we analyze whether the media fulfill its role as the fourth estate or whether the
media are captured. Therefore, our contribution is also connected to the work of Anderson and
McLaren (2012) and Besley and Prat (2006). In contrast to Dewenter et al (2020), we not only
analyze the role of the media as a whole but also focus on each single newscast in our media set.
In addition, to tackle endogeneity issues, which could not fully be ruled out by Dewenter et al
(2020), we utilize elections as an identification tool in our empirical strategy.
 7
3. The Political Positioning of the “Big Four”

3.1 The Data: Political Media Coverage of ABC, CBS, FOX, and NBC News

The Media Dataset

Our dataset, collected by Media Tenor International,10 comprises news programs by four major
US news gathering organizations – ABC News, CBS News, FOX News, and NBC News – namely ABC
World News Tonight, the CBS Evening News, NBC Nightly News, and FOX’s Special Report from the
beginning of 2001 through the end of 2012. We are aware that by focusing on ABC News, CBS
News, FOX News, and NBC News, we are mixing aired channels (ABC News, CBS News, and NBC
News) with a cable channel (FOX News). However, the distinction of aired and cable channels is
not relevant for the analysis provided. In addition, other news organizations, like CNN, could also
be of interest. Although the selection of the media in our analysis is mainly driven by data
availability, FOX News has higher ratings than CNN11. Hence, the selection can be argued from this
perspective as well.

Besides anecdotical evidence and scientific work by, among others, Groseclose and Milyo (2005),
the “Media Bias/Fact check” website,12 which sees itself as “the most comprehensive media bias
resource,” provides information on the political positioning of the ABC News, CBS News, FOX News,
and NBC News:

 • ABC News, founded in 1945, is the news division of the American Broadcasting
 Company (ABC), which owned by the Disney Media Networks division of The Walt Disney
 Company. Its flagship program is the daily evening newscast ABC World News tonight,
 which is a focus of our investigation. “Media Bias/Fact check” sees ABC News as having a
 slight to moderate liberal of left-center bias with a high share of factual reporting.13
 • CBS News, founded in 1927, is the news division of American television and radio service
 Columbia Broadcasting System (CBS). The president of CBS News is Susan Zirinsky. CBS
 News has multiple programs, including the CBS Evening News, which is a focus of our
 investigation. “Media Bias/Fact check” sees CBS News to have a slight to moderate liberal
 or left-center bias with a high share of factual reporting.14
 • Fox News was founded in 1996 by Rupert Murdoch. It is an American cable and satellite
 news television channel that is owned by the Fox Entertainment Group, a subsidiary of

10 For more information see: www.mediatenor.com
11
 See for instance: https://variety.com/2019/tv/news/network-ratings-top-channels-fox-news-espn-cnn-cbs-nbc-
abc-1203440870/ (last checked: August, 13th, 2020)
12 See: https://mediabiasfactcheck.com/ (last checked: August, 13th, 2020).
13 See https://mediabiasfactcheck.com/abc-news/ (last checked: August, 13th, 2020).
14 See https://mediabiasfactcheck.com/cbs-news/ (last checked: August, 13th, 2020).

 8
21st Century Fox. One of its news shows is FOX’s Special Report, which is a focus of our
 investigation. “Media Bias/Fact check” sees Fox News as having a moderate to strong
 conservative or right bias with a mixed share of factual reporting.15
 • NBC News was founded in 1940 and is the news division of the American
 broadcast television network, NBC, formerly known as the National Broadcasting
 Company. The division operates under NBC Universal News Group, a subsidiary of NBC
 Universal, which is, in turn, a subsidiary of Comcast. One of its flagship news programs is
 the NBC Nightly News, which is a focus of our investigation. “Media Bias/Fact check” sees
 NBC News to have a slight to moderate liberal or left-center bias with a high share of factual
 reporting.16

Human Coding

Each news program was coded by human analysts, based upon over 700 characteristics that are
defined in a binding coding manual (“the codebook”), including the reported topic (such as
domestic policy, health reform, military actions, etc.), participating persons (such as politicians,
entrepreneurs, managers, celebrities, etc.), participating institutions (such as political parties,
companies, football clubs, etc.), region of reference (such as Germany, USA, the UK, world), time
reference (future, present, past), and the source of information (such as journalist, politician,
expert, etc.). Each report was analyzed news item by news item, i.e. each time that a new topic,
person, institution, region, time reference, or source was mentioned, an additional news item was
coded. In addition, the analysts captured if the relevant protagonists and/or institutions receive
positive, neutral, or negative tone of coverage. Skipping all items that are not on political topics
results in a total of 815,252 observations that are used in our analysis.

The use of hand-coded data is an advantage, as “compared to human-based coding, automated
coding is less accurate in detecting the tone of each specific text analyzed” (Puglisi and Snyder
2015a, 656). With respect to political text analysis, Grimmer and Steward (2013) find that
computer linguistic approaches achieve accuracy no more than 0.65. Consequently, Grimmer and
Steward (2013) conclude that, for political text analysis, there is (at least so far) no adequate
substitute for human coding. In a similar line, more recently, in their comparative study of hand-
coding and computer-assisted text analysis methods, Nelson et al. (forthcoming, 25) conclude that
“none of the methods replace the human researcher.”17 Consequently, by now, “measuring the
tone of articles and editorials, is relatively underutilized in economics” (Puglisi and Snyder, 2015a,
664). In contrast, for the human coded data utilized in the present contribution, Media Tenor

15 See https://mediabiasfactcheck.com/fox-news/ (last checked: August, 13th, 2020).
16 See https://mediabiasfactcheck.com/nbc-news/ (last checked: August, 13th, 2020).
17 Earlier comparisons of human coding and computer assisted methods go back to Nacos et al. (1991).

 9
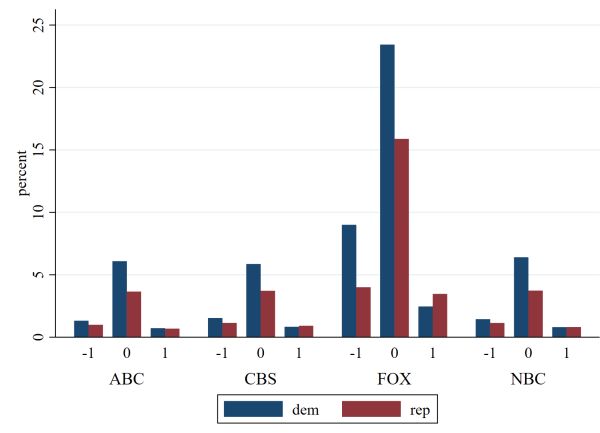
guarantees a minimum accuracy of 0.85 in comparison to a coding that is fully in line with the
codebook.18

Tone and Tonality

On average, the tone of the news items observed is negative, with a mean of -0.06, confirming the
well-known negativity bias of media reporting.19 In addition, the average tone in the reporting of
FOX News is, at -0.08, much more negative than the average tone of ABC News, CBS News, and NBC
News, which range from -0.03 to -0.05 (see Table 1).

 Table 1: Summary statistics for all newscasts

 Medium Obs Mean Std.Dev. Min Max

 ABC News 135.128 -0.0387558 0.4676518 -1 1

 CBS News 121.286 -0.0471695 0.5127805 -1 1

 FOX News 394.736 -0.0830707 0.4943626 -1 1

 NBC News 164.102 -0.0340642 0.4589244 -1 1

 Total 815.252 -0.0605199 .4864011 -1 1

Our dataset covers all political coverage of the newscast analyzed on both Democrats and
Republicans during the Republican presidency of George W. Bush as well as the Democratic
presidency of Barack Obama. By comparing the tone in media reporting between the time of
George W. Bush’s administration (see Figure 1) and Barack Obama’s administration (see Figure
2), we can observe differences in the political coverage of the newscasts analyzed. Media
reporting, for most newscasts, seems to be more critical toward Republicans during their
presidency and vice versa for Democrats.

18 The accuracy and reliability of the coding was regularly checked by Media Tenor, both with standard tests and random

spot checks, based on the codebook. Each month, for each coder, three analyzed reports were selected randomly and
checked. Coders scoring lower than 0.80, that is 80 percent accuracy in comparison to the codebook, were removed
from the coding process. In no month did the mean deviation among all coders exceeded 0.15. As a result, Media Tenor's
data achieves an accuracy of minimum 0.85.
19 The negativity bias in media reporting indicates that media focus more on catastrophes, crime, as well as threatening

political and economic developments than on more positive news (see among others Friebel and Heinz, 2014; Garz,
2013, 2014; Heinz and Swinnen, 2015 or Soroka, 2006).
 10
Figure 1: Share of positive, negative and neutral News Figure 2: Share of positive, negative and neutral News
 during Bush administration during Obama administration

Based on the number of positive, negative, and neutral news items, as defined by Dewenter et al.
(2020), the tonality , on a specific person or institution , extracted from a newscast , during time
t, can be defined as:

 , , − , ,
 , = (1)
 , ,

where , , is the total of all news items, , , is the number of positively rated reports, and , ,
the equivalent for negative reports.

3.2 The Political Coverage Index (PCI): A Tonality-Based Measure of Media Bias

The Political Coverage Index (PCI), as introduced by Dewenter et al. (2020), is based on tonalities
of news reports about political parties and politicians. PCI serves as a measure of the relative
political positioning of the media. Thereby, our contribution addresses the research gap that
analyzing media bias by “measuring the tone of articles and editorials, is relatively underutilized
in economics” (Puglisi and Snyder, 2015, 664).

By constructing the index, we are able to identify possible media biases and to analyze how
critically media cover specific parties, governments, or presidents. The unweighted PCI is
constructed by subtracting the average tonality of all news items about the Democrats from the
average tonality of the news about the Republicans.20 The PCI is measured as the difference

20In addition to biased media reporting in terms of tonality, media coverage might be biased by the share of coverage
dedicated to one party. In extreme cases, media could neglect to report on a certain party. In order to account for the
actual share of coverage of news items, we also define a weighted where stands for the share of coverage of

reports on the Republicans and for the share of coverage on the Democrats [ + = 1]: , =
 11
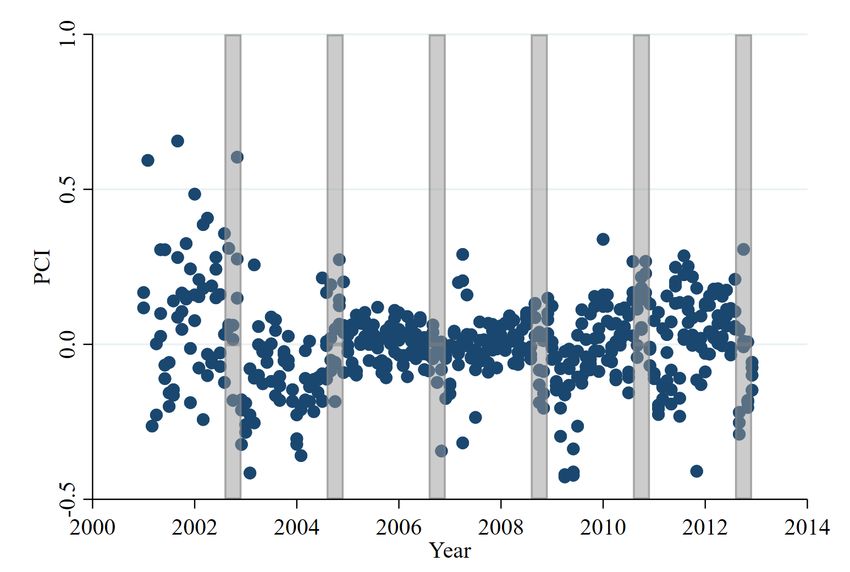
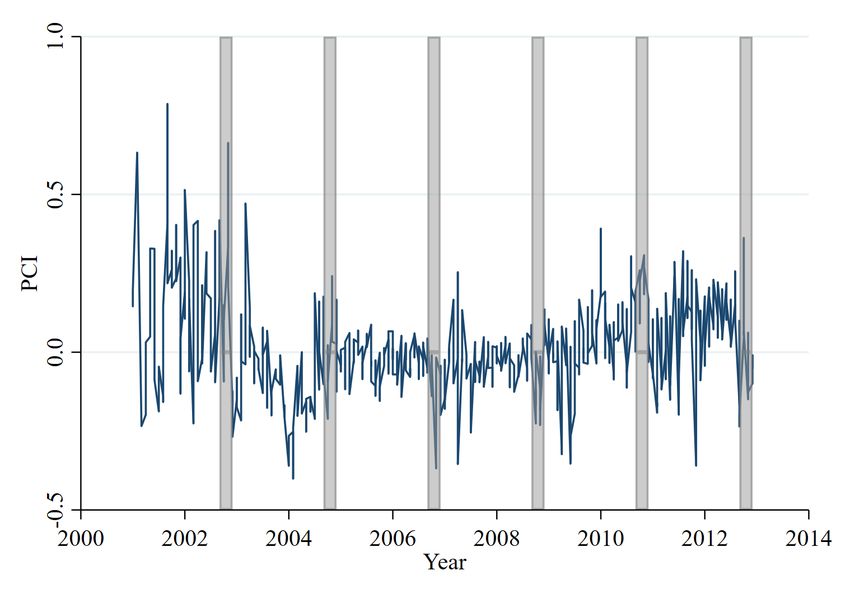
between the two values, with consisting of the tonality about the Republicans and
about the Democrats.

 , = ∑ − ∑ (2)
 =1 =1

As per definition of the PCI, positive values indicate a more conservative positioning of the media
outlet, whereas negative values indicate more liberal reporting. In other words, positive values of
the PCI indicate less critical coverage of the Republican Party and negative values less critical
coverage of the Democratic Party.

3.3 Application of the Media Data to the PCI

By applying the media data described in section 3.1 to the PCI ,as defined in section 3.2, the picture
in Figure 3 emerges. The aggregated PCI of all four newscasts varies between -0.40 and +0.79 with
an average standard deviation of 0.15. The index starts with relatively high values but also with
sharp fluctuations around the events of the terrorist attacks in the period after 9/11 and the Iraq
War in 2003. After a dip in 2004, the PCI varies around zero until 2007, when it becomes less
steady.

 Figure 3: Monthly PCI, aggregated for all media with administration

 ∑ =1 − ∑
 =1 . We also conduct our analyses with the weighted PCI, but the results do not show
substantial differences between weighted and unweighted PCI (see Table A1 in the Appendix). Therefore, we continue
to focus on the unweighted PCI in the following sections.

 12
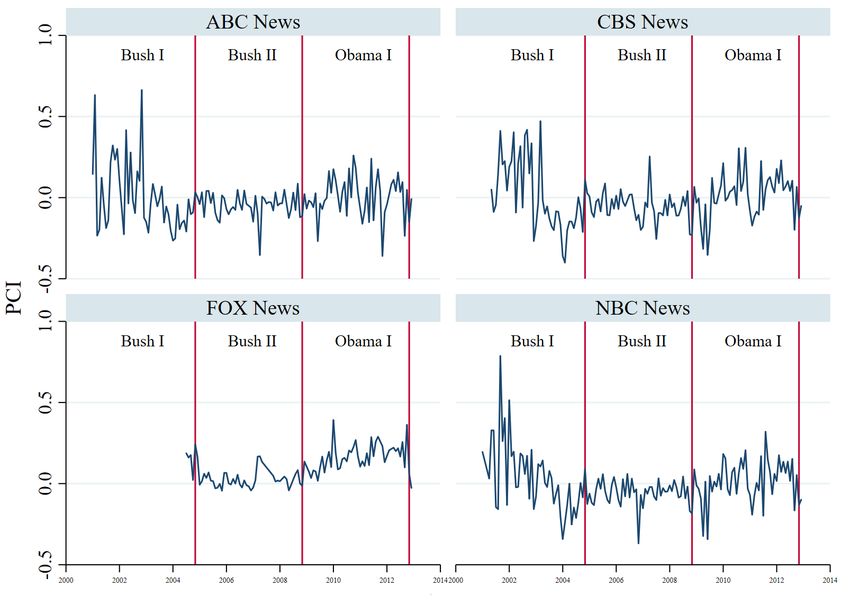
Table 2: Summary statistics for all newscasts: PCI

 Medium Obs Mean Std.Dev. Min Max

 ABC News 143 -0.0126969 0.151564 -0.3595873 0.6633663

 CBS News 140 -0.0093912 0.1596853 -0.4005961 0.4712919

 FOX News 98 0.1016607 0.0982841 -0.0436856 0.3917593

 NBC News 142 -0.0015361 0.1552664 -0.3683450 0.7868421

 Total 523 0.0126467 0.1522971 -0.4005961 0.7868421

By splitting the data between the newscasts, we can see differences in the PCI of certain newscasts
over time (see Figure 4). The vertical lines indicate a new administration.21

 Figure 4: PCI per medium and presidencies

21 Note that for FOX News, the obtained observations only begin in January 2004.
 13
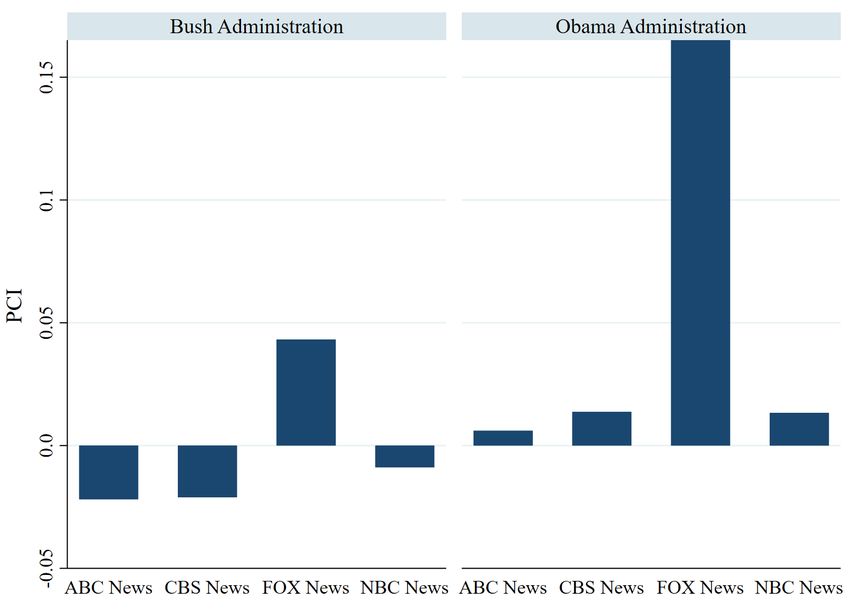
Focusing on the average PCI of each medium during the Bush administration (Figure 5) and during
the Obama administration (Figure 6), one can see interesting differences in the political coverage
of ABC News, CBS News, FOX News, and NBC News.22

During the Obama administration (Figure 6), the PCI shows positive values for all newscasts, thus
indicating that media reporting was more critical to the Democrats in power than to Republicans.
This can be seen as a first hint of reporting that is critical of the government during the Obama
administration. However, the PCI value of FOX News is, at +0.17, far higher than the PCI values of
ABC News, CBS News, and NBC News, which range from 0.006 to 0.01. This shows how conservative
the media reporting of FOX News was during the Obama administration.

 Figure 5: PCI per medium during Bush administration Figure 6: PCI per medium during Obama administration

In contrast, during the Bush administration (Figure 5), the PCI values of ABC News, CBS News, and
NBC News show negative values, indicating that the media reporting was more critical to the
Republicans than on the Democrats. Again, this can be seen as a hint of a government critical
reporting, now during the Bush administration. However, the PCI values of ABC News, CBS News,

22 For the aggregated PCI for each medium over the whole timespan see Figure A1 in the Appendix.
 14
and NBC News during the Bush administration are, from -0.02 to -0.01, much more negative than
their positive values during the Obama administration, from +0.006 to +0.1. This can be seen as
a hint of the generally republican-critical political positionings of ABC News, CBS News, and NBC
News. The political reporting of FOX News during the Bush administration clearly presents a
different picture. In contrast to ABC News, CBS News, and NBC News, during the Bush
administration the PCI values of FOX News are still positive, thus indicating that FOX News was still
reporting more critically on Democrats even when Republicans were in power. The FOX News PCI
value is, at +0.04, somewhat smaller than it was during the Obama administration, at +0.17.
However, it is still more positive than the PCI values for ABC News, CBS News, and NBC News are
negative.

Of course, this simple chart inspection can only provide first hints on systematic differences in the
media reporting of the newscasts analyzed and is not a substitute for a robust empirical analysis,
which we provide in section 4.

4. Do the Big Four serve as 4th Estate?

In this section, we investigate the role of the media as the fourth estate by estimating the effect of
the presidencies on the political positioning of the media as measured by the Political Coverage
Index for each of the four different newscasts in our sample. Expressed in a simple way, we analyze
econometrically the obtained PCI values of ABC, CBS, FOX, and NBC during the Republican
presidency of George W. Bush and during the Democratic presidency of Barak Obama. If we find
robust empirical evidence that media coverage is more critical toward the ruling party, we can
confirm the hypothesis that the media serves as an additional level of control for government, thus
it is the fourth estate. In section 4.2.1, the results for the entire media set are presented, in section
4.2.2, a more in-depth analysis of each respective newscast in our media dataset.

4.1 Empirical Strategy

4.1.1 Econometric Set Up
To analyze the role of ABC News, CBS News, FOX News, and NBC News in the US democracy
econometrically, we first conduct a basic Ordinary Least Squares (OLS) regression to estimate a
model explaining PCI as the dependent variable. We include a dummy variable Democrat, which
represents the presidential incumbent: taking the value of 1 during the Democratic presidency of
Obama and 0 during the Republican presidency of Bush.

In addition, to capture at least a part of the factual performance of the government, which is likely
to be a major driver of the political media coverage and the PCI as well, we add several economic
 15
and geopolitical controls. Specifically, we add monthly variables for the seasonally adjusted
unemployment rate (Unemployment), the consumer price index (CPI), which accounts for all items
in the United States with base year 2015, and business tendency surveys for manufacturing as a
confidence indicator (Business). In addition, we add the geopolitical risk index (GPR) to our
regressions, which reflects the occurrence of military tensions, terrorist attacks, or similar threats
worldwide to account for the role and the self-understanding of the United States as a global
superpower.

The regression is then specified as follows: For every media newscast , the is described at
time , as

 , = 0 + 1 + 1 + 2 + 3 + 4 (4)
 + ,

where t is a dummy variable indicating that a Democrat is the sitting president of the
United States of America at time , the coefficients and are to be estimated, and represents
the error term. In order to account for the panel structure of our data, in a next step, we add both
media fixed effects as well as month fixed effects to our regression to control for unobserved
structural differences between the media as well as for seasonal variations in media coverage.
Thus, the regression equation is expanded to the following:

 , = + + 0 + 1 + 1 + 2 + 3
 (5)
 + 4 + ,

where and denote media and month fixed effects, respectively.

4.1.2 Identification Strategy
We are aware that conducing this kind of panel regression with media and time fixed effects can
still raise legitimate endogeneity concerns for several reasons: First, it cannot be excluded that
the presidency not only affects the political positioning of the media measured by the PCI, but that
their political coverage affects the outcome of elections and, thus president in office. For instance,
DellaVinga and Kaplan (2007), Dewenter et al. (2019), and Enikolopov et al. (2011) provide
empirical evidence regarding the impact of media reporting on election outcomes and voting
intentions. If this is the case, the coefficients in our regression would be biased due to reverse
causality. Secondly, although the macroeconomic factors of unemployment rates, the consumer
price index, business confidence, and geopolitical risks are controlled for, we cannot fully account
for the performance of the government. Therefore, we are unable to determine if the PCI values
are really driven by the party affiliation of the incumbent or by the performance of the government
apart from the “performance indicators” controlled for. If the latter would drive the dependent
 16
PCI as well as the explanatory dummy variable Democrat, which indicates who is in office, this
would cause biased coefficients due to omitted variables.

To account for the possible endogeneity issues mentioned, we split our sample into different
subsamples, consisting of periods with and without elections. In order to do so, we create
timespans ranging from four months before the election date up to one month after the election.
The intuition behind this approach is, first, that in the four months before the election and, thus,
during the campaign, media reporting affects election outcomes, as shown by DellaVinga and
Kaplan (2007), Dewenter et al. (2019), and Enikolopov et al. (2011). Specifically, during this time,
the coefficients could be biased due to both reverse causality and omitted variable bias, as
discussed above. In addition, in the weeks directly after an election another effect could lead to
biased results. In the initial weeks following the November presidential election, there is
somehow an intermediate period before the elector’s election, which takes place on the first
Monday after December 12th. During this period, political coverage is often dominated by
reporting on electoral success and the new president, who is not even elected by the electors; this
coverage of the presidential-elect tends to be positive, with minimal criticism levelled, something
standing in stark contrast to subsequent coverage during the subsequent presidential term. 23

Hence, in our analysis, we focus on time spans other than periods from four months before the
election to one month after it. Thus, in our sample, elections and election outcomes are purely
exogenous event (or at least less prone to endogeneity). Hence, the endogeneity issue of reverse
causality of the PCI on the incumbent dummy Democrat can be ruled out. In addition, the
endogeneity issue that both the dependent PCI and the explanatory Democrat are driven by the
performance of the government apart from the “performance indicators” controlled for can also
be ruled out, as in this period Democrat is given and purely exogenous. This assumption would
not hold if the presidency could end early, with snap elections, a feature that is, in contrast to many
other democracies, constitutionally not possible in the US. Table 3shows all relevant election dates
for our dataset.

23We also test variations of the timespans. For example, we test four months before and four months after an election,
respectively, and obtain similar results. As the inauguration takes place in January, we expect media reporting to be less
influenced by electoral success by then and to have returned to critical coverage. Furthermore, we test for three months
before and one month after an election. However, the results show weaker coefficients, hinting at biased results due to
reverse causality and omitted variable problems in the fourth month before the election (see Table 4 in comparison to
Table A1 in the Appendix).
 17
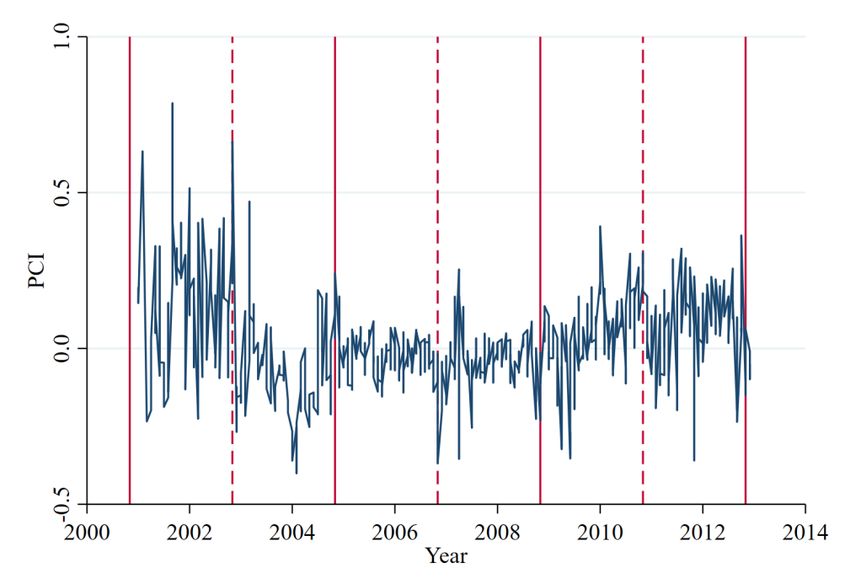
Table 3: Election dates

 President Election Inauguration Midterm Elections End of Term

 I G.W. Bush 7 November 2000 20 January 2001 5 November 2002 20 January 2005
 II G.W. Bush 2 November 2004 20 January 2005 7 November 2006 20 January 2009
 I Obama 4 November 2008 20 January 2009 2 November 2010 20 January 2013
 II Obama 6 November 2012 20 January 2013 4 November 2014 20 January 2017

Presidential elections take place every four years in November; this election includes all 435
members of the US House of Representatives and one-third of all seats in the US Senate. Midterm
elections are held after two years of a president’s term in office, determining all 435 seats in the
US House of Representatives as well as one-third of all seats in the US Senate. In our sample, which
runs from the beginning of 2001 through the end of 2012, we have data covering three
presidential elections and three midterm elections, as shown in Figure 7. For President George W.
Bush, the outcome of the 2002 midterm elections, during his first term, generally favored his own
party, the Republicans. However, four years later the Democratic Party won a majority of the seats
in Congress, resulting in a loss for the governing party. The same pattern in midterm elections
occurred during the presidency of Barack Obama in 2010 and 2014, respectively.

 Figure 7: Presidential elections and midterm elections

 Presidential elections are indicated by solid vertical lines; midterm elections by dashed lines.

 18
4.2 Empirical Results

4.2.1 Average Results on the Big Four
Six different specifications of our empirical investigation on the entire media set are presented in
Table 4. Specifications OLS I to OLS III are OLS models, FE I to FE III are the two-way fixed effect
regressions. All models estimate the political positioning of the Big Four measured by the PCI as
the dependent variable and the incumbent dummy ( ) as main explanatory variable.
When the latter is reversed to a Republican presidency, we observe the expected reverted results
in our time span analyzed.

 Table 4: Impact of the party affiliation of the president on the political positioning of the Big Four
 (all media, elections periods: 4/1 months before/after an election)
Dependent OLS I OLS II OLS III FE I FE II FE III
variable:

PCI
 Full sample Presidential Presidential & Full sample Presidential Presidential &
Sample elections midterm elections midterm
 periods elections Periods elections
 excluded periods excluded periods
 excluded excluded

Democrat 0.157*** 0.214*** 0.237*** 0.175*** 0.240*** 0.265***
 (0.0459) (0.0575) (0.0587) (0.0446) (0.0544) (0.0551)

Consumer Price -0.00364** -0.00396* -0.00317 -0.00546*** -0.00586*** -0.00511**
Index (CPI) (0.00184) (0.00204) (0.00209) (0.00183) (0.00205) (0.00209)

Unemployment -0.00914 -0.0202* -0.0321*** -0.0111 -0.0241** -0.0365***
 (0.00927) (0.0114) (0.0120) (0.00894) (0.0108) (0.0113)

Business -0.0144** -0.0154** -0.0178** -0.0149** -0.0149** -0.0174**
 (0.00668) (0.00752) (0.00748) (0.00633) (0.00707) (0.00717)

GPR 0.000455*** 0.000483*** 0.000450*** 0.000505*** 0.000523*** 0.000509***
 (0.000157) (0.000159) (0.000170) (0.000154) (0.000154) (0.000169)
Constant 1.728** 1.905** 2.143** 1.918** 2.021** 2.291***
 (0.781) (0.847) (0.849) (0.745) (0.801) (0.817)

Observations 523 451 386 523 451 386
R-squared 0.108 0.123 0.119 0.228 0.239 0.233
Month FE No No No Yes Yes Yes
Media FE No No No Yes Yes Yes
 Robust standard errors in parentheses
 *** p
The coefficient for a Democratic presidency (Democrat) is positive and highly significant for every
specification. This indicates that media reporting during Democratic presidencies is generally
associated with higher PCI values, which can be interpreted as more conservative news coverage.
When removing the time span around presidential elections from our sample, this effect
intensifies, leading to even more conservative reporting. When excluding all election periods, the
effect of the president’s party affiliation on the political positioning of the Big Four, as measured
by the PCI, is even stronger. This can be seen as an indication that, around elections, the
coefficients are biased due to the aforementioned endogeneity problems. In addition, the results
suggest that critical media coverage accompanies the incumbent president, which hints at the
media fulfilling their role as the fourth estate. Both the CPI and the business tendency indicator
(Business) have, in nearly all specifications (despite the CPI in OLS III), a significant and slightly
negative influence on the PCI, suggesting that higher consumer prices or higher business
confidence are connected with more conservative reporting. The coefficient for the
unemployment rate is insignificant in specifications OLS I and FE I, which is, at least partly,
explained by the high correlation between the macroeconomic variables. This could potentially
hint at multicollinearity, but the test with variance inflation factors indicates that the degree of
collinearity is still tolerable. The coefficient for the geopolitical risk index is highly significant and
positively associated with the PCI, indicating that, in times with high geopolitical risk, media
reporting tends to be less critical of Republicans than of Democrats in comparison to times with
lower geopolitical risk. This is in line with the intuition.24

In addition, we add both month and media dummies in the fixed effects regressions FE I to FE III.
The month dummies are insignificant without exception, whereas the media dummies are
significant and differ between the newscasts: ABC News, CBS News, and NBC News are associated
with a lower PCI and, thus, more liberal reporting, where FOX News positively affects the PCI,
suggesting more conservative political coverage. We also test the inclusion of dummies for the
party holding the majority in the House of Representatives, which can change after every Federal
election. As the effect on the PCI is unclear and could go in either direction, we drop this variable
from further consideration.

Moreover, we verified our identification strategy by estimating the models with different time
spans, testing the effect on the PCI. By switching the included months from actual election periods
to non-election times, we can observe a statistically lower significance and a smaller impact of the
presidential dummy on our dependent variable. Thus, we conclude that, in our setting, elections

24See Table A2 in the appendix for regression results using the weighted PCI, which are quantitatively identical to the
results of regression using the unweighted index.
 20
can be seen as an exogenous event with which we can identify the impact of the party affiliation
of the president on the political positioning of the Big Four.

To check if our results are robust to variations in campaign timings, we also varied the number of
months before and after an election when campaigns are supposed to happen. Overall, the results
are quite stable independent of this variation.25

Although our sample is limited and, thus, the number of observations strongly reduced, we also
investigate the effects during the election campaign periods in separate regressions (see Table 5).
Analyzing the full sample of TV newscasts, the incumbent dummy (Democrat) turns insignificant
in three of four regressions. Only OLS I shows significant results; however, the coefficient is now
negative. This can be seen as an empirical hint of less critical media reporting on the upcoming
president during the election campaign. During the campaign, it can become increasingly clear
that one candidate has a good chance to become/remain president, which can result in more
positive (less critical) reporting on the candidate who is perceived to be likely to win the election.
We interpret these results as some evidence for our assumption that the incumbent dummy and
the PCI are differently linked to each other during election campaigns for several endogeneity
problems, which supports our identification strategy to drop election campaigns from our sample.

25 See Table A1 in the appendix for regression results using election campaign periods of three months before an
election and a honeymoon period of one month. Using the full sample (FE I), the results are similar to those from Table
4. However, on average, the effect of the party affiliation of the running president on the PCI seems to be weaker when
assuming that election campaigns are three months long.
 21
Table 5: Impact of the party affiliation of the president on the political positioning of the Big Four
 (all media, elections periods: 4/1 months before/after an election)

 Dependent variable: OLS I OLS II FE I FE II

 PCI
 Sample Presidential Presidential & Presidential Presidential &
 election periods midterm election midterm
 only election periods only election periods
 periods only only

 Democrat -0.708** -0.00621 -0.666 0.0494
 (0.303) (0.0947) (0.479) (0.0927)

 Consumer Price Index (CPI) 0.00582 -0.00562 0.00437 -0.00958*
 (0.00635) (0.00562) (0.00951) (0.00573)

 Unemployment 0.316*** 0.0543*** 0.302 0.0509***
 (0.117) (0.0151) (0.192) (0.0143)

 Business 0.135** 0.0102 0.127 -0.00211
 (0.0527) (0.0164) (0.0857) (0.0168)

 GPR -0.000982 0.000592* -0.00112 0.000565
 (0.00106) (0.000316) (0.000904) (0.000352)

 Constant -15.70** -0.909 -14.76 0.650
 (6.188) (2.069) (10.35) (2.146)

 Observations 60 114 60 114
 R-squared 0.112 0.256 0.435 0.410
 Month FE No No Yes Yes
 Media FE No No Yes Yes
 Robust standard errors in parentheses, *** p
4.2.2 Detailed Results on ABC, CBS, FOX, and NBC News
This section provides a more in-depth analysis of each single newscast in our media set to
determine if ABC News, CBS News, FOX News, and NBC News serve as a fourth estate or not.

For CBS News, coefficients indicating the impact of presidential party affiliation on political
positioning are positive and statistically significant in all specifications (see Table 6, FE I - III). This
shows that CBS News reports are more conservative if a Democrat is in office and vice versa. This
government-critical reporting by CBS News is stronger than the average government-critical
reporting of the Big Four (see Table 4). Dropping election campaign windows with respect to
presidential and midterm elections from our sample (see Table 6, FE III), the incumbent dummy
shows, with a coefficient of 0.313, the strongest effect of presidential party affiliation on the
political positioning of CBS News. This can be seen as an indicator that, during election campaigns,
the results are biased due to the several aforementioned endogeneity problems. In specification
FE III, two additional coefficients are significant. A higher unemployment rate is connected with
more liberal reporting by CBS News, whereas high geopolitical risk is connected to more
conservative reporting. This follows intuition. As the results show robust empirical evidence on
government-critical reporting by CBS News, we conclude that CBS News did serve as fourth estate,
at least during our sample period.

Results for NBC News draw a similar picture. The coefficients indicating the impact of presidential
party affiliation on political positioning are positive and statistically significant in all specifications
(see Table 6, FE IV - VI). This suggests that NBC News reports are more conservative when a
Democrat is in office and vice versa. Dropping election campaign times with respect to
presidential and midterm elections from our sample due to endogeneity problems, the incumbent
dummy shows, with a coefficient of 0.327, the strongest effect of presidential party affiliation on
the political positioning of NBC News (see Table 6, FE VI). Thus, NBC News appears to be even more
government-critical than CBS News. In specification FE VI, three more coefficients are significant.
A higher consumer price index connects with more liberal reporting by NBC News. However, this
coefficient is only significant at the 10 percent level. Additionally, a higher unemployment rate is
connected with a more liberal reporting by NBC News, while periods of high geopolitical risk are
connected with more conservative reporting. Again, this follows the intuition. As the results show
robust empirical evidence of government-critical reporting by NBC News, we conclude that NBC
News did serve as fourth estate, at least during our sample period.

 23
Table 6: Impact of the party affiliation of the president on the political positioning of CBS News & NBC News
 (election periods: 4/1 months before/after an election)

Dependent FE I FE II FE III FE IV FE V FE VI
variable: CBS News CBS News CBS News NBC News NBC News NBC News
PCI
Sample Full sample Presidential Presidential & Full sample Presidential Presidential &
 elections midterm elections midterm
 periods elections Periods elections
 excluded periods excluded periods
 excluded excluded

Democrat 0.195** 0.283*** 0.313*** 0.220** 0.295*** 0.327***
 (0.0879) (0.103) (0.106) (0.0935) (0.111) (0.113)

Consumer Price -0.00401 -0.00477 -0.00399 -0.00722** -0.00781** -0.00713*
Index (CPI)
 (0.00319) (0.00353) (0.00376) (0.00334) (0.00366) (0.00376)

Unemployment -0.0193 -0.0370* -0.0524** -0.0216 -0.0372* -0.0516**
 (0.0182) (0.0212) (0.0221) (0.0188) (0.0223) (0.0235)

Business -0.0105 -0.00944 -0.0138 -0.0254* -0.0227 -0.0257
 (0.0132) (0.0158) (0.0162) (0.0136) (0.0154) (0.0156)

GPR 0.000745*** 0.000772*** 0.000683** 0.000509** 0.000538** 0.000616**
 (0.000260) (0.000266) (0.000285) (0.000212) (0.000213) (0.000254)

Constant 1.365 1.418 1.889 3.192** 3.046* 3.367**
 (1.426) (1.638) (1.699) (1.550) (1.678) (1.688)

Observations 140 122 104 142 124 106
R-squared 0.237 0.281 0.232 0.205 0.229 0.253
Month FE Yes Yes Yes Yes Yes Yes
 Robust standard errors in parentheses, *** p
You can also read