Structure-based machine-guided mapping of amyloid sequence space reveals uncharted sequence clusters with higher solubilities - Nature
←
→
Page content transcription
If your browser does not render page correctly, please read the page content below
ARTICLE
                  https://doi.org/10.1038/s41467-020-17207-3                 OPEN

                  Structure-based machine-guided mapping of
                  amyloid sequence space reveals uncharted
                  sequence clusters with higher solubilities
                  Nikolaos Louros1,2, Gabriele Orlando1,2, Matthias De Vleeschouwer1,2, Frederic Rousseau                                    1,2 ✉   &
                  Joost Schymkowitz 1,2 ✉
1234567890():,;

                  The amyloid conformation can be adopted by a variety of sequences, but the precise
                  boundaries of amyloid sequence space are still unclear. The currently charted amyloid
                  sequence space is strongly biased towards hydrophobic, beta-sheet prone sequences that
                  form the core of globular proteins and by Q/N/Y rich yeast prions. Here, we took advantage
                  of the increasing amount of high-resolution structural information on amyloid cores currently
                  available in the protein databank to implement a machine learning approach, named Cordax
                  (https://cordax.switchlab.org), that explores amyloid sequence beyond its current bound-
                  aries. Clustering by t-Distributed Stochastic Neighbour Embedding (t-SNE) shows how our
                  approach resulted in an expansion away from hydrophobic amyloid sequences towards
                  clusters of lower aliphatic content and higher charge, or regions of helical and disordered
                  propensities. These clusters uncouple amyloid propensity from solubility representing
                  sequence flavours compatible with surface-exposed patches in globular proteins, functional
                  amyloids or sequences associated to liquid-liquid phase transitions.

                  1 Switch Laboratory, VIB Center for Brain and Disease Research, Herestraat 49, 3000 Leuven, Belgium. 2 Switch Laboratory, Department of Cellular and

                  Molecular Medicine, KU Leuven, Herestraat 49, 3000 Leuven, Belgium. ✉email: Frederic.Rousseau@kuleuven.vib.be; Joost.Schymkowitz@kuleuven.vib.be

                  NATURE COMMUNICATIONS | (2020)11:3314 | https://doi.org/10.1038/s41467-020-17207-3 | www.nature.com/naturecommunications                           1
ARTICLE                                                                 NATURE COMMUNICATIONS | https://doi.org/10.1038/s41467-020-17207-3

T
        he amyloid cross-β state is a polypeptide conformation that          identified less hydrophobic polar and charged aggregation prone
        is adopted by 36 proteins or peptides associated to human            sequences that increasingly uncouple solubility and amyloid
        protein deposition pathologies1. It also constitutes the             propensity, closely resembling characteristics of phase-separation
structural core of a growing number of functional amyloids in                inducers. Clustering by t-distributed stochastic neighbour
both bacteria and eukaryotes2,3. Beyond these bona fide func-                 embedding reveals the heterogeneous substructure of amyloid
tional and pathological amyloids it has been demonstrated that               sequence space consisting in varying clusters corresponding to
many if not most proteins can adopt an amyloid-like con-                     sequences compatible with globular structure, functional scaf-
formation upon unfolding/misfolding4. This has led to the notion             folding amyloids, N/Q/Y-rich prions, helical peptides and
that just like the α-helix or β-sheet, the amyloid state is a generic        intrinsically disordered sequences. Together, the structural
polypeptide backbone conformation but also that amino acids                  exploration performed here demonstrates that the field now
have different propensities to adopt the amyloid conformation5.              gathered sufficient structural and sequence information to start
Initially, it was observed that amyloid-like aggregation correlates          classifying amyloids according to different structural and func-
with hydrophobicity, β-strand propensity, and (lack of) net                  tional niches. Just like for globular proteins in the 1980s, this will
charge6. This triggered the development of aggregation prediction            allow to fine-tune both general and context-dependent structural
algorithms that essentially evaluate the above biophysical                   rule learning allowing to manipulate and design amyloid struc-
propensities7,8. Others extended to scaling residue propensities             ture and function.
between protein folding and aggregation9,10. These algorithms
confirmed the ubiquity of amyloid-like propensity in natural
                                                                             Results
protein sequences and particularly in globular proteins as it was
                                                                             Overall approach of Cordax. We wanted to design a novel
estimated that 15–20% of residues in a typical globular domain
                                                                             structure-based amyloid core sequence prediction method that
are within aggregation-prone regions (APRs)11,12. These APRs
                                                                             (a) leverages all the available structure information that is cur-
are sequence segments of six to seven amino acids in length on
                                                                             rently available, and (b) employs a machine-learning element for
average and are mostly buried within the protein structure where
                                                                             optimal prediction performance. To this end, we first built a
they constitute the hydrophobic core stabilising tertiary protein
                                                                             curated template library of amyloid core structures as described
structure13–15. On the other hand, the increasing identification of
                                                                             in the paragraph below. In the vein of previous prediction
both yeast prions and functional amyloids clearly indicated that
                                                                             methods29, we fixed on the hexapeptide as a unit of prediction. In
amyloid sequence space is not monolithic and that more polar/
                                                                             order to determine the amyloid propensity of a query hexapeptide
less aliphatic sequences represent important alternative popula-
                                                                             we start by modelling its side chains on all the available amyloid
tions of amyloid sequence space3. The limited sensitivity of the
                                                                             template structures using the FoldX force field30, which yields a
above cited algorithms to specifically identify these other sub-
                                                                             model and an associated free energy estimate (ΔG, kcal/mol) for
populations confirmed the underestimated sequence versatility of
                                                                             each template. These free energies are then fed into a logistic
the amyloid conformation. Indeed, more recently the role of
                                                                             regression model, which is a simple statistical method relating a
amyloid-like sequences in proteins mediating liquid–liquid phase
                                                                             binary outcome to continuous variables. The prediction output of
transitions again demonstrates the ubiquity of the amyloid in
                                                                             Cordax is multiple: First, there is the prediction from the logistic
biological function and further withers the image of the amyloid
                                                                             regression whether or not the segment is an amyloid core
state as a predominantly disease and/or toxicity-associated pro-
                                                                             sequence. Second, for the sequences deemed amyloid core, the
tein conformation16–18. Rather, this suggests that like globular
                                                                             most likely amyloid core model is provided. For longer query
protein folding, amyloid assembly is a matter of kinetic and
                                                                             sequences, a sliding window approach is adopted. The technical
thermodynamic control that can be evolutionary tuned by
                                                                             details of the pipeline can be found in the “Methods” section.
sequence variation and selection.
   Efforts to develop aggregation predictors that can identify a
broader spectrum of amyloid sequences have increased over the                Refinement of fibril structures for machine learning. We iso-
years19. Such approaches focused on identifying position-specific             lated 78 short segment fibril core high-resolution structures from
patterns by reference to accumulated experimental data of                    the Protein Data Bank (Supplementary Data 1). Templates were
APRs20–22, or by using energy functions of cross-beta pairings23.            grouped into seven distinct topological classes out of eight the-
Recently developed meta-predictors produce consensus outputs                 oretically possible based on their overall structural properties, as
by combining previous methods, in an attempt to boost                        previously proposed by Sawaya et al.31. Briefly, topologies are
performance24,25. Indirect structure-based methods were initially            defined by whether β-sheets have parallel versus antiparallel
developed by considering secondary structure propensities26,27.              orientation, by the orientation of the strand faces that form the
Complementary studies extended this notion by suggesting that                steric zipper (face-to-face versus face-to-back), and finally the
disease-related amyloids form β-strand-loop-β-strand motifs28.               orientation of both sheets towards each other and whether that
However, the principle of using structural information to accu-              results in identical or different fibril edges. This complexity was
rately predict aggregation prone segments in protein sequences               addressed by generating an ensemble of amyloid cores per
stems from the detailed work of Eisenberg and co-workers. The                structure using crystal contact information derived from the
3D-profiling method utilised the crystal structure of the fibril-              solved structures. Every template comprises two facing β-sheets,
forming segment NNQQNY (PDB ID: 1YJO) derived from the                       each composed of five successive β-strands. Since parallel archi-
Sup35 prion protein, to thread and evaluate sequence fitting using            tectures can share more than one homotypic packing interface,
the Rosetta energy function29. In this work, we build on this                those structures were split into separate individual entries (Fig. 1).
principle to develop Cordax, an exhaustively trained regression              To ensure uniformity, we expanded the number of structural
model that leverages a substantial library of curated template               variants by breaking down longer segments into hexapeptide
structures combined with machine learning. Cordax not only                   constituents, thus yielding a library of 179 peptide fragment
detects APRs in proteins, but also predicts the structural topology,         structures (Fig. 1 and Supplementary Data 1).
orientation and overall architecture of the resulting putative fibril            The amyloid interaction interfaces were analysed in detail
core. To validate the accuracy of our predictions, we designed a             following energy refinement by the FoldX force field30. During
screen of 96 newly predicted APRs and experimentally deter-                  this step we identified and rejected 33 imperfect β-packing
mined their aggregation properties. Using this approach, we                  interfaces formed by β-strands that contribute less than three

2                NATURE COMMUNICATIONS | (2020)11:3314 | https://doi.org/10.1038/s41467-020-17207-3 | www.nature.com/naturecommunications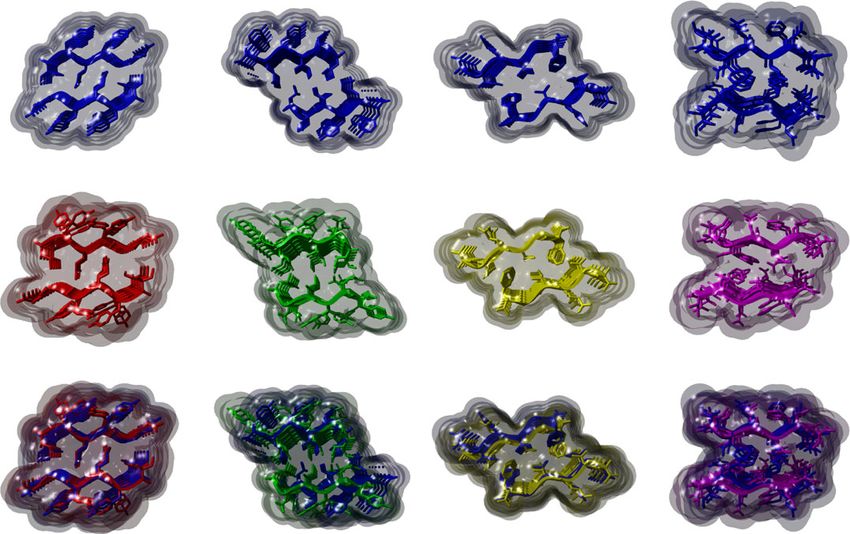
NATURE COMMUNICATIONS | https://doi.org/10.1038/s41467-020-17207-3 ARTICLE
Interface fragmentation
1
90° 90°
Interface a Interface b
2
Hexapeptide fragmentation
Fragment a_1 Fragment a_2 Fragment b_1 Fragment b_2
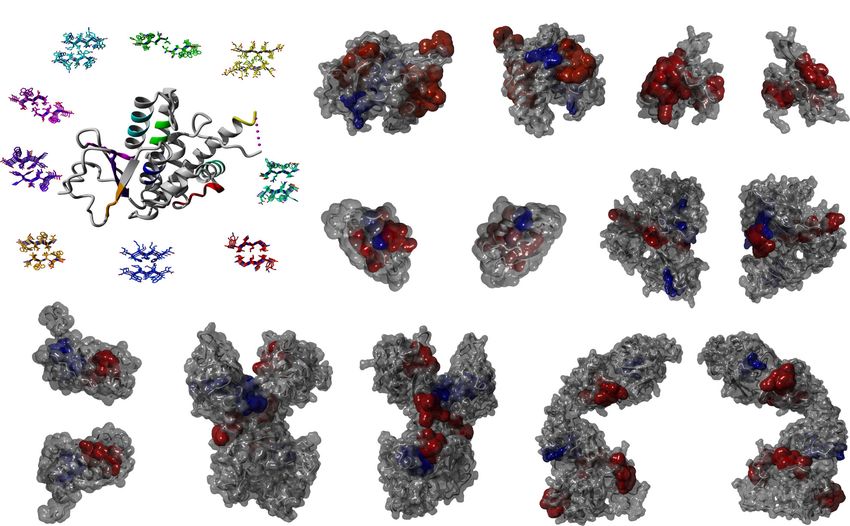
Fig. 1 Processing steps of the peptide fragment library. a Crystal contact information was used to generate fibril cores from isolated PDB structures.
Structures containing multiple packing interfaces were split into individual templates (1), which were in turn split into hexapeptide core fragments (2).
Source data are provided as a Source Data file.
interacting residues, thus reducing the ensemble to 146 structures characteristic (ROC) analysis33. The ROC curves generated
(Supplementary Data 1). Detailed analysis of the contributions of highlight that Cordax performance exceeds over seven state-of-
various energy components showed that these excluded β- the-art methods, which we applied using optimised options
packing interfaces have inefficient shape complementarity and defined by the developers7,9,21–24,34. In detail, Cordax performs
low overall stability, stemming from a combination of weak well over random as depicted by the highest total area under the
electrostatic contributions, diminished van der Waals interactions curve (AUC) value of 0.87 (Fig. 3a). Distribution analysis of the
and exposure of hydrophobic residues to the solvent (Fig. 2a). scoring values indicates that the method achieves optimal
Previous work has highlighted that distinct topological layouts separation, resulting in minimal scoring overlay between positive
can potentially introduce a stronger tolerance for the integration and negative amyloid forming sequences (Fig. 3b). As previously
of protein sequence segments and as a result can generate several reported, TANGO showed high specificity due to the over-
potential type-I errors (false positives)29. To address this issue, we representation of unscored values, which is also evident for
implemented a two-step cross-threading exploration of putative WALTZ as well as MetAmyl, which incorporates the latter
structural promiscuous traps. In more detail, we extracted a non- method in its meta-prediction. The cost of high specificity is also
redundant set of hexapeptide sequences from the structural reflected by the calculated F1 values, as PASTA and TANGO
library (73 sequences), which was subsequently cross-modelled in report low recall values. On the other hand, AGGRESCAN and
an all-against-all reiteration process. Using an empirical cut-off GAP produce significant overpredictions as depicted by their
threshold (=5), a sum of three structural fragments was initially reported false-positive rates (FPR values of 0.54 and 0.76,
identified and removed. Eliminating these structures led to the respectively) (Fig. 3c). The optimal score thresholding of our
identification and subsequent elimination of three additional method was determined from the ROC curve analysis as the score
promiscuous templates, resulting in the final Cordax library, where predictions show the highest sensitivity-to-specificity ratio.
composed of 140 zipper structures (Fig. 2b and c). According to this, Cordax achieves a well-balanced prediction by
reporting with high specificity (86%) more than 7 out of 10
Benchmarking aggregation propensity detection with Cordax. aggregation prone segments (72%), which is reflected by the
As an initial test of the prediction accuracy of the regression highest calculated MCC, AUC and F1 values compared to other
model, we performed leave-one-out cross-validation on the available software (Fig. 3c).
training dataset32 and performance metrics were determined on a To further benchmark the method, we tested it against full-
peptide basis. Due to the extensive size of the dataset, comparison length protein sequences. For this we used a standardised set of
to other software was performed only with methods supporting 34 annotated amyloidogenic proteins that was previously
multiple sequence input and a non-binary scoring function, implemented for validation of several previous aggregation
since performances were compared using receiver operating predictors25, following a filtering step for potential overlaps to
NATURE COMMUNICATIONS | (2020)11:3314 | https://doi.org/10.1038/s41467-020-17207-3 | www.nature.com/naturecommunications 3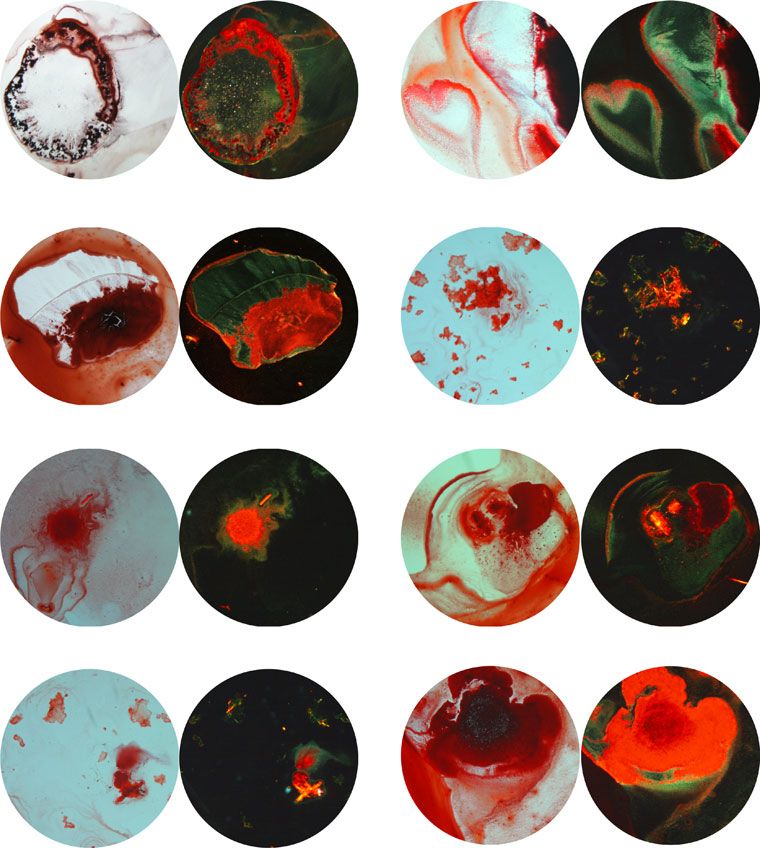
ARTICLE NATURE COMMUNICATIONS | https://doi.org/10.1038/s41467-020-17207-3
a ΔG BackHbonds SideHbonds VdW Electrostatics SolvPolar SolvHphobic
b 1YJO 3FR1 6CFH_3 3FOD 4XFN 4W67_2
Cor : 0.221 Cor : 0.0339 Cor : 0.611 Cor : 0.559 Cor : –0.0299 Cor : 0.697
Accepted: 0.206 Accepted: –0.0205 Accepted: 0.524 Accepted: 0.526 Accepted: 0.158 Accepted: 0.654
ΔG
146 Structures 143 Structures 140 Structures
Rejected: 0.211 Rejected: –0.306 Rejected: 0.791 Rejected: 0.365 Rejected: –0.538 Rejected: 0.806 Starting Filtered CORDAX
library library library
Cor : 0.128 Cor : 0.213 Cor : –0.197 Cor : –0.287 Cor : 0.136
BackHbonds
Accepted: 0.132 Accepted: 0.173 Accepted: –0.248 Accepted: –0.219 Accepted: 0.11 1st Cross-thread step 2nd Cross-thread step
Rejected: 0.0738 Rejected: 0.215 Rejected: –0.342 Rejected: –0.516 Rejected: 0.101
15 1yjo 15 15
Cor : 0.365 Cor : 0.0391 Cor : –0.549 Cor : –0.0231
10 6cfh_3 10 10
SideHbonds
Accepted: 0.385 Accepted: –0.0142 Accepted: –0.56 Accepted: –0.0886
5 5 5
Selection counts
Selection counts
Selection counts
Rejected: –0.145 Rejected: –0.0855 Rejected: 0.0135 Rejected: –0.223 4xfn
3fr1 4w67_2 3fod
0 0 0
Cor : 0.22 Cor : –0.677 Cor : 0.901
VdW
Accepted: 0.151 Accepted: –0.595 Accepted: 0.859
Rejected: –0.0543 Rejected: –0.879 Rejected: 0.982
Cor : –0.0129 Cor : 0.217
Electrostatics
Accepted: 0.0724 Accepted: 0.169 PDB Code PDB Code PDB Code
Rejected: 0.31 Rejected: –0.0201
WALTZ-DB 2.0 1 DATABASE OF AMYLOID
Cor : –0.416 c FORMING PEPTIDES
Sequence
input
SolvPolar
Accepted: –0.263
1402 Sequences
Rejected: –0.804
CORDAX
library
Topology model
196.280 Regression
SolvHphobic
ΔG Energies model
Training data
140 Structures
Amyloid scoring
Fig. 2 Optimising the Cordax structural library. a Correlation plot of interface energies calculated using FoldX. Top half shows correlation values with
scatter plots indicated at the bottom half. Rejected fragments sharing low shape complementarity (shown in yellow) have correlating weak van der Waals
interfaces, as well as poor solvation energies for hydrophobic side chains compared to the remaining library (indicated in purple). Linear regression lines
are shown with 95% confidence interval (shown in grey shaded areas). b Promiscuity sorting of the structural library performed as a two-step cross-
threading process. Circular histograms highlight three major promiscuous structures (n > 5) which were removed during the primary (PDB ID: 1YJO, 3FR1
and 6CFH_3) and secondary step (PDB ID: 3FOD, 4XFN and 4W67_2). c Schematic representation of Cordax training and the derived pipeline.
a b 1.00
1.0 1 5
PASTA 2.0 energy
0.75
CORDAX score
0
0.50
0.25 –5
0.8 0.8
0.00
Amyloid Non-Amyloid 0.0 0.5 1.0 1.5 2.0 2.5 Amyloid Non-Amyloid 0.00 0.05 0.10 0.15 0.20
Classification Density Classification Density
Average true positive rate
0.6 0.6 600
CORDAX cutoffs
n
tio
400
ic
ed
WALTZ score
pr
TANGO score
400 300
m
do
an
200
R
200
0.4 AUC = 0.87 0.4
100
CORDAX 0 0
WALTZ
PASTA 2.0 Amyloid Non-Amyloid 0.00 0.25 0.50 0.75 1.00 Amyloid Non-Amyloid 0.00 0.25 0.50 0.75 1.00
AGGRESCAN Classification Scaled density Classification Scaled density
MetAmyl
TANGO
0.2 GAP 0.2
MILAMP
0.15
MetAmyl (total hot spot area)
100
AGGRESCAN (Na4vSS)
50
0.10
0
0.0 0 –50
0.05
–100
0.0 0.2 0.4 0.6 0.8 1.0
0.00
Average false positive rate –150
Amyloid Non-Amyloid 0.00 0.25 0.50 0.75 1.00 Amyloid Non-Amyloid 0.000 0.005 0.010
Classification Scaled density Classification Density
c CORDAX WALTZ PASTA 2.0 AGGRESCAN MetAmyl TANGO GAP MILAMP
1.00 1.00
Accuracy 0.81 0.67 0.76 0.57 0.79 0.73 0.51 0.73
Precision 0.74 0.54 0.74 0.60 0.72 0.82 0.42 0.66 0.75 0.75
MILAMP score
GAP score
TPR (Recall) 0.72 0.65 0.52 0.85 0.69 0.31 0.94 0.49 0.50
0.50
FPR 0.14 0.33 0.10 0.54 0.15 0.04 0.74 0.14
0.25 0.25
MCC 0.57 0.34 0.46 0.29 0.54 0.38 0.25 0.38
F1 0.73 0.60 0.61 0.71 0.70 0.45 0.58 0.56 0.00 0.00
Amyloid Non-Amyloid 0.00 0.25 0.50 0.75 1.00 Amyloid Non-Amyloid 0.0 0.5 1.0 1.5 2.0
AUC 0.87 0.73 0.84 0.84 0.78 0.64 0.70 0.76 Classification Scaled density Classification Density
Fig. 3 Benchmarking of CORDAX. a ROC curve analysis for Cordax and seven other state-of-art methods against WALTZ-DB 2.0. For WALTZ, TANGO
and MetAmyl, FPR stops at earlier rates due to minimal scoring variations. b Cordax score distribution compared to other tools. The regression model
achieves better scoring separation for predictions between amyloid-forming (shown in blue) and non-amyloid sequences (shown in red). Distributions are
shown as standard box-plots highlighting median, upper (Q3) and lower (Q1) quartiles. Whiskers indicate the ranges for values within 1.5 interquartile
range (IQR) above and below Q3 and Q1, respectively. Density plots for WALTZ, TANGO, MetAmyl and GAP are scaled due to the overrepresentation of
unscored values or false positives, respectively. c Performance metrics comparison indicating Cordax superiority to other sequence predictors (MCC =
0.57, F1 = 0.73 and AUC = 0.87).
4 NATURE COMMUNICATIONS | (2020)11:3314 | https://doi.org/10.1038/s41467-020-17207-3 | www.nature.com/naturecommunications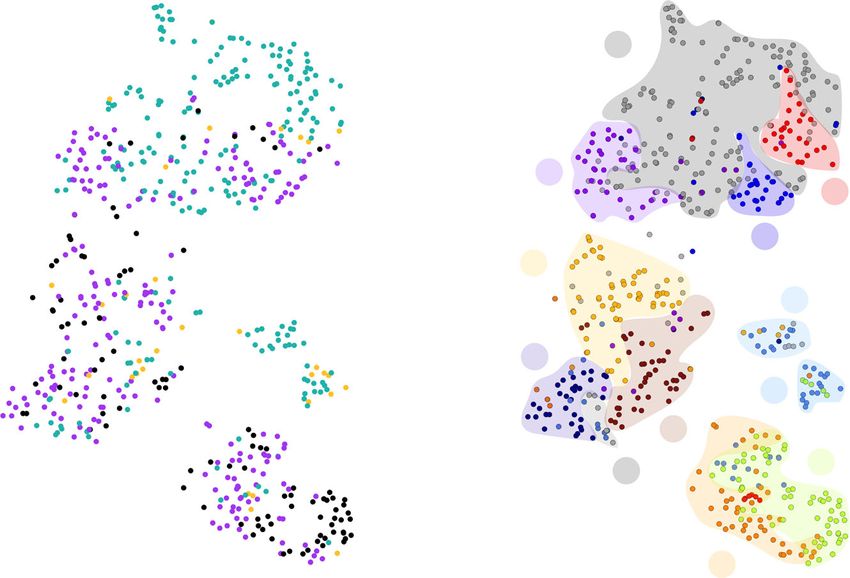
NATURE COMMUNICATIONS | https://doi.org/10.1038/s41467-020-17207-3                                                                    ARTICLE

the training data set. Despite its wide use, this collection suffers            picked up both by Cordax and traditional sequence-based
from insufficient experimental characterisation of certain large                 methods are usually found buried within the core of soluble
entries (i.e. gelsolin, kerato-epithelin, lactoferrin, amphoterin and           proteins. Contrary to what has been previously reported14,15,
others), which has been shown to introduce type-I errors (false                 however, our regression model also discovered additional nucle-
positives). This error propensity derives from non-amyloid                      ating sequences that primarily appear to reside on the surface of
annotations which primarily correspond to regions of undeter-                   protein molecules (Fig. 5b–h) and as a result, are characterised by
mined aggregation propensity, a notion that is highlighted by                   high solvent exposure (Fig. 5i and j). Partition coefficients clearly
recent studies, such as in the case of calcitonin35, cystatin-C36 and           indicate that these exposed peptide segments identified by Cordax
transthyretin37. In contrast, other proteins have been linked to                are primarily water-soluble sequences, whereas APRs that are
the formation of β-helical structures and as an after effect contain            predicted by the majority of sequence-based predictors are largely
elongated fragments characterised, yet unverified in their entirety,             insoluble (Fig. 5k). Sequence distribution analysis signifies that
as amyloidogenic, which can introduce type-II errors (false                     this increased exposure and solubility is complemented by an
negatives) when applying predictors of local aggregation                        expected decrease in sequence hydrophobicity (Fig. 5l). More
propensity38–41. The aforementioned shortcomings are reflected                   specifically, APRs identified solely by Cordax are relatively enri-
by the low MCC values that are reported for all aggregation                     ched in charged or polar side chains (Fig. 5l) and are frequently
predictors (Supplementary Table 1) and the fact that predicted                  parts of α-helical or unstructured segments (Fig. 5m). This
segments were originally considered neutral, but later shown to                 implies that these regions are in fact conformational switches that
be aggregation hotspots (Supplementary Fig. 1)35–41.                            may, under fitting misfolding conditions, transiently move
                                                                                towards the formation of β-aggregates. The fact that these
                                                                                sequences are not dictated by typical sequence propensities, such
Designed APR nucleators validate the accuracy of Cordax
                                                                                as hydrophobicity or β-structure tendency, explains why
predictions. In the interest of improving the current description
                                                                                sequence-based predictors overlook them.
of the familiar amyloidogenic protein dataset, we selected and
synthesised a subset of 96 peptides corresponding to strong
aggregation prone regions identified in these proteins by Cordax.
                                                                                Cordax infiltrates uncharted areas of amyloid sequence space.
Apart of prediction strength, the peptide screen was also selec-
                                                                                To further explore the capabilities of our method, we composed a
tively constructed to ensure broad sequence variability and a wide
                                                                                map of the known amyloid-forming sequence space using t-
distribution on the proteins of the dataset, with a preference for
                                                                                distributed stochastic neighbour embedding (t-SNE) for dimen-
longer entries defined by inadequate previous characterisation.
                                                                                sionality reduction (Fig. 6a). As input, we used a 20-dimensional
Peptide sequences were cross-checked and filtered to exclude
                                                                                parameterisation vector describing all newly identified amyloi-
overlapping sequences with previously identified amyloid regions
                                                                                dogenic peptides merged to the known amyloid-forming hex-
and WALTZ-DB (Supplementary Data 2). The remaining selec-
                                                                                apeptide sequences in WALTZ-DB, in terms of their basic
tion of 96 peptides were synthesised using standard solid phase
                                                                                physicochemical properties and amino acid composition, as well
synthesis and their amyloid-forming properties were initially
                                                                                as prediction outputs derived from Cordax and other high spe-
examined using Thioflavin-T (Th-T) or pFTAA binding, fol-
                                                                                cificity predictors. t-SNE mapping pinpointed clear areas of
lowing rotating incubation for 5 days at room temperature. The
                                                                                sequence space where Cordax correctly identifies amyloid pro-
binding assays are complementary, as Th-T and pFTAA are
                                                                                pensity (purple colour in Fig. 6a), which primarily extend towards
opposingly charged molecules, which increases the amyloid
                                                                                regions that remain unpredicted (shown in black) and seclude
identification rate by overcoming cases of dye-specific failure to
                                                                                from a large base of sequences identified by multiple methods,
bind to amyloid surfaces based on charge repulsion. Under these
                                                                                including Cordax (cyan colour). Clustering analysis (Fig. 6b)
conditions, 66 peptides successfully bind to the specific dyes
                                                                                performed using physicochemical properties (Figs. 6c–e), sec-
(Fig. 4a and b) by forming fibrils with typical amyloid
                                                                                ondary structure propensities (Fig. 6f) and side chain size dis-
morphologies and properties that were verified using transmis-
                                                                                tributions (Fig. 6g, h) identifies that this common base of by-now
sion electron microscopy (Fig. 4c) and Congo red staining for
                                                                                easy to predict APRs are characterised by high hydrophobicity,
selected cases (Fig. 4d). As these dyes are known to yield false
                                                                                strong β-sheet propensity and a high relative content of aliphatic
negatives, in particular for short peptides, all dye-negative pep-
                                                                                side chains (cluster 1 in Fig. 6b), still echoing the initial discovery
tides were further investigated using electron microscopy. During
                                                                                of APRs by these features6. Cordax explores regions adjacent to
this scan, we recovered 19 additional sequences that were capable
                                                                                this with a higher content of shorter side chains (clusters 2 and 5).
of forming sparse amyloid-like fibrils with shorter lengths (Sup-
                                                                                Notably, amyloid nucleators of this composition are an invaluable
plementary Fig. 2). Taking the latter into account, Cordax was
                                                                                resource for amyloid nanomaterial designs with elastin-like
able to fish out a total number of 85 novel nucleation segments
                                                                                properties, are enriched in functional amyloids and have also
with unparalleled accuracy (89%), thus providing a rigorously
                                                                                been linked to ancestral amyloid scaffolds in early life42–45. A
improved description of the protein set to be used for the efficient
                                                                                similar trend in amino acid composition has also been reported
testing and development of future predictors (Supplementary
                                                                                for proteins that form condensates through phase transition, such
Fig. 1).
                                                                                as TDP-43 and FUS16,18. Low complexity regions (LCRs) that are
                                                                                enriched in short side chains, such as Gly or Ala, have been
Cordax detects highly soluble surface-exposed conformational                    shown to drive phase separation, often as an intermediate event
switches. The expanded amyloidogenic annotation of the protein                  towards fibrillation, particularly in polar LCRs with lower ali-
dataset was supplemented with structural analysis of the newly                  phatic content and strong disorder or α-helical propensities, such
identified aggregation prone regions. Out of 96 peptides designed                as the sequences discovered in cluster 517,46. Further to this,
and experimentally tested, 85 peptides were found to display                    Cordax provides significant advancement by traversing in areas
evident amyloid-forming features, with more than half (55.3%)                   with a higher content of negatively or positively charged regions
being predicted specifically by Cordax, contrary to shared pre-                  (clusters 3, 4, 6 and 7, respectively). Charged residues often act as
dictions with sequence-based tools of high specificity (44.7%)                   gatekeepers that directly disrupt aggregation or modulate it by
(Supplementary Data 2). Pinpointing the location of the identified               flanking APRs within protein sequences47. Based on this premise,
nucleators in parental protein folds (Fig. 5a) revealed that APRs               most sequence-based predictors negatively correlate net charge to

NATURE COMMUNICATIONS | (2020)11:3314 | https://doi.org/10.1038/s41467-020-17207-3 | www.nature.com/naturecommunications                             5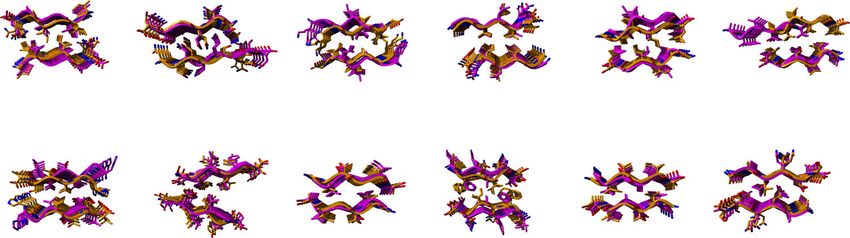
6
Th-T fluorescence intensity (490 nm)
e
c
a
pFTAA fluorescence intensity (510 nm)
5.0 × 10
2 × 10
4 × 10
0.0
2.5 × 10³
3
4
4
6 × 10⁴
8 × 10⁴
0
3 × 10⁴
6 × 10⁴
9 × 10⁴
(SVDYEV) Acylphos2 (9 – 14) p > 0.9999 (SVDYEV) Acylphos2 (9 – 14) p < 0.0001
(IGVVGW) Acylphos2 (34 – 39) p < 0.0001 (IGVVGW) Acylphos2 (34 – 39) p = 0.0322
(NFSIRY) Acylphos2 (94 – 99) p = 0.9995 (NFSIRY) Acylphos2 (94 – 99) p < 0.0001
(VNFSEF) Amphot (36 – 41) p = 0.9995 (VNFSEF) Amphot (36 – 41) p = 0.8600
IFTVQL
STVISY
ARTICLE
IQVYSR
p > 0.9999 p = 0.9804
NDAFVL
(SEFSKK) Amphot (39 – 44) (SEFSKK) Amphot (39 – 44)
(AFFLFC) Amphot (101 – 106) p < 0.0001 (AFFLFC) Amphot (101 – 106) p < 0.0001
(LSSYWE) ApoC2 (44 – 49) p > 0.9999 (LSSYWE) ApoC2 (44 – 49) p = 0.9995
(NLYEKT) ApoC2 (57 – 62) p > 0.9999 (NLYEKT) ApoC2 (57 – 62) p = 0.9790
(VYVDVL) ApoAI (41 – 46) p < 0.0001 (VYVDVL) ApoAI (41 – 46) p = 0.9988
(LNLKLL) ApoAI (66 – 71) p > 0.9999 (LNLKLL) ApoAI (66 – 71) p < 0.0001
p > 0.9999 p = 0.9792
500 nm
(LLDNWD) ApoAI (70 – 75) (LLDNWD) ApoAI (70 – 75)
200 nm
500 nm
500 nm
(MDVFMK) -Syn (1 – 6) p > 0.9999 (MDVFMK) -Syn (1 – 6) p = 0.0433
(IQVYSR) 2-micro (27 – 32) p < 0.0001 (IQVYSR) 2-micro (27 – 32) p < 0.0001
(LCSTFC) Casein (50 – 55) p < 0.0001 (LCSTFC) Casein (50 – 55) p < 0.0001
(LNFLKK) Casein (176 – 181) p > 0.9999 (LNFLKK) Casein (176 – 181) p = 0.9998
(KTVYQH) Casein (196 – 201) p > 0.9999 (KTVYQH) Casein (196 – 201) p = 0.7809
VHIVKL
IIYNWQ
NFSIRY
VYVDVL
(TKVIPY) Casein (213 – 218) p > 0.9999 (TKVIPY) Casein (213 – 218) p = 0.8792
(GIVAGA) Het-S (6 – 11) p > 0.9999 (GIVAGA) Het-S (6 – 11) p < 0.0001
(DCFEYV) Het-S (23 – 28) p < 0.0001 (DCFEYV) Het-S (23 – 28) p < 0.0001
(FEYVQL) Het-S (25 – 30) p < 0.0001 (FEYVQL) Het-S (25 – 30) p = 0.0443
(ILLLFE) Het-S (87 – 92) p < 0.0001 (ILLLFE) Het-S (87 – 92) p < 0.0001
(DLVVFE) Het-S (109 – 114) p < 0.0001 (DLVVFE) Het-S (109 – 114) p < 0.0001
p < 0.0001 (AEIEIE) Het-S (184 – 189) p < 0.0001
500 nm
200 nm
200 nm
(AEIEIE) Het-S (184 – 189)
500 nm
(ASLTIL) Het-S (195 – 200) p < 0.0001 (ASLTIL) Het-S (195 – 200) p < 0.0001
(MVVEHP) Gelsolin (52 – 57) p > 0.9999 (MVVEHP) Gelsolin (52 – 57) p = 0.6738
(AYVILK) Gelsolin (94 – 99) p > 0.9999 (AYVILK) Gelsolin (94 – 99) p < 0.0001
(GWFLGW) Gelsolin (758 – 763) p = 0.9781 (GWFLGW) Gelsolin (758 – 763) p = 0.9995
(YDLHYW) Gelsolin (110 – 115) p < 0.0001 (YDLHYW) Gelsolin (110 – 115) p = 0.0396
YIILYN
ASLTIL
FVIEEV
(IFTVQL) Gelsolin (130 – 135) p < 0.0001 (IFTVQL) Gelsolin (130 – 135) p = 0.0042
QVFVWV
(FLGYFK) Gelsolin (157 – 162) p > 0.9999 (FLGYFK) Gelsolin (157 – 162) p = 0.9991
(MSVSLV) Gelsolin (310 – 315) p < 0.0001 (MSVSLV) Gelsolin (310 – 315) p < 0.0001
(EDCFIL) Gelsolin (329 – 334) p < 0.0001 (EDCFIL) Gelsolin (329 – 334) p < 0.0001
(KIFVWK) Gelsolin (341 – 346) p > 0.9999 (KIFVWK) Gelsolin (341 – 346) p = 0.0235
(DFITKM) Gelsolin (364 – 369) p > 0.9999 (DFITKM) Gelsolin (364 – 369) p = 0.9998
p < 0.0001 p < 0.0001
200 nm
200 nm
500 nm
(YIILYN) Gelsolin (474 – 479)
500 nm
(YIILYN) Gelsolin (474 – 479)
(IIYNWQ) Gelsolin (489 – 494) p < 0.0001 (IIYNWQ) Gelsolin (489 – 494) p < 0.0001
(MIIYKG) Gelsolin (544 – 549) p = 0.9997 (MIIYKG) Gelsolin (544 – 549) p < 0.0001
(NDAFVL) Gelsolin (591 – 596) p < 0.0001 (NDAFVL) Gelsolin (591 – 596) p < 0.0001
(AAYLWV) Gelsolin (601 – 606) p < 0.0001 (AAYLWV) Gelsolin (601 – 606) p < 0.0001
(FVIEEV) Gelsolin (679 – 684) p < 0.0001 (FVIEEV) Gelsolin (679 – 684) p < 0.0001
ILLLFE
AEIEIE
p = 0.1841 p < 0.0001
VNFSEF
YQLVQL
(QVFVWV) Gelsolin (706 – 711) (QVFVWV) Gelsolin (706 – 711)
(GYLTIR) RepA (45 – 50) p > 0.9999 (GYLTIR) RepA (45 – 50) p = 0.0002
(KLFNRD) RepA (75 – 80) p = 0.9998 (KLFNRD) RepA (75 – 80) p = 0.0003
(FHVKYR) RepA (97 – 102) p > 0.9999 (FHVKYR) RepA (97 – 102) p < 0.0001
(MLHKEF) RepA (122 – 127) p = 0.9995 (MLHKEF) RepA (122 – 127) p = 0.9037
(FYAVRL) RepA (141 – 146) p > 0.9999 (FYAVRL) RepA (141 – 146) p = 0.9996
500 nm
p > 0.9999 p = 0.0261
2000 nm
200 nm
(SQFIKL) RepA (151 – 156) (SQFIKL) RepA (151 – 156)
200 nm
(FSFTIA) RepA (216 – 221) p < 0.0001 (FSFTIA) RepA (216 – 221) p < 0.0001
Th-T Control pFTAA Control
Th-T fluorescence intensity (490 nm)
f
pFTAA fluorescence intensity (510 nm)
d
b
0.0
2.5 × 10³
5.0 × 10³
2 × 10⁴
4 × 10⁴
6 × 10⁴
8 × 10⁴
0
3 × 10⁴
6 × 10⁴
9 × 10⁴
(YQLVLQ) Keratoep (30 – 35) p < 0.0001 (YQLVLQ) Keratoep (30 – 35) p < 0.0001
(STVISY) Keratoep (77 – 82) p < 0.0001 (STVISY) Keratoep (77 – 82) p < 0.0001
(VNIELL) Keratoep (163 – 168) p < 0.0001 (VNIELL) Keratoep (163 – 168) p < 0.0001
polarised light (CP). Scale bars: 500 μm. Source data are provided as a Source Data file.
(IQIHHY) Keratoep (202 – 207) p > 0.9999 (IQIHHY) Keratoep (202 – 207) p < 0.0001
(QIIEIE) Keratoep (245 – 250) p < 0.0001 (QIIEIE) Keratoep (245 – 250) p < 0.0001
(GVIHYI) Keratoep (362 – 367) p > 0.9999 p = 0.0003
BF
(GVIHYI) Keratoep (362 – 367)
(LNSVFK) Keratoep (416 – 421) p > 0.9999 (LNSVFK) Keratoep (416 – 421) p = 0.4282
(LYHGQT) Keratoep (449 – 454) p > 0.9999 (LYHGQT) Keratoep (449 – 454) p = 0.0006
(TLFTMD) Keratoep (490 – 495) p = 0.9997 (TLFTMD) Keratoep (490 – 495) p = 0.0925
(VYTVFA) Keratoep (536 – 541) p < 0.0001 (VYTVFA) Keratoep (536 – 541) p < 0.0001
(HYYAVA) Lactoferrin (110 – 115) p > 0.9999 (HYYAVA) Lactoferrin (110 – 115) p < 0.0001
(GDVAFI) Lactoferrin (223 – 228) p < 0.0001 (GDVAFI) Lactoferrin (223 – 228) p < 0.0001
YIILYN
AEIEIE
p > 0.9999 p = 0.0319
NFSIRY
(LLFKDS) Lactoferrin (317 – 322) (LLFKDS) Lactoferrin (317 – 322)
IQVYSR
(YFTAIQ) Lactoferrin (343 – 348) p < 0.0001 (YFTAIQ) Lactoferrin (343 – 348) p < 0.0001
(GWNIPM) Lactoferrin (487 – 492) p = 0.9997 (GWNIPM) Lactoferrin (487 – 492) p < 0.0001
(MDKVER) Lactoferrin (622 – 627) p = 0.9998 (MDKVER) Lactoferrin (622 – 627) p = 0.9650
CP
(YVAGIT) Lactoferrin (686 – 691) p < 0.0001 (YVAGIT) Lactoferrin (686 – 691) p < 0.0001
(CEFLRK) Lactoferrin (705 – 710) p = 0.9999 (CEFLRK) Lactoferrin (705 – 710) p = 0.0014
(LQVDLG) Medin (289 – 294) p < 0.0001 (LQVDLG) Medin (289 – 294) p = 0.0453
(MFSEFD) Prolactin (64 – 69) p < 0.0001 (MFSEFD) Prolactin (64 – 69) p < 0.0001
(LIVSIL) Prolactin (111 – 116) p = 0.9813 (LIVSIL) Prolactin (111 – 116) p < 0.0001
(LYHLVT) Prolactin (123 – 128) p > 0.9999 (LYHLVT) Prolactin (123 – 128) p = 0.9988
(MELIVS) Prolactin (158 – 163) p < 0.0001 (MELIVS) Prolactin (158 – 163) p < 0.0001
(LHCLRR) Prolactin (200 – 205) p = 0.9998 (LHCLRR) Prolactin (200 – 205) p = 0.8737
(FDKFKH) Myoglobin (44 – 49) p > 0.9999 (FDKFKH) Myoglobin (44 – 49) p = 0.9921
(QVYYRP) PrP (160 – 165) p > 0.9999 p = 0.0130
(QVYYRP) PrP (160 – 165)
(YFHARG) SAA (53 – 58) p > 0.9999 (YFHARG) SAA (53 – 58) p = 0.0001
(LIFMGH) Sup35 (263 – 268) p = 0.9990 (LIFMGH) Sup35 (263 – 268) p < 0.0001
BF
(MYVSEM) Sup35 (350 – 355) p < 0.0001 (MYVSEM) Sup35 (350 – 355) p < 0.0001
(VVVNKM) Sup35 (403 – 408) p > 0.9999 (VVVNKM) Sup35 (403 – 408) p < 0.0001
(SNFLRA) Sup35 (428 – 433) p > 0.9999 p = 0.0420
(SNFLRA) Sup35 (428 – 433)
(IGYNIK) Sup35 (434 – 439) p > 0.999 p = 0.1168
(IGYNIK) Sup35 (434 – 439)
(TDVVFM) Sup35 (440 – 445) p < 0.0001 (TDVVFM) Sup35 (440 – 445) p < 0.0001
(VDMAMC) Sup35 (542 – 547) p < 0.0001 (VDMAMC) Sup35 (542 – 547) p < 0.0001
(VHIVKL) Sup35 (612 – 617) p > 0.9999 (VHIVKL) Sup35 (612 – 617) p < 0.0001
ILLLFE
ASLTIL
FVIEEV
p = 0.0445
NDAFVL
(INFEFS) Ure2p (35 – 40) p < 0.0001 (INFEFS) Ure2p (35 – 40)
(FKVAIV) Ure2p (126 – 131) p > 0.9999 (FKVAIV) Ure2p (126 – 131) p = 0.0004
(GYTLFS) Ure2p (113 – 118) p > 0.9999 (GYTLFS) Ure2p (113 – 118) p = 0.0003
p < 0.0001
CP
(TIFLDF) Ure2p (141 – 146) p < 0.0001 (TIFLDF) Ure2p (141 – 146)
(LSIWES) Ure2p (176 – 181) p < 0.0001 p < 0.0001
(LSIWES) Ure2p (176 – 181)
NATURE COMMUNICATIONS | (2020)11:3314 | https://doi.org/10.1038/s41467-020-17207-3 | www.nature.com/naturecommunications
(HLVNKY) Ure2p (187 – 192) p = 0.9999 (HLVNKY) Ure2p (187 – 192) p = 0.9910
(INAWLF) Ure2p (211 – 216) p < 0.0001 (INAWLF) Ure2p (211 – 216) p < 0.0001
(LVMELD) Ure2p (270 – 275) p < 0.0001 (LVMELD) Ure2p (270 – 275) p < 0.0001
(IGINIK) Ure2p (323 – 328) p > 0.9999 p = 0.9999
(IGINIK) Ure2p (323 – 328)
(EVYKWT) Ure2p (333 – 338) p > 0.9999 (EVYKWT) Ure2p (333 – 338) p < 0.0001
(SYVLQT) Semenogelin (193 – 198) p = 0.9329 (SYVLQT) Semenogelin (193 – 198) p = 0.0036
(LLVYNK) Semenogelin (260 – 265) p > 0.9999 p = 0.0941
(LLVYNK) Semenogelin (260 – 265)
(LHYGEN) Semenogelin (298 – 303) p > 0.9999 p = 0.2828
(LHYGEN) Semenogelin (298 – 303)
Th-T Control pFTAA Control
amyloid fibrils bind Congo red as displayed under bright field illumination (BF) and exhibit typical for amyloids apple-green birefringence under crossed-
multiple comparison against the vehicle control). e Electron micrographs of amyloid fibrils formed by Th-T or pFTAA-binding peptides. f Suspensions of
Fig. 4 Amyloid-forming properties of the peptide screen designed by employing Cordax. a and b Measured pFTAA and c and d Th-T fluorescence of
synthetic peptides following rotation at 200 μM for 5 days. Data represents mean ± SD (n = 6 independent experiments, statistics: one-way ANOVA with
NATURE COMMUNICATIONS | https://doi.org/10.1038/s41467-020-17207-3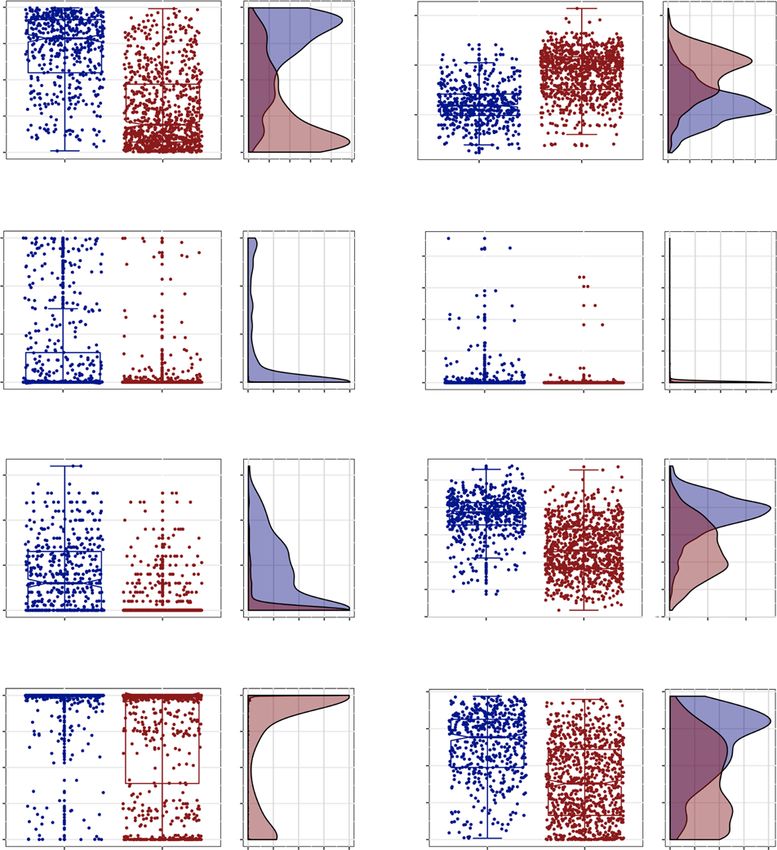
NATURE COMMUNICATIONS | https://doi.org/10.1038/s41467-020-17207-3 ARTICLE
a b c RepA
180° 180°
Ure2p PDB: 1HQO PDB: 1HKQ
Sup35
d e
Acylphosphatase-2
Ure2p
180°
180°
PDB: 1APS PDB: 4CRN
Prolactin
Lactoferrin
f g h Keratoepithelin
180°
180°
180°
PDB: 1RW5 PDB: 1CB6 PDB: 5NV6
i 1.2
p < 0.0001
j 1.2
p < 0.0001
k 5 p < 0.0001
l 40 m 100
CORDAX CORDAX
1.0 1.0 vi Joined Joined
30 75
0.8 i
Side chain burial
Main chain burial
0.8 0 n
Residue counts
Residue (%)
logD values
s
0.6 0.6 20 50
vs
0.4 0.4 –5
10 25
0.2 0.2
0.0 0.0 –10 0 0
ys
AX
ed
ge
ge
ic
x
ic
tic
r
ed
ed
AX
la
da
l
ix
nd
at
ob
oi
C
ha
in
ar
ar
Po
D
el
in
in
om
C
D
or
o/
ra
ph
Jo
ch
ch
R
H
Jo
lip
Jo
R
Pr
C
St
O
α-
Ar
ro
O
ta
e
e
C
β-
C
yd
iv
tiv
or
at
si
H
Sh
eg
Po
N
Fig. 5 Cordax identifies surface-exposed aggregation nucleators spanning residues that are typically considered unconventional for amyloid fibril
formation. a Schematic representation of Cordax-predicted topological models for APRs charted against the cognate native crystal structure of the
amyloidogenic protein Ure2p. b–h Surface representation of folded structures for b Ure2p, c RepA, d Acylphosphatase-2, e Sup35, f Prolactin, g Lactoferrin
and h Kerato-epithelin reveals that aggregation nucleators uniquely identified by Cordax (highlighted in red) are primarily exposed to the surface of
proteins, compared to segments of joint prediction (shown in blue) which are predominantly buried within the hydrophobic core of the native fold. Cordax-
specific predicted APRs produced lower volumetric burial values, calculated using FoldX, for i side chain and j main chain groups indicating that they are
considerably exposed compared to jointly identified nucleators. k Partition coefficients indicate that Cordax-specific APRs are significantly more soluble
compared to typically predicted sequences that are primarily hydrophobic and therefore insoluble. Solubility regions (vi very insoluble, i insoluble, n neutral,
s soluble, vs very soluble) are shown as coloured backgrounds72. Significant differences were computed using one-way ANOVA with multiple comparison.
l Surface-exposed Cordax-specific APRs are composed of residues with a 20% increase in polar and charged side chains, in expense of hydrophobic
residues (n = 219 residues in APRs identified by Cordax, n = 203 residues in APRs from joined predictions). m Secondary structure analysis, using FoldX,
indicates that Cordax identifies several APRs that reside in α-helical or unstructured regions within the native fold, suggesting that amyloidogenic proteins
may harbour a plethora of exposed conformation switches that can act as potential nucleators of amyloid fibril formation, under suitable misfolding
conditions (n = 219 residues in APRs identified by Cordax, n = 203 residues in APRs from joined predictions). Violin plots represent the kernel probability
densities of the data with the median, upper and bottom quartiles. Source data are provided as a Source Data file.
protein aggregation and have increased failure rates when iden- scope to improve the method, as in particular, the region with
tifying such amyloid-forming stretches. On the other hand, high disorder propensity (cluster 11) still contains many false
sequences with a high content of aromatic side chains are rela- negatives, in spite of the ability of Cordax to partially pick up a
tively easy to identify (clusters 9a and 9b), following several lines minority of sequences. Interestingly, a closer look at the partition
of evidence supporting their role in amyloid fibril formation48. coefficients of the known amyloid sequence space reveals that
Cordax also pushes forward into less well-charted areas of amy- although Cordax takes a significant step forward towards the
loid sequence space, e.g. exploring clusters with high α-helical right direction, these APRs remain very hard to identify as they
content (cluster 10) and overall a low content of aliphatic amino are characterised by even higher solubility values (Fig. 6i). Similar
acids (clusters 5, 6, 7, 8 and 9b). These regions also reveal the charting of the amyloid sequence space is achieved by using
NATURE COMMUNICATIONS | (2020)11:3314 | https://doi.org/10.1038/s41467-020-17207-3 | www.nature.com/naturecommunications 7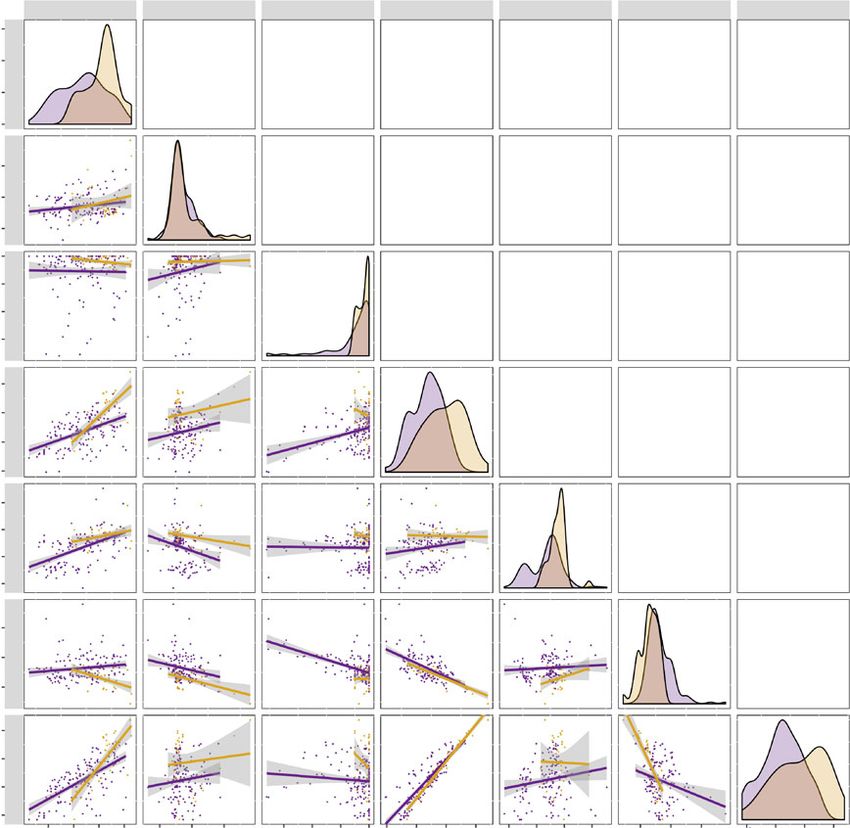
ARTICLE NATURE COMMUNICATIONS | https://doi.org/10.1038/s41467-020-17207-3
a b
1
1. Hydrophobic/β-propensity/High aIndex
2 2. Short side chains/hydrophobic/High aIndex
3 3. Acidic/High aIndex
4. Basic/High aIndex
CORDAX
Clustering sorting scheme
4
5. Short side chains/hydrophobic/Low aIndex
Predictions
Non-CORDAX 5
6. Acidic/Low aIndex
Joined
9a 7. Basic/Low aIndex
Unpredicted
8. Hydrophobic/High instability/Low aIndex
7 9a. Aromatic/High aIndex
9b 9b. Aromatic/Low aIndex
10. α-helix propensity
6
11. Unstructured propensity
11
8
t-SNE dim2
t-SNE dim1 10
c d e i
10
p < 0.0001
p < 0.0001
1 2 300 p = 0.343
Hydrophobicity
1
Alndex
0.5 200 p = 0.0002
Charge
0
0 p = 0.027
–1 100
–0.5 –2 p < 0.0001
0 5
–1 –3
vi
logD values
i
0
n
s
f g h
–5 vs
100
α-helix
Secondary structure
(%) Tiny sc
60
(%) Aromatic
75
α/β 40 50
20 25
β-strand 0
0 –10
Unstructured
x
x
ed
ed
da
da
in
ct
or
or
Jo
di
C
C
re
n-
np
no
U
Fig. 6 t-SNE 2D-representation of the known experimentally determined amyloidogenic sequence space. a State-of-the-art sequence-based methods
predict amyloid sequences, with (shown in cyan) or without Cordax (shown in yellow), that are grouped together in a major landing cluster and two
islands. Cordax predictions (shown in purple) transgress towards areas of amyloid-forming sequences that remain undetected by most methods (shown in
black). b Clustering of the t-SNE map using basic physicochemical properties and amino acid composition of the amyloid peptides. Each data point is
colour-coded based on the sorting scheme shown in the legend and background areas are used to pinpoint the major clusters of each defined category. The
clustering scheme was defined by characterising the t-SNE map using peptide c hydrophobicity, d net charge, e aliphatic index, f secondary structure
propensity and percentage content of g aromatic or h short residue side chains. i Partition coefficient analysis reveals that APRs identified by Cordax are
primarily soluble sequences compared to easy to identify sequences of joint prediction. On the other hand, APRs that remain hard to detect are
characterised by higher solubilities. Solubility regions (vi very insoluble, i insoluble, n neutral, s soluble, vs very soluble) are shown as coloured
backgrounds. Significant differences were computed using one-way ANOVA with multiple comparison. Violin plots represent the kernel probability
densities of the data with the median, upper and bottom quartiles.
uniform manifold approximation and projection (UMAP) for structural compatibility can overcome typical sequence propen-
dimensionality reduction (Supplementary Fig. 3a and b), while sities as a pivotal driver of aggregation nucleating sequences and
PCA analysis highlights that CORDAX slowly infiltrates the suggests that under the proper conditions, the boundaries currently
sequence space of higher solubilities (Supplementary Fig. 3c and d). considered compatible to protein amyloid-like assembly are
Overall, dimensionality reduction transformation highlights that potentially far wider than previously expected.
8 NATURE COMMUNICATIONS | (2020)11:3314 | https://doi.org/10.1038/s41467-020-17207-3 | www.nature.com/naturecommunications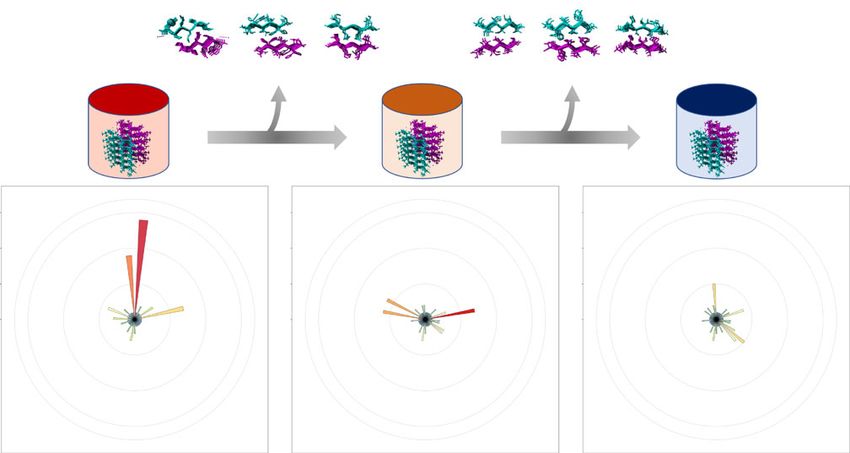
NATURE COMMUNICATIONS | https://doi.org/10.1038/s41467-020-17207-3 ARTICLE
a 100 b
CORDAX
d
3D Profile
te
tric
es
Fib Predictor
l-R
80
lle
ra
Pa
d
Prediction (%)
te
ric
60 VIGIAQ NNQGSN KGAIIG GVNLVN GAIIGL AVVTGV
st
Re
1-
RMSD : 1.6 Å RMSD : 1.3 Å RMSD : 2.7 Å RMSD : 1.2 Å RMSD : 1.4 Å RMSD : 2.1 Å
ss
Cla
40
20
0
y
na nd
og
HGVTTV GYLLGS GVTGIA IFQINS GVTAVA AALQSS
io a
y
l
ct str
lit
po
re β-
To
RMSD : 2.3 Å RMSD : 1.1 Å RMSD : 0.9 Å RMSD : 2.5 Å RMSD : 1.3 Å RMSD : 1.2 Å
di
c p < 0.0001 d e (IYQYGG) 6G8C (LNIYQY) 6G8D (VTQVGF) 6G8E (IFAEDV) 5TXH
40 p < 0.0001
20
p < 0.0001
30
Blosum62 score
Blosum62 score
10
20
PDB
10 0 strucure
0
–10
–10
–20 –20
0 20 40 60 80
at e
at y
at y
m log
m g
m plat
is lo
ch
ch
ch
po
m opo
Model rank
m
Cordax
To
Te
T
Template mismatches
model
f PDB lD CORDAX 3D Profile FibPredictor
Topology prediction (Å)
6G8C 0.4 2.7 3.8
6G8D 2.1 2.1 2.4
Structural
overlay
6G8E 1.1 1.5 Class mismatch
5TXH 1.7 Class mismatch Class mismatch
RMSD : 0.4 Å RMSD : 2.1 Å RMSD : 1.1 Å RMSD : 1.7 Å
Fig. 7 High-precision recognition of amyloid fibril structural architectures using Cordax. a Prediction accuracy comparison of Cordax to the only publicly
available structural predictors, Fibpredictor and 3D-profile. For comparison, methods were run against a non-redundant sequence set extracted from
amyloid-forming peptide interfaces (n = 73 templates). b Model topologies, predicted by applying Cordax (shown in orange), strongly superimpose to
matching solved structural layouts of amyloidogenic nucleators (shown in magenta), as indicated by the reported minor RMSD values. c Sequence identity
contribution for template selection during cross-threading analysis of the Cordax structural library. Alignment scores for selected models matching the
template sequences compared to mismatching template selections of similar or different topological layouts (n = 73 templates). d Alignment scores of the
APRs newly identified by Cordax to the sequence of the selected templates, plotted against their corresponding model ranks (n = 96 sequences threaded).
e Structural alignment of Cordax outputs to experimentally determined 3D structures. Models were calculated for three aggregation prone sequences
derived from CsgA curli forming protein (PDB IDs: 6G8C, 6G8D and 6G8E, respectively) and a peptide mutant sequence derived from Aβ amyloid peptide
(PDB ID: 5TXH). Predicted topologies are overlapping representations of the experimentally determined amyloid fibril cores, f as displayed by a direct
comparison to other software. Violin plots represent the kernel probability densities of the data with the median, upper and bottom quartiles. Source data
are provided as a Source Data file.
Cordax predicts the structural layout and topology of fibril closer look reveals that sequence specificity may be a modulating,
cores. Due to restricted availability of experimentally determined yet not determining factor for this selection process. Steric per-
structures not included in the Cordax library, we first analysed turbations can be introduced due to restrictions deriving from
the information derived from cross-threading analysis in order to closely interdigitating side chains within the packed interfaces,
test the performance of the tool in predicting the structural therefore, key residue positions can be bound to the overall sta-
architecture of aggregation prone stretches. Among 73 unique bility of certain structural topologies and decrease the acceptable
sequences corresponding to the structural library, Cordax was sequence space that can accommodate energetically favourable
able to accurately assign the correct architecture to 63%, whereas interactions. This is highlighted by the sequence similarity
81% was identified with proper β-strand orientation (parallel/ observed between topological matches (Fig. 7c, Supplementary
antiparallel) (Fig. 7a, Supplementary Data 3 and 4). In compar- Data 4). On the other hand, topologically different model selec-
ison, FibPredictor49 correct topology allocation was limited to tions could also be a consequential outcome of amyloid poly-
9.5% of the sequences and assigned β-strand directionality morphism. The observed sequence redundancy of the Cordax
amounted to 32.9%, while introducing an evident preference library illustrates that APRs can form amyloid fibrils with distinct
towards antiparallel architectures (Fig. 7a). Similarly, the 3D- morphological layouts50–52, a notion that is also supported by the
profile method is restricted to linking all potential queries with a common morphological variability of aggregates formed at the
class 1 topology, hence was incapable of predicting alternative level of full-length amyloid-forming proteins53,54. The modulat-
architectures (Fig. 7a). Structural alignment indicated that even in ing role of sequence dependency was also evident for the 96-
cases of mismatching selected templates, modelled architectures peptide screen. A ranked analysis of the output models indicated
strongly superimpose to the solved structures (Fig. 7b), suggesting that templates with higher alignment scores were not crucial for
that Cordax identifies the correct topology with high accuracy. A the topology selection process, although could often correspond
NATURE COMMUNICATIONS | (2020)11:3314 | https://doi.org/10.1038/s41467-020-17207-3 | www.nature.com/naturecommunications 9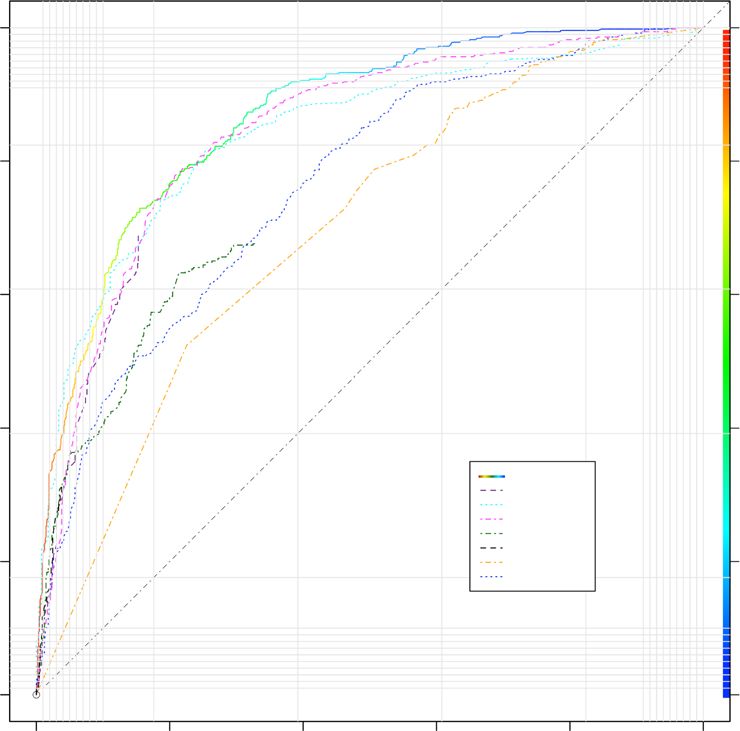
ARTICLE                                                                 NATURE COMMUNICATIONS | https://doi.org/10.1038/s41467-020-17207-3

to the favourable architectures (Fig. 7d), thus highlighting that the        provided significant insights on the polymorphic architectures of
structural predictions of Cordax are relatively unbiased in terms            amyloid fibrils57. In this line, the emergence of cryo-EM has been
of the sequence space composing the structural templates.                    pivotal in determining features of amyloid fibril polymorphs58,
   The accuracy of the tool was also cross-referenced against                complementing earlier efforts developed using solid-state NMR
experimentally determined structures of fibril cores not included             spectroscopy53,59. Notably, these structures represent snapshots
in the structural library. We utilised the recently solved structures        of the kinetic cores of aggregation or end-state morphologies of
of parallel fibril-forming segments derived from the major curli              amyloid fibrils and therefore provide limited information on the
protein CsgA55, as well as an anti-parallel polymorphic APR                  underlying aggregation pathways and toxicity-related effects of
variant segment derived from the amyloid-β peptide56. Compared               amyloids. On the other hand, the growing number of high-
to other structural predictors, only Cordax could invariantly                resolution cryo-EM structures has highlighted the in vivo struc-
predict the correct architecture for every steric zipper as the              tural diversity of amyloid fibrils60, whereas steric zippers have
closest representation of the experimentally determined reference            been recently used for the development of targeted ther-
structures (Fig. 7e and f). This performance can only improve as             apeutics61–63. However, determining the structural layout of
the fragment library expands, so we aim to update it at regular              amyloid fibrils still remains challenging. Cordax attempts to
intervals, providing there is a noticeable increase in solved                provide a cost-effective complementary powerful computational
structures in the future.                                                    alternative that can be operated without any required scientific
                                                                             expertise necessary to apply the intricate technical approaches.
                                                                             Apart from its function as an aggregation predictor, the tool is
Discussion                                                                   uniquely poised to provide detailed complementary structural
The number of amyloid structures in the protein databank has                 information on the putative amyloid fibril architecture of iden-
been steadily increasing over the last two decades. It has now               tified APRs. Users can utilise the method to structurally char-
achieved a number (>80) that was reached for globular proteins at            acterise identified APRs by classifying their overall specific
the beginning of the 1980s and that then triggered the first                  topological preferences, including β-strand directionality and key
developments of template-based modelling methods including                   residue positions that are integral parts of the amyloid core. The
homology-based and threading (or fold recognition) in an                     latter information is imperative for efforts focused on under-
attempt to estimate the versatility of individual folds and discover         standing the underlying mechanisms that dictate amyloid-related
novel folds in a more directed manner. Similarly, we here                    diseases or the formation of functional amyloids, but can also
developed Cordax, an exhaustively trained regression model that              have an immense impact on the design of applied nano-
leverages a substantial library of curated amyloid template                  biomaterials64, targeted amyloid inducers65 or counteragents,
structures combined with machine learning. Cordax uses a                     following the increased interest in the development of structure-
logistic regression approach to translate structural compatibility           based inhibitors of aggregation61–63.
and interaction energies into sequence aggregation propensity
and is therefore unconstrained by defined sequence tendencies,                Methods
such as hydrophobicity or secondary structure preference that                Regression model training. In previous work we synthesised and explored the
direct most sequence-based predictors. As a result, we discovered            aggregation potential of 940 peptide sequences derived from both functional and
unconventional amyloid-like sequences, including sequences with              pathological amyloid-forming proteins, which were supplemented with additional
                                                                             data on 462 hexapeptides derived from other published sources to develop
low aliphatic content, high net charge or sequences with low                 WALTZ-DB 2.032, the largest public comprehensive repository of experimentally
intrinsic structural propensities. Clustering amyloid sequences by           defined amyloidogenic peptides. In total, 1402 hexapeptide sequences from
t-SNE two-dimensional reduction revealed the substructure of                 WALTZ-DB were modelled on the 140 backbone structures of the Cordax library,
amyloid sequence space. Apart from a large cluster corresponding             leading to the generation of 196,280 models. The thermodynamic stability of each
                                                                             model (ΔG, kcal mol−1) was calculated using FoldX and fed into a logistic
to sequences found in the hydrophobic core of globular proteins,             regression model (Fig. 2c). This model was used to distil the aggregation propensity
we also found clusters corresponding to surface-exposed amyloid              from the free energy values. Towards this end, from the calculated ΔGs, we isolated
sequences in globular proteins, small aliphatic functional amy-              50 representative energies using a recursive feature elimination algorithm (using
loids, N/Q/Y prions, strongly helical and intrinsically disordered           the RFE module of the SciKit-learn python package33 and selecting for the set of
sequences which could be compatible with liquid–liquid phase                 templates that maximised the AUC). As a result, each sequence is described with a
                                                                             50-dimensional vector. Next, the data were transformed in order to be constrained
responsive sequences. Our analysis highlights the discovery of               in a scoring range between 0 and 1, using a Min/Max scaling algorithm. The
highly soluble, yet amyloid-forming, sequences and suggests that             regression model was trained with L2 penality and regularisation strength (C) equal
the largest portion of the remaining uncharted amyloid sequence              to 1. Both scaling of the estimated ΔG and the machine-learning model were
space is hidden in this corner (Fig. 6a and i). Indeed, most                 developed using the SciKit-learn python package66.
archetypal hydrophobic APR sequences have low intrinsic solu-
bility. As a result, low solubility and aggregation propensity are           Model pipeline. Cordax receives a protein sequence in FASTA format as input,
properties that are often wrongly used interchangeably. It is                which is fragmented into hexapeptides using a sliding window process. Sequences
                                                                             are then threaded against the fragment library utilising FoldX and the derived free
important to differentiate between the initial solubility and                energies are translated into scoring values for every peptide window. An energe-
aggregation propensity of a peptide, as soluble monomeric                    tically fitted model is selected as the closest representative of the overall topology of
sequences can often self-assemble, at later time points, into                the amyloid fibril core for each predicted window and is provided as output in
insoluble amyloid fibrils. The APRs that are newly discovered by              standard PDB format to the users (Fig. 2c). An amyloidogenic profile is generated
                                                                             by scoring every single residue of the input sequence with the maximum calculated
Cordax are often highly soluble in their monomeric form, even                score of the corresponding windows, followed by a binary prediction for every
more than the already known polar APRs from the yeast prions,                segment. Finally, calculated energies are stored automatically in a growing local
as they contain many charged and polar residues, yet surprisingly            database and can be retrieved, thus creating a ‘lazy’ interface that bypasses unne-
can still assemble into amyloids. Overall, our approach demon-               cessary computation for recurring sequence segments or future runs.
strates that the increasing structural information on amyloids
now allows for more fine-graded structural rule learning of the               Datasets. Performance assessment of Cordax was carried out utilising two indi-
amyloid state.                                                               vidual data sets for peptide and protein aggregation propensity detection. Further
                                                                             validation of the method was performed against an independent subset screen of 96
   Recent developments in microcrystal electron diffraction have             hexapeptides sequences.
enabled structural determination from nanocrystals that are not                  For peptide aggregation propensity, we used a dataset of 1402 non-redundant
typically suited for traditional X-ray diffraction and have                  hexapeptides contained in the WALTZ-DB 2.0 repository32. This database is the

10               NATURE COMMUNICATIONS | (2020)11:3314 | https://doi.org/10.1038/s41467-020-17207-3 | www.nature.com/naturecommunications
You can also read