2030 A changing Europe in a different World - Trends & Business Models January 2016 Version 1.0 - International Certified ...
←
→
Page content transcription
If your browser does not render page correctly, please read the page content below

2030
A changing Europe in a different World

             Trends & Business Models

                              January 2016
                                Version 1.0
“Τα πάντα Ρει”
                                                                    Ηράκλειτος

Contents
1. MegaTrends
2. Emerging Business Models
3. Delphi Study (to be conducted)
4. Annexes

Abbreviations

ASEAN-5     Indonesia, Malaysia, Philippines, Thailand, Vietnam
BRIC        Brasil, Russia, India, China
FDI         Foreign Direct Investment
GHC         Green House Gas
N-11        Next Eleven: Bangladesh, Egypt, Indonesia, Iran, Mexico,
            Nigeria, Pakistan, Philippines, South Korea, Turkey, Vietnam
RTO         Research & Technology Organization
Introduction
Scope

This report is compiled by Phemonoe Lab, aiming to briefly describe five
megatrends that will shape Europe, China and the rest of World over the next 20
years. All the trends have serious impacts on businesses, markets, societies, and
imply the need of specific strategies to address the risks and opportunities of the
future.

Methodology

The first step was the identification of relevant trends and future studies
worldwide, followed by verification and analysis, in order to identify major
megatrends and emerging business models.

In parallel, data from different sources were collected and used to further back
up and verify the desktop work.

Finally, a Delphi study (to be conducted) will provide further input on the Trends,
Disruptive Business Models, and China.

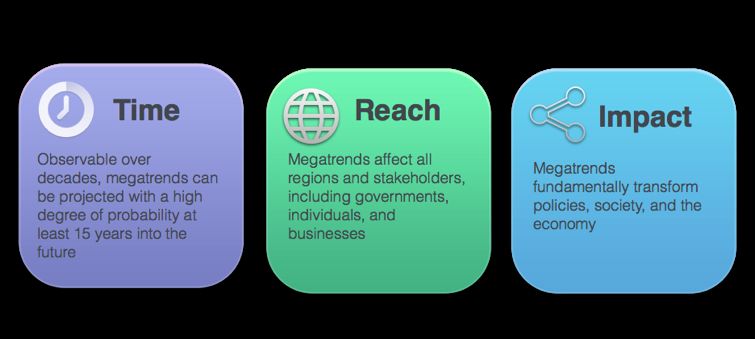
Megatrends towards                2030
The concept of megatrend was first introduced by John Naisbit, in the book
Megatrends (Naisbitt, 1982), describing a long-term, transformational process with
global reach, broad scope, and a fundamental and dramatic impact (graphically
presented bellow).

The project team has initially identified around 20 Megatrends, regularly cited in
academic papers, foresight books, executive reports, and the media. All these
trends have substantial impact on the European and Global economy, society, and
policies; however we have decided to focus on 5 of them, which are creating the
greater opportunities and risks for the businesses and public RTOs.
T1         Richer & Older [Demographics]

• 8.3 billion people on earth by 2030 (from 6.9 billion today); 33.2 the median age;
• 59% the global urbanization rate;
• China’s infertility rate rose to around 12.5% of people of childbearing age, more
  than four times higher than it was 20 years ago.

The human race is growing older and richer with a growing middle class and
widening inequalities across societies. By 2030, the global middle class is expected
to reach 5.0 billion, from current’s 1.8 billion. In addition, the global middle class is
expected to grow by 66%, to a total of about 3 billion more consumers with
increased purchasing power and expectations, while China’s cities alone will be
home to nearly 1 billion people.

At the same time, life-expectancy is increasing by two years every decade, while
fertility rate is declining. As an outcome, the latest growth estimates for the world
population contrast with earlier forecasts of a substantial global population

increase. Over the next 20 years, the world population will increase by 1.4 billion
people to 8.3 billion, up 20% (0.9% or 70 million people p.a.) from 6.9 billion today.

The decline in fertility rates in many emerging countries could be greater than
forecast and off-set continuing high-fertility rates in Sub-Saharan Africa and in India.
With life-expectancy overall increasing, the world population could peak at around
8.3 billion towards 2030, followed however by a gradual fall to reach the current
levels towards the end of the 21st century. As expected, developing countries will
grow nearly seven times faster than the developed countries, increasing their share
of the global population to 85% (from the current 82%).

Changing demographics will have a profound impact on geopolitical and economic
trends worldwide affecting global trade, services, and business models.

Another direct and already seen result is the changing workforce. In many European
countries it is estimated that the workforce has reached its peak (or it will reach it in
the next few years), and the working population in Europe is expected to decline by
21 million by 2030. Europe-based organizations will face radical shifts in workplace
design, agility of employees and leadership styles. Managing diversity and
exploiting talent throughout Europe will be key challenges.

As the population rises, the urban share of the population will also continue to rise
at high speed (8.5%) and growth will even accelerate compared to the last 20 years
(7.8%). By 2030, 4.9 billion people, or 59% of the world's population, will live in
cities, starting from 3.5 billion today (50% of the world's population). This means an
increase of 40% in absolute numbers. The developed countries will still have a far
larger share of urban population than the developing countries in 2030. However,
the gap narrows by 2030, as the urbanization process is more pronounced in the
developing countries.

2030 Projections
■ Ageing will be global. The world population growth will slow and peak, possibly
within 20 years, at around 8.3 billion people;
■ A new global ‘middle class’ in the emerging countries will expand rapidly, mainly
in cities, and particularly in Asia;
■ Dynamic and technologically empowered, this new group will be especially
vulnerable, subject to increasing inequalities and unprecedented ageing;
■ Inequalities within countries will widen worldwide;
■ Migration may well further increase, in particular along South-South routes.

Uncertainties
■ Ageing in the emerging economies may affect their economic growth and
domestic stability;
■ Growing inequalities in access to resources (education, health services) may
trigger serious social discontent.
T2          Globalization 2.0

• The world exports as share of GDP will raise from 26% (2010) to 33%
  (2030).
• GDP growth will continue at a rate of 1.8% p.a. in Developed countries, 7.9% in
  BRICs, and 5.9% in the Next Eleven.
• The middle class in the BRIC countries will grow by 150% to 2.0 billion people, and
  by 116% to 730 million people in the N-11 countries.

Globalization 2.0 is fundamentally different from Globalization 1.0, with the East
playing a far more important role than being the workplace of the West. Western
companies will still operate in the East, but under different circumstances; goods,
people and capital will flow in multiple directions (not just from West to East, but
also from East to West).
As economic power gradually shifts eastward (with China playing a central role),
trade between emerging markets will flourish, raising new risks and opportunities for
the European companies, as the East will rely less on the West for goods and
services.

This raise of the emerging economies, will coincide with a raising urban middle
class in these countries, that will set its own set of consumer demands, requesting
further “glocalization” of products and services. As an outcome, different strategies
and operational models will be a necessity for multinational corporations. In 2008,
Goldman Sachs estimated that the number of “middle-incomers” ($6,000-30,000
annual income) was growing at a record 70 million per year, and expected to reach
a growth rate of 90 million per year by 2030, adding 2 billion people into the middle
income category. Even more impressively, McKinsey foresees that consumption in
emerging markets will total $30 trillion annually by 2025, becoming “the biggest
growth opportunity in the history of capitalism”.

It should be however underlined that Globalization 2.0, is not replacing Globalization
1.0 that continue to exist, with Western multinationals continuing to operate distant
low-cost bases. Nevertheless, many of these bases, due to increasing labor costs in
the emerging economies (e.g. China), are expected to move to other countries (e.g.
Bangladesh, Indonesia, Iran, Pakistan, Philippines, Vietnam, Nigeria, Egypt, etc).

2030 Projections
■ The middle class in the BRIC countries will grow 150%, from 0.8 billion people
today to 2.0 billion in 2030, raising enormously the purchasing power of these
countries.
■ The emerging equity markets will grow significantly by 9.3% p.a. to USD 80 trillion
by 2030, while global equity market capitalization (in fixed 2010 USD) will increase
by 6.2% p.a. from USD 43 trillion to USD 145 trillion in 2030.
■ By 2030, the combined real GDP of the N-11 will equal 30% of the BRIC's GDP
and 11% of the world's GDP.
■ The ASEAN-5 GDP will equal 4.0% of global GDP in 2030 (almost as today).

Uncertainties
■ The political and financial role of Europe, and USA
■ The political stability of BRIC, and ASEAN-5 countries.

T3          Technologies and the Information Revolution

• The number of mobile broadband users is going to reach 4,693 million by 2030
  (from 0.788 million today). The average broadband speed will grow by a factor of
  100 or more, from less than 1 Mbps to more than 100 Mbps in 2030.
• By 2025, more than 100 billion “things” will be connected to cloud computing
  systems.
• By 2020, European industrial companies will invest €140 billion annually in
  industrial internet applications
• 5 million jobs will be lost by 2020 due to rapid advancements in the fields of
  technology, such as artificial intelligence and machine learning (fourth industrial
  revolution).

The next decades will be shaped by the process of converging (and even merging)
technologies through interdisciplinary developments across scientific fields.
Platforms will be the main field to drive industrial development and business
intelligence. Nanotechnology, biotechnology, IT, cognitive science, and robotics will
drive innovations in several fields like health, nutrition, and logistics and will rapidly
change our lives. The speed of the changes will be further accelerated with the
support of artificial intelligence and the advent of quantum computing.
The innovation potential of the developed countries and the EU will remain ahead of
the emerging economies and the N-11, as they have more financial and personal
resources available. However, by 2030 some other countries such as China and
India will become major competitors of the latest technologies and innovations from
developed countries.

The importance of technology will dramatically increase within the next twenty years
as new technologies are being adopted faster and innovation cycles become
shorter. This trend will continue by 2030 as product life cycles become even shorter,
obliging companies to be always alerted and invest more heavily on R&D. The
speed up of technology diffusion will reduce the technology gap between
developed and developing countries (although income is an important asset for
technology adoption) and will help reduce poverty and address several key
challenges (clean water, food availability, etc).

At the same time digitization is a booming worldwide phenomenon, with western
societies at the front but with emerging economies and undeveloped countries
approaching with a quick pace. We are always connected and the separation
between personal, private, and professional lives is becoming unclear.

The range of innovations of the next 20 years cannot be easily predicted, however
important developments are expected in:

     •   Artificial Intelligence (A.I.) is anticipated to surpass human intelligence
         around 2030.

     •   The miniaturization of products, with nanotechnology remaining in the heart
         of future innovations, and affecting several industries such as ICT, and
         Health.

     •   Medical innovations, that will significantly improve quality of life (especially
         for the elderly), and prolong life expectancy.

     •   Energy sector; it is expected to have renewables vastly replacing the use of
         fossil fuels, mainly due to innovations in solar energy, geothermal energy,
         energy efficiency & storage, and possibly in nuclear fusion.

     •   Synthetic biology to produce bio-fuels, personalized medicine, healthier
         food, etc
2030 Projections ■ A technological revolution based on new industrial production, bio- scientific, communication and digital processes will transform societies; ■ The speed of technological change is accelerating; ■ Autonomous decision-making processes will rapidly rise; ■ Europe and the United States will remain world leaders in science and knowledge-creation, though worries persist in Europe about applied research. Uncertainties ■ The speed of convergence of technologies remains uncertain; ■ Potentially fundamental impacts of technologies on people and societies at large could trigger unpredictable social reactions.
• Global energy consumption is rising.
• Sea level rose 19cm from 1901 to 2010 and
could rise an additional 26-98 cm by the end of
the century.
• GHG emissions are about 54Gt of CO2
equivalent per year, and estimated to reach 68Gt
in 2030.

T4        Climate Change

• Half of the bee colonies in USA and Europe
have collapsed during the last 2 decades.
• EU is on track to achieve its 2020 climate/
energy objectives and committed to reduce GHG
emissions by 40% from 1990 levels by 2030
(from 1990 levels), and to increase by 27% from
1990 the share of renewables.

Global change is real and almost irreversible. Nature’s capacity to absorb human
activity is diminishing, and global warming is increasingly causing extreme weather
events around the world, leading to death, displacement and serious economic
damage.

Global energy consumption is raising, GHC and global waste are increasing, and
ecosystems (like bee colonies) are collapsing. A fifth of the world’s irrigated soils are
affected by salt, and this may cut crop yields by 70%.

At the same time, as we have seen earlier, the global middle class will increase from
1.8 billion in 2009 to 4.9 billion in 2030, raising interest on ecosystem services, and
in 2014 for the first time in four decades, the world economy grew without a parallel
rise in CO2 emissions.
It is estimated that adaption costs to climate change effects are likely to reach $300
billion per year by 2050, even with strong emission cuts, entailing a huge risk for
countries and corporations not prepared to address this issue. Climate change will
mostly affect the most fragile areas and populations in the world that depend on
agriculture and fisheries, and may have serious consequences in terms of migration
and economic prospects and performance.

On the other hand according to UNEP’s Towards a Green Economy report, investing
2% of global GDP ($1.3 trillion per year) into 10 key sectors could kick-start the
transition towards a low-carbon economy. In any case, climate change effects are
expected to bring focus upon new technologies like electric cars, saltwater
agriculture, carbon capture and reuse, solar power satellites, maglev (magnetic
levitation)trains, urban systems ecology, cultivated meat, and to the establishment
of global climate change collective intelligence systems to support better decisions
and keep track.

2030 Projections
■ In 2030, between 1.9 and 2.6 billion people are likely to suffer from a lack of water.
■ GHC emissions are estimated to reach 68Gt in 2030.
■ Large-scale exploitation of natural resources will remain concentrated in a small
number of dominant countries and regions;
■ Food and water supply will be about managing scarcity — a problem that will
keep worsening due to climate change;
■ By 2030, 93% of the rise in energy consumption will be in non-OECD countries.

Uncertainties
■ The successful implementation of the Paris (2015) UN Convention on Climate
Change.
■ The willingness of USA and China to apply stricter policies to reduce GHG
emissions.
■ The price of fossil fuels. In addition, OPEC and Russia may lose market power
because of United States shale gas production.
■ The extent of rise in sea levels and ensuing natural disasters is uncertain, while
more than 60 % of the global population lives in coastal areas;
■ Large-scale migrations triggered by floods, droughts and food shortages may
affect Europe;
■ Arctic icecaps melting quickly and opening up new opportunities for natural
resources and transport but with incalculable consequences for biological balance
and dangerous feedbacks that will further accelerate climate change;

   •   By 2030 global water demand could be 40% more than the current supply,
       and half the world could be living in areas with severe water stress by 2030.
   •   Some 30% of global cereal production could be lost in current production
       regions due to water scarcity, yet new areas in Russia and Canada could
       open due to climate change.
T5 Scarcity of Resources
• Over the last 20 years, inflation-adjusted food prices have doubled and may
rise by an additional 150% by 2030.
• BP forecasts a 37% increase in world energy demand from 2013 to 2035, of
which 96% will come from emerging economies.
• By 2035, China is expected to consume nearly 70% more energy than the
U.S.
As global population increases, and climate change effects are worsening, the
problem of food and water resources management will be central in governmental
policies. At the same time, the continuous exploitation and the growing demand of
other natural resources like metals and fossil fuels, will increase geopolitical
tensions and further raise the issue of resource management. This is because large-
scale exploitation and extraction of natural resources will still be highly
concentrated in a small number of producer countries. Across nineteen (19)
resources (including crops, timber, fish and meat, metals, fossil fuels and fertilizers)
the three largest producers on average account for 56 % of global production. Theeight dominant players are China, the United States, Australia, the European Union, Brazil, Russia, India and Indonesia (ESPAS, 2015). At the same time, even in a best-case scenario, the effects of the present rising energy consumption will be lasting and even become a major problem in the future. The increase in global energy consumption will be linked mainly to population growth and rising income of the global middle class. The world is in a race to quickly make enough safe energy fast enough to meet the growing needs of an expanding and wealthier population. Solar power, and wind energy are offering an attractive alternative, while at the same time, some 58% of existing reactors are past the 30-year lifetime and should be decommissioned; however, fewer than 100 nuclear plants are scheduled to be closed by 2020. In 2030, liquid fuels are expected to provide 31% of the world's energy, down from 35% today and 38% in 1990. Number two in 2030 will be coal at 27%, slightly higher than in previous years – 26% today and 25% in 1990, followed by natural gas with 23% in 2030, the same figure as today. 2030 Projections • 62% of the seafood eaten in 2030 will be farm-raised and 70% of that will be consumed in Asia. China is expected to produce 37% of the world’s fish by 2030, while consuming 38% of the world’s food fish. • By 2030, Japan solar could reach 100GW of installed PV generation capacity, or 11.2% of electricity demand. • Renewable energy sources can meet 57% of China’s electricity demand in 2030 and 86% by 2050. • Oil and gas production in the Caspian region will grow substantially by 2030; Kazakhstan and Turkmenistan lead the growth in oil and gas, respectively. • Use of genomics to create plants that produce hydrogen instead of CO2; High- altitude wind generators will be broadly available. • Some rear metals will run out. Uncertainties
• OPEC and Russia may lose market and political power due to United States
  shale gas production.
• Positive developments with nuclear fusion could change the energy landscape.
• Price of oil.
Emerging Disruptive Business Models – The Game
Changers

As traditional industries grow and mature, their core technologies often become
commodities and thus their differentiating competencies are increasingly coming
from their service components, switching the innovation paradigm from product
innovation to service innovation. In parallel, the avalanche of technological
innovations is continuously creating new markets and risks for corporations and
countries not able to follow the speed of changes.

The term disruptive business model is exactly used to describe these new markets
created by new technological innovations or by old technologies that are used in
new ways.

I. Baby you can drive my car – The Rise of sharing Economy (the
on-demand economy)
The sharing economy is the result of the rapid technological breakthroughs, the
increasing urbanization, the demographic shifts and the rise of millennial. These
trends are shaping new business models that emphasize access to products and
services over their outright ownership.

This model generates revenue by the exponential need of people to have things
done right away. Speed and convenience matter the most and the on demand
company provide services that make the lives of its consumers easier. The on
demand model is a business model that holds a high risk but when successful may
disrupt the entire industry.

This model grants customers the use of the product without buying it. “Everything is
a service”. These access-over-ownership companies generate revenue by using the
power of the sharing economy, by facilitating the actions between people thus
making it needless for these companies to invest in products or people.

Citizens in 2030 will be able to reshape economic developments with the rise of the
sharing economy. Several successful sharing economy businesses (e.g.Uber,
Airbnb, RelayRides) are popping up every day, presenting a real alternative business
trend, with more than 10,000 companies, allowing the sharing of consumer
products, houses and various services. At the same time, remains unclear if most of
these cases are legal, and several of these companies are hostilely confronted by
the governments and the institutions they are challenging.

However, the trend is increasing and it seems that with the further adoption of e-
payment services and e-currencies, more collaborative economy businesses will
emerge around the world. The trend will be further enhanced by a global trend of
millennials towards efficient working models, and the desire to get the most value
from the things they own.

It is true that current regulations, in most of the cases, set obstacles or even prohibit
sharing economy ventures. This is mainly due to the extensive regulatory framework
that protects workers, consumers and property owners. On the other side, better
ideas come up over time and policy is probably going to be adapted to
accommodate these new ideas; i.e. modernize the regulatory structure of industries.

Main Characteristics

• Use of the product with buying

• Catalysed by digital breakthroughs, and e-payments

Examples

• Uber, Airbnb, Zipcar, ParkCirca, Peerby, Operator

II. Glocalizing on growth regions

As many of the developed countries face a shrinking population, companies in
those countries have limited potential to grow by acquiring new customers.
Therefore, companies need to focus on countries with both a growing
population and a growing income per capita. The countries that will increase
their population by more than 20 million people within the next 20 years and reach a
per capita GDP above USD 10,000 in PPP will be India, China, Nigeria, Indonesia,
Brazil, Philippines, Egypt and Mexico (in descending order according to total
population growth).

What is more important is that the size of the “global middle class” (defined as all
those living in households with daily per capita incomes of $10-100 in PPP terms)
will increase from 1.8 billion in 2009 to 4.9 billion by 2030. The new Urban middle
class in the emerging economies, will further demand for international brands, but
also has special needs and require tailor-made approaches, customized products,
and special services.

In this international competitive environment, Glocalization is the concept that in a
global market, a product or service is more likely to succeed when it is customized
for the locality or culture in which it is sold. In this new reality, international
corporations will have to invest more (in marketing & sales, R&D, human capital, etc)
in BRICs and the N-11, in order to seize the opportunities and address the risks
(political instability, cultural & social differences, etc).

Main characteristics

• Substantial opportunities in emerging countries. Demand for international brands,
  luxury products, personalized services (e.g. financial), etc

• Opportunities in infrastructure projects, smart technologies, services (e.g.
  security)

• Markets with greater risks (e.g. political instability).

Examples

• McDonalds illustrates the concept of glocalization by changing their menus to
  appeal to local taste and customs.
• Gillette introduced the low cost razor ‘Gillette Guard’ priced at about 15 rupees (~
  $0.33) in the Indian market.
• Luxury retail brands like Bottega Veneta, a unit of PPR, and Canali, an Italian
  men’s fashion brand launched limited-edition of clutch (Knot India) and closed
  neck jacket (bandhgala worn by Indian men) specifically for the Indian market.

III. The silver economy - the 60+ market

Due to rising life expectancy, rising infertility rates and declining birth rates, global
median age is rising. In many developed countries, people aged 60 and over will
become the largest segment. In 2030, 29% of people in the developed countries
will be older than 60, compared to 22% today. Consumption spending among those
aged 60 and over rose 50% faster than those under 30 in the past two decades
according to Eurostat, while the global spending power, of the now-elderly “baby
boomer” generation will reach $15tn by 2020.

In addition, an increased segment of the over 60s population in 2030 will be still
dynamically working, due to the increase of life expectancy, the increase of the
retirement age, and the regenerative medicine developments. Corporations will have
to adapt internally, adjusting organizational structures and process to fully exploit
their know-how.

This demographic change will oblige companies to draw focus on people in this
segment and work towards understanding and addressing their special needs.
This special group is heavily consumption-driven, enjoy quality service and
appreciate easy-to-use products. The 60-year-old in 2030, will look younger and be
fitter than the one today, and will look of different products, and certainly not
products for the elderly of today.

Finally, Imagine that as life expectancy is increasing, consumption patterns are also
changing, altering the decisions of the “seniors”. In 2030, a 70-year-old will be
planning his next autonomous driving car purchase and a 60-year-old will still think
about building her own home.
By 2050, the number of those over 65 will outnumber children aged five and under
for the first time, while Pim van der Jagt, managing director of the Ford Research
Center speaking to Financial Times , said that “100-year-olds driving cars will not be
abnormal in the future”.
Main characteristics
• Consumer market dominated by older adults. Consumer spending by the over 50s
accounts for about 60% in USA, and 50% in UK.
• Companies are moving away the “boring, big and beige” design model for the
older people.
• New opportunities in property development, car-making, special technology
products, financial services, pharmaceuticals and health services.
Examples
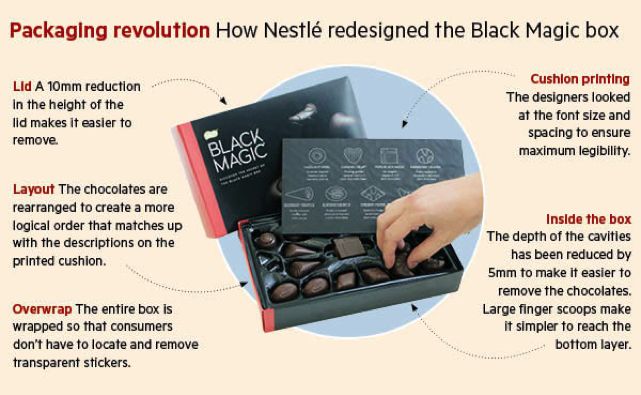
• Nestlé had arthritic hands in mind when it redesigned the jar for its Nescafe
Gold instant coffee in Australia, giving it a “waist” to make it easier to hold
Photo: Financial Timesand an easy peel foil cover. In the UK, the group reworked its Black Magic
chocolate box – which has been around since the 1930s – by increasing the
font size on the cover, reorganising the chocolates so they align with the
pictures on the lid and widening the finger scoops.
• Danone has developed Souvenaid – aimed at early Alzheimer’s sufferers –
while Nestlé launched its Yiyang milk in China for baby boomers concerned
about cardiovascular health.
IV. The rise of the services: Big Data & Micromanufacturing
In the early 2010s, the Boston Consulting Group (ESPAS, 2015) considered that 4 %
of United States GDP could be related to the Internet and the economies or the new
business opportunities it had generated. In the future, the internet will be drastically
fused by the physical world (refrigerators, air quality, sleeping patterns, sex
behaviour, etc) and the great data science companies of the future sensor-packed
world will sell intelligent information, and provide tailor-made services to the
connected citizens.
In parallel, virtualization is rapidly creating new business models, disrupting the
powerful relationships between corporations and customers, allowing the latter to
directly communicate, interact, buy & sell, and check the reputation. In this
environment, companies will face the challenge of big data management. If they do
not master it, their competitive position will seriously weaken, especially as big data
are expected to be the starting point of a new business model based on converging
technologies.
At the same time 3D printing is expanding fast, and has just started to tap its
potential. Prices of simple 3D printers have already fallen to less than $500, allowing
individuals and micro-businesses to become industrial producers, providing
personalised services and tailor-made products to consumers. Future versions of
today’s primitive 3-D printers, will give us the ability to make devices at home,
creating a new reality of highly distributed manufacturing.By 2030, as technologies and innovations become ever more critical for success and innovation cycles become shorter, companies need to strengthen their R&D positions, especially mid-sized ones, possibly through establishing partnerships with business partners or RTOs and investigate innovation outsourcing. Main Characteristics • The ‘Internet of things’: big data and data-mining, cloud computing and super- calculators, brain-machine interfaces and sensors • Opportunities of micro-businesses in 3D and 4D printing but also risks of counterfeiting. • Multiplication of big data will affect and transform the whole of society. Collecting, purchasing and controlling these data will be regarded as an essential resource for the economies and societies of the future. • Ubiquitous sensors will govern communications devices (including future smartphones), clothes, houses, vehicles and drones. Examples • Many cloud printing services, like Shapeways, Kraftwurux, iMaterialise or Cubigy offer today templates that let you design or customize objects online. • Crayon Creatures offers to turn any child’s drawing into a three-dimensional toy for $130. V. Crypto-currencies & blockchain The global economic crisis and the collapse of the banking system in several countries around the globe have increased voices, even between entrepreneurs and venture capitalists, for alternative systems, like e-currencies for building a new digital finance industry. The main innovation related with crypto-currencies, is the
ability to carry out transactions without the need for a trusted third party; i.e. a move
towards trust-less transactions. This mechanism could work to eliminate the role of
many intermediaries, thereby reducing radically transaction costs.

According to backers of the open source digital currencies (like bitcoin), these
systems will become the basis for a future low-cost standards-based financial
system independent of the traditional banking system. This new financial system
may significantly reduce transaction costs and boost global online shopping of
products and services. The disruption in finance is believed to be analogous to the
disruption that the media and communication industries faced with the rise of
internet.

The main handicap of crypto currencies is the high-volatility of the exchange rate,
mainly due to lack of a valuation method; however new crypto currencies are
addressing this issue with different approaches (like Hayek backed by gold). Today,
regulators in US are still sceptic but changing, while Brazil, Germany and Russia
keep a more open stance, giving space and opportunity for the creation of many
start-ups, while China is also the focal point for many innovations in the field (while
UK is officially looking to regulate the digital currencies market).

Although the focus is naturally drawn on financial services, there are dozens of
potential applications for blockchain (the technology behind the crypto-currencies),
and several investments and new concepts are appearing in all the major industries:

•      Technology, media, and telecommunications: Applications include support
for low-cost micropayments, processed without fees imposed by existing payment
networks, which would enable, for instance, a newspaper website to charge readers
per article or per page rather than per month. Some are also looking at blockchain
as a way of securing intellectual property and digital creative works such as images
or music.

•      Consumer and industrial products: Blockchain’s most obvious application
is as an alternative payment platform in retail, with several advantages. For
example, in travel and hospitality as well as retail, blockchain may offer a superior
means of powering loyalty-points programs.
•       Life sciences and health care: The health care sector is starting to show
interest in blockchain technology as a means of securing digital assets, such as
health records.

•       Public sector: Several blockchain-based applications will be increasingly
becoming available in the public sector, particularly where existing record-keeping
methods are inadequate. Examples include secure voting records, vehicle registries,
fraud-proof government benefits disbursements, and digital identities for
individuals, such as refugees, who lack government-issued identity documents.

Main Characteristics

• Blockchain technology

• Increased security for various digital transactions

Examples

• Several of digital currency groups have received VC funding and provide
    alternative financial services, like Circle Internet Financial, and Ripple Labs.

• DocuSign, a provider of electronic-signature and digital transaction-management
    technology, created an app for Visa’s “connected car” proof of concept; the app
    integrates with the bitcoin blockchain and can record contracts. It is intended to
    simplify the car buying and leasing processes and enable auto-based secure
    payments.

VI. The circular economy – Remanufacturing Europe

A circular economy is a global economic model that aims to decouple economic
growth and development from the consumption of finite resources. Increasingly,
companies see tremendous opportunity in this model, as it not only allows them to
capture additional value from their products and materials, but also to mitigate risks
from material’s price volatility and supply.

The current operation of the economy can be largely described as linear: raw
materials are retrieved from nature and used to massively produce products, which
are then consumed and eventually disposed of. This model produces enormous
levels of waste and pollution and creates dependence between economic development and inputs of raw materials. In a world of finite resources, this model cannot work in the long run, and there are, already today, indications that it is reaching its limits. The new concept of circular economy aims to decouple economic growth and development from the consumption of finite resources. It is restorative by design, and focuses on keeping products, components and materials at their highest utility and value, at all times. Unlike a linear economy, it is about optimizing systems rather than components. This includes careful management of materials flowing in both biological and technical cycles. In technical cycles, materials are maintained, reused, refurbished and (as a last resort) recycled. In biological cycles, non-toxic materials are cascaded and eventually returned to the soil, thus restoring natural capital. The tighter the cycle the more economic value is retained. Economic opportunities from implementing a circular economy are tremendous. Just in terms of materials costs, the model has been estimated to enable savings of USD 630 billion for medium-lived complex goods in the EU and USD706 billion for fast-moving consumer goods globally. Additionally, circular models allow businesses to mitigate risks from material price volatility and material supply, and comply with rising societal concerns on environmental issues, sustainability, and corporate responsibility. Main Characteristics • Strong technological base: it is the technological and scientific progress primarily that allows the circular economy to be realized. • Promotes interconnection of firms throughout the world, thus leverages modularity, versatility, and adaptability. • Think in systems: it requires coordination across multiple stakeholders to facilitate systemic change
• Rethink incentives: circular business models often require multiple forms of
capital. Also, creditworthiness deserves more attention as pay per use models run
the risk of attracting less creditworthy users

Examples

• Vodafone’s Red-Hot plan is a good example. You can rent the latest phone for a
  year and keep on exchanging it for a newer version. Assuming Vodafone is
  engaged in collecting the old phone, not only does this act as material collection
  and pooling but from a business standpoint also creates deeper customer
  relationships.

• Tata Motors Assured is a good example here. It’s more than a second hand car
  dealership. Cars are handpicked and refurbished in Tata workshops and then
  undergo a certification process. Customers are even offered financing options
  and warranty.

• Re-Tek UK Ltd is providing an example of how embracing ‘incentivised return’
  can generate revenue.

• Mazuma Mobile is an online mobile phone reuse and recycling service allowing
  consumers to unlock the cash value of their mobile phones – offering same day
  payments.

• FLOOW2 (the he first business-to-business sharing marketplace) facilitates the
  sharing of overcapacity of business equipment, but even the skills & knowledge
  of personnel that are under-utilised.

                                      Other new or less new disruptive models are:

The subscription model

The subscription model is a business model where a customer pays a returning
subscription price to have access to the product service. The constant revenue
stream from subscribers reduces uncertainty & often provides payment in advance, while allowing customers to become greatly attached to using the service and, therefore, more likely to extend the subscription. The revenue stream from recurring subscriptions often is greater than the revenue from the simple one-time purchases. Pioneered by: Newspapers and magazines Examples: Netflix, HelloFresh, Dollar, Shave Club, Kindle, One The freemium model The subscription model is a business model where a customer has free access to the basic service but is charged for additional features. The freemium model is used to build a large consumer base when the marginal cost of producing extra units is low. Giving the service away for free results in acquiring a lot of prospects very efficiently. The non-paying costumers results in input of data, feedback, notoriety, advertising opportunities, etc Pioneered: by software companies Examples: spotify, dropboc, linkedin, the New York Times, Farmville The free model The free model is business model integrated by companies that don’t charge the end users (directly). The data and the attention of the users is the currency. By offering the product or service for free it is easy to gain a lot of users. The more people that interact with the product, the more data that can be extracted from the users. Revenue is produced by selling user data or user’s attention, offering huge possibilities for targeting advertising. Pioneered by: search engines Examples: Google, Facebook, Snapchat
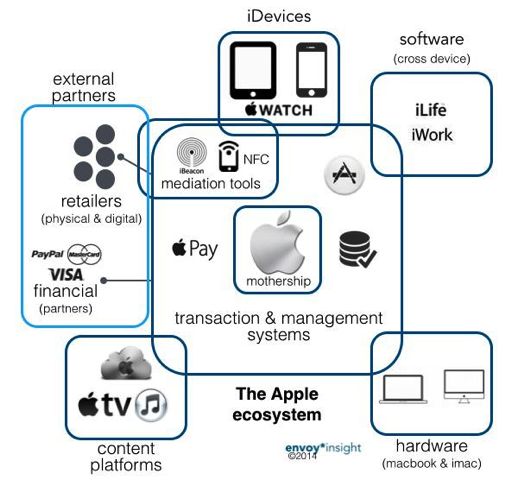
The market place

The market place is a business model used by a company that only facilitates a
platform where parties economically interact with each other. The market place is a
business model that defines a company as a big supplier of a service without the
company having the good or the service. It only facilitates the platform where
people interact with each other in any (economical) way. The market place
generates revenue by taking a percentage of any transaction between people on
their platform.

Pioneered by: classifieds in newspapers

Examples: eBay, Alibaba, Friendsurance, priceline.com, The Lending Club,
Beatport, Upwork etc (check link      http://www.digitaltransformationbook.com/10-
hyper-disruptive-business-models/ )

The experience model

The experience model is a business model used by company that provides the
customers with an unseen (user) experience. Customers of experience model
companies are willing to pay more just because of the special (user) experience they
get when interacting with the company or the product. Experience companies are
often situated in or penetrating competitive markets. In these markets you can
either offer the lowest price or provide consumers with the best experience.

Pioneered by: Apple

Examples: Tesla, Disney World, Tomorrowland

The ecosystem

One of the most powerful, disrupting business models. Companies build an entire
universe of products and services. The ecosystem business model only exists when
companies can offer enough services and or products that cause high level of
dependence of the customer. Once the customer is dragged too far in the
ecosystem, he can hardly get back out. If your iphone breaks you must buy a new
one… and a macbook and an apple watch

Pioneered by: Google and Apple

Examples: Google, Apple
Works Cited
Blundell-Wignall, A. (2014, June 16). “The Bitcoin Question: Currency versus Trust-
less Transfer Technology”, OECD Working Papers on Finance, Insurance and Private
Pensions. Retrieved Jan 15, 2016 from OECD: http://dx.doi.org/
10.1787/5jz2pwjd9t20-en
Chartered, S. (2010, 11 15). The Super-Cycle Report. Retrieved 1 11, 2016 from
Standard Chartered: https://www.sc.com/id/_documents/press-releases/en/
The%20Super-cycle%20Report-12112010-Vinal.pdf
CONSULTANTS, R. B. (2015). TREND COMPENDIUM 2030. Retrieved Jan 11, 2016
from CONSULTANTS, ROLAND BERGER STRATEGY: http://
www.rolandberger.com/gallery/trend-compendium/tc2030/content/assets/
trendcompendium2030.pdf
Daneshkhu, S. (2014, November 7). The Silver Economy: Baby boomers power new
age of spending. Retrieved January 30, 2016 from Financial Times: http://
www.ft.com/intl/cms/s/0/e9fc95c0-44b1-11e4-
ab0c-00144feabdc0.html#axzz3z00CYzWG
David Schatsky, C. M. (6, December 2015). Beyond Bitcoin. Retrieved January
2016, 22 from Deloitte University Press: http://dupress.com/articles/trends-
blockchain-bitcoin-security-transparency/#end-notes
DearMedia. (2015, July 8). 10 Hyper Disruptive Business Models. Retrieved
January 26, 2016 from Digital Transformation: http://
www.digitaltransformationbook.com/10-hyper-disruptive-business-models/
Economist, T. (2015, June 13). Uber: Driving Hard. The Economist , pp. 57-58.
ESPAS. (2015). Global Trends to 2030: Can the EU meet the challenges ahead?
Luxembourg, European Union: European Union.
Georg Vielmetter, Y. S. (2014). Leadrship 2030: The Six Megatrends You Need to
Understand to Lead Your Company into the Future. New York: AMACOM.
Hardy, Q. (2015, April 27). The sensor-rich, data-scooping future. International
New York Times , p. 16.
Henry Foy, A. W. (2014, 10 20). Companies target baby boomers and the $15tn
silver economy. Finanical Times , pp. 1,6.
Jerome C. Glenn, E. F. (2015). 2015-2016 State of the Future. Washington: The
Millennium Project.
Lins, C. (2015, June 18). Renewable Energy’s Record Year Helps Uncouple Growth
of Global Economy and CO2 Emissions. Retrieved Jan 20, 2016 from REN21:
http://www.ren21.net/wp-content/uploads/2015/06/REN21_press-release-
GSR-2015_ENGLISH.pdf
Naisbitt, J. (1982). Megatrends: Ten New Directions Transforming Our Lives.
Warner Brooks.
O'Leary, A. (2013, June 20). 3-D printing just starting to tap its potential.
International Herald Tribune , p. 14.
Parker, L. (2015, November 6). Visa’s blockchain use sets example for DocuSign’s
50 million users,. Retrieved January 18, 2016 from BraveNewCoin: http://
bravenewcoin.com/news/visas-blockchain-use-sets-example-for-docusigns-50-
million-users/
Sanderson, H. (2015, May 15). Digital currencies: A gold standard for bitcoin.
Retrieved Jan 15, 2016 from Financial Times: http://www.ft.com/intl/cms/s/
0/38d02382-f809-11e4-962b-00144feab7de.html#axzz3yAbxswyQ
Stein, J. (2015, Feb 9). BABY, YOU CAN DRIVE MY CAR. TIME , pp. 26-33.
Waters, R. (2013, Dec 2). Bitcoin backers eye revolution for banking. Financial
Times , p. 16.
ANNEX I: Data & Analysis

Demographics
Population projections, by age, in EU-28, according to the most
probable scenario

                         Data: Eurostat, Analysis : PRAXI/FORTH & Phemonoe Lab

Population structure in EU28
Data: Eurostat, Analysis : PRAXI/FORTH & Phemonoe Lab
Average Annual Rate of Change of the Urban Population, EU-28 (per
cent)
Source: United Nations, Department of Economic and Social Affairs, Population Division
(2014). World Urbanization Prospects: The 2014 Revision, custom data acquired via website.
Analysis: PRAXI/FORTH & Phemonoe Lab
Globalization
Regional shares in world GVC (Global Value Chains) income for all
manufactures (%)Data Source: Timmer, M. P., B. Los, R. Stehrer, G. J. de Vries (2013). "Fragmentation,
Incomes, and Jobs: An Analysis of European Competitiveness" Economic Policy, vol. 11(4),
pp 613-661. Analysis: PRAXI/FORTH & Phemonoe Lab
EU Imports from China (including Hong-Kong) (bil. Euros)
Data by Eurostat, Analysis by PRAXI/FORTH & Phemonoe Lab
FDI flows between China and the EU (mil. US dollars)Source: UNCTAD FDI/TNC database, based on data from the Ministry of Commerce
(MOFCOM). Analysis: PRAXI/FORTH & Phemonoe Lab
Resources
Energy Dependency in EU-28
Data by Eurostat, Analysis by PRAXI/FORTH & Phemonoe Lab
Technology
High-tech patent applications to the EPO by priority year
14.000
12.000
10.000
8.000
6.000
4.000
2.000
0
2000 2001 2002 2003 2004 2005 2006 2007 2008 2009 2010 2011 2012Data by Eurostat, Analysis by PRAXI/FORTH & Phemonoe Lab
Patent applications to the EPO by priority year
70.000
60.000
50.000
40.000
30.000
20.000
10.000
0
1980
1982
1984
1986
1988
1990
1992
1994
1996
1998
2000
2002
2004
2006
2008
2010
2012
Data: Eurostat, Analysis: PRAXI/FORTH & Phemonoe Lab
ICT patent applications to the EPO by priority year
18.000
16.000
14.000
12.000
10.000
8.000
6.000
4.000
2.000
0
2000 2001 2002 2003 2004 2005 2006 2007 2008 2009 2010 2011 2012Data: Eurostat, Analysis: PRAXI/FORTH & Phemonoe Lab
Biotechnology patent applications to the EPO by priority year
3.500,00
3.000,00
2.500,00
2.000,00
1.500,00
1.000,00
500,00
0,00
2000 2001 2002 2003 2004 2005 2006 2007 2008 2009 2010 2011 2012
Data: Eurostat, Analysis: PRAXI/FORTH & Phemonoe Lab
Patent applications to the EPO by priority year by NACE
Manufacture of food products
16.000
Manufacture of beverages
Manufacture of tobacco products
Manufacture of tex:les
14.000
Manufacture of wearing apparel
Manufacture of leather and related products
12.000 Manufacture of wood and of products of wood and cork, except
furniture; manufacture of ar:cles of straw and plai:ng materials
Manufacture of paper and paper products
Prin:ng and reproduc:on of recorded media
10.000 Manufacture of coke and refined petroleum products
Manufacture of chemicals and chemical products
Manufacture of basic pharmaceu:cal products and
pharmaceu:cal prepara:ons
8.000 Manufacture of rubber and plas:c products
Manufacture of other non-metallic mineral products
Manufacture of basic metals
6.000 Manufacture of fabricated metal products, except machinery
and equipment
Manufacture of computer, electronic and op:cal products
Manufacture of electrical equipment
4.000 Manufacture of machinery and equipment n.e.c.
Manufacture of motor vehicles, trailers and semi-trailers
Manufacture of other transport equipment
2.000 Manufacture of furniture
Other manufacturing
Civil engineering
0 Specialised construc:on ac:vi:es
2000 2001 2002 2003 2004 2005 2006 2007 2008 2009 2010 2011 2012Data: Eurostat, Analysis: PRAXI/FORTH & Phemonoe Lab
Τhe number of EU-28 high-technology patent applications followed a similar
development, falling from 12.0 thousand in 2000 to 4.0 thousand in 2012. This
considerable and continued reduction in patent applications filed with the EPO for
ICT and high-technology may reflect a number of factors, including the length of
patent procedures.
Source: http://ec.europa.eu/eurostat/statistics-explained/index.php/
Patent_statistics
Total intramural R&D expenditure (GERD) by sectors of performance in
EU28
Data: Eurostat, Analysis: PRAXI/FORTH & Phemonoe LabTurnover from Innovation in EU
Data: Eurostat, Analysis: PRAXI/FORTH & Phemonoe LabYou can also read