Identifying the Arbitrageurs on Mt. Gox: First Insights from the Leaked Dataset - WEIS 2019
←
→
Page content transcription
If your browser does not render page correctly, please read the page content below
Identifying the Arbitrageurs on Mt. Gox:
                     First Insights from the Leaked Dataset

                                Pietro Saggese1              Rainer Böhme2

                    Work in progress – please do not cite our results as final.

Abstract

We mine the leaked history of trades on Mt. Gox, the dominant Bitcoin exchange from 2011 to
early 2014, with the aim of identifying investors who performed two-point arbitrage between Mt.
Gox and three other cryptocurrency exchanges (BTC-e, Bitstamp, Bitfinex). Most importantly,
the availability of user identifiers per trade allows us to reconstruct the sequence of actions
executed by each investor. We match these sequences to ‘ideal’ sequences of arbitrage trades,
considering the price differences between exchanges and a user-specific estimate of transaction
costs. The latter involves a fee model that is inspired by the posted fee schedules and fitted to
empirical data. The subset of users whose actual series matches the ideal series best are potential
arbitrageurs. Out of about 125,000 users, we identify 2,631 potential arbitrageurs with all three
counterpart exchanges, and 14,291 potential arbitrageurs with at least one counterpart exchange.
We consider these numbers as upper bounds and argue that post-filtering techniques are required
to refine and later validate the results. A preliminary comparison of aggregate statistics between
potential arbitrageurs and non-arbitrageurs is given and discussed.

1       Introduction

Arbitrage, the simultaneous purchase and sale of the same asset in two different markets for a risk-
free profit, is a key concept in economics and finance. The concept is so important because the
absence of arbitrage opportunities is a necessary condition for market equilibrium [1]. Intuitively,
whenever an arbitrage opportunity emerges, some arbitrageur will exploit it until the mechanism
of supply and demand has eliminated the price difference. This ‘law of one price’ makes the
no-arbitrage principle a powerful solution concept in financial theory. It is a common foundation
of the Capital Asset Pricing Model (CAPM) [2, 3, 4], the theory of option pricing [5], the efficient
market hypothesis [6], and many other theories.
In practice, arbitrage is never risk-free. Since purchase and sale are not executed in an atomic3
transaction across markets, the arbitrageur bears the risk of incomplete execution or concurrent
price changes. Moreover, the asset traded in both markets may not be exactly the same, and
there may be political risk premia if the markets operate in different jurisdictions [7]. These
    1
      IMT School for Advanced Studies Lucca, Italy. pietro.saggese@imtlucca.it
    2
      Department of Computer Science, Universität Innsbruck, Austria. rainer.boehme@uibk.ac.at
    3
      Incidentally, this may change with decentralized exchanges on programmable cryptocurrency platforms.

Workshop on the Economics of Information Security (WEIS), Harvard, June 2019
Last revision: May 17, 2019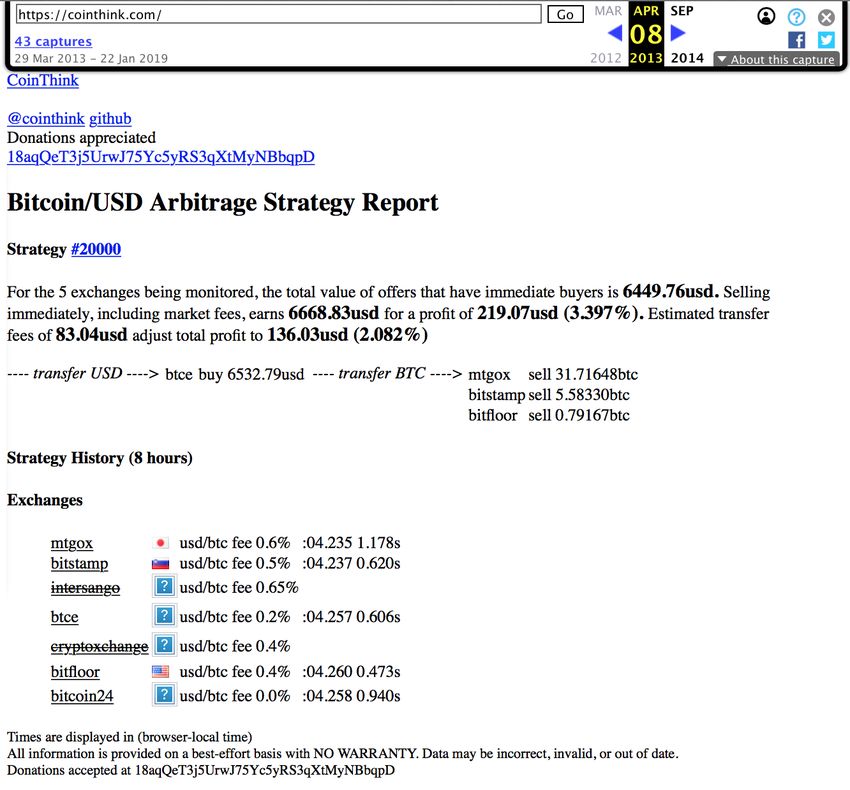
risks, in addition to other certain transaction costs, impose a lower bound on the price difference
needed for profitable arbitrage. The orthodox economic response, in line with the efficient market
hypothesis, is to imagine that many small arbitrageurs each take an infinitesimally small portion
of the risk (and hence profit). However, Shleifer and Vishny [8] challenge exactly this view in
their landmark work on practical arbitrage in financial markets:

        “[A]rbitrage is conducted by relatively few professional, highly specialized investors
        who combine their knowledge with resources of outside investors to take large posi-
        tions.” (p. 36)

The authors support this claim by referring to the bounded rationality of many investors, “millions
of little traders are typically not the ones who have the knowledge and information to engage in
arbitrage.” (p. 36) While this is plausible and likely cross-checked by expert market participants,
the evidence remains anecdotal. Most surprising to us is the fact that 20 years after these
statements were published, we still could not find any academic paper that provides an empirical
answer to the question ‘Who are the arbitrageurs?’.4 The answer to this question may not only
reconcile economic theory with the reality on financial markets, but also refine the assumptions
about arbitrageurs in theoretical studies that derive optimal trading strategies in the presence
of arbitrageurs [9, and the works cited therein].
In this work we seek to provide a partial answer from a very singular market, namely the exchange
market between convertible currency and cryptocurrency in the early years of Bitcoin. The choice
of market and time is opportunistic. We mine a leaked dataset of individual and identified trades
from Mt. Gox, a meanwhile defunct exchange that enjoyed a dominant market position before
its collapse in early 2014.
This manuscript mainly documents a data science approach to the problem. In the next section,
we provide some context and describe our approach. On a high level, our pipeline consists of
three stages: pre-processing, identification of potential arbitrageurs, and elimination of false
positives. Each stage poses specific challenges, which we document and propose solutions for.
We intentionally do not report results because we are not confident enough in the output of our
analysis, yet. Given the relevance of the question we tackle, we see the need for better validation
and we describe our ideas to this end. For these reasons, we appreciate feedback on all stages,
but prefer if the work in its current state is not cited for its “results”.

2       Background and Approach

2.1     Arbitrage in Cryptocurrency Markets

Bitcoin is a decentralized cryptocurrency system which records transfers between parties de-
nominated in bitcoin (units of cryptocurrency) in a public ledger. By contrast, exchanges are
centralized entities in the Bitcoin ecosystem that provide interfaces to conventional payment
systems by allowing its users to trade units of cryptocurrency against fiat money [10]. Typical
exchanges manage and match orders in a private limit order book, and update their customers’
account balances in cryptocurrency or fiat money as trades are executed. As a result, exchanges
are the place where price formation occurs. Trades on exchanges are kept in a private ledger and
have no effect on the public ledger unless users withdraw cryptocurrency from the exchange to a
    4
    Of course, we simply may have missed the relevant source and are grateful for pointers from our readers and
the workshop audience.

                                                      2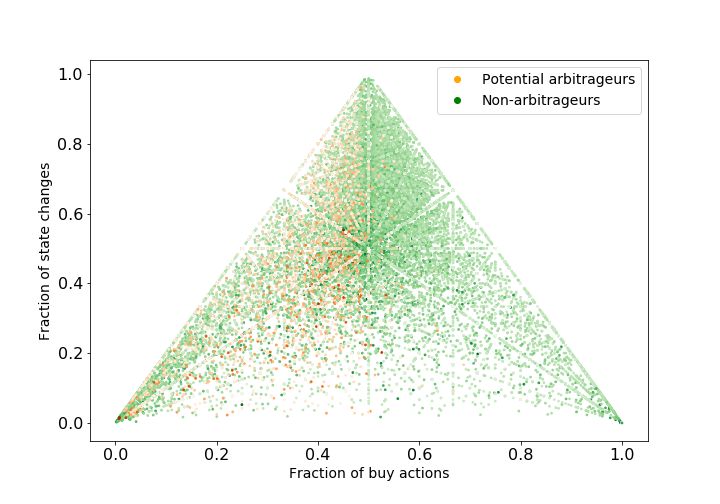
wallet under their own control. Most exchanges publish aggregate information about prices and
volume, but concerns about data quality exist since few cryptocurrency exchanges are regulated
and audited by the standards of conventional financial markets [11].
Intuitively, an arbitrageur observes a price difference between two exchanges, buys a bitcoin at
the cheaper place, then transfers it to the more expensive place, and then sells it there for a profit.
The transfer of bitcoins between exchanges would be observable in the public ledger and could be
associated in time with differences in published prices, thereby generating evidence for arbitrage.
However, bitcoin transactions are too slow and (at times) too costly for this strategy. Instead,
arbitrageurs must maintain a stock of both bitcoins and fiat money in accounts at each exchange
in order to react quickly to price differences. The funds can be balanced at a lower frequency
and not necessarily correlated with observable price differences. Therefore, we do not gain any
advantage from the public ledger in identifying arbitrage transactions. This fact was already
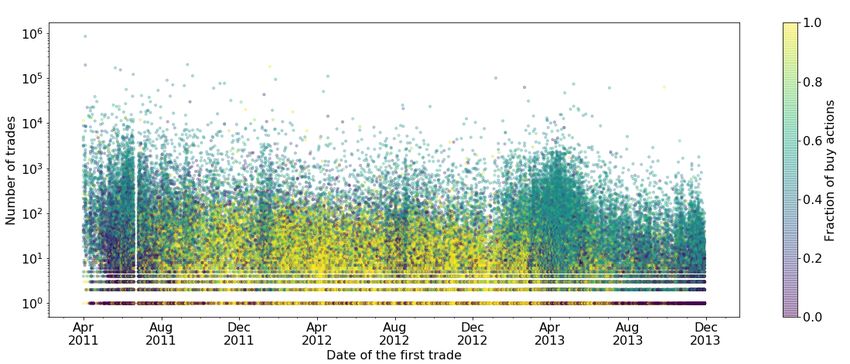
mentioned in the first attempt to study arbitrage in Bitcoin [12]. Interestingly, this term paper
documents that market participants actively explored arbitrage opportunities in spring 20135 by
pointing to two websites that track suitable price differences (see Fig. 15 in Appendix D), and
one open source software trading bot that exploits arbitrage opportunities.
Besides this form of two-point arbitrage, which requires accounts at two exchanges, one can also
consider triangular arbitrage by exploiting relative price differences between three assets (fiat or
cryptocurrency) traded against each other in the same exchange. While arbitrage opportunities
are measurable from published data, there is no way to identify arbitrage transactions or arbi-
trageurs from the public ledger. In this regard, cryptocurrency exchanges do not offer researchers
any advantage over foreign exchange markets.
2.2 Relation to Prior Work
The body of prior works applying financial econometrics to time series data from cryptocurrency
exchanges is vast and not easy to navigate [e. g., 13, 14, 15, 16, 17, 18, 19, 20, 21, 22, 23]. We
restrict our review to focused studies of arbitrage opportunities and the exploration of market
imperfections. The latter are relevant for our method because they inform us about transaction
costs, which constrain the exploitability of apparent arbitrage opportunities.
When interpreting prior work, it is important to keep in mind that most studies use rather short
and often non-overlapping samples. The maturing market for cryptocurrencies has exhibited
extraordinary volatility as it transitioned through several epochs. Consequently, the time-series
contain several structural breaks, which make it hard, if not impossible, to draw conclusions
that generalize to the cryptocurrency as a whole. To illustrate this, we depict in Figure 1 the
sample periods of the works discussed in the following along with the bitcoin price in USD on a
logarithmic scale. This accounts best for the order of magnitude differences between epochs.
The early years of Bitcoin trading (which are relevant for our work) are covered by Dong and
Dong [24] as well as Badev and Chen [25]. The former team compares official and implied
exchange rates between fiat currencies on cryptocurrency exchanges. The authors interpret this
measure of triangular arbitrage opportunity as a proxy for the liquidity of Bitcoin. The latter
source investigate two-point arbitrage between exchanges, which is close to our interest. But
the most remarkable price differences reported fall into the period when the Mt. Gox exchange
collapsed, and thus are beyond our sample. The best explanation for these differences is the
counter-party risk of the tumbling exchange, rather than unexploited arbitrage opportunities.
5
https://bitcointalk.org/index.php?topic=137675.0,
https://bitcoin.stackexchange.com/questions/12670/why-dont-people-buy-at-one-exchange-and-sell-
at-another (all accessed on 7 May 2019)
3
104
                                     Mt. Gox dataset
Bitcoin price in USD

                       103

                                                          Pieters & Vivanco 2015 [28]                 Hattori & Ishida 2018 [32]
                       102
                                         Badev & Chen 2014 [25]                Kroeger et al. 2017 [30]
                       101
                                                          Reynolds et al. 2018 [27]                       Hautsch et al. 2018 [33]

                       100          Dong & Dong 2015 [24]     Pieters & Vivanco 2017 [29]     Makarov & Schoar 2018 [31]

                                                                 Pichl & Kaizoji 2017 [26]

                             2011        2012          2013       2014        2015           2016      2017        2018        2019

         Figure 1: Related work in temporal and market context (Bitcoin price in USD on log scale)

The draft by Kroeger et al. [30], albeit incomplete at the time of writing, is probably closest to
our analysis. The authors show that even after accounting for both explicit (fees) and implicit
(illiquidity and volatility) transaction costs, arbitrage opportunities pertain between exchanges.
In particular, bitcoins are traded at a consistenly lower price on one exchange, BTC-e. Reynolds
et al. [27] focus on the triangular arbitrage and report persistent mis-pricing when Bitcoin is
used as a vehicle currency. Pieters and Vivanco [28] observe that, from January to December
2014, there are arbitrage opportunities between different exchanges. As a noteworthy detail,
they remark that the exchange rate for the Argentinian pesos (ARS) on Local Bitcoins, a peer-
to-peer exchange, is closer to the ARS black market exchange rate than to the official one. In
follow-up work [29], the authors expand this line of thought and try to explain international
inconsistencies in the price of Bitcoin with the regulatory environment towards cryptocurrencies.
Markets with tighter regulation, approximated by the level of customer identification exchanges
require, seem to charge a political risk premium. Related to that, Makarov and Schoar [31]
report unexploited arbitrage opportunities for a later time window and suggest that capital
controls played an essential role in causing market frictions in 2017. Pichl and Kaizoji [26] study
triangular arbitrage without considering transaction costs. They find unexploited opportunities
in particular in the Chinese market.
Hattori and Ishida [32] study the nascent futures market for Bitcoin and, somewhat surprisingly,
find that it is efficient from March 2018 onwards. The disagreement with the tenor of most other
literature can be attributed to the time window and the fact that the futures market operates in
a single geographical area. Finally, Hautsch et al. [33] focus on a short time window from April
to September 2018. Their main contribution is to derive theoretical bounds to arbitrage, which
could arise as a consequence of the settlement time needed for arbitrage strategies that require
bitcoin transfers across exchanges.
In summary, based on heterogeneous methods and studying different periods in time with data of
different frequency, the literature pretty consistently reports unexploited arbitrage opportunities
in cryptocurrency markets. This does not imply that arbitrage does not happen, but might
rather indicate that the costs and risks of arbitrageurs are under-estimated. Anecdotal evidence
from forums, the existence of web-based arbitrage tools, and code repositories for trading bots
indicate that arbitrage does happen [12].

                                                                         4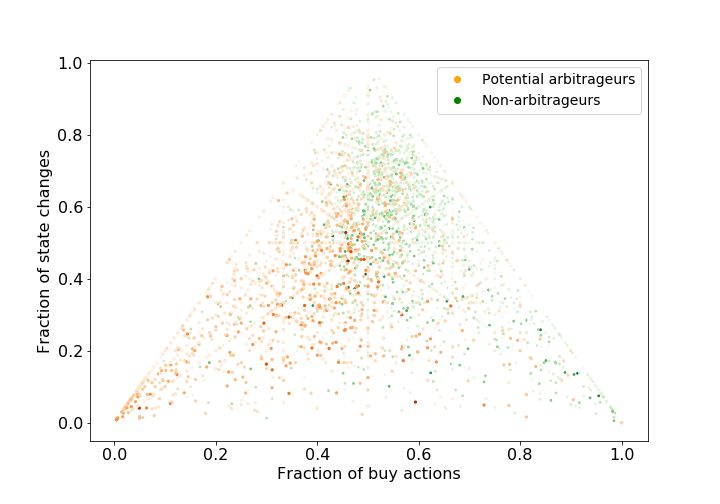
2.3      Data Source

All the reviewed studies have in common that they analyze aggregated price (and sometimes
volume) time series. Our approach differs in that we use individual data from the internal ledger
of a major exchange, Mt. Gox.
Mt. Gox played a prominent role during the early years of Bitcoin: established in 2010, it was
the first exchange and dominated market with more than 90% of total trading volume until early
2012. The competitors Bitstamp and BTC-e entered the market in mid-2011, BTC China at
the end of 2011. When Bitfinex started its activity in spring 2013, the competitors of Mt. Gox
gained market share pushing Mt. Gox to just under 60% in the summer of 2013. (See Figure 1 in
Appendix A of the supplemental material to [34] for market share over time.) Customers of Mt.
Gox often experienced delays when withdrawing fiat money. The exchange stopped withdraws
altogether on 7 February 2014, and filed for bankruptcy two weeks later. The former CEO was
arrested after criminal charges of fraud and embezzlement in 2015, and found guilty of falsifying
data in 2019. Exchange closure is a common phenomenon in the cryptocurrency space, and a
source of concern for investors, as witnessed by the survival analysis of 80 exchanges in [35].
Our main dataset was leaked to the public in 2014 as a series of CSV files. They contain
information on almost 7 million trades in between 1 April 2011 and 29 November 2013. The vast
majority (87.7%) of trades are in USD, followed by EUR (7.7%). Figure 2 visualizes selected
indicators on how Mt. Gox’s user base evolved over time, reaching a total of more than 125,000.
While there is no way to fully verify the correctness of this dataset, our own comparisons to
aggregate information support its authenticity. Moreover, according to The Guardian,6 several
members of the bitcoin community claimed to have found their own transactions in the dataset.
Finally, certain facts established in the court case against the former CEO of Mt. Gox seem to
plausibly explain patterns in the dataset.7
Several researchers have analyzed the dataset for other research questions than arbitrage:

      • Gandal et al. [34] analyze the actions of two users, Markus and Willy, who engaged in
        suspicious trading activity. The authors relate the growth of the 2013 bitcoin price bubble
        to these users’ trades, supporting the claim of potential market manipulation.

      • Feder et al. [36] study the impact of distributed denial-of-service (DDoS) attacks on the
        Mt. Gox exchange. They find that the number of large trades decreases significantly in the
        days following an attack.

      • Scaillet et al. [37] analyze price jumps in the BTC/USD exchange rate. They use the
        leaked dataset as an approximation for tick-level information and calculate indicators of
        aggressiveness and market participation from its user identifiers. This kind of information
        is rarely available in aggregated financial series.

      • Chen et al. [38] study trades through the lens of network science. They report that a
        limited number of users had a significant impact on the bitcoin price, and suspect that
        some unusual patterns (self-loops, uni- and bi-directional trades, triangular structures)
        might be indications of market manipulation.
  6
     https://www.theguardian.com/technology/2014/mar/10/mtgox-bitcoin-database-leaked-online-as-
hackers-crowdsource-clues (accessed on 4 May 2019)
   7
     This statement is based on personal communication. The authors have not read the Japanese files.

                                                  5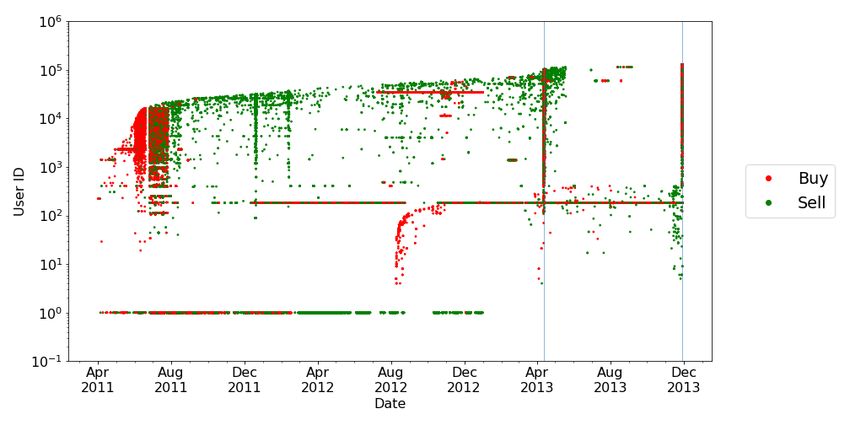
(a)

                                               (b)

                                               (c)

Figure 2: Descriptive statistics of Mt. Gox users. Panel (a) shows the growth of registered users
in relation to the bitcoin price (the latter is reported on a logarithmic scale). Panel (b) shows
the number of daily active users. Panel (c) shows a scatterplot where each dot represents a user
positions on the x-axis by the first day of activity on Mt. Gox and on the y-axis by the total
number of trades; color indicates the fraction of buy actions.
                                               6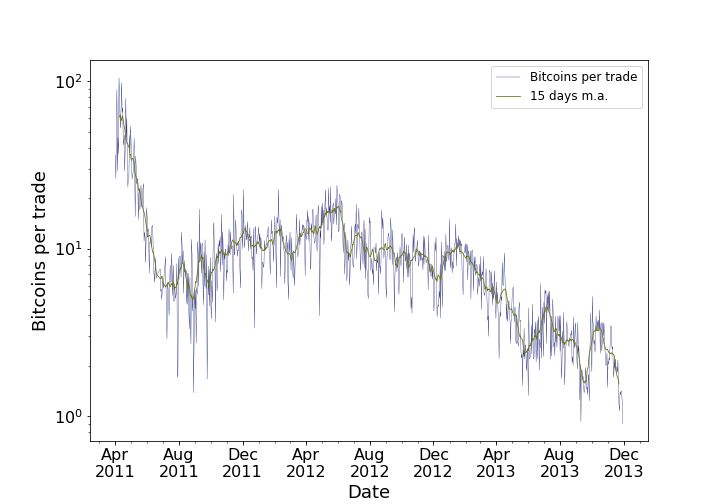
In summary, the dataset is meanwhile well researched. Our own exploration revealed some
additional details, which we document in the form of descriptive statistics in Appendix B. We
are not aware of any other work looking at arbitrage activity, our main interest in this study.
Finally, a comment on research ethics and data privacy stands to reason. The internal ledger
of Mt. Gox contains data that, in principle, can be linked to natural persons by matching it
with other records. Moreover, the users appearing in this dataset had no expectation that their
individual trades will become public. We therefore take utmost care that none of our analyses
singles out users that have not been singled out in other work (which we always document with a
proper citation). Specifically, we map all user identifiers in the dataset to a consecutive sequence
of integers, preserving the order but not the numbers. Therefore, user identifiers in our figures
should not be directly related to identifiers in the data source. Moreover, we do not possess
additional data which would allow linking records to natural persons, nor are we aware of a
source where this data could be gathered. Therefore, we believe that the harm caused by our
study is minimal while there are clear benefits in shedding light into a fundamental question in
finance. Readers seeking to replicate the general methods described here are advised to make
similar considerations before working with the data.

2.4      Analytical Approach

The internal ledger of one exchange does not allow us to identify two-point arbitrage on the level
of individual (pairs of) trades. However, under the assumption that arbitrageurs are users who
perform arbitrage consistently over a longer period of time, we can identify the users in the Mt.
Gox dataset whose sequence of actions can be plausibly explained with arbitrage exploiting the
differences in published prices between Mt. Gox and any counterpart exchange. The high-level
idea of our approach is to generate an ‘ideal’ series of arbitrage actions for each counterpart of
Mt. Gox from aggregate information. This ideal series is then matched against the actual trades
of each user in the Mt. Gox dataset. The set of users with the highest similarity between ideal
and actual trades are likely arbitrageurs.
Figure 3 shows the analytical pipeline of our approach in more detail. It is based on two data
sources, the Mt. Gox leaked files and high frequency time series of price and volume information
obtained from the Bitcoincharts.com Market API8 for the three other relevant exchanges in the
time period considered: BTC-e (USD and EUR), Bitstamp (USD), and Bitfinex (USD). The pre-
processing stage involves data cleaning of the Mt. Gox files. We follow the procedure established
in related work and deviate for reasons detailed in Appendix A. Moreover, the high-frequency
time series are aggregated to hourly open/high/low/close/volume (OHLCV) series in unified
GMT time.
The most interesting parts of our work so far concern the matching stage, where we focus on two
aspects: first, the calculation of the ideal series requires a good approximation of the transaction
costs. We devise and fit a fee model to estimate the transaction costs as a function of each user’s
trading history (Section 3.1). Second, we discuss our similarity metrics and report preliminary
results on the set of potential arbitrageurs for the three counterpart exchanges (Section 3.2).
As we find that the method is still prone to false positives, we propose a post-filtering approach
to narrow down the set of arbitrageurs to users where arbitrage activity can be confirmed from
tick data. This part of the work was not completed by the WEIS deadline and will benefit from
the feedback received from the workshop participants.
  8
      http://api.bitcoincharts.com/v1/csv/ (accessed on 6 May 2019)

                                                   7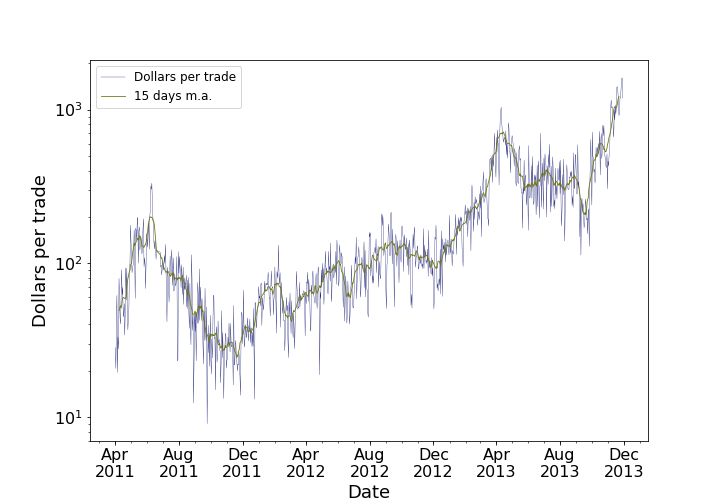
Data sources            Pre-processing                Matching         Post-filtering

            Mt. Gox             Data cleaning:
                                - uniform dataset;                             Checking for
          leaked data
                                - de-duplication;                              the presence of
                                - error checks              Ideal     Actual   false positives;
                                                            series    series
         Bitcoincharts                                                         post-filtering
           price and            Aggregation:                                   techniques
            volume              - OHLCV t.s.

                                         Fee model

                                                         Similarity metric

                         Figure 3: Overview of our analytical approach

3     Method and Results

We describe the method and present the estimated fee model in Section 3.1 before we describe
the matching along with our results for the identified potential arbitrageurs in Section 3.2.

3.1   Fee Model

Table 1 shows the fee schedule published by Mt. Gox; we could confirm that the scheme was valid
at least from 16 October 2011 until mid-February 20139 . Discounts were based on the volume of
bitcoins traded by the user over the last 720 hours10 (that is, 30 days).
We first compare the posted and the real fee schedules. In the Mt. Gox dataset, transaction
costs are reported in two entries: bitcoin buyers were charged with fees in bitcoin, while sellers
with fees in fiat money11 . Thus, for each leg of every trade, we compute the actual fees paid as
                                         BitcoinFee MoneyFee
                                Fee =              +         ,                                    (1)
                                          Bitcoins   Money
where ‘BitcoinFee’ represents the fees paid on the amount of bitcoins traded, while ‘MoneyFee’
represents the fees paid on the amount of fiat money traded.
Figure 4 shows a sample (N = 100, 000) of the empirical fees, focusing on the relationship
between the actual transaction costs and the past volume traded; each dot represents the fees
paid on a leg of a trade. By comparing the posted and the actual schedules, we note that most of
the data points fall into the expected volume bands, although deviations exist: first, from 0.40%
   9
     http://web.archive.org/web/20111016114851/https://mtgox.com/fee-schedule
http://web.archive.org/web/20140210044241/https://www.mtgox.com/fee-schedule
https://bitcointalk.org/index.php?topic=144558.0 (all accessed on 6 May 2019)
  10
     https://en.bitcoin.it/wiki/Mt._Gox (accessed on 6 May 2019)
  11
     https://bitcoin.stackexchange.com/questions/10016/does-mtgox-charge-commission-in-usd-or-in-
btc (accessed on 6 May 2019)

                                                     8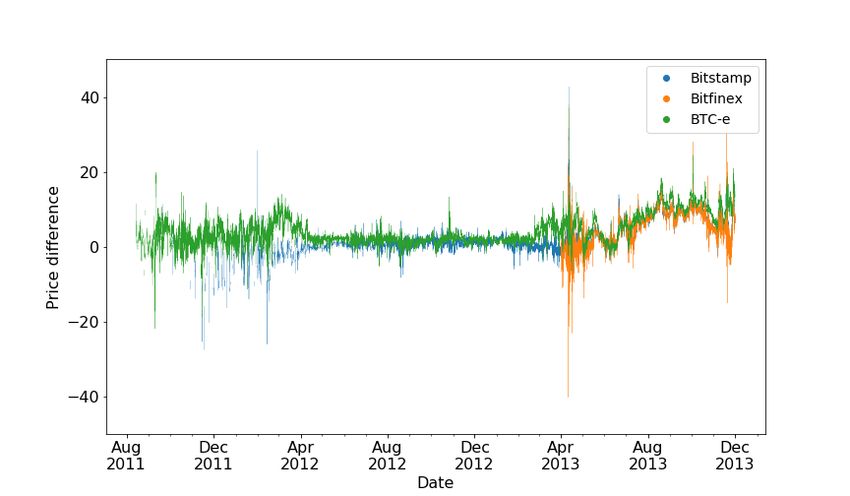
Table 1: Mt. Gox posted fee schedule. Discounts are based on the user’s trading volume over
the last 720 hours

            Volume (BTCs)                Fees           Volume (BTCs)             Fees
            0 to < 100                   0.60%          10000 to < 25000          0.30%
            100 to < 200                 0.55%          25000 to < 50000          0.29%
            200 to < 500                 0.53%          50000 to < 100000         0.28%
            500 to < 1000                0.50%          100000 to < 250000        0.27%
            1000 to < 2000               0.46%          250000 to < 500000        0.26%
            2000 to < 5000               0.43%          > 500000                  0.25%
            5000 to < 10000              0.40%          -                         -

to 0.20%, many points follow a pattern that cannot be explained by the posted schedule; second,
a non-negligible number of dots falls below the threshold of 0.20%, suggesting the existence of
privileged users, and a subset of legs is completely exempted from any kind of fee. These legs
are further investigated in Figure 5.
The heuristics that we introduce to detect arbitrageurs in Section 3.2 crucially depend on the fees
paid by the users. To take them into account, instead of reverse-engineering the posted schedule,
we take an empirical approach and fit a simple model that predicts the fees a user would have
to pay given his trading history. The fee model is specified as:

                    Feei = β0 + β1 · LogVoli + β2 · VolSmalli + β3 · VolBigi
                               + β4 · LogVoli · VolSmalli + β5 · LogVoli · VolBigi                   (2)
                               + β6 · T0i + β7 · T1i + β8 · Tholidi + i .

The independent variables have the following meaning:

   • LogVol, the natural logarithm of the volume traded in the last 720 hours by the user who
     submitted the leg associated to the fee;

   • VolSmall, a dummy variable equal to 1 if the volume traded in the last 720 hours is between
     100 and 10,000 bitcoins;

   • VolBig, a dummy variable equal to 1 if the volume traded in the last 720 hours exceeds
     10,000 bitcoins. As it can be seen from Figure 4, discount factors follow a linear trend with
     different slopes below and above the 10,000 bitcoins threshold. This is the reason why we
     introduced this dummy variable and the previous one, as well as their interaction terms
     with the LogVol variable;

   • T0 , a dummy variable for trades executed between 1 April 2011 and 23 June 2011;

   • T1 , a dummy variable for trades executed between 24 June 2011 and 18 August 2011;

   • Tholid , a dummy variable for trades executed on ‘special days’: from 26 December 2011 to
     1 January 2012, from 2 to 7 April 2012; on 9 and 10 November 201212 .

  12
     respectively, Christmas holidays in 2011, Easter holidays in 2012 and first Bitcoin Friday Sale day.
https://bitcoinmagazine.com/articles/bitcoin-friday-sale-happening-today-1352497394/ (accessed on
6 May 2019)

                                                    9
Figure 4: Empirical fee schedule. Fees paid per leg expressed as the percentage of the value
of the trade (y-axis). According to Mt. Gox’s schedule, fees depend on the amount of bitcoins
traded by the user in the last 720 hours (on the x-axis). Color indicates the time of the trade.
The lines of the grid help to graphically delimit the volume bands corresponding to different
discount brackets. Two horizontal red lines help to identify the two time windows when fees
were fixed: 0.65% from 1 April 2011 to 23 June 2011, and 0.3% from 24 June 2011 to 18 August
2011. Many legs pay no fees, and a limited number of legs pays fees as low as 0.1 percent or less.
In addition, in some particular circumstances (e.g., Easter and Christmas holidays in 2011 and
2012), fees were halved, thus explaining some of the values that do not correspond to the official
fee schedule. The plot shows a random sample of N = 100, 000 legs.
10(a)
(b)
Figure 5: Patterns of waived fees. Panel (a) reports the distribution of the legs whose associated
fees are zero, as a function of time and user ID (the latter on a logarithmic scale, to focus on low
IDs). Buy (red) and sell (green) orders differ by color. Many interesting patterns emerge: first,
two users with low ID did not pay fees over extended time periods; moreover, they account for
∼ 1, 000, 000 zero-fee legs over the total of ∼ 1, 700, 000 zero-fee legs. Second, during some days
(especially on 19, 20, and 21 December 2011; 12, 13, and 14 April 2013; 28 and 29 November
2013) there were anomalous increases in trade legs with zero fees. Possible explanations include
special events, such as a temporary downtime of Mt. Gox on 11 April 2013, and the exchange
rate surpassing 1,000 $/BTC for the first time on 27 November 2013. In both cases, the number
of zero-fee trade legs increases shortly afterwards. Panel (b) depicts the daily bitcoin volume
traded and the exchange rate in USD (the latter on a logarithmic scale). Observe from both
panels that many users with low IDs seem to have coordinately executed buy orders from August
to around November 2012, and then exclusively sell orders in the the days preceding the Bitcoin
price peak. The plot shows a random sample of N = 200, 000 legs.
11Table 2: Fee model for non-zero fees, coefficients fitted with OLS
Dependent variable: Fee as a percentage of the amount traded
Specification
(1) (2) (3) (4) (5)
Intercept 0.636 0.638 0.556 0.560 0.561
(0.0001) (0.0001) (0.0001) (0.0001) (0.000070)
LogVol -0.030 -0.030 -0.001 -0.001
(0.0000) (0.0000) (0.0000) (0.0000)
VolSmall -0.106 0.151 0.153
(0.0001) (0.0002) (0.0002)
VolBig -0.283 -0.206 -0.218
(0.0001) (0.0005) (0.0004)
LogVol ∗ VolSmall -0.037 -0.037
(0.0000) (0.0000)
LogVol ∗ VolBig -0.006 -0.005
(0.0001) (0.0001)
T0 0.163 0.156
(0.0002) (0.0001)
T1 -0.159 -0.168
(0.0002) (0.00011)
Tholid -0.187 -0.191
(0.0002) (0.0002)
R2 0.510 0.605 0.527 0.590 0.688
Obs. 12243707 12243707 12243707 12243707 12243707
Note: All variables are significant at the 0.1% level. This is due to the high number of obser-
vations; however, we emphasize that these results are intended not so much to find significant
effects as to predict fees. Observations consist of legs whose fees are positive and their value is
below 1%.
Table 2 reports the estimated coefficients and goodness-of-fit indicators. In each specification,
the constant term approximates the non-discounted official fee of 0.6%, and the response variable
is negatively correlated with an increase of the volume traded in the past 720 hours; as expected,
when included in the model, T0 and T1 respectively increase and decrease the constant term
by a factor of around 0.15%, while Tholid has an even stronger negative effect (around -0.20%).
Finally, again in accordance with our expectations, both β4 and β5 are negative; the first one is
bigger in absolute terms, thus indicating a steeper variation of discounts given the same variation
in volume (as can be seen in Figure 4). We chose a logarithmic model because the break points
for the fee schedule in Table 1 follow a logarithmic trend, and thus it was straightforward to
consider the estimation on logarithmic volumes. However, to strengthen the results, we explored
an alternative model, which is reported in Appendix C, using linear volumes. In that section we
also specify a logit model to estimate the probability that a leg pay zero fees given user-specific
and time-related variables.
Finally, we need to account for the fact that two-point arbitrage requires two trades, one on Mt.
Gox and a second one on another exchange. Thus, we also need to include an estimate of the
fees that the investor would pay on the counterpart exchange. Relying on each counterpart’s
12posted fees at the time of the analysis13 , we add a transaction cost of 0.2% of the amount traded
when the counterpart exchange is BTC-e, and 0.1% for Bitfinex. Since Bitstamp applied a fee
schedule similar to Mt. Gox, based on the volume traded in the last 30 days, but ranging from
0.5% to 0.2% and having different bands, we add a term corresponding to the fee paid in Mt.
Gox, but rescaled it proportionally to Bitstamp’s fee range.
3.2 Matching and Similarity Metric
The fee model gives an approximation of the expected transaction costs, which vary across users
and time. This assumption is crucial, since individual transaction costs affect how the same
arbitrage opportunity is perceived by different users: the same mis-pricing can be an unexploited
arbitrage opportunity for an investor who pays low enough fees, and a costly operation for a
trader that pays higher fees. Then, the second step of the analysis consists in defining a heuristic
approach to identify the users who are likely to be arbitrageurs: we match the sequence of actions
executed by each real user, together with the associated fees paid, against an ideal sequence of
optimal actions made by a ‘perfect arbitrageur’; thus, we introduce a similarity metric to classify
investors in potential arbitrageurs and non-arbitrageurs.
Figure 6: Price differences between Mt. Gox and Bitstamp, Bitfinex, BTC-e, as a percentage of
the Mt. Gox price, in USD.
Our work is based on hourly frequency, therefore we first aggregate the price time series for the
three counterpart exchanges: Figure 6 shows the bitcoin USD price difference between Mt. Gox
and the three counterpart exchanges, as a percentage of the Mt. Gox price, at the hourly level.
13
Bitfinex: https://web.archive.org/web/20130513094437/https://bitfinex.com/pages/fees;
BTC-e: https://web.archive.org/web/20120805040835/https://btc-e.com/page/2;
Bitstamp: https://www.bitstamp.net/article/press-release-bitstamp-introduces-volume-discount-/
(all accessed on 6 May 2019)
13We focus on a counterpart exchange E. For each time interval, the optimal response of an ideal
arbitrageur active on Mt. Gox is drawn from the set of actions A = {Buy (B), Sell (S), Hold (H)}:
without considering transaction costs, an arbitrageur would always Sell on Mt. Gox if prices are
higher on Mt. Gox, and vice versa, he would Buy if they are lower. If there is no mis-pricing, the
best action is to Hold. We construct then a sequence of hourly ideal response actions to price
changes between Mt. Gox and E, together with the associated maximum transaction costs that
would entail zero profits: the information contained in this sequence is common to each user and
publicly available.
Second, we aggregate the user actions at the hourly level. When a user submits more than one
trade in the same hour, we define the hourly prevalent action as Buy if the difference between
the amount of bitcoins bought and sold is positive, and as Sell if negative; we exclude hours in
which this difference is equal to zero. We made this choice to preserve the original set of users’
actions. Fees are aggregated by computing the mean value for each hour. Matching takes place
only on the time windows in which the user is active; currently, we do not make any deduction
on ‘arbitrageur-like’ behavior of a user during times of inactivity. This issue is something to
be revisited in follow-up work. Moreover, the matching algorithm only compares time-periods
in which both a user’s action and the price difference between Mt. Gox and the counterpart
exchange are available (e.g., Bitfinex data are available only from April 2013 onwards). From
the sequence of the users’ hourly actions, we construct a first indicator: we count the changes of
state as the number of alternations of the hourly Buy and Sell actions for each user U.
Then, each user U observes the publicly available information on mis-pricings and maximum
transaction costs, and derives from it the individual ideal sequence of hourly events, given the
user-specific transaction costs: while the former is common to each user, the latter depends on
each user’s trading history and thus is private. The matching algorithm compares this sequence
to the individual hourly sequence of actions: an action is considered as ‘arbitrage-like’ if it
corresponds to the one that an ideal arbitrageur would perform in the same time window and
if the associated transaction costs do not exceed the size of the mis-pricing. Figure 7 shows an
illustrative example of the matching procedure for a demonstrative user U.
As a result of the matching algorithm, only a fraction of each user’s ‘hourly actions’ correspond
to two-point arbitrage actions. For each user we construct then a second indicator: we compute
the fraction of ‘arbitrage-like’ actions that correspond to two-point arbitrage on the counterpart
exchange E. We rank the users based on this parameter in descending order.
We repeat these steps for each of the three counterpart exchanges, considering the price time
series denominated in USD. Figure 8 shows three lines, one per exchange; users are ranked in
descending order based on the share of ‘arbitrage-like’ actions. Note that, for each counterpart
exchange, actions are matched independently: a user ranked nth in a counterpart exchange might
be ranked mth in another. For each counterpart exchange, we take into account only the users
for which the matching occurs on more than 10 hours. Consider the illustrative case of Bitfinex:
since the price time series is shorter (the data on price differences go from April 2013 to November
2013), a smaller number of users is included in the ranking. Users whose share of ‘arbitrage-like’
actions is above 0.5 are classified as potential arbitrageurs. All the lines follow a sigmoid trend;
in the case of Bitstamp, the right tail follows a smoother decline; this is probably due to the
differences in the fee schedules (higher in Bitstamp). In Bitstamp and Bitfinex, with respect
to BTC-e, it is possible to notice a steeper decline of the users whose fraction of arbitrage-like
actions is high; most importantly, the set of users detected as potential arbitrageurs in BTC-e
is larger if compared to the size of the sets obtained on the other counterpart exchanges (12,511
against 4,990 in Bitstamp and 5,045 in Bitfinex). We attribute the dominance of BTC-e to the
persistence of larger price differences throughout most of 2013, with respect to the mis-pricings
14Time: h0 h1 h2 ... hi ... hn
Ideal Series: (B,f0 ) (S,f1 ) (B,f2 ) ... (B,fi ) ... (B,fn )
Buy if Buy if Buy if Buy if
FU,0 < f0 FU,i−1 < fi−1 FU,i < fi FU,n < fn B
HOLD:
FU,1 > f2
Matching: H
Sell if Sell if
FU,0 < f1 FU,i+1 < fi+1 S
User U (B,0.4) NA (B,0.4) NA NA (S,0.3) (S,0.4)
Actual series
Figure 7: Illustrative example of the matching heuristic. At each point in time we know the
buy/sell action that an ideal arbitrageur would execute given the mis-pricing, and a value f for
the absolute value of the size of the arbitrage opportunity. FU,i represents the fee paid and varies
across time and users. The last row shows the tuples (Prevalent Action, Fee) for a representative
user U. Now, for this illustrative example, suppose that all the values fi are bigger than 0.5%,
except f2 = 0.3%. Once individual fees are included, some of the f values might turn out to be
too small for the user to be exploited as arbitrage opportunities, because the fees exceed the size
of the mis-pricing; in this case, even though the ideal and actual action at time h2 correspond,
the fee exceeds the price differences: an ideal arbitrageur would then ‘Hold’ (H); so, this action
is counted as ‘non-arbitrageur like’ for user U. NA stands for Not Active, meaning that in this
time window the user did not make any trade; green tuples are classified as ‘arbitrageurs-like’,
while red tuples as ‘non arbitrageurs-like’.
in the other counterpart exchanges.
We identify a set of 2,631 users as potential arbitrageurs in all of the three counterpart exchanges.
Figure 10 shows to what extent the results overlap. On a total of 125,730 users, 111,439 are always
classified as non-arbitrageurs, while 14,291 investors are detected as potential arbitrageurs on at
least one exchange. Figure 9 shows the subset of users detected as potential arbitrageurs in each
exchange (orange), compared with all the other users (green). While independent of the fraction
of changes of state, the set is mainly composed of investors who made more Sell actions than Buy
actions. This goes against our expectations to find arbitrageur candidates in the upper central
portion of the constructed triangle. We hypothesize that the subset of potential arbitrageurs
identified on all exchanges might be affected by the structural price increase that occurred in
Mt. Gox from Spring 2013. However, further investigation is required.
Table 3 reports the summary statistics on the sets of the identified potential arbitrageurs. The
purpose of column (c) is to introduce a benchmark for the comparison of the values in columns (a)
and (b), while column (d) is reported for illustrative purposes. Coherently with the interpretation
given for Figures 8, 9, and 10, we note that the users in the set of column (a) made more Sell
trades and less Buy trades with respect to groups (b) and (c), and the mean user ID in column (a)
is higher (84,597 against 57,465 and 49,513 respectively for columns (b) and (c)); furthermore,
they moved more fiat currency per trade ($415.70 for column (a), $300.40 and $275.85 for columns
(b) and (c)), but moved less bitcoins; thus, they were active in a time window in which prices
were high.
15Figure 8: Share of trades that correspond to two-point arbitrage actions with another exchange,
per user, evaluated independently for the counterpart exchanges Bitstamp, Bitfinex, BTC-e;
users above 0.5 are treated as potential arbitrageurs. Users with less than 10 active hours are
excluded from this analysis.
16Figure 9: Scatterplot of the users detected as potential arbitrageurs with all three counterpart
exchanges (orange), in contrast to all other users (green), as a function of the fraction of buy
actions and of the fraction of state changes; the opacity is proportional to the number of actions
made by the user.
17BTC-e
100%
7019
1822 1039
2631
405 1243
132
0%
Bitstamp Bitfinex
Figure 10: Venn diagram on the number of potential arbitrageurs between Mt. Gox and the three
counterpart exchanges considered. The shading is proportional to the fraction of arbitrageurs in
each segment.
In conclusion, we consider both the intersection and the union of the sets represented in Figure
10 to be an over-estimation of the actual set of arbitrageurs we try to identify. Thus, we argue
that we need to implement post-filtering techniques to remove the false positives and to rule out
the alternative hypotheses.
Figures 16 and 17 show the results of the same analysis on the EUR market; since we have data
only for the BTC-e exchange platform, we cannot make comparisons among exchanges and the
analysis is limited. We report the Figures in Appendix D.
4 Discussion
The aim of this work is to mine Mt. Gox’s internal ledger in order to identify users who likely
carried out two-point arbitrage between Mt. Gox and one of the three other Bitcoin exchanges.
To do so, we pre-process the data sources following related work. We then construct a fee model
to estimate user-specific transaction costs, and we define a similarity metric to compare users’
actual trades to the actions of an ‘ideal arbitrageur’, given the individual transaction costs and
the price differences between Mt. Gox and the three counterpart exchanges, Bitstamp, BTC-e,
and Bitfinex.
At this stage, the paper mainly contributes to the literature by shedding some light on the
internal dynamics of the Mt. Gox exchange platform, and in particular on the actual fee scheme
paid by the users in Mt. Gox from April 2011 to November 2013. Up to now the contribution on
the financial side is limited. A filtering technique is needed to rule out false positives, thus the
results for the arbitrageur identification are very preliminary. Moreover, our heuristic is based
on longitudinal similarity metric biased against users with few transactions: this restricts the
18Table 3: Comparison of potential arbitrageurs to non-arbitrageurs
Users with ≥ 10 hours of activity All users
Potential arbitrageurs Non-arbitrageurs
with all 3 with at least
exchanges one exchange
(n = 2631) (n = 14291) (n = 18435) (n = 125730)
(a) (b) (c) (d)
Total trades mean 376.1 438.1 335.9 111.3
median 64 72 61 10
Buy trades mean 137.4 186.8 187.4 55.6
median 24 27 37 5
Sell trades mean 238.7 251.3 148.5 55.6
median 37 41 23 3
Changes of State mean 67.1 85.2 57.2 20.4
median 16 18 15 1
Bitcoins bought mean 478.2 1310.9 1457.4 395.5
median 27.9 52.4 122.9 9.5
Bitcoins sold mean 971.6 1738.5 1192.4 395.5
median 39.5 90.0 57.1 3.0
‘Equivalent $’ sent mean 53944.4 54723.1 67442.1 17932.1
median 4822.3 3610.1 4328.3 428.0
‘Equivalent $’ received mean 79250.1 66122.4 58718.0 17932.3
median 7399.1 5560.0 2759.0 241.1
‘Equivalent $’ per trade mean 415.7 300.4 275.9 235.5
median 194.2 122.6 117.4 91.5
Active hours mean 69.1 83.1 58.3 22.7
median 28 32 24 5
Active days mean 29.3 37.2 26.0 11.3
median 18 21 16 4
Trades per hour mean 3.0 3.0 3.5 2.7
median 2.0 2.0 2.3 1.8
Trades per day mean 7.5 6.5 7.2 4.1
median 3.4 3.3 3.7 2.2
User ID mean 84597.2 57465.6 49513.3 62864.5
median 95235 54688 44070 62864
A note on the meaning of ‘equivalent $’. Columns (c) and (d) include users who made transactions
in fiat currency other than USD. Thus, to make results comparable, we converted in USD the
value of the trades denominated in different fiat currencies.
19ability to comprehensively answer the question if the arbitrageurs are a few big players or many
small investors.
Several other open problems remain to be solved. A general limitation of our approach and
dataset is that we cannot observe individual behavior on the counterparts exchanges. Only this
(or good proxies thereof) would strengthen the evidence that what we are observing is actually
two-point arbitrage. The counterpart time series are strongly correlated, mainly from April
2013 on, and we hypothesized in Section 3.2 that this might bias the group of users detected
as arbitrageurs on all the counterpart exchanges. The next logical step is to split the dataset
into shorter and more homogenous epochs. The matching heuristic has some flaws: we do
not account for time-periods without trades, and we consider hourly aggregations instead of
an HFT-based approach (the work by Makarov and Schoar [31] contains useful suggestions in
this regard). More conceptually, it is not trivial to interpret arbitrage with more than one
counterpart exchange involved for the same user because in principle the user could engage in
two-point arbitrage between pairs of exchanges not including Mt. Gox. These trades are not
included in our dataset. A possible way forward is to compose ideal series with actions involving
two-point arbitrage between all pairs of exchanges and consider actions that do not involve Mt.
Gox as censored data points.
Even when all of these open problems are addressed, the external validity remains a concern.
Can we learn anything substantial about arbitrageurs in conventional financial markets from a
nascent niche market that requires technical sophistication and willingness to accept unusual
risks? This question must be asked for the early years of Bitcoin as well as the emerging markets
in the crypto-token ecosystem. For example, a very recent related work studying automated
arbitrage on Ethereum’s decentralized token exchanges reports sizable opportunities, which are
routinely exploited by a range of competing trading bots [39]. However, the external validity is
further compromised by an observer effect: apparently, the race was triggered by a blog post and
the release of proof-of-concept code for a trading bot by members of that research team!
Disclosure: the authors have never traded on Mt. Gox.
Acknowledgments
We would like to thank JT Hamrick, Marie Vasek, the participants at the University of Innsbruck’s
research seminars in spring 2019, Simone Giansante, Andrea Canidio, and the anonymous reviewers of
WEIS 2019 for their comments on earlier versions of this work. Angelo Facchini and Nicola Dimitri
supported the first author’s research visit in Innsbruck, which was funded by the European Union’s
Erasmus Plus mobility programme.
References
[1] J. M. Harrioson and D. M. Kreps, “Martingales and arbitrage in multiperiod security mar-
kets,” Journal of Economic Theory, vol. 20, pp. 381–408, 1979.
[2] W. F. Sharpe, “Capital asset prices — A theory of market equilibrium under conditions of
risk,” Journal of Finance, vol. 19, no. 3, pp. 425–442, 1964.
[3] J. Lintner, “Security prices, risk and maximal gains from diversification,” Journal of Finance,
vol. 20, no. 4, pp. 587–615, 1965.
[4] J. Mossin, “Equilibrium in a capital asset market,” Econometrica, vol. 34, no. 4, pp. 768–783,
1966.
20[5] F. Black and M. Scholes, “The pricing of options and corporate liabilities,” Journal of Po-
litical Economy, vol. 81, pp. 637–654, 1973.
[6] E. Fama, “Efficient capital markets: A review of theory and empirical work,” Journal of
Finance, vol. 25, no. 2, pp. 383–417, 1970.
[7] R. Z. Aliber, “The interest rate parity theorem: A reinterpretation,” Journal of Political
Economy, vol. 81, no. 6, pp. 1451–1459, 1973.
[8] A. Shleifer and R. W. Vishny, “The limits of arbitrage,” Journal of Finance, vol. 52, no. 1,
pp. 35–54, 1997.
[9] C. C. Moallemi, B. Park, and B. Van Roy, “Strategic execution in the presence of an unin-
formed arbitrageur,” Journal of Financial Markets, vol. 15, no. 4, pp. 361–391, 2012.
[10] R. Böhme, N. Christin, B. Edelman, and T. Moore, “Bitcoin: Economics, technology, and
governance,” Journal of Economic Perspectives, vol. 29, no. 2, pp. 213–238, 2015.
[11] B. Underwood, Virtual Markets Integrity Initiative. Office of the New York State Attorney
General, September 2018.
[12] A. Petrov and D. Schufla, “Arbitrage am Bitcoin-Markt,” in 1st Münster Bitcoin Conference
(R. Böhme and D. Breuker, eds.), University of Münster, 2013.
[13] F. Glaser, K. Zimmermann, M. Haferkorn, M. Weber, and M. Siering, “Bitcoin-asset or
currency? Revealing users’ hidden intentions,” 2014.
[14] D. Garcia, C. J. Tessone, P. Mavrodiev, and N. Perony, “The digital traces of bubbles:
Feedback cycles between socio-economic signals in the Bitcoin economy,” Journal of the
Royal Society Interface, vol. 11, no. 99, 2014.
[15] M. Brandvold, P. Molnár, K. Vagstad, and O. C. A. Valstad, “Price discovery on Bitcoin
exchanges,” Journal of International Financial Markets, Institutions and Money, vol. 36,
pp. 18–35, 2015.
[16] D. Yermack, “Is Bitcoin a real currency? An economic appraisal,” in Handbook of Digital
Currency, pp. 31–43, Elsevier, 2015.
[17] A. Cheung, E. Roca, and J.-J. Su, “Crypto-currency bubbles: An application of the Phillips–
Shi–Yu (2013) methodology on Mt. Gox bitcoin prices,” Applied Economics, vol. 47, no. 23,
pp. 2348–2358, 2015.
[18] P. Ciaian, M. Rajcaniova, and d. Kancs, “The economics of bitcoin price formation,” Applied
Economics, vol. 48, no. 19, pp. 1799–1815, 2016.
[19] S. Athey, I. Parashkevov, V. Sarukkai, and J. Xia, “Bitcoin pricing, adoption, and usage:
Theory and evidence,” 2016.
[20] E. Bouri, G. Azzi, and A. H. Dyhrberg, “On the return–volatility relationship in the bitcoin
market around the price crash of 2013,” tech. rep., Economics Discussion Papers, No. 2016–
41, Kiel Institute for the World Economy (IfW), Kiel, 2016.
[21] P. Katsiampa, “Volatility estimation for Bitcoin: A comparison of GARCH models,” Eco-
nomics Letters, vol. 158, pp. 3–6, 2017.
21[22] S. Wheatley, D. Sornette, T. Huber, M. Reppen, and R. N. Gantner, “Are bitcoin bubbles
predictable? Combining a generalized Metcalfe’s law and the LPPLS model,” tech. rep.,
Swiss Finance Institute, Research Paper Series, No. 18-22, 2018.
[23] A. H. Dyhrberg, S. Foley, and J. Svec, “How investible is Bitcoin? Analyzing the liquidity
and transaction costs of bitcoin markets,” Economics Letters, vol. 171, pp. 140–143, 2018.
[24] H. Dong and W. Dong, “Bitcoin: Exchange rate parity, risk premium, and arbitrage sticki-
ness,” 2015.
[25] A. I. Badev and M. Chen, “Bitcoin: Technical background and data analysis,” 2014.
[26] L. Pichl and T. Kaizoji, “Volatility analysis of bitcoin price time series,” Quantitative Finance
and Economics, vol. 1, no. 4, pp. 474–485, 2017.
[27] J. Reynolds, L. Sögner, M. Wagner, and D. Wied, “Deviations from triangular arbitrage
parity in foreign exchange and bitcoin markets,” 2018.
[28] G. Pieters and S. Vivanco, “Bitcoin arbitrage and unofficial exchange rates,” tech. rep.,
Trinity University, 2015.
[29] G. Pieters and S. Vivanco, “Financial regulations and price inconsistencies across bitcoin
markets,” Information Economics and Policy, vol. 39, pp. 1–14, 2017.
[30] A. Kroeger and A. Sarkar, “Law of one bitcoin price?,” Federal Reserve Bank of Philadelphia,
2017.
[31] I. Makarov and A. Schoar, “Trading and arbitrage in cryptocurrency markets,” 2018.
[32] T. Hattori and R. Ishida, “Do investors arbitrage in the cryptocurrency market? Evidence
from the bitcoin futures market,” 2018.
[33] N. Hautsch, C. Scheuch, and S. Voigt, “Limits to arbitrage in markets with stochastic
settlement latency,” 2018.
[34] N. Gandal, J. Hamrick, T. Moore, and T. Oberman, “Price manipulation in the Bitcoin
ecosystem,” Journal of Monetary Economics, vol. 95, pp. 86–96, 2018.
[35] T. Moore, N. Christin, and J. Szurdi, “Revisiting the risks of Bitcoin currency exchange
closure,” ACM Transactions on Internet Technology, vol. 18, no. 4, pp. 50:1–50:18, 2018.
[36] A. Feder, N. Gandal, J. Hamrick, and T. Moore, “The impact of DDoS and other security
shocks on Bitcoin currency exchanges: Evidence from Mt. Gox,” Journal of Cybersecurity,
vol. 3, no. 2, pp. 137–144, 2018.
[37] O. Scaillet, A. Treccani, and C. Trevisan, “High-frequency jump analysis of the bitcoin
market,” tech. rep., Swiss Finance Institute, Research Paper Series, No. 17-19, 2017.
[38] W. Chen, J. Wu, Z. Zheng, C. Chen, and Y. Zhou, “Market manipulation of Bitcoin: Evi-
dence from mining the Mt. Gox transaction network.” http://arxiv.org/abs/1902.01941
(last access: 7 May 2019), 2019.
[39] P. Daian, S. Goldfeder, T. Kell, Y. Li, X. Zhao, I. Bentov, L. Breidenbach, and A. Juels,
“Flash boys 2.0: Frontrunning, transaction reordering, and consensus instability in decen-
tralized exchanges.” http://arxiv.org/abs/1904.05234 (last access: 7 May 2019), April
2019.
22[40] M. E. Newman, “Power laws, Pareto distributions and Zipf’s law,” Contemporary Physics,
vol. 46, no. 5, pp. 323–351, 2005.
[41] T. Kim, “On the transaction cost of bitcoin,” Finance Research Letters, vol. 23, pp. 300–305,
2017.
A Data Cleaning
Members of the Mt. Gox users community were among the first to explore the leaked dataset.
Supposedly they wanted to prove misbehavior of the exchange in the events that lead to its
bankruptcy on 28 February 2014. The volunteers analyzed the structure of the dataset, tried to
identify potential malicious users, and pointed out key issues to keep in mind. Prior to carrying
out our own analysis, we followed their example, and replicated the steps adopted by Gandal
et al. [34] and Feder et al. [36], in order to remove duplicates from the dataset. However, we
slightly deviate from their method in a way explained and justified in the following.
Previous works use two related methods to detect duplicates: the first one (method Conservative)
detects rows as duplicates if the following entries are equal: user id, timestamp, buy/sell action,
amount in BTC, amount in Yen. The other method detects rows as duplicates if the following
entries are equal: user id, timestamp, buy/sell action, amount in BTC. The latter is more
aggressive because it removes a higher number of rows, hence previous works refer to it as
Aggressive.
However, this approach also treats as duplicates unwanted legs. Consider the case in which a
user performs two exactly equivalent trades at the same moment, with the only difference that
the complementary leg is executed by different trading partners: both deduplication methods
mentioned above remove one of the two exactly equivalent legs. Thus, these methods reduce the
dataset more than desirable.
To prevent this behavior, we slightly changed the deduplication method, by modifying the Ag-
gressive one and adding the trade id value to the set of variables used to detect duplicates
(method TradeId ). As a result, rows are detected as duplicates if the following entries are equal:
trade id, user id, timestamp, buy/sell action, amount in BTC.
We also implemented another deduplication technique (method Pairs), based on the Aggressive
method, but the legs of a trade are not treated independently: rows are considered as duplicates
only if both legs are duplicates. We chose this deduplication method for the analyses.
The results appear to be consistent with those obtained by previous works: the rows are slightly
less than 14 million, thus the total number of trades is just below 7 million. We were able to
find the ‘users’ Markus and Willy, who traded an amount of BTC consistent with the results
reported by Gandal et al. in [34] (335,898 and 268,133 bitcoins, respectively).
To clarify the differences among the different methods, a series of example trades and the resulting
deduplications are shown in the following.
Original sample. Table 4 shows the original table. It also corresponds to the deduplication
results of method TradeId, meaning that in that specific case the TradeId method does not
remove any duplicate. Consider the following example: rows 937 and 939 show two equal legs,
having the same values for user id, timestamp, buy/sell action, amount in BTC, amount in Yen;
however, since the trade id marks them as distinct, they are not treated as duplicates.
23You can also read