Data-Driven Modelling of Daylight Scattering by Roman Window Glass
←
→
Page content transcription
If your browser does not render page correctly, please read the page content below
This is the accepted manuscript of an article published as:
L. O. Grobe, A. Noback, and F. Lang (2020). Data-Driven Modelling of Daylight Scattering by Roman Window Glass.
ACM Journal on Computing and Cultural Heritage, Vol. 13, No. 1, Article 2, 20 pages. https://doi.org/10.1145/3350428

Data-Driven Modelling of Daylight Scattering by Roman Window Glass
                            Lars O. Grobe1 , Andreas Noback2 , and Franziska Lang2
                                1
                                    Lucerne University of Applied Sciences and Arts
                                         2
                                           Technische Universit at Darmstadt
                                                             Abstract
          With the advent of window glass, its optical properties arise as one important factor in the illumination, and
      thereby the visual perception, of Roman architecture. Computational simulation allows to reconstruct the daylight
      illumination of buildings with known geometrical configuration, if the scattering properties of window glass can
      be replicated. We describe a method to generate data-driven models of Roman window glass based on precise
      gonio-photometric measurements of archaeological finds. The method is employed to model four exemplary glass
      finds in the context of a simplified architectural scene, demonstrating the potential to support research in building
      history and archaeology focused on building techniques, lighting concepts and perception with accurate and reliable
      photometric data.
    Keywords: Roman window glass, Roman architecture, daylight, light scattering, daylight simulation

1     Introduction
In archaeology, the material attributes of Roman window glass can be discussed within two contexts: First as physical
remains of antique technology and therefore evidence in the research on the origins of raw materials, (centralised)
raw glass production, trade, recycling and the (probably local) manufacture of panes or domes. Secondly as physical
properties affecting the application of window glass in ancient architecture and therefore an element in its research.
Combining both aspects, the material attributes can act as a link between these contexts, and guide research on the
relation between glass production and application as well as its interdependent development over time.
    Besides the geometry, thickness, size and form, physical and chemical durability of Roman window glass, its optical
properties – specifically spectral transmittance and scattering – affect its usage. These properties are the measurable
effects of chemical and geometric features (Figure 1). In the spatial context of an architectural interior, they affect
illumination in relation to the optical properties of reflective surfaces and the characteristics of incident light. The
illumination of an ancient interior can be studied by means of lighting simulation applied to a spatial reconstruction
of its architecture. For such Cultural Heritage Predictive RenderingHappa et al. (2012, 2010), the acquisition and
modelling of the optical properties of Roman window glass is a necessity and not well researched Earl et al. (2013).
    This article aims to meet this demand with regard to light scattering by flat Roman window glass, and to exemplify
how glass properties as results of manufacturing processes relate the illumination of an architectural interior.

2     State of Research
2.1     Production and proliferation of Roman window glass
The invention of window glass is an important keystone in the development of architecture. Window glass is first
applied in Roman baths in the first century BC Baatz (1991) (Komp, 2009, p. 24). Finds of window glass of similar
time-frames from different sites in the Roman empire resemble each other in regard to colour, thickness, surface
structure and chemical composition Bachmann (2011); Gliozzo et al. (2013); Komp (2009); Arletti et al. (2010).
Window glass was produced independent of location in a similar fashion Drauschke and Greiff (2008); O’Hea (2001).
Raw glass originated from centralised production (Komp, 2009, p. 205), with a focus along the eastern Mediterranean
coast Saguì (2008); Freestone et al. (2008). This centralised production ended in the second half of the first millennium.
A rise in the use of plant ash in glass from Great Britain since the 6th century has been diagnosed, indicating a more
localised production Freestone et al. (2008). Similar findings for early Byzantine glass from Caričin Grad Drauschke
and Greiff (2008), and a disruption of raw glass production at the eastern Mediterranean coast in the 9th century
after natron from Egypt has become unavailable have been reported Saguì (2008).
    There is no evidence indicating a similar centralisation of further processing steps in glass production. It has to be
assumed that raw glass from various production sites was rather processed in small local workshops, or by itinerant
craftsmen (Komp, 2009, pp. 206,211,216). Nevertheless, there is some evidence of trade with finished products Komp
(2009). Roman window panes were mostly produced in rectangular shape with typical sizes of 20 cm to 80 cm(Komp,
2009, p. 20). Other types such as circular domed panes in occuli Fontaine and Foy (2008), and crown glass Fontaine
and Foy (2008); Allen (2002) are documented.

                                                               1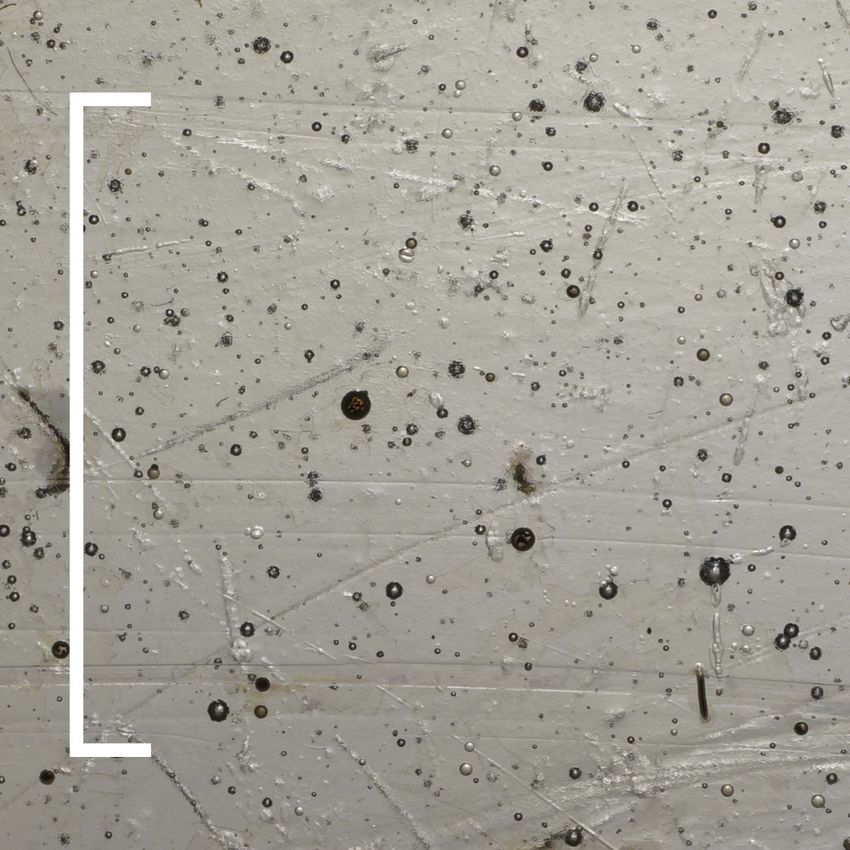
(a) (b)
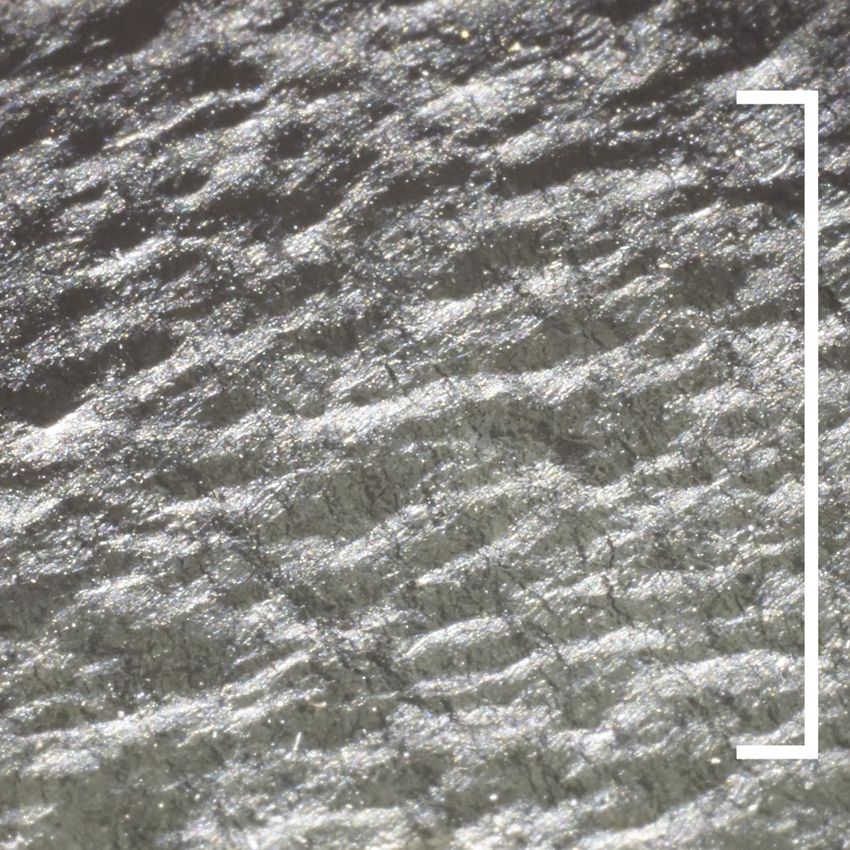
Figure 1: (a) Air inclusions and surface imperfections on a sample of blown window glass (sample G3) Noback et al.
(2018). (b) Leather-like surface structure of a sample of the matte-glossy type (G1). The features are typical for
Roman window glass and cause scattering of transmitted and reflected light (l = 10mm).
z(θ = 0)
source
θi
θs y
front φs φi
A
back
x(φ = 0)
receiver
Figure 2: Coordinate system and notation of directions to source (θi , φi ) and receiver (θs , φs ) relative to the sample
in the measurement of the BSDF as averaged over the sampling aperture A Noback et al. (2018).
2.2 Measurement of light scattering
Light scattering is described by the Bidirectional Scattering Distribution Function (BSDF) as a function of the incident
direction to the light source (subscript i), and the outgoing, or scattering direction toward which light is leaving
the sample (subscript s) ASTM E2387-05 (2011); Nicodemus et al. (1977). Both directions are typically notated as
spherical coordinates (θi , φi ) and (θs , φs ) relative to the sample (Figure 2). The BSDF is implicitly defined for an
infinitely small surface area by the rendering equation Kajiya (1986):
Z ωi =4π
Ls (θs , φs ) = BSDF (θi , φi ; θs , φs ) · Li (θi , φi ) · cos(θi ) · dωi , (1)
θi ,φi
with Ls being the scattered, Li the incident radiance and ωi the solid angle subtended by the light source.
Measurements of the BSDF inevitably imply several limitations Apian-Bennewitz (1995):
• The continuous BSDF can be sampled only by a finite number of directions.
• The BSDF is averaged over the solid angles of light source and detector.
• The BSDF is averaged over the observed surface area of the sample, the sampling aperture A, which has to be
large enough to cover a representative region.
2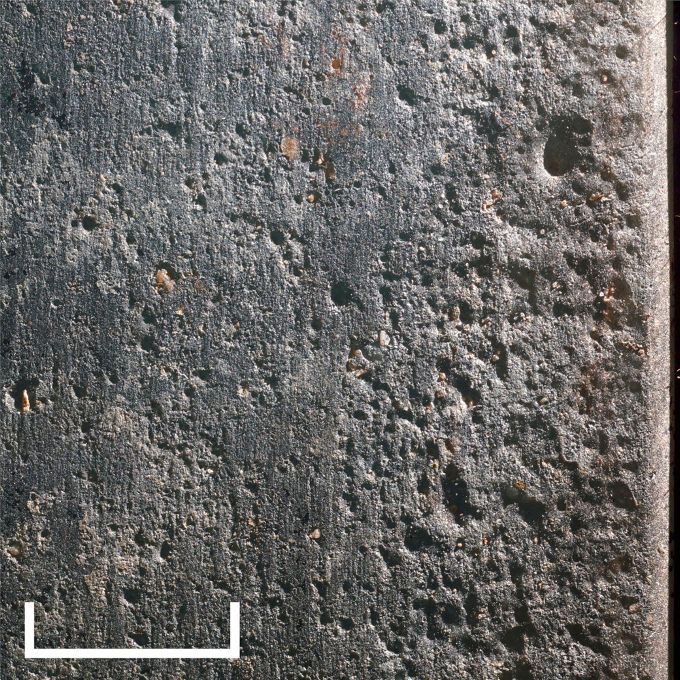
The effects of such sampling and averaging define, together with electric noise and scattering by the illuminating
optics, a characteristic instrument signature, that determines the lowest measurable BSDF and limits the achievable
directional resolution Stover (2012).
    The BSDF is measured by relating the light reaching a detector from a sample under known illumination for
combinations of incident and outgoing directions Apian-Bennewitz (2010). Instrumentation is implemented either
by scanning or imaging techniques Krehel et al. (2015). Scanning gonio-photometers acquire the BSDF for varying
incident and outgoing directions by mechanical movement. The sequential recording of the BSDF allows to adjust
e.g. amplification to the signal, accommodating a high dynamic range, and to refine the directional resolution of
measurement Apian-Bennewitz and Hardt (1998). Imaging gonio-photometers aim to decrease the time required
for the BSDF measurement by the simultaneous acquisition for many scattered directions. This is implemented by
assigning the pixels of the imaging sensor to the corresponding scattered directions by reflective or refractive optics.
Dynamic range and resolution of imaging gonio-photometers are typically lower than those of scanning instruments
Meyen et al. (2014).

2.3    Scattering models for daylight simulation
Lighting simulation requires models that evaluate to reflection and transmission for arbitrary pairs of incident and
scattered directions. These representations of the BSDF can broadly be categorised into parametric descriptions of light
scattering, either phenomenological or analytical, and data-driven models Kurt and Edwards (2009). Phenomenological
models are more widespread in daylight simulation and aim to replicate an observation with few, easily measurable
variables or by fitting to measured BSDFs Ngan et al. (2005). Often the BSDF is represented as a combination of lobes,
modelling directional scattering, and a diffuse background Geisler-Moroder and Dür (2010). Analytical models are
parametrised by properties that relate light scattering to explanatory concepts from physics (e.g. micro-facet theory
Walter et al. (2007)). Thereby analytical models allow to contrariwise reveal such properties by fitting a theoretical
model to measured BSDFs.
    While analytical and phenomenological models cover a broad spectrum of scattering phenomena, they lack gener-
ality. A fundamentally different approach is the direct utilisation of measured data by data-driven models Matusik
et al. (2003). Due to the discrete nature of BSDF measurements, such models imply interpolation, typically by an
intermediate set of basis functions, and extrapolation. Efficient techniques for data-reduction, storage and look-up are
essential to handle the large volumes of discrete data when high directional resolution is to be achieved.
    Radiance is a thoroughly validated, open-source daylight simulation suite that implements physically plausible,
parametric reflection and transmission models, as well as a compact data-driven model. The model achieves high,
locally adaptive directional resolution (up to 1.5◦ for anisotropic cases) and was developed to replicate the transmission
properties of optically complex fenestration. Even highly irregular, computed or measured BSDF can be compiled
into the data-driven model by a tool-chain distributed with the software Ward et al. (2012, 2014); Grobe et al.
(2017). The software by default employs backward ray-tracing, a rendering technique that achieves photo-realistic and
physically valid imagery but cannot model effects such as irregular deflection and concentration of light by reflection
and refraction (Ward and Shakespeare, 1998, f. 579f.)Kider et al. (2009). This shortcoming is addressed by bidirectional
photon mapping, that optionally replaces the backward algorithm in the diffuse inter-reflection calculation and allows
accurate replication e.g. of caustics Jensen (2001); Schregle (2004). Besides its application to geometric models
of reflectors and fenestration systems, photon mapping has been demonstrated to accelerate image synthesis with
data-driven models under directional illumination Grobe (ress).

2.4    Transparency and translucency in case studies that reconstruct illumination
The effect of light scattering, not by glass but by thin marble tiles covering the Demeter temple at Sangri on the island
of Naxos (Greece), has been modeled to synthesise images for an assessment of the roof’s appearance and its effect on
the illumination of the interior. The model is based on transmission measurements under diffuse illumination, and does
not account for directional dependency or non-diffuse transmission Ohnesorg (2011). The generated imagery has been
reused to visually match renderings of the temple of Zeus in Olympia (Greece), which is assumed to be illuminated
through a similar, translucent roof, since the transmission properties as required for a simulation are unknown. The
generated visualisations have been employed in an evaluation of different hypotheses about the illumination of the
colossal statue of Pheidias located in the temple Patay-Horváth (2016).
    Dielectric solids, that are constraint by non-planar interfaces, form a particular case of transmission that is char-
acterised by deflection and potentially concentration of light. The effect, referred to as caustics, has been studied for
the case of the oil lamps of the Mosque of Cordoba in a simulation study Kider et al. (2009). The caustics caused by
the partially filled glass vessels were acquired by cameras and translated into a data-driven description, that appears
to be similar to ray files as measured in near-field gonio-photometry of modern luminaires IES TM-25 (2013).
    A model of light transmission through medieval stained glass has been developed based on ellipsiometric measure-
ments on samples of different kinds of glass comprising the windows Cerise et al. (2012). To acquire the scattering

                                                            3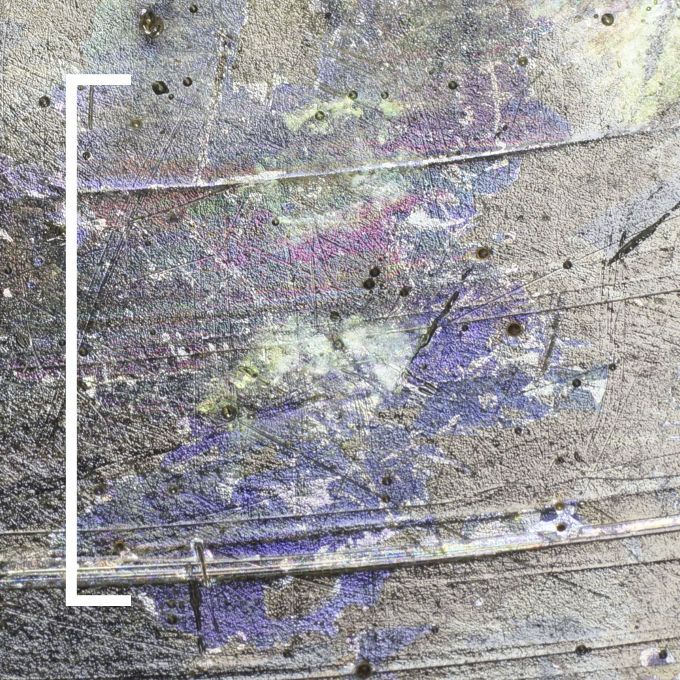
properties of an entire window in the the cathedral of Lausanne (Switzerland) in situ, the spatially varying trans-
mission properties of the stained glass were reconstructed by combining images under varying, natural illumination
with a dictionary of laboratory measurements on comparable samples. The model allows relighting – the generation
of images of the cathedral’s rose window under arbitrary sky conditions – by multiplication of a matrix representation
of the BSDFs with an illumination vector Thanikachalam et al. (2016).
    The effects of window techniques, coloured and translucent glazing, scattering by translucent divisions and the
illumination through adjacent spaces have been studied in detail for the case of the Katholikon in the Monastery of
Hosios Loukas (Greece). The light simulation software Lightscape was employed to reconstruct the illumination,
and to assess the interplay of light, interior surfaces, and building geometry. Details of the modelling of window panes
or other transmissive and reflective building elements are not given Piotrowski (2006).
    The data-driven model as implemented in Radiance has been employed to model light scattering by window panes
in a detailed simulation model of 6th century Hagia Sophia in Istanbul (Turkey). The effects of different glass types on
horizontal illuminance distribution, shadow patterns and the three-dimensional perception of shapes and reliefs were
demonstrated Noback et al. (2018).

2.5     Objectives
To enable the simulation-based reconstruction of the illumination and its influence on the perception of the interior
of Roman architecture,
    1. the BSDF of four finds of Roman window glass have been measured for the first time,
    2. these measurements have been compiled into data-driven transmission models,
    3. the models have been employed in daylight simulations for a simplified room model, and
    4. the effects of light scattering properties on the illumination of that room have been evaluated based on the
       synthesised images.
The authors aim to provide a general, reliable and accurate method to base research on the interplay of glass-making
and the perception of interiors under natural illumination employing reconstruction and computational simulation on
quantitative, photometric grounds.

3     Four samples of Roman window glass
3.1     Selection of exemplary samples by manufacturing techniques
Four glass fragments (G1-G4) were selected from the archaeological collection of the LVR-LandesMuseum (Bonn,
Germany). The set of exemplary samples, shown in Figure 3, is not representative for Roman glass in general, but
rather chosen to cover a wide spectrum of provincial Roman window glass finds in terms of distinct and typical surface
features, based on knowledge regarding production methods for rectangular Roman window panes:
    1. Formed window glass comprises one matt and one glossy surface. It is translucent rather than transparent and
       typically between 3 and 6 mm thick. It was produced by pouring molten glass on a planar surface. With various
       tools, the mass was flatten and stretched into a rectangular pane Wiesenberg (2016). During this process the
       glass cools down fast, probably causing the frequently found, leather like structure. Formed glass often comprises
       remains of sand that has been used as abherent (Komp, 2009, pp. 60ff.). The sides and corners are typically
       thicker than the centre and showing tool marks. This glass has been common in the early Roman empire Arletti
       et al. (2010).
    2. Blown window glass is thinner and comprises two glossy surfaces. It can be described as genuinely transparent
       but shows more distortion and stray light than today’s window glass. In its production, a cylinder was blown,
       cut and flattened Wiesenberg (2016). It can be wavy and often shows a lot of air bubbles (Komp, 2009, pp. 73ff.).
       This glass emerged in the end of the 2nd century (Komp, 2009, p. 69) and dominates the finds since then Arletti
       et al. (2010).
The inclusion of the samples into the museum’s collection dates back several decades. Unfortunately, initial cleaning
and preparation of the samples was not documented. Find context and dating are reported in Table 1 Komp (2009).

3.2     Results of visual inspection, macro photography and microscopy
The four samples were visually inspected to record the optical relevant features of their surfaces and glass mass,
and to search for evidence of production methods, contaminants, results of corrosion and cleaning marks. This was
complemented by macro photography and microscopy (Figure 4).

                                                            4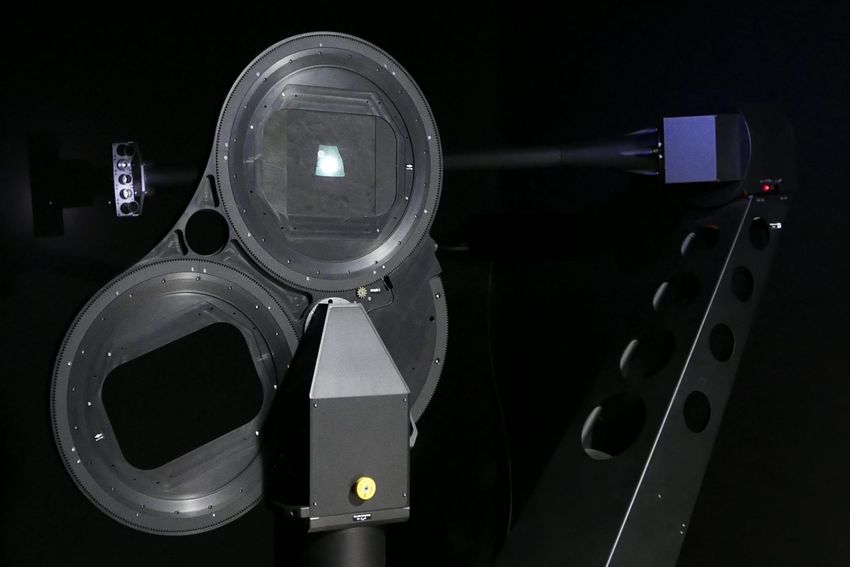
G1                                                            G2

 G3                                                            G4

Figure 3: Samples G1-G4 in their mounts. The ellipses illustrate the effective sampling apertures for θi = 60◦ , φi = 0◦
(l = 50mm).

    G1: formed window glass with leather-like structure. Smooth side: irregular distributed signs of slight corrosion
with small holes; some areas of more evolved corrosion. Matt side: elongated wavy structure (λ ≈1 mm) with round
and lenticular dimples (Figure 1(b)); some deeper round dimples; remains of mortar; slight scratches diagonal to
surface structure, probably from cleaning; slight signs of corrosion. Glass mass: few, small ( 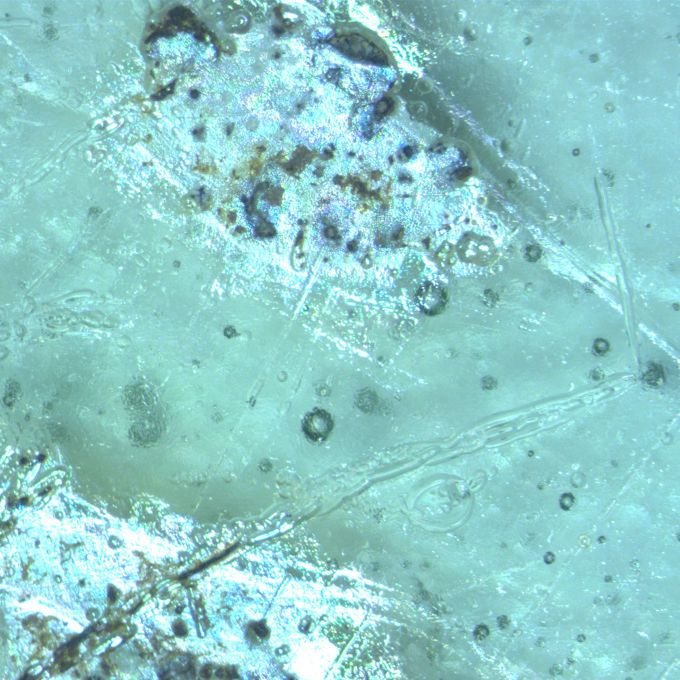
(a)                                    (b)                                     (c)

Figure 4: (a) Iridescent corrosion on sample G3 Noback et al. (2018). The resulting fine roughness of the surface is
likely to cause some amount of scattering (l =10 mm). (b) Areas with inclusions and deeper linear corrosive structures
on sample G3 under the microscope. (c) Edge, grinding structure and grains of sand from sample G4 (l =10 mm).

                     Table 2: Incident elevation angles θi measured for azimuth φi =0◦ and all samples.
 ID    θi,f ront                                                  θi,back
 G1    0◦   to   70◦ (∆θi   =10◦ ), 75◦                           105◦ , 110◦ to 180◦ (∆θi =10◦ )
 G2    0◦   to   70◦ (∆θi   =10◦ ), 75◦                           105◦ , 110◦ to 180◦ (∆θi =10◦ )
 G3    0◦   to   60◦ (∆θi   =10◦ )                                130◦ to 180◦ (∆θi =10◦ )
 G4    0◦   to   70◦ (∆θi   =10◦ ), 75◦                           105◦ , 110◦ to 180◦ (∆θi =10◦ )

4     Optical characterisation of light scattering
4.1    Measurement method and instrumentation
Measurements were performed on a scanning gonio-photometer Apian-Bennewitz (2010). The instrument comprises
an optical bench to illuminate a sample held by a programmable sample mount, and a robotic arm featuring detectors
for photometric and radiometric measurements (Figure 5). The incident direction is set by rotation of the sample
mount over the vertical axis, and rotation of the holding plate by the sample mount. The outgoing scattered directions
are varied by movement of the detector on configurable paths, aimed at the sample.
    For this research, a 150 W Xenon arc-lamp was employed as part of the illuminator. The emitted light is collected
by condenser lens L1 and a back-mirror, which is integrated in the lamp enclosure. After spatial filtering by pinhole
P H (diameter ≈ 2 mm), the beam is focused by lens L2 on the sample (Figure 6).
    This configuration of the illuminator was chosen to minimise the size of the sampling aperture A. It results in an
almost circular, illuminated spot, equal to A, that has a diameter of ≈ 8 mm for normal incidence. The configuration
achieves a maximum directional resolution of ≈ 1.5◦ . With increasing θi , A widens to an elliptical shape of width w =
8 mm/cosθi , while the height remains constant h = 8 mm. The increase of w limits the range of incident directions,
since it must not exceed the sample’s size.
    Wooden holding plates were prepared for each sample, utilising a laser cutter to fit the irregular shaped glass
fragments to the sample mount. The samples were mounted so that the sampling aperture is located in an area where
the sample shows minimum signs of corrosion or other defects (see Figure 3).
    Prior to the light scattering measurement, the unobstructed illuminating beam is characterised and the contained
power Pi is calculated by integration over all outgoing directions. Only after this initial step, the samples are moved
into the optical path.
    In the course of the measurement, first the incident direction is set (Table 2). Subsequently, the distribution of
scattered light is scanned by sampling the detector signal at fixed intervals during the continuous movement of the
robotic arm. The detector movement first describes a coarse spherical scan-path. In a subsequent pass, regions where
peaks were identified during the first scan are refined. The combination of spherical and peak scans leads to a total of
≈ 400 000 to 500 000 data-points per incident direction, including reflection and transmission.
    The BSDF for each data-point is computed from the illuminance E recorded by the detector at position (θs , φs )

                                                             6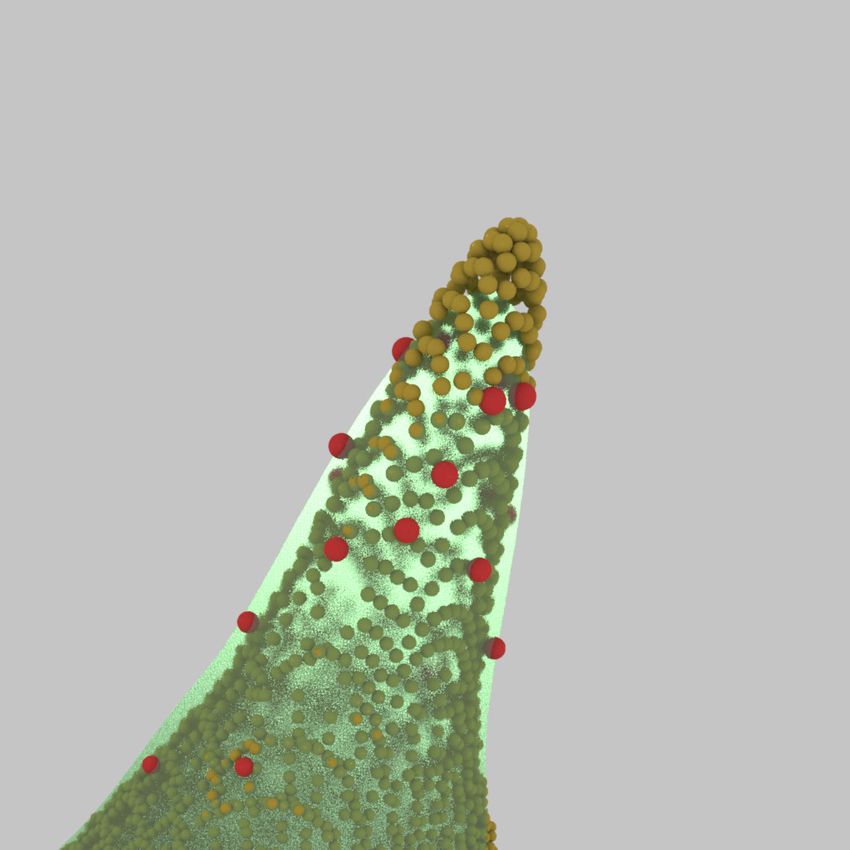
Figure 5: Detector aimed at G1 held by its holding plate in the automated sample mount Grobe (2017).

                  L1     L2

          Lamp      PH     Baf f le                    Sample plane               Detector

   Figure 6: Configuration of the illuminator employed in the BSDF measurements Lee et al. (2018).

                                                 7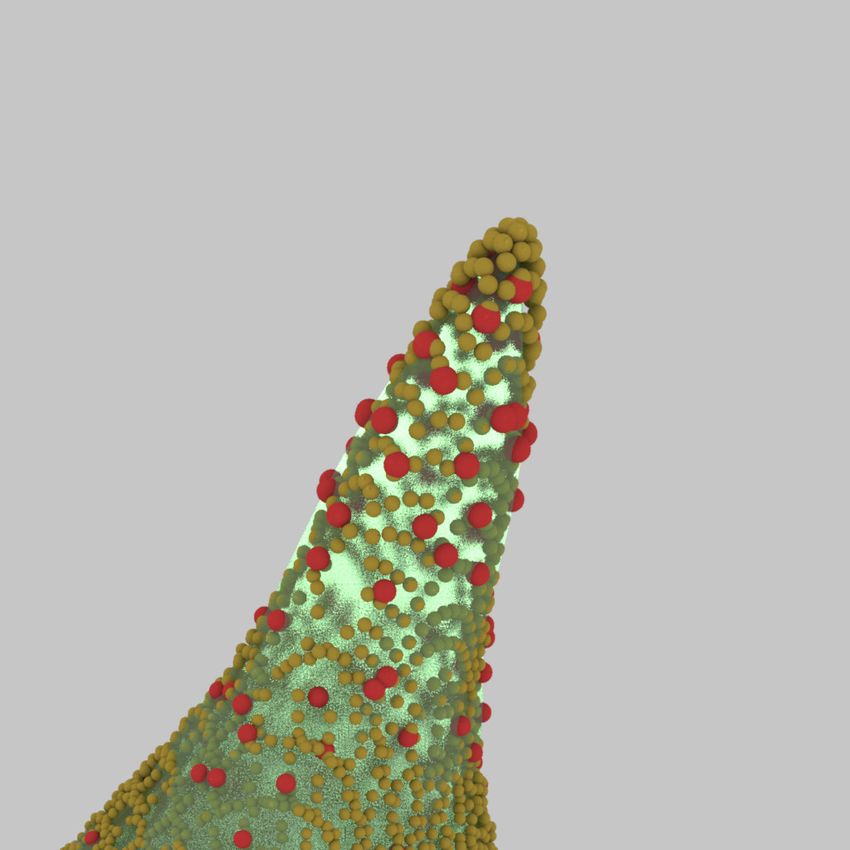
and the beam power Pi as (Apian-Bennewitz (1995))

                                                                            E(θi , φi , θs , φs )
                                              BSDF (θi , φi , θs , φs ) =                         .                   (2)
                                                                             Pi · cos(θs )

4.2      Measured optical properties
Measured light scattering by each of the four samples is illustrated by projections of the transmission hemisphere in
Figure 8 (left) for one exemplary incident direction θi = 40◦ , φi = 0◦ . Shown is the BSDF multiplied by cos(θs ).
This reverses the division in Equation 2, since otherwise even low noise would approach infinity at directions close to
θs = 90◦ . The full measured data-set is made available for future research Grobe and Noback (2019).
    All four samples exhibit a peak due to strong forward transmission, and a diffuse background. However the shape,
namely the width, and the intensity of the peaks, as well as the level of the backgrounds differ significantly.
    The distinctiveness of the peak primarily affects the clarity of vision and the softness of shadows cast by direct
illumination through the glass. The background increases the brightness of the glass itself when exposed to direct
sun-light – regardless the view direction. This adds to the ambient illumination of the attached space, and affects
vision through and appearance of the glass.
    G2 and G3 are similar in that they combine little diffuse scattering with sharp peaks, indicating strong directionality
and just little increase of brightness by scattering of direct sun-light.
    G1 has a much stronger diffuse background, and the wider peak indicates that incident sun-light is spread over
a wider range of directions. The diffuse scattering would significantly increase the brightness of the window when
exposed to direct sun-light, giving it a glowing appearance that overlays view through, which is blurred due to the
width of the peak.
    G4 exhibits the strongest scattering, widening the peak to what could be better describes as a forward lobe, and
increasing the diffuse background. The glass can be expected to appear like a bright, translucent surface rather than
transparent glazing under direct sun-light.

5      Modelling light scattering based on measurements
The gonio-photometric measurements provide accurate descriptions of the outgoing distribution of transmitted light
only for the selected, measured incident directions. However, a model to be applied in daylight simulation must predict
transmission from any direction on the outside to the inside to account for light transport
     • from the continuously changing position of the sun,

     • from the sky hemisphere, and
     • from the ground and the reflective surroundings.
Rather than fitting a mathematical description of light scattering based on a-priori assumptions, the presented research
relies on the data-driven BSDF in Radiance. The compilation of measured data into the model comprises a sequence
of data-processing steps, which are implemented by the commands pabopto2bsdf and bsdf2ttree Radiance Grobe
et al. (2017); Ward et al. (2012, 2014). Resulting models of the four samples are published alongside this article Grobe
and Noback (2019).

5.1      Fitting measured distributions by radial basis functions
Each measured distribution is approximated by a set of Gaussian Radial Basis Functions (RBFs). This effectively
replaces the high amount of data contained in the high-resolution measurements by a set of few parameters. The
RBFs representing all measured transmission data could e.g. generated by the command pabopto2bsdf *_trans.dat
> trans.sir.
    The accuracy of the algorithm is controlled by a target value of the acceptable relative Mean Squared Error (MSE)1 .
The initial target of 0.03 particularly widened pronounced peaks. Consequently, the differences between the peak
shapes of the four samples were eliminated by the RBF approximation. Given the particular importance of the peak
shape as an indicator of the clarity of the glass, the target MSE was decreased from 0.03 to 0.005. The effect of the
setting is demonstrated by an overlay of the hull of the RBFs and the the measured outgoing transmission distribution
for of sample G3 for θi =30◦ ,φi =0◦ (Figure 7).
    1 Defined   by SMOOTH_MSE in src/cv/bsdfrbf.c.

                                                                    8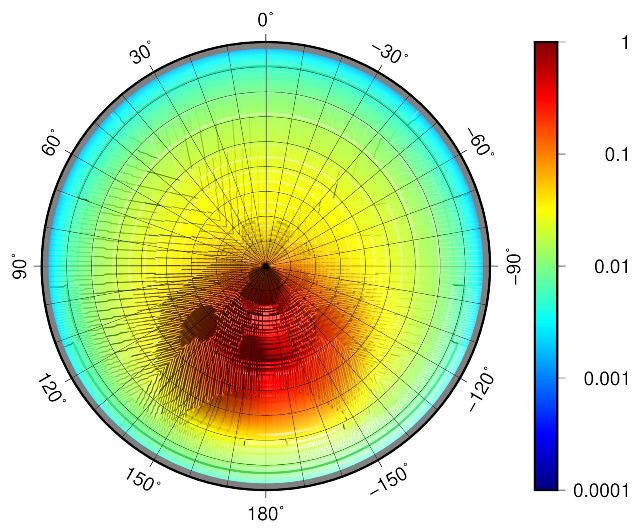
(a)                                                                    (b)

Figure 7: Transmitted peak through G3, θi =30◦ (logarithmic scale). Decreasing the target MSE from 0.03 (a) to 0.005
(b) increases the number of RBFs in the model (directions indicated by red spheres), and improves the accordance of
the RBFs’ hull (green surface) with the measured data-points (yellow spheres).

5.2         Interpolation and sampling
The RBF representations are grouped to form four geometric BSDF components front-reflection, front-transmission,
back-reflection and back-transmission according to the attribution of incident and outgoing directions to the inside or
outside of the sample.
    The interpolation of distributions itself poses a particular challenge. A naive, linear interpolation of two distri-
butions with a directly transmitted peak would e.g. modulate the height of the two peaks at their initial location
rather than moving the peak. Radiance addresses this challenge by the application of an advanced mass-transport
algorithm Bonneel et al. (2011).
    The interpolated BSDF is discretised according to a given target resolution, and stored in a three-dimensional
data-cube2 . In a subsequent pass, the directional resolution of the data-set is reduced by merging adjacent cells in
regions of low variance until a given data-reduction target is reached.
    For this research, an initial angular resolution of ≈ 0.7◦ led to a data cube of 28 × 28 × 28 elements, which was
then reduced by 95 %. Discretisation and data-reduction were achieved by the command bsdf2ttree -g 8 -t 95
trans.sir > trans.xml.
    The BSDFs predicted by the resulting models of all four samples for θi =40◦ , φi =0◦ are contrasted with the
corresponding measurements in Figure 8.

6      Simulating the effects of light scattering
6.1         Setup of simplified test scene to compare glazing properties
The four glass models were applied in a simplified architectural scene. The scene comprises a room on quadratic plan,
featuring a groin vault and a simplified Diocletian window oriented East (Figure 10(a)). Daylight simulations were
performed with each glass model (G1-G4) applied to the window’s glass panes (Figure 10(c)–(f)), and without any
panes as reference (Figure 10(b)). Walls, floor and vault are equally set to ideally Lambertian reflectance ρ = 0.403 .
The scene has been designed to evaluate the effect of the window’s scattering properties on the appearance of the
window and opaque surfaces exposed to directly transmitted sunlight.
    The scene is lit by a standard International Commission on Illumination (CIE) sunny sky model ISO 15469:1997
(1997), configured for mid morning on a spring day close to Equinox. Combined with the orientation of the window,
these settings provide a patch of sunlight on the Northern wall and allows light to be scattered toward the observer.
    2 This
       assumes isotropic scattering. To replicate anisotropic scattering, the data-structure would become a tensor of four dimensions.
    3 The
       value approximates the mean total reflection measured by the authors on different marble or stone wall cladding common in
Roman architecture.

                                                                  9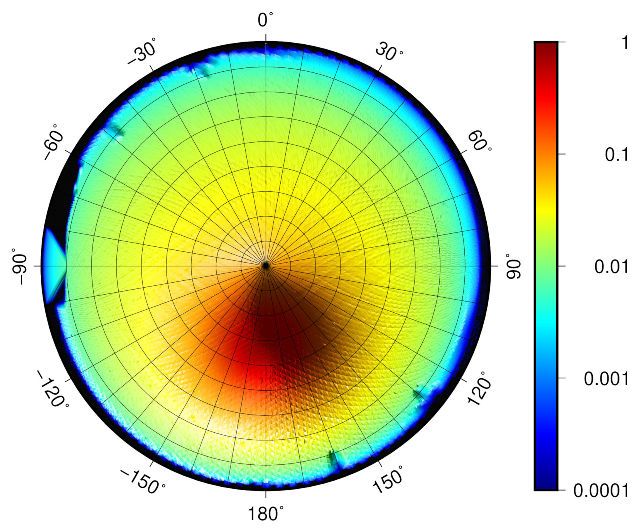
G1:

  G2:

  G3:

  G4:

Figure 8: Measured BSDFs (left) and data-driven models (right) for incident direction θi =40◦ , φi =0◦ Noback et al.
(2018). Note that in-plane angles φ are reversed for the models.

                                                        10
i
90
80
70
60
Incident angle θi [°]
East 50
South
West 40
max. θi G1, G2, G4
max. θi G3
30
20
10
6 8 10 12 14 16 18
Local Time
Figure 9: Incident angle θi for windows facing East, West and South at March 20th (Equinox). The validity of the
models G1, G2and G4 of max. θi = 70◦ resp. G3 of max. θi = 60◦ is exceeded at multiple times of day.
This solar geometry ensures that the incident angle of sunlight (θi = 40.7◦ ) relative to the glass surface is within the
valid range of the models (θi < 60◦ for G3, θi < 75◦ for the other samples).4 θi can be calculated from the solar
Zenith angle Zsun = 90◦ − e and Γ for an East-oriented window (slope ω = 90◦ , azimuthal rotation toward West from
South γ = −90◦ ) according to Equation 3 Reda and Andreas (2008):
θi = arccos cos(Zsun ) cos(ω) + sin(ω) sin(Zsun ) cos(Γ − γ) (3)
The Radiance command gensky is parameterised by the solar elevation angle e (measured from the horizon) and
the topocentric astronomers azimuth angle Γ (in Radiance measured toward West from South). According to the
chosen solar geometry with e = 29.9◦ , Γ = −57.4◦ , the sky model was generated by gensky -ang 29.9 -57.4. The
sky model calculates the sky luminance depending on the direction and features a diffuse ground reflection that was
set to ρ = 0.20. The colours of sun, sky and ground were set to white, blue and beige respectively to distinguish their
contributions to the illumination of the room.
The simulations were conducted utilising backward ray-tracing as implemented in Radiance, and were controlled
by the program rad. To minimise artefacts due to the stochastic sampling as part of the indirect-diffuse calculation,
parameters Variability and Quality were set to High. Given the simplified model geometry, the Detail parameter
was set to Low. The diffuse-indirect calculation was limited to three reflection steps.5
6.2 Luminance ratios and imagery to compare the effect of light scattering
For each of the rectangular image regions marked in Figure 10(b), the average luminance were extracted from the
imagery. The ratio of the the average luminance in the directly illuminated image region A over that in the diffusely
illuminated region B on side-wall was evaluated as LA /LB . The ratio of region C, covering parts of the glazing, over
the diffusely illuminated region on the window wall D, was calculated accordingly as LC /LD . All luminance averages
and their ratios are reported in Table 3.
The pixel values in the images resulting from the simulation are in units of luminance. These are photometrically
valid representations of the light distribution within the field of view, but do not correspond to the visual perception by
a human observer. To approximate the latter, from each luminance map an image was generated with the Radiance
program pcond. The software implements a perception model, that mimics aspects of human vision such as contrast
reduction and glare from bright light sourcesWard Larson et al. (1997) (Figure 10). The resulting pictures simulate
the perception of the scene by an observer with vision adapted to its brightness and contrast.
6.3 Effects of the four samples on the illumination of the test scene
Four renderings in Figure 10(c)–(f) show the impact of the different light scattering properties of samples G1 to G4 on
visual perception. The view is identical to that of the reference image without glass in Figure 10(b). The luminance
4 Sinceisotropic transmission models were used, φi was not considered.
5 Resulting in the following rpict parameters: -dp 1024 -ar 31 -ms 0.1 -ds .2 -dt 0.05 -dc 0.75 -dr 3 -ss 16 -st 0.01 -ab 3 -af scene.amb
-aa 0.075 -ad 4096 -as 2048 -av 0.5 0.5 0.5 -lr 12 -lw 1e-5 -ps 8 -pt 0.04.
11B
C
A
D
(a) (b) (c)
(d) (e) (f)
Figure 10: The test scene: (a) Geometric model of the test scene with its East-facing window. (b) Reference scene
without glazing, rectangular areas A to D as used in the calculation of luminance ratios. (c)–(f) Renderings of the
test scene with models G1-G4. The renderings mimic human visual response: it adapts to the contrast and brightness
of the individual scene. This allows to compare the impression on the scene on printed paper, but not the comparison
of brightness values from one setup to another.
1225000
2500 217 211 26492
3178
1923 3375
1774 941
271 141
250
51 30
25 cd m−2
(a) (b)
7232 16611
166 16611 102 262
1877 980 5934
731 1021 450
116 141 77
24 26 22
(c) (d) (e)
Figure 11: Luminance distributions in the test scene by reference (a) and models G1 to G4 (b)–(e) (logarithmic scale).
Maximum and minimum values at their respective locations (circles) and average luminance for regions A–D (squares).
13Table 3: Luminance averages and ratios on side-wall (LA , LB ) and window-wall (LC , LD ).
LA (Patch) LB (Wall) LA LC (Window) LD (Wall) LC
ID
[cd m−2 ] [cd m−2 ] LB [cd m−2 ] [cd m−2 ] LD
Reference 1774 217 8.18 1923 271 7.10
G1 941 211 4.46 3375 141 23.90
G2 731 166 4.40 1877 116 16.12
G3 1021 102 10.00 980 141 6.93
G4 450 262 1.72 5934 77 77.36
distributions are visualised in Figure 11. The corresponding luminance averages of the image regions A to D, and
their ratios, are listed in Table 3.
Reference: No glazing. In the reference rendering without glazing, the brightest luminance values in the scene can
be found within the sky (LC ) closely followed by values in the patch of sunlight on the wall on the left (LA ). This
patch has sharp edges resulting in a high luminance ratio LA /LB . The luminance ratio LC /LD of window and the
wall beneath is similarly high. The colours in the vaults show that ground reflection contributes to their illumination.
Blue light from the sky illuminates the walls and the floor6 . The visual result would be similar in a scene with modern
glazing.
G1: Formed window glass with leather-like structure. The luminance values in the window LC in this scene are
more than three times higher than in the light-patch and the luminance ratio LC /LD is much higher than in the
reference. The window lights up in the sunlight. The edges of the light-patch are completely blurred resulting in a
significantly reduced luminance ratio LA /LB . The vaults appear similar to the reference.
G2: Formed window glass with flat lower side. This scene shows similarities to G1 with similar luminance ratios
but lower absolute values. The blurring of the edges of the light patch is a little bit less distinct and the luminance
ratio LC /LD is a little bit lower.
G3: Blown window glass. Although the illumination of the scene can be clearly distinguished from the reference,
the blown window glass results in less blurring than the formed glass types. The window does not significantly light
up in the sunlight. Luminance values and ratios reflect that and are similar to the reference. 7
G4: Formed window glass with sings of grinding. The luminance values in the window LC in this scene are more
than ten times higher than in the light-patch and the luminance ratio LC /LD is much higher than for the other
glasses. The window lights up brightly in the sunlight. The light-patch can not be distinguished form the surrounding
luminance of the wall. The luminance ratio LA /LB is significantly reduced. The vaults are brighter than in the other
scenes as they receive scattered sunlight from the window.
7 Discussion
7.1 Samples
All samples show signs of corrosion that affects the glass surfaces and thereby the scattering of light. Since the
combined effects of manufacturing and ageing were measured, it is not possible to isolate the latter, to eliminate it
from the result, or to estimate its impact. Consequently, the presented characterisation and data-driven models do not
reflect the original conditions of the samples, but include effects of glass-making techniques as well as the subsequent
deterioration of the artefact during and after its use until excavation, cleaning and processing of the archaeological
find, and any later reactions with its environment.
Most of the samples show uneven thickness so that the surfaces are not parallel to each other and light is refracted.
G1 shows remains of mortar, G3 and G4 wrought edges. All four samples are probably from the edges of window
panes. The centre of a window pane is expected to be thinner and therefore might show less scatter from air inclusions.
This implies that the samples, and therefore the measurements, are not necessarily representative for entire window
panes.
7.2 Measurements
The distinct visible features of the sample that can be attributed to the two manufacturing techniques affect light
scattering. G3, the only example of blown window glass in this research, exhibits the strongest directionality, reflected
by a strong peak in the distributions, and little diffuse transmission. The three formed glass fragments significantly
differ in their light scattering properties. All formed glasses have a higher diffuse background than the blown glass,
6 The generated BSDF models do not effect the colour of transmitted light, therefore the renderings with the glass models appear grey.
7 Thereduced contrast between the intersecting barrels vaults in this rendering can be attributed to the high incident angles of the light
reflected from the ground. These angles are outside the valid range of this model.
14but very different peak shapes. The results indicate the diversity of Roman window glass in terms of scattering of
directional transmission, and diffuse transmission, characteristics closely related to clarity and haze.
7.3 Modelling and simulation
The test scene illustrates the characteristic differences between the four evaluated samples. Effects by opaque surfaces
were deliberately minimised. For similar reasons, the CIE clear sky was chosen as an extreme sky condition. It helps
to isolate scattering by the different kinds of window glass from the gradual change of diffuseness of incident light
defined by the sky model. Such nuances would be better replicated by the current, extended set of CIE skies ISO
15469:2004 (2004), or the parametric sky model by Perez Perez et al. (1990). The latter is parametrised by commonly
available, monitored weather-data, making it the de-facto standard in daylight simulations in building sciences. In
historical sciences, this tight link to empirical data however becomes problematic due to the lack of historical records.
The deliberate use of synthetic models, e.g. the CIE skies, therefore seams to be preferable unless propositions on
the luminous conditions at a particular point in time in history can be justified. For the same reason, data-driven
techniques such as image based lighting Debevec (2005); Mehlika (2013) can only simulate a modern sky condition,
but cannot reconstruct the luminous conditions in the distant past.
The use of a monochromatic sky model supports the differentiation between diffuse sky-light (blue in the exemplary
simulations) and direct sun-light (white). This reflects the focus of this research on light scattering, e.g. the spatial
distribution of light. Consequently, the interior surfaces of the test scene, and the data-driven BSDF models, are grey.
Spectrally resolved sky models, e.g. extensions of the Perez model that are frequently employed in computer graphics
Preetham et al. (1999); Hosek and Wilkie (2012), would provide more realistic imagery and allow to study the effects
of emitted light, transmission and reflection on colour perception. The method in principle supports the acquisition
and modelling of coloured BSDF.
Radiance and its data-driven BSDF model have proved of value for the given task, but require careful setting
of parameters that are of utter importance for the validity of the results as well as the computational effort. The
authors relied on the backward ray-tracing algorithm for the exemplary light simulations. This required to refine the
parametrisation of the indirect-diffuse (or ambient) calculation to ensure the adequate sampling of the high-resolution
BSDF models. The bidirectional photon mapping algorithm, also implemented in Radiance, would lend itself as an
alternative in simulations with models of higher complexity.
Compared to the reference Figure 10(b), all models of Roman glass significantly affect the illumination of the test
scene (Figure 10). This is reflected by the luminance averages, and their calculated ratios as reported in Table 3. The
effects on image regions differs for the evaluated glasses. For the side wall, it is G3 that stands out from all samples
due to its strong directional transmission, resulting in a luminance ratio LA /LB = 10.00 compared to 1.72 to 4.46
for the other samples. On the window wall, it is G4 that achieves an outstanding LC /LD = 77.36 compared to 6.93
to 23.90 for the others. These luminance rations reflect the two apparent key aspects of directionality and diffuse
background, that can be observed directly in the BSDF measurements in Figure 8.
8 Conclusions, limitations and further research
8.1 Samples
The main challenge in the development of data-driven models, if originating from measurements on archaeologic finds,
is to address the effects of deterioration that are inherent in the empirical data. The translation of the measured
properties of archaeologic finds into simulation models inevitably includes effects by damage and age. If the objective
of modelling is to reconstruct past conditions, these effects need to be eliminated. Further research is required to
distinguish between the sources of scatter and to reconstruct the original optical characteristics without deterioration.
This is of special importance in the case of blown glass panes, where corrosion might significantly contribute to the
total amount of scatter.
To generate a representative model, e.g for an entire window pane, or the average optical properties of window panes
originating from a given manufacturing technique, a larger amount of samples would be required. This research aims
at the development and demonstration of a modelling method rather than representative results. The set of samples
combines the predominant manufacturing techniques with typical deterioration effects. Only few samples from a
limited area, which are not attributed to a particular architectural context, were characterised. Further research is
necessary to generalise the results and to investigate other types of Roman window glass.
8.2 Measurements
The measurements are ample to generate valid material models for a limited range of cases, and accurately describe
light scattering by the different samples, beyond what can be distinguished by visual inspection. Besides the presented
application in the generation of models, the measured BSDF may also provide valuable information to identify effects
by e.g. production techniques and ageing of the samples.
15While the measurements led to accurate models for the range of incident directions included in the measurement,
BSDF data closer to grazing angles is necessary to generate models of universal use. A reasonable limit for this would
be e.g. θi ≈ 82◦ 8 . However, with the current setup, this results in an elliptic sampling aperture of 8 mm × 80 mm that
effectively exceeds the size of most available samples. Direct light from grazing angles θi > 82◦ is occluded by window
frames or embrasures in typical architectural contexts and transmission decreases due to the increased reflection on
glass interfaces for angles close to grazing.
8.3 Modelling and simulation
The method is applicable to the study Roman window glass. Light scattering, as predicted by the data-driven models,
alters the lighting of the scene significantly. This implies a clear distinction from daylighting with modern glazing. It
further implies the importance of production methods for the lighting of Roman interiors. The model derived from
the blown glass sample differs significantly from all others. Nevertheless the formed glass models have own distinct
lighting characteristics. For the latter, the window effectively becomes an area light source in itself with significant
visual importance. It may introduce glare and results in a more evenly light distribution over the scene’s surfaces. The
application of the blown glass model for-mostly blurs the edges of the patch of sunlight and reduces the contrast over
the northern wall significantly. The distinctness of this effect may be reduced for a glass in its original state without
corrosion. Nevertheless the effect is of visual importance.
8.4 Outlook
The scattering characteristics of the glazing material are a relevant factor for the lighting of Roman architecture. This
correlation asks for thorough research. It relates to many aspects of interior architecture: marble decoration, wall
painting or mosaics etc. It relates to lighting concepts and the architectural staging of performative enactment. The
transition in the usage from formed to blown window glass since the end of the 2nd century (Komp (2009) p. 69,
Arletti et al. (2010)) relates to a significant change in lighting of Roman architecture. The results clearly call for
further study, especially for real architecture as test cases.
To extend the range of incident directions, that can be measured on small glass fragments, other light sources
achieving a smaller sampling aperture, e.g. lasers emitting in the wavelength range of visible light, are currently
evaluated. The modified setup shall be applied in the characterisation of a larger set of samples to estimate the
bandwidth of light scattering properties for a particular site and production period.
To eliminate the impact of damages and age in data-driven modelling, two approaches are currently investigated.
One is the temporary healing of surface defects by restorative measures. The other possible strategy is to prepare
physical replicates, employing techniques from experimental archaeology, or to model the detailed geometry of the
glass structures and derive the BSDF by computational means. Preparation of these intermediate, physical or digital
models, would still have to be guided by accurate characterisation of findings.
Acknowledgements
The authors express their gratitude to LVR-LandesMuseum (Bonn) for providing the samples, and in particular to
Dr. Jennifer Komp for her expert support in selecting and analyzing the glass finds. We thank Dr. Susanne Greiff
from the Römisch-Germanisches Zentralmuseum (Mainz) for her contribution to the characterisation of the state of
preservation and the identification of traces of processing on the samples. This includes the micro photography of
Figure 4(b). Greg Ward guided us in the improved parametrisation of the basis functions to our measurements when
generating the data-driven model.
This research, as part of the pilot study "Messung und Simulation der Streuung von Tageslicht an römischen
Fenstergläsern", was funded by the Fritz Thyssen Stiftung für Wissenschaftsförderung, Köln (Az.20.18.0.006AA).
References
Denise Allen. 2002. Roman window glass. In Artefacts and archaeology. Aspects of the Celtic and Roman world,
Miranda Jane Aldhouse-Green and Peter Webster (Eds.). University of Wales Press, Cardiff, UK, 102ff.
Peter Apian-Bennewitz. 1995. Messung und Modellierung von lichtstreuenden Materialien zur Computer-Simulation
von Tageslichtbeleuchtung. Ph.D. Dissertation. Albert-Ludwigs-Universität, Freiburg, DE.
Peter Apian-Bennewitz. 2010. New scanning gonio-photometer for extended BRTF measurements. In SPIE Optical
Engineering + Applications, Vol. 7792 Reflection, Scattering, and Diffraction from Surfaces II. International Society
for Optics and Photonics, Brussels, BE, 77920O–77920O. https://doi.org/10.1117/12.860889
8 In building science, an established directional basis includes directions up to 82.5◦ .
16Peter Apian-Bennewitz and Jochen von der Hardt. 1998. Enhancing and calibrating a goniophotometer. Solar Energy
Materials and Solar Cells 54, 1–4 (1998), 309 – 322. https://doi.org/10.1016/S0927-0248(98)00082-8
R. Arletti, G. Vezzalini, S. Benati, L. Mazzeo Saracino, and A. Gamberini. 2010. Roman window glass: A Comparison
of findings from three different Italian sites. Archaeometry 52, 2 (2010), 252–271. https://doi.org/10.1111/j.
1475-4754.2009.00479.x
ASTM E2387-05 2011. Standard practice for goniometric optical scatter measurements. Standard ASTM E2387-05.
ASTM / SC E12.03. https://doi.org/10.1520/E2387-05R11
Dietwulf Baatz. 1991. Fensterglas, Glasfenster und Architektur. In Bautechnik der Antike. Diskussionen zur Archäol-
ogischen Bauforschung, Vol. 5. Philipp von Zabern, Darmstadt, 4ff.
Martin Bachmann. 2011. Fenster zum Hof. Zur Belichtungsfrage pergamenischer Peristylhäuser. In Licht - Konzepte
in der vormodernen Architektur. Schnell & Steiner, Regensburg, 128–141.
Nicolas Bonneel, Michiel Van De Panne, Sylvain Paris, and Wolfgang Heidrich. 2011. Displacement interpolation using
Lagrangian mass transport. ACM Transactions on Graphics (TOG) 30 (2011), 158. Issue 6. https://doi.org/
10.1145/2070781.2024192
Remi Cerise, Fernando da Graça, Frederic Magoulès, and Patrick Callet. 2012. Natural lighting and medieval glass –
Scientific data acquisition, methodology and physically based rendering. In Progress in cultural heritage preservation
EuroMed 2012 (Lecture Notes in Computer Science), Marinos Ioannides, Dieter Fritsch, Johanna Leissner, Rob
Davies, Fabio Remondino, and Rossella Caffo (Eds.), Vol. 7616. Springer, Limassol, Cyprus, 636–643. https:
//doi.org/10.1007/978-3-642-34234-9_66
Paul Debevec. 2005. Making T̈he Parthenon.̈ In 6th International Symposium on Virtual Reality, Archaeology, and
Cultural Heritage.
Jörg Drauschke and Susanne Greiff. 2008. Chemical aspects of Byzantine glass from Caričin Grad / Iustiniana Prima
(Serbia). In Glass in Byzantium – Production, usages, analyses (RGZM – Tagungen), Jörg Drauschke and Daniel
Keller (Eds.). Verlag des Römisch-Germanischen Zentralmuseums, Mainz, DE, 25–45.
Graeme Earl, Vito Porcelli, Constantinos Papadopoulos, Gareth Beale, Matthew Harrison, Hembo Pagi, and Simon
Keay. 2013. Formal and informal analysis of rendered space: The Basilica Portuense. In Computational approaches
to archaeological spaces, Andrew Bevan and Mark Lake (Eds.). Left Coast Press, Walnut Creek, CA, Chapter 11,
265.
Souen Deva Fontaine and Danièle Foy. 2008. Diversité et évolution du vitrage de l’Antiquité et du haut Moyen Âge :
un état de la question. Gallia 65, 1 (2008), 405–459. https://doi.org/10.3406/galia.2008.3349
Ian C. Freestone, Michael J. Hughes, and Colleen P. Stapleton. 2008. The composition and production of Anglo-Saxon
glass. In Catalogue of Anglo-Saxon glass in the British Museum, Vera I. Evison and Sonja Marzinzik (Eds.). The
British Museum, London, UK, 29–46.
David Geisler-Moroder and Arne Dür. 2010. A new Ward BRDF model with bounded albedo. Computer Graphics
Forum 29 (2010), 1391–1398. Issue 4. https://doi.org/10.1111/j.1467-8659.2010.01735.x
E. Gliozzo, A. Santagostino Barbone, and F. D’Acapito. 2013. Waste glass, vessels and window-panes from Thamusida
(Morocco): Grouping natron-based blue-green and colourless Roman glasses. Archaeometry 55, 4 (2013), 609–639.
https://doi.org/10.1111/j.1475-4754.2012.00696.x
Lars Oliver Grobe. 2017. Daylighting in the antique. https://blog.hslu.ch/solarcontrol/2017/05/30/
daylight-performance-of-antique-roman-glazing
Lars Oliver Grobe. in press. Photon mapping to accelerate daylight simulation with high resolution, data-driven
fenestration models. Journal of Physics: Conference Series CISBAT 2019 (in press).
Lars Oliver Grobe and Andreas Noback. 2019. Light scattering by Roman window glass. https://doi.org/10.
5281/zenodo.3265014 Digital data-set.
Lars Oliver Grobe, Stephen Wittkopf, and Zehra Tuğçe Kazanasmaz. 2017. High-resolution data-driven models of
daylight redirection components. Journal of Facade Design and Engineering 5 (2017), 101–113. https://doi.
org/10.7480/jfde.2017.2.1743
Jassim Happa, Tom Bashford-Rogers, Alexander Wilkie, Alessandro Artusi, Kurt Debattista, and Alan Chalmers.
2012. Cultural heritage predictive rendering. Computer Graphics Forum 31 (2012), 1823–1836. Issue 6. https:
//doi.org/10.1111/j.1467-8659.2012.02098.x
17Jassim Happa, Mark Mudge, Kurt Debattista, Alessandro Artusi, Alexandrino Gonçalves, and Alan Chalmers. 2010.
Illuminating the past: State of the art. Virtual Reality 14, 3 (2010), 155–182. https://doi.org/10.1007/
s10055-010-0154-x
Lukas Hosek and Alexander Wilkie. 2012. An analytic model for full spectral sky-dome radiance. ACM Trans. Graph.
31 (2012), 95:1–95:9. https://doi.org/10.1145/2185520.2185591
IES TM-25 2013. Ray file format for the description of the emission property of light sources. Recommendation IES
TM-25:2013. Illuminating Engineering Society.
ISO 15469:1997 1997. Spatial distribution of daylight – CIE standard overcast sky and clear sky. Standard ISO
15469:1997 (CIE 003/E-1996). ISO / CIE TC 3-15. Superseded by ISO 15469:2004 (CIE S 011/E:2003).
ISO 15469:2004 2004. Spatial distribution of daylight – CIE standard general sky. Standard ISO 15469:2004 (CIE S
011/E:2003). ISO / CIE TC 3-15. Reviewed and confirmed in 2018.
Henrik Wann Jensen. 2001. Realistic image synthesis using photon mapping. AK Peters / CRC Press, New York, US.
https://doi.org/10.1201/9780429294907
James T. Kajiya. 1986. The rendering equation. In 13th Annual Conference on Computer Graphics and Interactive
Techniques (SIGGRAPH). ACM, New York, NY, USA, 143–150. https://doi.org/10.1145/15886.15902
Joseph T. Kider, Rebecca L. Fletcher, Nancy Yu, Renata Holod, Alan Chalmers, and Norman I. Badler. 2009.
Recreating early Islamic glass lamp lighting. In Proceedings of the 10th International Conference on Virtual Reality,
Archaeology and Cultural Heritage (VAST’09). Eurographics Association, Aire-la-Ville, Switzerland, Switzerland,
33–40. https://doi.org/10.2312/VAST/VAST09/033-040
Jennifer. Komp. 2009. Römisches Fensterglas : Archäologische und archäometrische Untersuchungen zur Glasherstel-
lung im Rheingebiet. Ph.D. Dissertation. Frankfurt am Main, Univ., Diss., 2007, Aachen.
Marek Krehel, Stephen Wittkopf, and Jérôme Kämpf. 2015. Characterisation and modelling of advanced daylight
redirection systems with different goniophotometers. In Proceedings CISBAT 2015. EPFL, Lausanne, 211–216.
https://doi.org/10.5075/epfl-cisbat2015-211-216
Murat Kurt and Dave Edwards. 2009. A survey of BRDF models for computer graphics. SIGGRAPH Computer
Graphics 43, 2 (May 2009), 4:1–4:7. https://doi.org/10.1145/1629216.1629222
Eleanor Lee, Taoning Wang, Jacob Jonsson, Greg Ward, Lars Oliver Grobe, Jan Wienold, and David Geisler-
Moroder. 2018. Generating high-resolution BSDFs for the direct beam component. International Radiance
Workshop. https://www.radiance-online.org/community/workshops/2018-loughborough/presentations/
03-HighResBSDFs.pdf
Wojciech Matusik, Hanspeter Pfister, Matt Brand, and Leonard McMillan. 2003. A data-driven reflectance model.
ACM Transactions on Graphics 22, 3 (July 2003), 759–769. https://doi.org/10.1145/882262.882343
Inanici Mehlika. 2013. Dynamic daylighting simulations from static high dynamic range imagery using extrapolation
and daylight coefficient methodologies. , 25–28 pages.
Stephanie Meyen, Florian Sutter, and Peter Heller. 2014. Near specular scatter analysis method with a new go-
niophotometer. In SPIE Optical Engineering + Applications, Vol. 9205, Reflection, Scattering, and Diffraction
from Surfaces IV. International Society for Optics and Photonics, San Diego, California, US, 92050B–92050B–15.
https://doi.org/10.1117/12.2061036
Addy Ngan, Frédo Durand, and Wojciech Matusik. 2005. Experimental analysis of BRDF models. In EGSR’05 16th
Eurographics conference on Rendering Techniques. Eurographics Association, Konstanz, Germany, 117–226.
Fred E Nicodemus, Joseph C Richmond, Jack J Hsia, Irving W Ginsberg, and Thomas Limperis. 1977. Geometri-
cal considerations and nomenclature for reflectance. Vol. 160. US Department of Commerce, National Bureau of
Standards, Washington, DC, USA.
Andreas Noback, Lars Oliver Grobe, and Franziska Lang. 2018. 21st Congress of the Association Internationale pour
l’Histoire du Verre. https://doi.org/10.5281/zenodo.1414008
Margaret O’Hea. 2001. Glass from the 1992-93 excavations. In The Petra Church, Patricia Maynor Bikai (Ed.).
American Center of Oriental Research, Amman, JO, 370–376.
Aenne Ohnesorg. 2011. Der naxische Lichtdom – Phänomen lichtdurchlässiger inselionischer Marmordächer. In Licht
- Konzepte in der vormodernen Architektur. Schnell & Steiner, Regensburg, 92–100.
18You can also read