Social Media Types: Introducing a Data Driven Taxonomy
←
→
Page content transcription
If your browser does not render page correctly, please read the page content below
Social Media Types: Introducing a Data Driven Taxonomy

 Paraskevas Koukaras, Christos Tjortjis, Dimitrios Rousidis
 School of Science and Technology, International Hellenic University
 GR-570 01 Thermi, Thessaloniki, Greece
 {p.koukaras, c.tjortjis, d.rousidis}@ihu.edu.gr

Abstract: Social Media (SM) have been established as multifunctional networking tools that tend to
offer an increasingly wider variety of services, making it difficult to determine their core purpose and
mission, therefore, their type. This paper assesses this evolution of Social Media Types (SMTs),
presents, and evaluates a novel hypothesis-based data driven methodology for analyzing Social
Media Platforms (SMPs) and categorizing SMTs. We review and update literature regarding the
categorization of SMPs, based on their services. We develop a methodology to propose and evaluate
a new taxonomy, comprising: i) the hypothesis that the number of SMTs is smaller than what current
literature suggests, ii) observations on data regarding SM usage and iii) experimentation using
association rules and clustering algorithms. As a result, we propose three (3) SMTs, namely Social,
Entertainment and Profiling networks, typically capturing emerging SMP services. Our results show
that our hypothesis is validated by implementing our methodology and we discuss threats to validity.

Keywords
Social Media, Social Media Types, Social Media Sites, Social Media Platforms, Social Networking,
Data mining, Clustering, Association Rules.

Abbreviations
Social Media (SM), Social Media Type (SMT), Social Media Platform (SMP), Social Networks (SN)

 1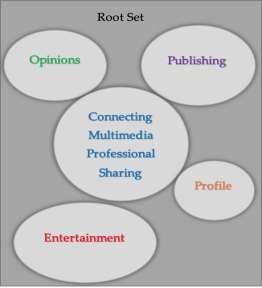
1. Introduction
People around the world use Social Media (SM) to communicate, connect and interact with other users,
sharing and propagating information at a great rate [1]. SM facilitate sharing information, ideas,
interests and other forms of expression through virtual communities and networks [4]. There is a
great variety of services offered having many common features [5]. SM are considered interactive
Internet-based applications [6]. SM are full of user-generated data, such as posts, photos, videos and
so on. They offer user accounts (profiles) on websites and mobile apps, facilitating the generation of
web based social networks, connecting users or groups [7].
A Social Network (SN) is a social structure consisting of several actors / entities / groups of entities, that
describe a variety of interactions among them. Studies like the one reported in [10] present
taxonomies for SN, which describe the spectrum of attributes that relate to these systems. They
provide a reference point for different system compositions, aiming at capturing their building
blocks, whilst examining the architectural designs and business models they might pose.
SN offer different techniques for analyzing the structure of social atoms (entities), as well as a set of
theories for understanding and recognizing patterns hidden in them [8]. Such patterns can be local
or global, which can be further analyzed in order to mine special entities that might influence others
or examine characteristics of parts or the whole network [9].
During the early years of SM networking, Social Media Platforms (SMP) had a clear vision statement.
Nowadays, most SM provide services and functionalities using different names. SM users take
advantage of services such as connecting, sharing, entertaining, monetizing etc., seeking to detect
brand awareness indicators, usage for sales, feedbacks, opinions and more, before approaching
specific target groups. Fig. 1 shows the number of SM users worldwide since 2010, along with
estimated numbers for up to 2021. Categorizing SMPs helps addressing appropriate groups and
improve our understanding regarding SM, whilst getting better results from each platform/site. New
opportunities arise for research and improvements based on new data at our disposal. Although SM
networking is considered a new field of studies, more and more researchers work on it, due to its
wide user adoption [2].

 Figure 1: Number of SM users worldwide (2010-2021*) [2]

SM data types are highly dependent on typical user activities. There are various characteristics and
implications on SM that often lead to confusions regarding data handling [12]. Therefore, our work
aims to elaborate on Social Media Types (SMTs), updating current literature, as well as to introduce
new perspectives on SMPs multiple feature offerings.
While we refer to SMTs and networks, we survey and categorize most common such types and we
research an update to their current standardization. To achieve that, we extract from SMTs features

 2
and services that we refer to as “Utilities”, and develop a methodology based on our initial hypothesis
H₀ (“standard SMTs can be narrowed down to a smaller number n”) which is later backed up by
further elaboration on our SM feature dataset.
We report on SM evolution and how we can use a data-driven approach in order to generate a new
SMTs taxonomy. This is significant because SM offer an increasingly wider variety of services,
making it difficult to determine their core purpose and mission; therefore, their type. This paper
assesses SMT evolution, presents and evaluates a novel hypothesis-based data driven methodology
for analyzing SMPs and categorizing SMTs based on their services.
As a result of our first experiment (Experiment #1, detailed in section 5) we propose five (5) SMTs,
which we argue to be better and more synched with the current state of play in SM than
categorizations proposing, nine (9) [3] or seven (7) [4] SMTs respectively. Yet, when comparing these
early results with work proposing three (3) SMTs [6], we conclude that a tighter categorization
scheme is needed.
Thus, we conduct further research, striving for better results. With Experiment #2 we came up with
four (4) clusters which can be interpreted as four (4) SMTs. Finally, we present an insight into the
merged version of the two (2) experiments, which proposes a new categorization that consists of three
(3) SMTs, namely: Social networks, Entertainment networks, and Profiling networks, typically
capturing emerging SMP services.
The remainder of this paper is structured as follows: Literature review (section 2) presents the state of
the art on SMTs. Methodology (section 3) defines our problem, methods, dataset, observations and
research process. Experiments (section 4) presents experimental results, while Findings (section 5)
discusses key findings relating them with H₀ and presents important extracts from our research.
Conclusions (section 6) discusses results, assesses the importance of our work along with biases and
threats to validity and presents directions for future work.

2. Literature review
There are various approaches when dealing with a new taxonomy proposal. For example,
Engelbrecht et al. categorize data-driven business models based on three points: the data source, the
target audience and the technological effort [46]. Then, they propose eight (8) categories of business
models. Our work aims to research categories of SM (SMTs), a rather untapped topic regarding SM.
Based on Social Theories, there is the Social Atom as an individual that interacts with the Social Molecule
which is the community, constructing seven (7) probable building blocks (Identity, Conversations,
Sharing, Presence, Relationships, Reputation, Groups) of SM [4]. A categorization of SM sites (and by
extension SMTs) such as blogs, social media sites, and virtual game worlds can be found in [6]. The
classification is based on purpose and functionality. Nine (9) types of Social Media are identified [3]:
1. Online Social Networking: Web-based services that allow individuals and communities to connect
 with real world friends and acquaintances online. Users interact with each other through status
 updates, comments, media sharing and messages. Examples: Facebook, Myspace, LinkedIn.
2. Blogging: Journal-like websites for users, to contribute textual and multimedia content, arranged
 in a reverse chronological order. Blogs are generally maintained by an individual or by a
 community. Examples: Huffington Post, Business Insider, Engadget, WordPress.com, Medium.
3. Micro-blogging: Same as blogs, but with limited content. Examples: Twitter, Tumblr, Plurk.
4. Wikis: Collaborative editing environment that allows multiple users to develop Web pages.
 Examples: Wikipedia, Wikitravel, Wikihow.

 3
5. Social news: Sharing and selection of news stories and articles by communities of users. Examples:
 Digg, Slashdot, Reddit, Quora.
6. Social book-marking: Allows users to bookmark Web content for storage, organization, and sharing.
 Examples: Delicious, StumbleUpon.
7. Media sharing: Sharing of media on the Web including video, audio, and photos. Examples:
 YouTube, Flickr, UstreamTV.
8. Opinion, reviews and rating: The primary function of such sites is to collect and publish user
 submitted content in the form of subjective commentary on existing products, services,
 entertainment, businesses and places. Examples: Epinions, Yelp, Cnet, Zomato, TripAdvisor.
9. Answers: Platforms for users seeking advice, guidance or knowledge to ask questions. Other
 community users can answer these questions based on previous experiences, personal opinions
 or relevant research. Answers are generally judged using ratings and comments. Examples: Yahoo!
 answers, WikiAnswers.

3. Methodology
In this section we analyze our methodology, including the problem definition, our methods, the data
set, some key research observations and the corresponding process.

3.1 Problem definition
The current standardization on categories of SMTs (like the ones presented in [6], [3], and [4]) is
considered decaying, since SMTs develop rapidly on platforms that offer various services and multiple
features that we label as Utilities. Our aim is to introduce a new taxonomy that narrows down the
current SMTs standardization, since most of the modern SMPs tend to offer multiple Utilities into a
single platform/product. Therefore, we investigate this issue, expecting to offer another option
regarding SMTs. Our methodology takes into consideration our observations (section 3.4) on a dataset
that contains different SM alongside their official features. We perform two (2) experiments (reported
in section 4) involving association rule mining and clustering in order to unfold a data-driven
methodology that validates our summarized research question: “Can the current state of the art on
SMTs (section 2) be updated by reducing the number of SMT standards; thus, better reflecting the
current state of play?”

3.2 Methods
It should be noted that there are numerous data mining functions to choose from; two prominent
ones are association rules and clustering, implemented by a variety of algorithms [47], [48]. We used
RapidMiner1 [50] for experimentation, because it contains all the algorithms we want to utilize for
our experiments. The following subsections contain a short introduction to unsupervised learning
(like clustering) and association rule mining with brief descriptions of key algorithms, as well as
details about the methods we employed for our experiments.
3.2.1 Association Rule Mining
Association rule mining [14] is a machine learning method for discovering relations between
variables in large databases [15]. The intention here is to identify strong rules in databases using some

1
 RapidMiner is a software suite that provides an integrated environment for data preparation, machine learning [51],
deep learning, text mining [53], and predictive analytics. It supports all steps of the data mining process including data
preparation, results visualization, model validation and optimization [50].

 4
measures of interest, like confidence and support [16]. There are exhaustive and heuristic association
rule algorithms, like Apriori [17], a prominent algorithm for mining frequent itemsets for Boolean
association rules and FP-Growth [18] that is detailed in this subsection. Also, ARMICA [48], a novel
ARM method, based on the heuristic Imperialism Competitive Algorithm (ICA), for finding frequent
itemsets and extracting rules from datasets, whilst setting support automatically. In this paper we use
two (2) measures in order to find interesting rules from the dataset: minimum support and confidence.
Let I = {i1, i2, . . . , in} be a set of n binary attributes called items. Let D = {t 1, t2, . . . , tm} be a set of
transactions called the database. Each transaction in D has a unique transaction ID and contains a
subset of the items in I. A rule is defined as an implication of the form X ⇒ Y where X, Y ⊆ I and X ∩
Y = ∅. The sets of items (itemsets) X and Y are called antecedent (left-hand-side or LHS) and consequent
(right-hand-side or RHS) of the rule [54]. In order to select interesting rules from the set of all possible
rules, constraints on various measures of significance and interest can be used. The best-known
constraints are minimum thresholds on support and confidence.
Definition of Support [55]:
The support supp(X) of an itemset X is defined as the proportion of transactions in the dataset which
contain the itemset.
Definition of Confidence [55]:
Confidence can be interpreted as an estimate of P(Y |X), i.e. the probability of finding the RHS of the
rule in transactions under the condition that these transactions also satisfy the LHS, or the measure
that indicates how often the rule is true. The confidence of a rule is defined as:
 conf(X ⇒ Y ) = supp(X ∪ Y )/supp(X) (1).
FP-Growth [18] was used in Experiment#1 (section 4.2). This algorithm counts occurrences of items in
the dataset and appoints them to a header table. Then it builds the FP-tree structure (“a compact
structure that stores quantitative information about frequent patterns in a database”) [52] by inserting
instances. Items in each instance are sorted by descending order of their frequency in the dataset for
faster tree processing. Then a threshold for coverage is applied and all items that do not meet the
requirements are removed. Recursive processing of this compressed version of the dataset grows
large itemsets directly, instead of generating candidate items and testing them against the entire
database. After a few more steps [18] the recursive process is finalized and the largest sets of items
with minimum coverage have been found, and association rule creation begins [19].

3.2.2 Clustering
Clustering is an unsupervised learning method, which creates groups from datasets that consist of
objects or entities that are characterized by similar or identical attribute values, but are adequately
different from entities that belong to other clusters [47]. For running a clustering algorithm, we need
to specify the distance measure (e.g. Euclidean, Manhattan, Jaccard, Cosine distances) [20]. After that,
clustering methods often continue with the process of object selection and a method for evaluating
the results [21]. For evaluation we can use quality measures like cohesiveness (measure for object-to-
object distance), separateness (measure for cluster-to-cluster distance) and silhouette index (mix of
cohesiveness and separateness) [11].
Clustering algorithms that we use in our experiments (specifically, Experiment#2, section 4.3) are:
Density-based spatial clustering of applications with noise (DBSCAN) [23]. It is density-based,
meaning that given a set of points in some space, it tries to group together points that are packed

 5
together, labeling outlying points that are alone in low-density regions. It functions on three (3) abstract steps [22]: 1. Find the points in the ε (eps) neighborhood of every point and identify the core points with number of neighbors more than minPts. 2. Find the components that are connected with core points on the neighboring graph, without taking into consideration non-core points. 3. Assign every non-core point to a nearby cluster if the cluster is an ε (eps) neighbor, else assign it to noise. For the RapidMiner [50] implementation of this algorithm, we used: epsilon=1: (Range:real; 0.0; default:1), which specifies the size of the neighborhood and min points=5: (Range:integer; 1; default:5), which specifies the minimum number of points forming a cluster. As for measure types, there are four (4) options: Mixed Measures, Nominal Measures, Numerical Measures and Bregman Divergences. The last two (2) cannot be used since our dataset does not contain numerical attributes. So, out of the remaining two (2) groups of measure types we chose Mixed Measures, and specifically the Mixed Euclidean Distance for two (2) reasons: a) Nominal Measures contain, Nominal Distance, Dice Similarity, Jaccard Similarity, Kulczynski Similarity, RogersTanimoto Similarity, RussellRao Similarity and Simple Matching Similarity which all form two (2) clusters with no reasonable results except from Nominal Distance. which produces exactly the same results as Mixed Euclidean Distance, and b) according to RapidMiner user statistics, 79% of users utilize the Mixed Euclidean Distance measure which in our case outperforms the rest of the measures. k-Medoids is a clustering algorithm related to k-means and the medoidshift algorithm [24]. Both k- means and k-Medoids partition the dataset, and attempt to minimize the distance between points labeled to belong to a cluster and a point designated as the epicenter of the cluster. Running this algorithm in RapidMiner we used the following default parameter values: max runs=10, max optimization step=100. We also tried other values, but they produced the same or poorer results. Regarding the measure type, we used Mixed Euclidean Distance, as we did with DBSCAN. Random-Clustering [25]: It generates simple and uniform random partitions. It has a single parameter controlling the partition of a random permutation into its cycles. The limit distribution of the size index of the generated partition is the join of the independent Poisson distributions with means determined by the size and the parameter. As for RapidMiner’s parameters, in this algorithm the only one required is the number of clusters to be formed (more in section 4.3). 3.3 Dataset The dataset used for our methodology contains various SMPs; the choice is based on ranking regarding active monthly users, using the expanded & merged version of Table 2 and Appendix A. We consider a platform’s user penetration, as well as the variety of its official features, as the most important attributes when enlisting a candidate platform to our methodology. It is built and populated by data retrieved from the official sites of each of the 112 SMPs we review. Some platforms with smaller user penetration implement fewer features. Clearly the list is not exhaustive, given the volatile nature of SM popularity and feature base. We use data pre-processing techniques such as removing duplicates and missing values, or data transformation and reduction as needed to normalize our research dataset (further explained in Observation#1 below). 6
Having presented the most common SMTs in section 2, Table 1 summarizes the top fifteen (15) ranked
SM information networks with regards to active users [26].

 Table 1: SM ranking by active users.

 Social Media Number of active
 Networking Site Users (millions)
 Facebook 2,010
 YouTube 1,500
 Instagram 800
 Twitter 328
 Reddit 250
 Vine 200
 Pinterest 175
 Ask.fm 160
 Tumblr 115
 Flickr 112
 Google+ 111
 LinkedIn 106
 VK 95
 ClassMates 57
 Meetup 32
3.4 Observations
Table 1 shows the top fifteen (15) ranked sites, based on active users. The mapping of features to
Utilities is described step-by-step by Observations #1-4 below. All in all, we examined each feature,
and grouped these logically, according to their semantic meaning in context. Each group was then
labelled by a term, signifying the corresponding utility.

Observation#1: We map platform features onto Utilities using common sense, semantics and
denotation forming Appendix B, in line with similar research [3], [4], [6]. This mapping is heuristic, not
guaranteed to be the optimal, but it is suitable for practically appointing each feature (described by a
word or a sentence) to a Utility. For example, Facebook, LinkedIn and VK implement the
“Messaging” feature, which can be grouped under the Utility we call “Connecting”.
The most representative official features for SMPs are shown in Table 2 (data retrieved from the official
documentation for each platform [27] – [41]). Nowadays, the majority of SM support multimedia
sharing, posting, hash-tagging features and more, under different feature labeling. We use an
expanded form of the current standardized types, as used in [6], [3], [4], to assign relevant feature
labels into conceptually compliant Utilities.
Observation#2: We transform features so that each attribute in our dataset represents a semantically
equivalent specific Utility in the real-world. Examples: feature “Messaging” becomes “Connecting”,
users exchange text, voice and/or video etc. which is a means for establishing social connections.
Feature “Tags” becomes “Sharing”, feature “wall” becomes “Profile” etc.
Based on Observation#1 and Observation#2 we came up with fourteen (14) distinct Utilities
(Connecting, Sharing, Multimedia, Privacy, News, Promoting, Voting, Publishing, Schedule, Profile,
Applications, Professional, Opinions, Entertainment) that group up unique official SM features under a
single conceptual label (Utility). Appendix B showcases the feature transformations for the complete
dataset (112 SM sites).

 7
Table 2: Official features for the 15 top-ranked sites

 SMP Feature
 Friends, Fans, Wall, News Feed, Fan Pages, Groups, User Groups, Apps, Live Chat, Likes, Photos, Videos, Text, Polls,
 Facebook
 Links, Status, Pokes, Gifts, Games, Messaging, Classified Section, Upload and Download Options for Photos.
 Playback Upload Quality and Formats, Live Streaming, 3d Videos, 360° Videos, Post Text, Images (Including Gifs),
 YouTube
 Live Video (On Channel).
 Explore, Photographic Filters, Video, Photos, Instagram Direct, Instagram Stories, Monetization, Stand-Alone Apps,
 Instagram
 Third-Party Services.
 Twitter Tweet, Retweet, Direct Messaging, Follow People & Trending Topics, Links, Photos, Videos.
 Social News Aggregation, Web Content Rating, Discussion Website, Content Sharing, Links, Text Posts, Images,
 Reddit
 Voting.
 Vine Record short Video Clips, Ability to "Revine" Videos on a Personal Stream, Protected Posts.
 Pinterest Pins, Boards, Exploring, Following.
 Ask.Fm Profiles, Send Each Other Questions.
 Tumblr Dashboard (Blog Posts), Queue, Tags, Html Editing, Messaging to Blogs, Questions.
 Flickr Accounts, Organization, Access Control, Interaction and Compatibility, Filtering, Licensing.
 User Profiles, Circles, Stream, Identity Service, Privacy, +1 Button, Google+ Pages, Communities, Locations, What's
 Google+
 Hot, Google Local, Photography, Additional Features, Collections, Deprecated Features.
 User Profile Network, Security nd Technology, Messaging, Applications, External, Third Party Applications,
 LinkedIn Embedded In Profile, Mobile, Groups, Job Listings, Online Recruiting, Skills, Publishing Platform, Influencers,
 Advertising and for-Pay Research.
 VK Messaging, News, Communities, Like buttons, Privacy, Synchronization with other Social Networks, SMS Service.
 Classmates Privacy, Post to and read Community Boards and view Information about upcoming Reunions, Emails.
 Meetup Groups, Members, Organize meetups.
Observation#3: By using the map in Appendix B and grouping features under the Utility label, we
observe that different SMPs utilize common Utility instances, as shown in Table 3.
 Table 3: SMP grouping based on common Utility

 Number of SMP
 SMP Utility
 (max=15)
 Facebook, Instagram, Twitter, Reddit, Pinterest, Ask.fm,
 Tumblr, Flickr, Google+, LinkedIn, VK, Classmates, Connecting 13
 Meetup
 YouTube, Instagram, Twitter, Reddit, Vine, Pinterest,
 Sharing 10
 Ask.fm, Tumblr, Google+, Classmates
 Facebook, YouTube, Instagram, Twitter, Reddit, Vine,
 Multimedia 9
 Pinterest, Flickr, Google+
 Facebook, Flickr, Google+, LinkedIn, VK, Classmates Privacy 6
 Facebook, Twitter, Reddit, Pinterest, VK News 5
 Facebook, Twitter, Ask.fm, LinkedIn, Promoting 4
 Facebook, Reddit, Google+, VK Voting 4
 Tumblr, Google+, LinkedIn Publishing 3
 Flickr, Classmates, Meetup Schedule 3
 Facebook, Google+, LinkedIn Profile 3
 Facebook, Instagram, LinkedIn Applications 3
 Instagram, LinkedIn Professional 2
 Facebook Opinions 1
 Facebook Entertainment 1
Observation#4: By further observing Observation#3 and Table 3 we could allude that various hybrid
SMTs can be formed, characterized by specific Utilities. For example, hybrid type#1 [Pinterest, Reddit,
Facebook, Twitter] that characterizes SMPs that offer News, Multimedia, and Connecting capabilities,
hybrid type#2 [Instagram, LinkedIn] that offers Professional, Connecting and Application
capabilities.

 8
3.5 Research Process
Our research process can be divided into seven (7) steps. A brief description of the proposed steps
follows: Step 1 entails data collection to form a dataset of features from 112 SMPs (section 3.3). Step 2
combines pre-processing by data normalization, transformation and reduction along with missing
values and duplicate removal (section 3.4). In Step 3, we record observations and finalize the dataset
based on SM utilities (section 3.4). Step 4 defines the axioms to follow for enlisting and shifting
between the proposed SMTs (section 3.5). Step 5 involves experiments (section 4) by using: a) FP-
Growth, an association rules algorithm in Experiment#1, and b) three (3) Clustering algorithms
(DBSCAN, k-Medoids, Random Clustering) in Experiment#2. Step 6 uses experimental results to
propose a new SMTs taxonomy (section 5). Finally, Step 7 examines whether the proposed taxonomy
is viable by testing our hypothesis and comparing our results with related work (section 5-6).

Since we implied that SMPs can form hybrid types based on their common Utilities, we extend our
effort to introduce a new taxonomy. The process is a mixture of data-driven & hypothesis-based
approaches emphasizing on the data-driven aspect, meaning that the feature dataset will be more
decisive and act as a validator for our initial hypothesis H₀ when forming the proposed taxonomy.
In 3.4 we recorded our observations from the dataset we built regarding 112 SM. Table 4 shows the
absolute count (c) of occurrences of each Utility, along with the proportion of c as a fraction of c over
the total number of Utility occurrences in our dataset.
 Table 4: Fraction of each Utility in dataset

 Utility Absolute count (C) Fraction of the dataset
 Connecting 85 0.21794871794871795
 Multimedia 78 0.2
 Professional 50 0.1282051282051282
 Sharing 35 0.08974358974358974
 Entertainment 28 0.07179487179487179
 Opinions 21 0.05384615384615385
 Profile 17 0.04358974358974359
 Publishing 17 0.04358974358974359
 Applications 14 0.035897435897435895
 Schedule 12 0.03076923076923077
 Privacy 11 0.028205128205128206
 Voting 9 0.023076923076923078
 News 7 0.017948717948717947
 Promoting 6 0.015384615384615385
Appendix C shows the complete set of Utility occurrences for each SM whilst Table 5 summarizes the
utilities of the top fifteen (15) SMPs. Using Appendix C, we extend our effort to support H₀ with the
inception of generalized axioms for enlisting and shifting between our Proposed Social Media Types
(taxonomy) as follows:
• Axiom 1 (A1): Primary Utility (P) for each SM platform is its Utility with the highest count of
 occurrences, c.
• Axiom 2 (A2): Secondary Utility (S) for each SM platform is its Utility with the second highest
 count of occurrences, c.
• Axiom 3 (A3): Trivia Utility (T) for each SM platform is its Utility with the lowest count of
 occurrences, c.

 9
• Axiom 4 (A4): If there is a tie in calculating P among 2 or more Utilities in a SM entry, we consider
 (∑ 1 ) utilities.
• Axiom 5 (A5): If there is a tie in calculating S among 2 or more Utilities in a SM entry, we consider
 (∑ 1 ,) utilities.
• Axiom 6 (A6): When none of A1-A5 apply, we categorize a platform by its official goals.
 Table 5: Top 15 SMPs with their Utilities

 SM
 Utility
 Platform
 Connecting, Profile, News, Promoting, Applications, Voting, Multimedia, Opinions, Entertainment,
 Facebook
 Privacy
 YouTube Multimedia, Sharing
 Instagram Connecting, Applications, Multimedia, Sharing, Professional
 Twitter Connecting, News, Multimedia, Sharing
 Reddit Connecting, News, Voting, Multimedia, Sharing
 Vine Multimedia, Sharing
 Pinterest Connecting, News, Multimedia, Sharing
 Ask.fm Connecting, Promoting, Sharing
 Tumblr Connecting, Sharing, Publishing
 Flickr Connecting, Multimedia, Schedule, Privacy
 Google+ Connecting, Profile, Voting, Multimedia, Privacy, Sharing, Publishing
 LinkedIn Connecting, Profile, Promoting, Applications, Privacy, Professional, Publishing
 VK Connecting, News, Voting, Privacy
 Classmates Connecting, Privacy, Sharing, Schedule
 Meetup Connecting, Schedule
Based on axioms A1-A6 and our dataset observations in 3.4, each of the proposed SMT is
characterized by Primary, Secondary, and Trivia Utilities, as presented in Appendix D.
Some examples of applying the rules to the top populated SM are presented in Table 6, Table 7 and
Table 8. For further clarification of the mapping process we note that Appendix C appoints the
features to Utilities, thus Table 6 counts seven (7) occurrences of Connecting since its seven (7)
features: Fans, Groups, Live Chat, Pokes, Gifts, Messaging, User Groups are grouped under the
Utility Connecting (refer to Observation#1). On the same context, in Table 7 YouTube scores one (1)
on Sharing since the feature “Post Text” is semantically linked with the Utility “Sharing".
 Table 6: Facebook break-down of Utility occurrences.

 Facebook
 Utility Count Utility
 Connecting 7 Primary
 Multimedia 4 Secondary
 Professional - -
 Sharing - -
 Entertainment 1 Trivia
 Opinions 1 Trivia
 Profile 1 Trivia
 Publishing - -
 Applications 1 Trivia
 Schedule - -
 Privacy 1 Trivia
 Voting 1 Trivia
 News 2 Trivia
 Promoting 2 Trivia

 10
Table 7: YouTube break-down of Utility occurrences.

 YouTube
 Utility Count Utility
 Connecting - -
 Multimedia 6 Primary
 Professional - -
 Sharing 1 Secondary
 Entertainment - -
 Opinions - -
 Profile - -
 Publishing - -
 Applications - -
 Schedule - -
 Privacy - -
 Voting - -
 News - -
 Promoting - -

 Table 8: Instagram break-down of Utility occurrences.

 Instagram
 Utility Count Utility
 Connecting 2 Secondary
 Multimedia 3 Primary
 Professional 1 Trivia
 Sharing 1 Trivia
 Entertainment - -
 Opinions - -
 Profile - -
 Publishing - -
 Applications 2 Secondary
 Schedule - -
 Privacy - -
 Voting - -
 News - -
 Promoting - -

Having examined Appendixes C & D, we extend our effort trying to prove H₀ by mining our dataset
using RapidMiner (as stated in section 3).

4. Experiments
We conducted two experiments using RapidMiner on our dataset. In the first experiment, we used
FP-Growth, an exhaustive Association Rules Mining (ARM) algorithm, which produces the same
results as Apriori, but is faster [43]. In the second experiment, we followed a progressive approach
using three different heuristic clustering algorithms, DBSCAN, k-Medoids, Random Clustering,
running twelve (12) experiments, organized in four (4) steps as explained later, because we needed
to compare intermediate results at each step. Our research experiments do not exclusively deal with
the association rule concepts, but also with clustering. We used a “learn-by-data” based approach to
reduce the possible number of clusters on SMTs. This means that we experimented with FP-Growth,
but results were not satisfactory. Then we moved on with our experiments using clustering

 11
algorithms that seem to have better results than association rules. These experiments are detailed in
the remaining of this section.
4.1 Biases
Before presenting our experiments, we should note biases in our methodology. These biases as well
as assumptions motivate our future work reported in section 6.

4.1.1 Dataset Biases
As mentioned in section 3.2, our data were gathered from the official SM descriptions. We recorded
and processed their features to generate a dataset by grouping under adjective comprehension,
removing duplicates and missing values when necessary. The SM used were chosen taking into
consideration user penetration and available features. Some SM implement fewer features than others
(e.g. Facebook compared with Tinder), thus our analysis might be impaired by this disparity.

4.1.2 Biases in Experiment#1
We extracted frequent itemsets in order to produce generalized rules for forming new SMTs, yet with
relatively high confidence, but rather low support. Ideally we were after strong rules (high confidence
and support), but due to the nature of our dataset explained in 3.3 (we implement a simple grouping
although our results might be considered ambiguous, due to the general subjectivity of grouping
features as we comprehend them under a specific Utility), it is not possible to do so at the extend we
would have liked. This perceived threat to validity was the primary reason for pursuing further
experimental validation by clustering.

4.1.3 Biases in Experiment#2
The second experiment offers more positive results, since we further reduced the number of
categories. In order to generate fewer clusters, we experimented with removing dominant utilities
during our analysis. We assume that by removing one by one the three (3) most frequent utilities,
while presenting and analyzing the output in a sequential manner, will enhance results.

4.2 Experiment#1
We executed FP-Growth aiming to generate strong association rules for our Utility entries for each
SM on our dataset. Figure 2 presents all the association rules when using min confidence=100%, min
items per itemset=1, and max items per itemset=3. 100% confidence guarantees that the rule is always
true. Regarding the support level, we experimented with a variety of values based on the data of each
experiment. We started with minimum support 2.7% and raised it up to 10%. We aimed at the greatest
values possible (driven by data) both in confidence and support, in order to find strong rules [64].
We found that some utilities form strong rules with high values for support and 100% confidence.
For example:
a) When an SM platform provides the Applications utility, it is sure to contain Connecting
 (support=6.2%). This suggests that based on our data “Applications” and “Connecting” can be
 part of the same meta-utility, meaning that in essence “Applications” are never provided unless
 “Connecting” is.
b) In the same manner, when a platform provides the News utility, it is sure to contain Connecting
 (support=5.4%).
c) When it provides the Multimedia & Privacy utilities, it is sure to contain Connecting
 (support=5.4%).

 12
Figure 2: Association Rules from the dataset

d) When it provides the Multimedia & Applications utilities, it also contains Connecting
 (support=4.5%).
e) When it provides the Multimedia & News utilities, it also contains Connecting (support=3.6%).
When it provides the Professional & Applications utilities, it also contains Connecting (support=3.6),
and so on. However, if we wanted to use the twenty-three (23) rules shown in Figure 2, to formulate
groups of utilities, we would have to observe that sixteen (16) rules are of the form X=>Connecting.
In other words, ten (10) utilities including Connecting would form one (1) big group, whilst the
remaining four (4) utilities will be standalone, producing a taxonomy of five (5) new SMTs. The
complete list of rules with confidence=100% is shown in Figure 2. For further reference, Appendix E
displays all frequent itemsets with min. support=2.7%, including itemsets producing the rules
presented in Figure 2 with confidence=100%.
At first, we experimented in order to create rules with min. confidence=100%, yet they proved to be
too strict, so we lowered our thresholds by including all results with confidence
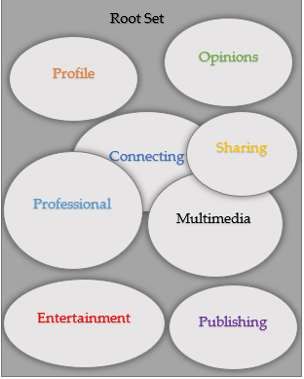
Figure 3: Venn Diagram for Support=10%.

 Figure 4: Venn Diagram with five (5) groups.

4.3 Experiment#2
We clustered our dataset in a sequential way by excluding one by one the top three (3) dominant
utilities (Connecting, Multimedia, Professional). At this point we can generate taxonomies using
clustering as shown in the Tree Diagram in Figure 5.

 14
Figure 5: Tree Diagram for k-Medoids results.

We started our experimentation by executing clustering algorithms aiming to generate groups that
could help us form new SMTs. Table 9 lists results after running three (3) different clustering
algorithms: DBSCAN, k-Medoids and Random Clustering on our dataset, before removing the
dominant utilities (Connecting, Multimedia, Professional). For DBSCAN we used the default
parameters from RapidMiner which are: epsilon=1, min points=5. DBSCAN does not need to be given
the number of clusters. It automatically produced k=6 clusters. For k-Medoids we used k=6, max
runs=10, max optimization steps=100 and for Random Clustering, k=6. Each of the algorithms
produced six (6) clusters of variable composition. Given the lack of a ground truth and the
unsupervised nature of clustering these results cannot be meaningfully evaluated in a standalone
basis.
 Table 9: Clustering including dominant attributes.
 Clustering Results

 Clustering Method Cluster 0 Cluster 1 Cluster 2 Cluster 3 Cluster 4 Cluster 5

 DBSCAN 69 7 12 10 7 7
 k-Medoids 25 9 36 17 9 16
 Random Clustering 19 23 16 14 19 21

Next, we ran the three (3) algorithms removing one by one the most dominant Utilities from our
dataset. First, we executed our experiment with the same parameters having removed the top ranked
of the biased Utilities: Connecting (Table 10). DBSCAN produced k=5 clusters which is an output that
is closer to validate our hypothesis (H₀). For our next experiments, we reduced k according to the
number of clusters produced by DBSCAN, since it is an algorithm that determines the number of
clusters. The reason we did that is for comparing the output for each run of the three (3) clustering
algorithms. Our goal was to find the point at which two (2) or more algorithms produce the same
number of clusters.

 15
Table 10: Clustering without Connecting utility.
 Clustering Results

 Clustering Method Cluster0 Cluster1 Cluster2 Cluster3 Cluster4

 DBSCAN 61 14 16 11 10
 k-Medoids 28 29 25 20 10
 Random Clustering 19 28 25 18 22

Then, we experimented with the same parameters having removed the top two (2) ranked of the
biased utilities: “Connecting” and “Multimedia” (Table 11). DBSCAN again produced k=5 clusters.

 Table 11: Clustering without Connecting and Multimedia Utility.
 Clustering Results

 Clustering Method Cluster0 Cluster1 Cluster2 Cluster3 Cluster4

 DBSCAN 53 5 24 17 13
 k-Medoids 23 52 11 24 2
 Random Clustering 19 28 25 18 19

Finally, we experimented having removed all dominant utilities: Connecting, Multimedia,
Professional, with the same parameters, except this time, given that DBSCAN produced k=4 clusters,
we also used k=4 for Random Clustering in order to compare the results for the same number of
clusters. As we can see, DBSCAN reduces the number of clusters from six (6) to four (4), so does k-
Medoids since for k=6 it creates two (2) clusters (Cluster4 & Cluster5) that each contains zero items
and for k=4 it simply swaps the items in Cluster 3 with the ones in Cluster 2, as shown in Table 12.

 Table 12: Clustering without all biased attributes.
 Clustering Results

 Clustering Method Cluster0 Cluster1 Cluster2 Cluster3 Cluster4 Cluster5

 DBSCAN 51 6 41 14 - -
 k-Medoids (with k=6) 23 20 58 11 0 0
 k-Medoids (with k=4) 23 20 11 58 - -
 Random Clustering 26 29 28 29 - -

After examining Appendix F we found that the generated clusters are formed based on the presence
of specific utilities in each cluster. In particular, SM with the Entertainment Utility belong to Cluster0.
SM with the Sharing Utility belong to Cluster1. SM with the Profile Utility belong to Cluster2. All the
remaining SM which do not have any Utility, or they have any Utility except from Entertainment or
Sharing, or Profile belong to Cluster3.
Table 13 shows a part of our results (see the complete cluster analysis in Appendix F) from the last step
of the sequential execution of the clustering algorithms.

 Table 23: Sample of taxonomies with k-Medoids (k=4)

 Proposed Clusters
 id Cluster 0 id Cluster 1 id Cluster 2 id Cluster 3
 1 Facebook 2 YouTube 12 LinkedIn 10 Flickr
 25 WeChat 3 Instagram 18 Snapchat 13 VK
 39 Kiwibox 4 Twitter 19 Quora 15 Meetup
 46 DevianArt 5 Reddit 30 Telegram 16 WhatsApp
 56 Last.fm 6 Vine 38 Pinboard 17 Messenger
 58 Flixster 7 Pinterest 86 LiveJournal 21 Nextdoor

 16
59 Gaia Online 8 Ask.fm 88 Qzone 22 ProductHunt
 67 Goodreads 9 Tumblr 94 Xing 23 AngelList
 79 Wayn 11 Google+ 101 Solaborate 24 Kickstarter
 80 CouchSurfing 14 ClassMates 103 Xanga 26 Skype
 81 TravBuddy 20 GirlsAskGuy 110 MyHeritage 27 Viber
 s
 82 Tournac 34 Stumbleupon - - 28 Viadeo
 83 Cellufun 35 Foursquare - - 29 Gab
 89 QQ 53 43Things - - 31 Tagged
 92 YY 55 Uplike - - 32 Myspace
 95 VampireFreak 65 Tinder - - 33 Badoo
 s
 98 ASmallWorld 85 Plurk - - 36 MeetMe
 99 ReverbNation 87 Weibo - - 37 Skyrock A192
 100 SoundCloud 90 Baidu - - 40 Twoo
 105 Zynga 97 Ravelry - - 41 Yelp
 106 Habbo - - - - 42 Snapfish
 107 FunnyOrDie - - - - 43 Photobucket
 111 MocoSpace - - - - 44 Shutterfly

General Purpose Networks: SM which are mainly described by Connecting, Multimedia,
Professional & Sharing Utilities as shown in Table 3 belong to this set.

Entertainment Networks: This set describes SM that have to do with Entertainment. Gaming,
Shopping, Sports, Travel, Movies etc.

Publishing Networks: This set contains SM with blogging, general form of publishing and
microblogging being their main functionality.

Profiling Networks: This set comprises SM that offer functions promoting skills, goals, personal
journals, etc.

Opinion Networks: The final set contains SM that mainly deal with recommendations, reviews,
discussions, polls etc.

Expreriment#2: We created a taxonomy for SMTs based on a set of generalized axioms produced
after running Experiment#2:

Axiom 7: Any SM that provides at least the Entertainment Utility alone, or Entertainment along with
Profile, or Entertainment along with Sharing, is assigned to Cluster0.
Axiom 8: Any SM that provides at least the Sharing Utility alone, or Sharing along with Profile, is
assigned to Cluster1.
Axiom 9: Any SM that provides at least the Profile Utility alone is assigned to Cluster2.
Axiom 10: If none of axioms 7-9 above stands, the SM belongs to Cluster3.
This leads to the conclusion that we can propose a new Taxonomy for SMTs as follows:
Entertainment Networks: The first cluster showcases results that are similar to Experiment#1
generating a SM category which describes SM that have to do with general entertainment, gaming,
shopping, sports, travel, movies etc.
Sharing Content Networks: This cluster contains SM that support features that prompt content
sharing, hashtags, quotes, location sharing, any kind of posts etc.

 17
Profiling Networks: This cluster produces the same results with Experiment#1, forming a category that describes SM that offer functions that promote skills, goals, personal journals, etc. General Purpose Networks: The final cluster has all the remaining SM that did not enroll on one of the above Networks (Entertainment, Sharing, Profiling). Moving on to the evaluation of our two (2) experiments (Experiment#1, Experiment#2), we aimed to produce a methodology that reduces the number of SMTs. To the best of our knowledge, current literature proposes nine (9) SMTs [3] or seven (7) SMTs [4]. In comparison with our work, we noted that by running clustering methods on our dataset, the output is better than that of association rules, since the formed clusters (taxonomies) were reduced from five (5) to four (4) moving closer to proving our initial hypothesis H₀. However, in both of our experiments we produce fewer SMTs. By examining our results from Experiment#1 & Experiment#2 we provide an insight for a proposed new taxonomy on SMTs motivated and reasoned by our dataset observations and experiments: Entertainment Networks: This cluster of SM appears in both Experiments#1  and it consists of SM that have to do with general entertainment, such as games, sports, cinema, travel, and so on. By further analyzing our data we found that this SMT offers the following Utilities: Primary Utility: Entertainment Secondary: Connecting, Multimedia, Opinions Trivia: Sharing, Privacy, News, Promoting, Voting, Publishing, Schedule, Profile, Applications, Professional. Profiling Networks: This cluster also appears in both Experiment#1 & #2, and forms an SMT describing SM that offer functions promoting skills, goals, personal journals, etc. By analyzing our data, we observed that such SM offer the following Utilities: Primary Utility: Profiling. Secondary: Connecting, Multimedia, Professional, Opinions, Publishing, Privacy, Voting, Applications, Promoting Trivia: Sharing, News, Schedule, Entertainment Social Networks This SMT is generated by merging General Purpose Networks as described by findings from Experiments#1 & 2. Such SM offer the following Utilities: Primary Utility: Connecting, Multimedia, Professional, Sharing Secondary: Publishing, Trivia: Privacy, News, Promoting, Voting, Schedule, Profile, Applications, Opinions, Entertainment On all of the three (3) proposed SMTs, we labeled secondary Utilities the ones that are found to be paired with the Primary Utility of each proposed SMT, without considering the support level of the association rule and we labeled as trivia the ones that do not display any association rule at all (Appendix E). This proposed taxonomy verifies our initial hypothesis (H₀). Evaluating our results, Table 14 summarizes our findings compared with the relevant literature. Source [3] essentially concludes with nine (9) SMTs, source [4] with seven (7) SMTs and source [6] with three (3) yet not operationally representing based on the current evolution of SM. By consolidating results from Experiments 1 and 2 we come up with an updated version of SMTs as described in this section. 18
Table 34: Comparing our work with the literature

 Source Description Number n of
 SMTs
 [3] Online Social Networking, Blogging, Micro-blogging, 9
 Wikis, Social news, Social book-marking, Media
 sharing, Opinion, reviews and rating, Answers
 [4] Identity, Conversations, Sharing, Presence, 7
 Relationships, Reputation, Groups
 [6] Blogs, social media sites, virtual games worlds 3
 Experiment #1 General purpose, Entertainment, Publishing, 5
 Profiling, Opinion
 Experiment #2 Entertainment, Sharing content, Profiling, General 4
 purpose
 Proposal consolidating results Entertainment networks, Profiling networks, Social 3
 from Experiment #1 & #2 networks
6. Conclusions
6.1 Research Summary
Literature review reveals that SMTs are in a rapid stage of evolution. SMPs integrate multiple user
services; thus, we conclude that a variety of SMTs tend to offer conceptual Utilities instead of being
“single minded”. This is due to the accelerated spread and absorption of various SM services. Users
require all-in-one platforms easy to use, that satisfy their needs holistically [44], [45].
In this paper we research this issue, aiming to offer an alternative regarding SMTs. Our methodology
is based on observations on a dataset that contains various SM along with their descriptions. We
performed two (2) experiments using association rule mining and clustering algorithms in order to
implement a data-driven approach that proves our initial hypothesis (H₀) stating that current
standardization on SMTs can be updated, thus reducing the number of SMTs.
Tables 14 summarizes the outcomes of existing research on SMTs, as well as our work. Observing
empirically our results, we can conclude that the first experiment (Experiment #1) produces five (5)
SMTs which is perceived to be better and more synched with the current state of play in SM than
categorizations proposing nine (9) [3] or seven (7) [4] SMTs respectively. Yet, when comparing this
early result with work proposing three (3) SMTs [6], despite this referring to a different time period
(2010), we concluded that a tighter categorization scheme was needed. Thus, we conducted further
research, striving for better results. With Experiment #2, we discovered four (4) clusters, i.e. four (4)
SMTs, which seems more semantically appropriate and representative than five (5) produced by
Experiment #1. Finally, we presented an insight of the consolidated version of the two (2)
experiments, as discussed in section 4, typically capturing emerging SMP services.

6.2 Implications
As Valentini and Kruckeberg Σφάλμα! Το αρχείο προέλευσης της αναφοράς δεν βρέθηκε.
stated: “Within this digital environment, it is extremely important to have a clear understanding of the
meaning, use, and implication of new/digital and social media”. Along with the rise of the number of SM
and their users, the ambiguity of their features rises, too. According to the same study it is vital to
distinguish digital technologies from their social functionality and to understand the SM use in order
to evaluate user behavior and attitudes. Our study can aid researchers, SM users and professionals
by facilitating a) SM Selection, b) identification of new trends and c) collaborations and acquisitions.

 19
SM Selection

Despite the fact that there is a clear preference over SM that users and professionals use [57]; and with
the top-10 SM having 500+ million users each, there is still some confusion over their role. In this work
we aimed at selecting the most popular and representative SM in terms of features, yet this selection
is not exhaustive. The study in [58] demonstrated that teen SM users spend around seven (7) hours
per day using screen media, whilst three (3) of these hours are spend in social networking websites.
According to [59] “Social media pose serious challenges for uses-and-gratifications research, such as the
entangled use of contemporary media services”. There are indeed detailed features and characteristics for
each SM, although many of them are overlapping, as they are similar. At the same time, there is a
great number of volatile features and there are dissimilarities that may not seem to be so distinct; yet,
they create a chaotic environment that can confuse the users. Our proposed categorization of SM
might help the stakeholders to select the optimum SM that best meets their needs, since 50% of the
respondents of Copp’s survey agree that the need to personalize content and experiences is a major
challenge [60]. An appropriate SM selection can support and reinforce public communication
activities and social connection.

Identification of new Trends

Teague mentions that around half of business marketers are still making up social media plans on the
fly without proper marketing strategies, whilst most of them (~65%) are valuing likes, comments and
shares as extremely important for their strategies [61]. According to [62] and [63] the new trends in
SM for 2019 are: 1. Rebuilding trust in SM platforms, 2. Storytelling, 3. Building a brand narrative, 4.
Quality and creativity over quantity, 5. Put Community and Socialization back in SM, 6. Influencers
continue to grow their communities, 7. Selfies, videos and branding (Live Videos, Vertical
videos, Interactive videos, more smartphone-quality videos), 8. Earn, rebuild, or keep the trust of
your followers, 9. Hyper-targeted personalization, and 10. Know your platforms. Our proposed
hybrid SMTs’ conceptualization can facilitate the identification of new trends in the future, since they
incorporate the features and suggest more functional, well-structured and up-to-date SM that
marketers and researchers could use.

Collaborations and Acquisitions

There are constantly buyouts between SM platforms and applications. For instance, even back in 2014,
around 26 billion USDs were spent during the seven (7) most important buyouts in SM [64]: 1. Google
buying YouTube for $1.65 billion, 2. Facebook buying Instagram for $1 billion, 3. Facebook buying
WhatsApp for $19 billion, 4. Google buying Waze for $966 million, 5. Twitter buying Vine for $970
million, 6. Microsoft buying Yammer for $1.2 billion and 7. Yahoo buying Tumblr for $1.1 billion.
Facebook for instance has acquired around 80 other companies [65]. Finally, index.co has
accumulated the acquisitions in SM per year [66]. Table 15 depicts the number of acquisitions, the
average per acquisition and the total cost of acquisitions per year.

According to Table 15 more than 423 billion USDs has been spent for approximately 700 acquisitions
in SM. Therefore, we believe with this work, in which we documented features from more than 100
SM, classified and suggested new hybrid categories, can facilitate collaborations and acquisitions
between SM. For instance, SM with complementary features can be merged or collaborate. Similarly,
a popular SM that lacks a specific feature, can acquire a SM with this distinct feature, like in the case
of Facebook and WhatsApp.

 20
Table 45: Number of acquisitions

 Number of Averaging Total cost
 Year Acquisitions Cost ($ mil) ($ bn)
 2019 9 1500 13.50
 2018 36 136.7 4.92
 2017 65 163.6 10.63
 2016 138 1600 220.80
 2015 91 247.6 22.53
 2014 96 1100 105.60
 2013 78 222.3 17.34
 2012 94 227.3 21.37
 2011 91 77 7.01
 Total: 698 423.70

6.3 Future work
In 4.1 we presented biases in our methodology as well as assumptions that motivate future work.
Therefore, we plan to elaborate more on SMTs, by continuing to monitor their evolution. It is likely
to observe more aggressive merges of SMPs soon, forcing updates on our proposed taxonomy. Our
next step is to improve our methodology to better handle our biases (section 6.1) in order to improve
the quality of the research output by performing an empirical study on the understanding the usage
of each SM from the user perspective.
Furthermore, we aim to automate the methodology in a way that even when new SM become
popular, new features are added or biased data entries persist, SM allocation on a SMT should be
effectively adjusted. This way we should be able to track future changes in SM when new features
are added. As mentioned in [46], SM are under a rapid evolution, growth and metamorphosis.
Scientists around the world have started using online tools and various technologies dedicated to SM,
but the adoption and acceptance is still poor across the wider research community. Our work could
help academics and practitioners to keep track of the evolution on SMTs by having a point of
reference regarding the essence of SM usage. For example, which list of SM should we refer to, when
we want to research market trends, which one for people’s discussions, which one for entertainment
purposes, and so on.

References
[1] Chaffey, D. (2016). Global social media research summary 2016. Smart Insights, 8.
[2] Number of global social network users 2010-2021 (2018, March 21). Retrieved from:
 https://www.statista.com.
[3] P. Gundecha and H. Liu, Mining social media: a brief introduction, Tutorials in Operations
 Research 1 (2012).
[4] Kietzmann, J. H., Hermkens, K., McCarthy, I. P., & Silvestre, B. S. (2011). Social media? Get
 serious! Understanding the functional building blocks of social media. Business horizons, 54(3),
 241-251.
[5] Obar, J. A., & Wildman, S. S. (2015). Social media definition and the governance challenge-an
 introduction to the special issue.
[6] Kaplan, A. M., & Haenlein, M. (2010). Users of the world, unite! The challenges and opportunities
 of Social Media. Business horizons, 53(1), 59-68.

 21
[7] Boyd, D. M., & Ellison, N. B. (2007). Social network sites: Definition, history, and
 scholarship. Journal of computer‐mediated Communication, 13(1), 210-230.
[8] Wasserman, S., & Faust, K. (1994). Social network analysis: Methods and applications (Vol. 8).
 Cambridge university press.
[9] Otte, E., & Rousseau, R. (2002). Social network analysis: a powerful strategy, also for the
 information sciences. Journal of information Science, 28(6), 441-453.
[10] Pallis, G., Zeinalipour-Yazti, D., & Dikaiakos, M. D. (2011). Online social networks: status and
 trends. In New Directions in Web Data Management 1 (pp. 213-234). Springer, Berlin, Heidelberg.
[11] Zafarani, R., Abbasi, M. A., & Liu, H. (2014). Social media mining: an introduction. Cambridge
 University Press.
[12] Richthammer, C., Netter, M., Riesner, M., & Pernul, G. (2013, September). Taxonomy for social
 network data types from the viewpoint of privacy and user control. In Availability, Reliability and
 Security (ARES), 2013 Eighth International Conference on (pp. 141-150). IEEE.
[13] T. Bodnar, and M. Salathé. "Validating models for disease detection using twitter." Proc. 22nd
 Int’l Conf. World Wide Web. ACM, 2013.
[14] Bassel, G. W., Glaab, E., Marquez, J., Holdsworth, M. J., & Bacardit, J. (2011). Functional network
 construction in Arabidopsis using rule-based machine learning on large-scale data sets. The Plant
 Cell, tpc-111.
[15] Weiss, S. M., & Indurkhya, N. (1995). Rule-based machine learning methods for functional
 prediction. Journal of Artificial Intelligence Research, 3, 383-403.
[16] Piatetsky-Shapiro, G. (1991). Discovery, analysis, and presentation of strong rules. Knowledge
 discovery in databases, 229-238.
[17] Agrawal, R., & Srikant, R. (1994, September). Fast algorithms for mining association rules.
 In Proc. 20th int. conf. very large data bases, VLDB (Vol. 1215, pp. 487-499).
[18] Han, J., Pei, J., & Yin, Y. (2000, May). Mining frequent patterns without candidate generation.
 In ACM sigmod record (Vol. 29, No. 2, pp. 1-12). ACM.
[19] Witten, I. H., Frank, E., Hall, M. A., & Pal, C. J. (2016). Data Mining: Practical machine learning tools
 and techniques. Morgan Kaufmann.
[20] S.-S. Choi, S.-H. Cha, and C.C. Tappert. "A survey of binary similarity and distance
 measures." Journal of Systemics, Cybernetics and Informatics 8.1 (2010): 43-48.
[21] A. K. Jain, “Data clustering: 50 years beyond k-means,” Pattern Recognition Letters, vol. 31, no. 8,
 pp. 651–666, 2010.
[22] Schubert, E., Sander, J., Ester, M., Kriegel, H. P., & Xu, X. (2017). DBSCAN revisited, revisited:
 why and how you should (still) use DBSCAN. ACM Transactions on Database Systems
 (TODS), 42(3), 19.
[23] Ester, M., Kriegel, H. P., Sander, J., & Xu, X. (1996, August). A density-based algorithm for
 discovering clusters in large spatial databases with noise. In Kdd (Vol. 96, No. 34, pp. 226-231).
[24] Kaufman, L., & Rousseeuw, P. (1987). Clustering by means of medoids. North-Holland.
[25] Sibuya, M. (1993). A random clustering process. Annals of the Institute of Statistical
 Mathematics, 45(3), 459-465.
[26] Statistics for Social Networks (2017, October 12). Retrieved from: https://www.dreamgrow.com.
[27] Facebook Platform and Documentation (2017, Dec 15). Retrieved from:
 https://www.facebook.com.
[28] YouTube Platform and Documentation (2017, Dec 15). Retrieved from:
 https://www.youtube.com.
[29] Instagram Platform and Documentation (2017, Dec 15). Retrieved from:
 https://www.instagram.com.

 22
You can also read