Black Lives Matter Protests, Social Distancing, and COVID-19 - IZA DP No. 13388 JUNE 2020
←
→
Page content transcription
If your browser does not render page correctly, please read the page content below
DISCUSSION PAPER SERIES

IZA DP No. 13388

Black Lives Matter Protests, Social
Distancing, and COVID-19

Dhaval Dave
Andrew Friedson
Kyutaro Matsuzawa
Joseph J. Sabia
Samuel Safford

JUNE 2020

DISCUSSION PAPER SERIES

IZA DP No. 13388

Black Lives Matter Protests, Social
Distancing, and COVID-19

Dhaval Dave Joseph J. Sabia
Bentley University, IZA and NBER San Diego State University and IZA
Andrew Friedson Samuel Safford
University of Colorado Denver San Diego State University
Kyutaro Matsuzawa
San Diego State University

JUNE 2020

Any opinions expressed in this paper are those of the author(s) and not those of IZA. Research published in this series may
include views on policy, but IZA takes no institutional policy positions. The IZA research network is committed to the IZA
Guiding Principles of Research Integrity.
The IZA Institute of Labor Economics is an independent economic research institute that conducts research in labor economics
and offers evidence-based policy advice on labor market issues. Supported by the Deutsche Post Foundation, IZA runs the
world’s largest network of economists, whose research aims to provide answers to the global labor market challenges of our
time. Our key objective is to build bridges between academic research, policymakers and society.
IZA Discussion Papers often represent preliminary work and are circulated to encourage discussion. Citation of such a paper
should account for its provisional character. A revised version may be available directly from the author.

 ISSN: 2365-9793

 IZA – Institute of Labor Economics
Schaumburg-Lippe-Straße 5–9 Phone: +49-228-3894-0
53113 Bonn, Germany Email: publications@iza.org www.iza.org
IZA DP No. 13388 JUNE 2020

 ABSTRACT
 Black Lives Matter Protests, Social
 Distancing, and COVID-19*
 Sparked by the killing of George Floyd in police custody, the 2020 Black Lives Matter
 protests have brought a new wave of attention to the issue of inequality within criminal
 justice. However, many public health officials have warned that mass protests could lead
 to a reduction in social distancing behavior, spurring a resurgence of COVID-19. This study
 uses newly collected data on protests in 315 of the largest U.S. cities to estimate the impacts
 of mass protests on social distancing and COVID-19 case growth. Event-study analyses
 provide strong evidence that net stay-at-home behavior increased following protest onset,
 consistent with the hypothesis that non-protesters’ behavior was substantially affected
 by urban protests. This effect was not fully explained by the imposition of city curfews.
 Estimated effects were generally larger for persistent protests and those accompanied by
 media reports of violence. Furthermore, we find no evidence that urban protests reignited
 COVID-19 case growth during the more than three weeks following protest onset. We
 conclude that predictions of broad negative public health consequences of Black Lives
 Matter protests were far too narrowly conceived.

 JEL Classification: H75
 Keywords: urban protests, social distancing, coronavirus, COVID-19

 Corresponding author:
 Joseph J. Sabia
 Department of Economics
 San Diego State University
 5500 Campanile Drive
 San Diego, CA 92182-4485 USA
 E-mail: jsabia@sdsu.edu

 * Sabia acknowledges research support from the Center for Health Economics & Policy Studies (CHEPS) at San
 Diego State University, including grant support received from the Charles Koch Foundation and the Troesh Family
 Foundation. We thank Kasey Buckles for helpful advice on a previous version of the paper, as well as Drew McNichols,
 Alicia Marquez, Cameron Milani, James Curry, Calvin Bryan, Erich Kevari, Connor Redpath, and Melinda Mueller for
 outstanding research assistance.
1. Introduction

 Throughout the majority of 2020 the United States has battled a pandemic of the disease

COVID-19. The spread of the disease in the U.S. was rapid and deadly: COVID-19 was

confirmed to have infected over 1.7 million Americans and killed over 93.4 thousand Americans

as of May 25, 2020 (Johns Hopkins University 2020). May 25, 2020 also saw one additional

fatality of historical note: George Floyd, a 46-year-old black man, was killed by a member of the

Minneapolis Police Department when an officer used his knee to pin Floyd’s neck to the ground

for over eight minutes (Hill et al. 2020). The death, which resulted in the officer being charged

with murder, touched off a series of protests in cities around the United States, with protesters

demanding policing reform (Taylor 2020).

 These two national movements: the fight to contain COVID-19, and the Black Lives

Matter protests for reform in law enforcement and for greater social equality, have espoused

some tactics which appear to be in direct opposition to one another. Specifically, one of the

main tactics for controlling the spread of COVID-19 is social distancing: avoiding large public

gatherings, and maintaining at least 6 feet of distance between individuals (Australian

Government Department of Health. 2020; Public Health England. 2020; Public Health Agency of

Canada. 2020; White House 2020). At the same time, protests, designed to galvanize public

action for social justice, are by definition large public gatherings in which it is difficult to avoid

close contact with others. This mismatch of tactics has drawn many in the public health

community to speculate that the protest movement could lead to a surge in COVID-19 cases

(Bacon 2020; Goldberg 2020; Harmon and Rojas 2020). On the other hand, other public health

experts have made the argument that the goals of the protests may be worth the costs (Simon

2020).

 1
However, whether the Black Lives Matter protests actually caused an increase in the

spread of COVID-19 is an open question. While the protests themselves were large gatherings

that do not match well with social distancing guidelines, the protesting population is not the only

one that may have a behavioral response. For example, other individuals who did not wish to

participate in the protests, perhaps due to fear of violence from police clashes or general unrest,

may have chosen to avoid public spaces while protests were underway. This could have an

offsetting effect, increasing social distancing behavior in other parts of the population. The net

effect, on both social distancing and on the spread of COVID-19 is thus an empirical question,

and the focus of this study.

 Using anonymous cell phone tracking data from SafeGraph, Inc., as well as data on the

local prevalence of COVID-19 from the Centers for Disease Control and Prevention, we

demonstrate that cities which had protests saw an increase in social distancing behavior for the

overall population relative to cities that did not. In addition, we find no evidence that net

COVID-19 case growth differentially rose following the onset of Black Lives Matter protests,

and even modest evidence of a small longer-run case growth decline. These results make an

important contribution not only to the current discussion around policies for controlling the

spread of disease, but also to the understanding of human behavior of the general population

during periods of civil unrest.

 2. Background

2.1 COVID-19 and Social Distancing

 The main vector for transmitting COVID-19 is believed to be respiratory droplets, which

are emitted during respiratory expulsion such as breathing, speaking, coughing or sneezing

 2
(Centers for Disease Control and Prevention 2020a, Fineberg 2020). The disease has been able

to circulate rapidly in part due to its ability to spread from asymptomatic carriers, allowing

individuals to infect others without knowing that they have done so or even that they themselves

are infected (Bai et al. 2020; Pan et al. 2020; Rothe et al. 2020).

 To combat the pandemic, governments have taken on two types of strategies. The first is

a set of public health recommendations for social behavior within the population. Specifically,

government health agencies have recommended frequent hand washing, mask-wearing in public

and social distancing – avoiding public spaces and when in public spaces maintaining distance

(usually at least 6 feet) between oneself and others (World Health Organization 2020; Centers for

Disease Control 2020b). The second set of policies have involved public encouragement and

enforcement of social distancing by shutting down public spaces, such as school closures, public

gathering bans, and blanket shelter-in-place orders. These policies have been the subject of a

growing literature that has shown meaningful increases in distancing behavior and meaningful

decreases in disease infection growth rates following the enactment of shelter-in-place orders,

suggesting that the strategy of social distancing (and its associated enforcement policies) have

been largely successful at slowing the spread of the disease (Courtemanche et al. 2020a,b; Dave

et al. 2020a,b,c; Friedson et al. 2020).

2.2 Features of the 2020 Black Lives Matter Protests

 On May 25, 2020 George Floyd was arrested for trying to use a counterfeit twenty-dollar

bill to purchase cigarettes. During the course of the arrest, one of the officers involved, Derek

Chauvin, who is white, restrained George Floyd by pinning him to the ground by his neck with

the officer’s knee. Despite complaining that he was unable to breathe, Derek Chauvin continued

 3
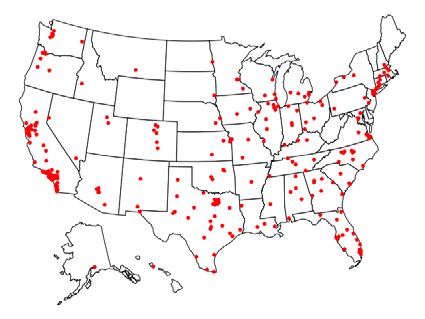
to restrain George Floyd in that position for 8 minutes and 46 seconds, during which he became

unresponsive and stopped breathing (Hill et al. 2020; Furber et al. 2020; State of Minnesota

2020).

 News of the killing sparked immediate protest of policing behavior, with the first protest

taking place in Minneapolis on the next day, May 26, 2020. 1 The death of George Floyd also

sparked widespread protests in large cities nationwide. Figure 1 shows both the gradual

diffusion of the protests, with 281 cities (documented to have a municipal population of at least

100,000) seeing protests by June 16, 2020. The vast majority of these cities saw protests lasting

more than 3 days (72 percent) and about one-third were attended by at least 1,000 people,

according to media reports.

 While many protests remained continuously peaceful, some included violence. There

were several high-profile instances of looting in cities such as Chicago, Minneapolis and Los

Angeles (Khazan 2020, Peterson 2020), as well a number of instances of police use of force

against protesters, including pepper spray, tear gas, and rubber bullets (Kim 2020). Some of the

police violence was in the course of enforcing citywide curfews which were enacted in some

cities in response to the large protests.

2.3 Protests and Transmission Behaviors

 Large scale protests could impact social distancing and disease transmission through two

key populations, those who attend the protests and those who do not. Any impact on the overall

1
 The recent Black Lives Matter protests are not the first time that the killing of an individual has led to large scale
protests with regards to issues of unequal treatment by law enforcement on the basis of race. The Black Lives Matter
movement traces back to 2013 (Black Lives Matter 2020), but the larger issue of racial justice within law
enforcement in the United States is substantially older.

 4
population rates of distancing behavior and contagion will be based on the relative effects of the

protests on the behavior of these populations as well as their sizes, and demographics.

2.3.1 Protest Attendees and Transmission Behaviors

 A protest is an activity that is difficult to socially distance. Attendees of the protests, be

they protesters, or police tend to congregate around points of interest (such as a seat of

government) in close proximity. While attendees can utilize some compensatory behaviors to

prevent spreading infection, such as wearing masks, maintaining distance from each other, and

staying home if they feel ill, it is difficult at such an event to completely avoid human contact.

Many activities that are common at protests, such as chanting or shouting can exacerbate the

spread of respiratory droplets (Wei and Li 2016). Additionally, many forms of crowd dispersal

used by law enforcement to break up protests such as pepper spray or tear gas illicit coughing,

which increases the likelihood that an infected individual will spread disease (Xi et al. 2009;

Rothenberg et al. 2016; Wei and Li 2016). In sum, we hypothesize that protests are activities

that would increase disease transmission, albeit perhaps in a dampened fashion if

countermeasures such as masks are used pervasively.

2.3.2 Avoiders and Transmission Behaviors

 The population who does not attend the large protests could have their social distancing

behavior altered by the presence of the protests locally. If the protests increase the perceived

cost of activities outside of the home, individuals would be more likely to avoid those activities

and thus remain distanced from others. This could take the form of additional time costs from

traffic congestion or from routing around streets closed off due to protests.

 5
There are other reasons why individuals could perceive leaving home to be costlier when

protests are present in the same city. If the protests are seen as dangerous (due to the protesters

or the police being potentially violent), then individuals may not leave home due to the

additional risk to their person or property. This would be consistent with previous literature

showing a link between crime and reduced outdoor physical activity, where individuals avoid

going outside due to additional perceived risk (Bennet et al. 2007; Stafford et al. 2007; Roman

and Chalfin 2008; Janke, Propper and Shields 2016; Yu and Lippert 2016; Stolzenberg,

D’Alessio and Flexon 2019). Also, if businesses are closed, either due to destruction from

looting or as a preventative measure to avoid looting, this could lower the options for out of the

home activities for non-attendees, increasing the likelihood that they would stay home. Finally,

non-attendees may perceive a higher risk of COVID-19 infection due to the protests and choose

to stay home.

 3. Data

3.1 Urban Protests

 Our data on protests are collected from May 25, 2020, the day George Floyd was killed,

through June 20, 2020 from 315 U.S. cities with municipal populations estimated at 100,000 or

more in 2019 (U.S. Census Bureau 2019). Searches for protests were carried out by the Center

for Health Economics & Policy Studies (CHEPS) at San Diego State University using internet

searches for local and national news articles, reports from local police departments, and

communications from mayors’ and governors’ offices. Of the 315 largest U.S. cities under

study, we document that 281 cities saw a protest while 34 did not. Figure 1 documents the

geographic dispersion of these protests over time, beginning on May 26, the first day following

 6
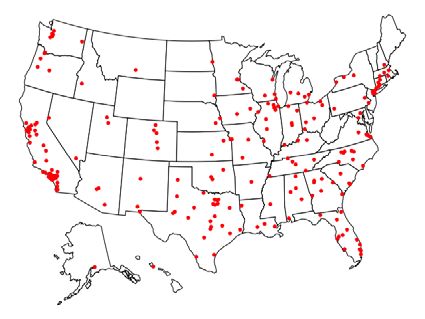
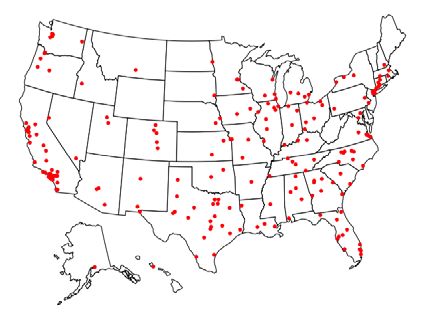
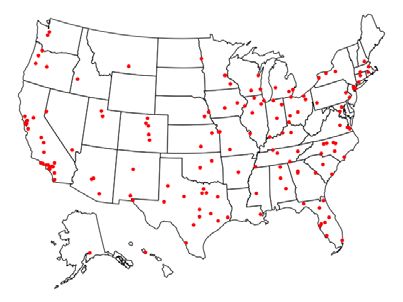
George Floyd’s death. The first large U.S. cities to experience protests were Minneapolis,

Minnesota (May 26), the city where George Floyd was killed, followed by Memphis, Tennessee

(May 27), and Los Angeles, California (May 27). On May 28, 14 additional cities held protests,

followed by 49 additional cities on May 29, 88 cities on May 30, 49 on May 31, and 78 in the

month of June.

 Appendix Figure 1 shows the geographic distribution of the “control” cities without

protests (in black) as compared to the treatment cities (in red). Included among geographically

diverse large cities without a Black Lives Matter protest were Aurora, Colorado, Hialeah,

Florida, and Irving, Texas.

 In Appendix Figure 2, we explore heterogeneity across protests by showing protests

which were accompanied by mainstream media reports of violence (which may include looting

or arrests) (blue) as compared to those that were consistently described as only peaceful

(yellow). Of the 281 cities with protests, 134 cities (47.7 percent) had a protest that were

accompanied by reports of violence.

 We also explore differences in protests in how persistent they were. Appendix Figure 3

compares large cities that had protests continue for three or more days (blue) as compared to

cities that held protests on only one or two days (yellow). We find that 71.9 percent of treatment

cities (202 of 281 cities) held protests for 3 or more days.

 In Appendix Figure 4, we show which cities included large protests, with media reports

of crowd sizes exceeding over 1,000 individuals. Such protests could increase the risk of

COVID-19 spread via the largest reductions in social distancing. These larger protests are

depicted in blue and comprise 36.3 percent of all protest cities.

 7
Finally, in Appendix Figure 5, we map our 281 “protest cities” into their primary 202

counties (black) and 42 secondary counties (grey) using the crosswalk created by Simplemaps,

which compiles up-to-date geographic information from the U.S. Geological Survey and U.S.

Census Bureau. 2 We do this for two reasons. First, our primary analyses of social distancing

and COVID-19 case growth will be at the county-level given data availability of both of these

outcomes. Second, using the county as our geographic unit of observation will allow us to

capture potentially important spillover effects from local protesters who (i) travel beyond city

limits to attend the events and (ii) perhaps travel back home where the coronavirus may be

spread. Supplemental analysis will widen this ring to include secondary counties associated with

primary counties, as well as include other border counties of the primary county where the

protest took place.

3.2 Social Distancing

 Our data on social distancing are drawn from Safe Graph, Inc., which provides an

anonymized population movement dataset of nearly 45 million smartphone devices aggregated to

the census block, county, and state levels. 3 These data have been used by the Centers for

Disease Control and Prevention (Lasry et al. 2020) and by COVID-19 scholars examining social

distancing in the United States (Andersen et al. 2020; Dave et al. 2020a,b,c; Friedson et al. 2020;

Abouk and Heydari 2020; Gupta et al. 2020).

 Our social distancing analysis period spans the 30 days from May 15, 2020 through June

13, 2020, which envelopes the date of George Floyd’s death (May 25) and the outbreak of urban

2
 The crosswalk is available at: https://simplemaps.com/data/us-cities
3
 SafeGraph data, and a detailed description of these data, are available at:
https://www.safegraph.com/dashboard/covid19-shelter-in-place

 8
protests (May 26). Our analysis focuses on 208 primary counties which map to the 315 cities

with a municipal population of 100,000. The average population of these counties is 779,565. In

supplemental analyses, we add 42 “secondary” counties, to which large cities extended, to the

treatment group. Moreover, we also consider augmenting the treatment group to include 739

border counties outside of the city limits to ensure that our results do not fail to capture important

spillovers of protests.

 From the SafeGraph data, we generate three measures of social distancing. The first

measure, Stay-at-Home Full-Time, captures the percent of the state population who remain at

home for the entire day. A person’s home is defined as a 153-meter by 153-meter area that

receives the most frequent GPS pings during the overnight hours of 6pm to 7am. To construct

this measure, each smartphone is assigned a “home” (or 153m by 153m square) based on a

common nighttime location. We estimate that in our sample, 35.6 percent of respondents

remained at home full-time.

 We also measure two variables that capture social distancing behavior at the intensive

margin: Median Hours at Home and Median Percent Time Spent at Home. On average, county-

level respondents in our urban sample remained at home for a median of 12.5 hours per day and

for 89.6 percent of the time. 4

 Panels (a) through (c) of Appendix Figure 6 shows trends in our three measures of social

distancing over the analysis period for our primary counties. We find that despite the intra-week

variance in social distancing, there is an overall downward trend facing these measures. We see

4
 The measure Median Hours at Home is based on summed observed minutes at home throughout the day,
regardless of whether or not these time episodes are contiguous. Because time during which a smartphone is turned
off is not counted towards measured time spent at home, this measure is not sensitive to protesters potentially
turning off their phones during the protests as a result of concern for potential digital surveillance or tracking by law
enforcement. Irrespective of whether protesters are leaving their phones on or off, their activity would be
appropriately reflected as a decrease in the median number of hours spent at home during the day.

 9
that, comparing to our earlier sample period (e.g. the first five days of our sample), less people

are staying at home and spending time at home during our later sample period (e.g. after June

1st).

3.3 COVID-19 Case Growth

 Finally, we measure county-level COVID-19 cumulative case growth using data from the

Centers for Disease Control and Prevention (CDC), made public by the Kaiser Family

Foundation. 5 For our COVID-19 case analysis period, May 15, 2020 through June 20, 2020, we

estimate an average of 623.6 COVID-19 cases per 100,000 population in our sample. The

average day-over-day COVID-19 case growth over the sample period was 215.2 cases (7.4 per

100,000 population). Our key variable measures the difference in the natural log in the

cumulative number of COVID-19 cases on a given day and the natural log of the number of

cases on the previous day. The mean of this variable is 0.019.

 In Panel (d) of Appendix Figure 6, we show the trend in COVID-19 cases for the full

sample of counties. We show that the slope is almost linear, which suggests that the rate of

COVID-19 case growth is relatively constant over our sample period.

 4. Methods

 The main objective of this study is to estimate how mass protests across the U.S.

following the death of George Floyd have impacted social distancing and the growth in COVID-

19 cases. Our research design capitalizes on variation in the differential outbreak of these

5
 These data are available at: https://github.com/nytimes/covid-19-data

 10
protests over time across “treated” cities in conjunction with “never-treated” large city controls

that did not experience any protests over the sample period.

 We begin by pooling our sample of 208 primary counties, which include the largest 315

U.S. cities with a municipal population of at least 100,0000 across 30 days and estimate a

difference-in-differences model of the following form:

 SDcst = γ0 + ∑8 =0 γ ct + Xct β1 + Zst β2 + αc + τt + εsct (1)

where SDcst is one of our four measures of social distancing in county c in state s on day t.

 ct represents a set of mutually exclusive indicators set equal to 1 if county c saw a large

city protest j days from day t, and captures any dynamics in social distancing behaviors

following the protest outbreak. In addition, Xct is a vector of county-level time-varying controls

including average temperature (in degrees Celsius) and an indicator for whether any measurable

precipitation fell. 6 Zst is a vector of state-level time-varying controls including the natural log of

COVID-19 testing rates, an indicator for whether the state had a shelter-in-place order (SIPO) in

effect and indicators for whether the state permitted reopening of (i) restaurants or bars, (ii) retail

stores (beyond curbside pickup), (iii) pet or personal care services (such as barbershops, nail

salons and tattoo parlors), or (iv) entertainment activities (such as drive-in movie theatres, state

parks, and public pools). 7 In addition, αc is a county fixed effect, and τt is a day fixed effect. All

regressions are weighted by the county population and standard errors are clustered at the

county-level.

6
 These data are available at: ftp://ftp.ncdc.noaa.gov/
7
 Data for COVID-19 testing are available from COVID tracking project (see: https://covidtracking.com). Data for
SIPO enactment are available in Mervosh et al. (2020) and Dave et al. (2020a). Data on reopening policies are
compiled by our own searches of official county websites, county court records, local news agencies, and
gubernatorial executive orders and proclamations.

 11
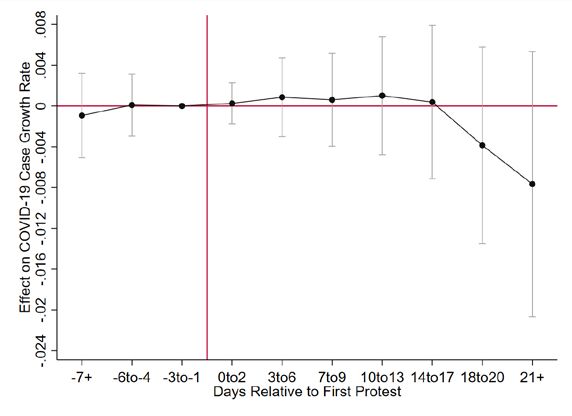
The parameters of interest, γ , capture the net effects of the protests on mobility outside

the home operating through all — reinforcing and counteracting, direct and indirect —

behavioral pathways. In our main tables on social distancing, we present post-protest effects for

various time windows up to 8 or more days following its outbreak.

 Next, we examine effects of the protests on the growth in COVID-19 cases by using data

from May 15, 2020 through June 20, 2020 (37 days) and estimating the following specification:

 COVID Growthcst, t-1 = γ0 + ∑21
 =0 γ ct + Xct β1 + Zst β2 + αc + τt + εsct (2)

where COVID Growthcst,t-1 is the difference in the natural log of cumulative COVID-19 cases in

county c on day t and day t-1, that is day-over-day COVID-19 case growth. Because we have

additional data on cases, we are able to estimate case effects up to 21 or more days following the

day of the protest, a period well beyond the median incubation period of COVID-19 (5.1 days)

(Li et al. 2020) when we would expect case divergence if there were an effect from the protest

gathering (Friedson et al. 2020; Dave et al. 2020a, b, c; Courtemanche et al. 2020a, b).

 Our difference-in-differences estimates of protest effects will only be unbiased in the

absence of (i) endogenous protests, that is, protests starting because of differential COVID-19

case growth, and (ii) unmeasured county-specific unobservables that could be correlated with

protests and with COVID-19 case growth.

 We take two tacks to assess the common trends assumption. First, we conduct an event-

study analysis, decomposing the estimated protest effect into coefficients up to 7 days prior to

the outbreak of the event and up to 10 (for social distancing) or 21 days (for cases) following the

onset of protests. This will provide a descriptive test for whether protests are endogenous to the

outcomes under study or correlated with differential trends in outcomes across the treated and

 12
non-treated counties. Second, in a robustness check, we test the sensitivity of estimates from

equations (1) and (2) to additional controls for county-specific linear time trends, which may

capture (i) differences in the trajectory of the COVID-19 epidemic across counties, and (ii)

unobserved time-varying heterogeneity at the county level such as enforcement of local

mitigation policies or outreach to historically marginalized populations.

 Next, we allow for spillover effects of protests by augmenting our analysis sample to

include 42 “secondary” counties to which cities may extend. In addition, in supplemental

analysis, we also augment our treatment group to include 739 border counties to the treatment

counties. We then re-estimate equations (1) and (2), turning the protest variable on for all

“treated” counties (primary, secondary, and non-secondary border counties) when a primary

county has its protest. This will allow us to capture those protesters who may travel from

neighboring jurisdictions to participate and potentially spread COVID-19 back in their home

counties. In these regressions, standard errors are clustered at the level of the 208 “primary

counties” associated with each group of border counties.

 Finally, we examine heterogeneity in the impact of urban protests across several key

dimensions of the protests, and estimate the following specification interacting the post-protest

time windows with the relevant characteristic:

 SDcst = γ0 + ∑8 =0 γ ct * Tc + Xct β1 + Zst β2 + αc + τt + εsct (3a)

 COVID Growthcst = γ0 + ∑21
 =0 γ ct * Tc + Xct β1 + Zst β2 + αc + τt + εsct (3b)

where Tc measures particular characteristics of the protest that could differentially affect social

distancing and COVID-19 case growth. These include (i) Violentc, an indicator for whether the

 13
protest was accompanied by media reports of violence (i.e. arrests, use of tear gas, looting), (ii)

Persistentc, an indicator for whether the protest lasted for at least three days, (iii) Protest Sizec, an

indicator for whether the protest was reported to consist of over 1,000 individuals on at least one

day of the protest, and (iv) Curfewc, an indicator for whether the city’s mayor issued a curfew

order at some point during the protest period. 8 In addition, in a series of auxiliary analysis, we

explore whether there were heterogeneous effects by whether the protest occurred early in

calendar time (on May 26, 27, or 28) or later, by whether the city municipal population size was

greater than 500,000 individuals, and by the racial composition of the county (whether the

county population exceeded the mean share of non-Hispanic whites, based on the treated

counties).

 5. Results

 Our main findings are shown in Figure 2 and Tables 1 through 3. In Table 1 and in

Panels (a) through (c) of Figure 2, we present the net effects of protest onset on mobility.

Estimates of the heterogeneity analyses with respect to these social distancing measures are

presented in Table 2. Then, in Table 3 and Panel (d) of Figure 2, we present and discuss how the

mass protests affected COVID-19 case growth. Additional analyses addressing specific issues

are presented in the Appendix.

4.1 Mass Protests and Social Distancing

8
 47.7 percent of all treatment cities (and 60.4 percent of all treatment counties) had a protest that was accompanied
by media reports of violence; and 71.9 percent of all treatment cities (and 82.9 percent of all treatment counties) had
a protest that lasted for three or more days; 36.3 percent of all treatment cities (and 47.5 percent of all treatment
counties) had a protest with reported attendance exceeding 1,000 persons; and 51.9 treatment cities (and 49.0
percent of all treatment counties) had a protest that was accompanied by a city curfew.

 14
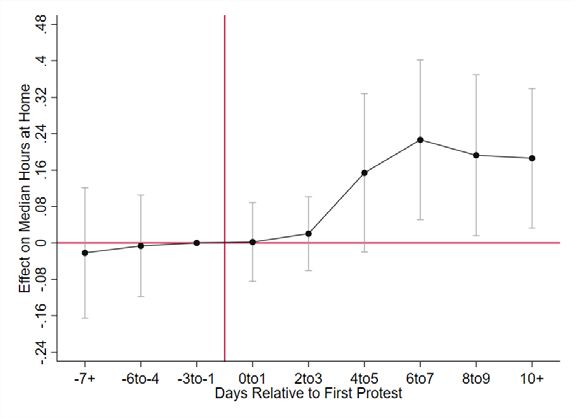
Panels (a) through (c) in Figure 2 visually present the conditional event study analyses for

our three measures of social distancing, drawn from Safegraph’s anonymized geotagged cell-

phone data. Panel (a) plots the trend difference between the treated and non-treated counties,

pre- and post-protest outbreak, for the percent of respondents staying at home throughout the

day. 9 Panels (b) and (c) repeat this exercise for intensity measures, respectively capturing the

median percent of time spent at home daily and the median daily hours spent at home.

 These analyses underscore three key points. First, it is validating that we find no

evidence that stay-at-home behaviors trend differently in treatment and control counties before

the outbreak of the protests. Trends between the treated and non-treated counties essentially

move in lock-step, reflected in the flat differential trends over the pre-protest periods. This

instills a degree of confidence that the timing of the protests is exogenous to trends in social

distancing.

 Second, where there are social distancing effects, they only appear to materialize after the

onset of the protests. Specifically, after the outbreak of an urban protest, we find, on average, an

increase in stay-at-home behaviors in the primary county encompassing the city. That overall

social distancing behavior increases after the mass protests is notable, as this finding contrasts

with the general secular decline in sheltering-at-home taking place across the sample period (see

Appendix Figure 6). Our findings suggest that any direct decrease in social distancing among

the subset of the population participating in the protests is more than offset by increasing social

distancing behavior among others who may choose to shelter-at-home and circumvent public

places while the protests are underway. This latter behavioral pathway is consistent with studies

9
 Estimates plotted in Figure 2 are conditional on state-level log testing rates, indicators for shelter-in-place policies
and reopening policies, county-level average temperature and an indicator for precipitation on the given day, and
day and county fixed effects.

 15
that find perceived safety concerns, crime, and violence to be significant barriers to participation

in physical activity and spending time outdoors (Janke, Propper and Shields 2016; Roman and

Chalfin 2008; Foster and Giles-Corti 2008). Moreover, to the extent that the killing of George

Floyd, and the ensuing civil unrest and mass protests, also impacted residents’ mental health and

stress, this may further lead to decreased activity levels and an increase in stay-at-home

behaviors. 10

 Third, the event study analyses shown in Panels (a) through (c) of Figure 2 point to some

dynamics in the response of stay-at-home behaviors. The rise in social distancing emerges after

about three days following the protest outbreak. Effects get stronger over the next few days and

peak within a week following the protests, before leveling off and showing some suggestive

signs of a decline. Hence, the effects of the protests on social distancing appear to be somewhat

transitory and may fade over the longer-run, possibly as the violence and scope of the protests

abate.

 The patterns evident in Figure 2 presage our main estimates of the average net effect of

the protests on each of the social distancing outcomes, based on equation (1) and reported in

Table 1. We present estimates both with and without controls as a gauge of the extent to which

the presence and timing of the protests are correlated with other observables. Our preferred

estimates are from the saturated models that include COVID-19 testing rates and other predictors

of social distancing, though it is reassuring that the results not very sensitive to these controls.

 Panel I presents results for primary counties that include the large cities under study. As

shown in column (2), we find an increase in the percent of county residents staying at home full-

time following protest onset, with the effect getting progressively stronger and statistically

10
 Studies have causally linked crime and violence to poor mental health (Cornaglia, Feldman and Leigh, 2014;
Dustmann and Fasani 2015; Wang and Yang 2013; Rubin et al. 2005).

 16
significant after the third day. Within 4 to 7 days, there is about a 0.70 percentage point daily

increase (2.0 percent increase relative to the mean) in residents remaining at home all day. The

magnification of the effect over the first few days likely reflects dynamics in the behavioral

response with protests gaining momentum and numbers, occurring on consecutive or multiple

days, and being accompanied by more reports of violence in certain cities – dimensions that we

return to below in assessing heterogeneity in the response. Estimates from the intensity

measures of staying at home follow a similar pattern, indicating on average a 0.46 percentage

point increase in the median percent of time spent at home and a 0.18 hour increase in the

median time spent at home (0.5 to 1.4 percent relative to the mean), within 4-7 days of the start

of the protests. 11 There is also evidence that social distancing effects level off or decline

following about a week after the protests, which could suggest either that the impact of the

protests are fading, or are cyclical depending on when future protests are organized. 12

 One concern with our findings is that our estimated social distancing effects may not

fully capture any direct reduction in stay-at-home behaviors driven by the sub-population of

protesters if protesters are being drawn from outside the city. This is partly addressed by our

focus on the primary county – which encompasses the city – as the unit of analysis. However, in

Panel II of Table 1, we widen the spatial unit to include both primary and secondary counties for

cities that partly cross over into another county. Models reported in Appendix Table 2 further

expand the geographic cluster to include counties that border the treated primary county (county

that encloses the protest city). To the extent that protests in cities are drawing participants from

11
 Results are robust to controlling for county-specific linear time trends though less precisely estimated (see
Appendix Table 1).
12
 Data from Google Trends show that search queries on Google related to “protest”, “protest today”, “George Floyd
protest”, and “Black Lives Matter protest” peaked between May 31 and June 2, five to eight days since the start of
the early protests. Similarly, searches related to “protest violence” and “protest looting” peaked between May 31
and June 1.

 17
their larger parent counties or from other surrounding counties, our estimates will capture both

the direct social distancing effects on resident protesters in these counties as well as behavioral

effects on other non-participating residents. The estimates remain largely similar across both

samples as we broaden the geographical unit to capture non-local protesters.

4.2 Heterogeneity in the Effects of the Protests on Social Distancing

 Given consistent indications that the mass protests appear to have increased net stay-at-

home behaviors — potentially reflecting an overriding behavioral effect among non-participants

— we next assess whether this average response differs across relevant characteristics of the

protests. We present these results in Table 2, based on equation (3a) that interacts a specific

dimension of the protest with the post-protest timing windows.

 If the increase in social distancing among non-participating residents is induced by safety

and related concerns, then one would expect protests that are persistent (ongoing for 3 or more

days) or that have turned violent to generate a stronger response. In Panel I, we specifically

assess treatment effects across protests which have turned violent as compared to those that have

not. We generally find increases in the percent of residents staying at home full-time and time

spent at home for both sets of protests, though effects are expectedly stronger when protests are

accompanied by media reports of violence.

 In Panel II, we specifically assess treatment effects across protests which are ongoing as

compared to those that last only one or two days. In cases when protests are ongoing, we find

that within 4-7 days after the onset of the first protest, the percent of residents staying at home all

day increases by 0.73 percentage points, which then falls to 0.53 percentage points after seven

days; both estimates are statistically significant. In contrast, effects in counties where the

 18
protests are not persistent are smaller (0.37 percentage points within 4-7 days and 0.38

percentage point after 7 days) and are statistically indistinguishable from zero.

 Panel III considers differences in the social distancing response based on the size of the

protest. Specifically, we compare treatment effects across cities where the protest size exceeded

1,000 protesters vs. those that drew smaller protests. Larger protests may be perceived as being

more disruptive and carrying a larger threat of violence. While there are significant increases in

social distancing in both cases, there are indications that the increase is larger when protests draw

a greater number of participants.

 Finally, in response to protests that have turned violent and disruptive or in anticipation

of such, some cities have issued nighttime curfews. In Panel IV, we assess whether these curfews

may be “mechanically” driving the increase in sheltering-at-home that we find. In addition to

their direct intended effects, curfews could also signal to residents the potential for the eruption

of violence, and may further elicit a behavioral response due to this information signal. We find

increases in staying-at-home behaviors across both cities with and without curfews, though effect

magnitudes are expectedly larger when the city has imposed a curfew order at some point during

the protest period.

 In summary, the estimates from Table 2 provide a form of a “dose-response” test. We

find that overall the onset of mass protests has led to an increase in social distancing, on the net,

which is consistent with a counteracting response among non-protesting residents who may be

avoiding venturing out as the protests are underway, possibly due to perceived safety concerns.

The behavioral response may also reflect a diminution of economic and business activity. For

instance, if retail outlets and restaurants are closed as a precautionary measure in anticipation of

violence and disruption from the protests, then this would reduce the demand for out-of-home

 19
mobility. If these behavioral pathways are at play, it is reasonable to expect stronger responses

when the protests are bigger in scope, persistent, and violent. The estimates in Table 2 largely

confirm these patterns. 13

 Nevertheless, we also generally find an increase in social distancing behaviors across all

margins. This is not altogether surprising given the geographic diffusion of the protests,

including the national media attention. Hence, even if a protest in a given city is not violent,

large, or sustained, there are likely spillovers from media reports of violence and disruptions

from other cities; in this case, we would expect some behavioral response since there is a non-

zero probability that a given protest could turn violent in the future. 14

4.3 Mass Protests and COVID-19 Case Growth

 Our findings thus far do not indicate that the outbreak of protests on the net has led

residents to spend more time outside their homes. If anything, we find consistent evidence of an

increase in social distancing behaviors on average. Prima facie, given this increase in sheltering-

at-home, we would not expect any strong increases in COVID-19 case growth. However, a key

concern has been that local protesters who travel back home may be spreading the coronavirus to

13
 Appendix Figure 7 presents event study graphs for each of the margins considered in Table 2. They largely
confirm flat differential trends prior to the onset of the protests, and increases in stay-at-home behaviors up to 7 days
post-protest which subsequently diminish in magnitude after this time.
14
 In supplementary analyses (see Appendix Table 3), we also assess whether there were heterogeneous effects
across other dimensions. Panel I considers differential effects based on whether the protests occurred early in
calendar time, within the first 3 days after the death of George Floyd. These protests were arguably spontaneous,
unanticipated, and exogenous to any considerations of COVID-19. We find significantly larger increases in social
distancing following these earlier protests. Many of the early protests also occurred among the larger cities. In
Panel II, we specifically decompose the treatment effect into separate effects across larger cities (≥500,000
population) and smaller cities. While we find significant effects across the board, the effect magnitudes are
generally higher for protests occurring in larger cities. Given that the protests were united against police brutality
and racism in policing, and conjoined with the Black Lives Matter movement, we also assess whether responses in
social distancing differed across the racial composition of the county (Panel III). We do not find any consistent or
meaningful differences across our three social distancing outcomes across counties with a larger (≥ weighted mean
of 56 percent among treated counties) share of non-Hispanic whites vs. those with a smaller share.

 20
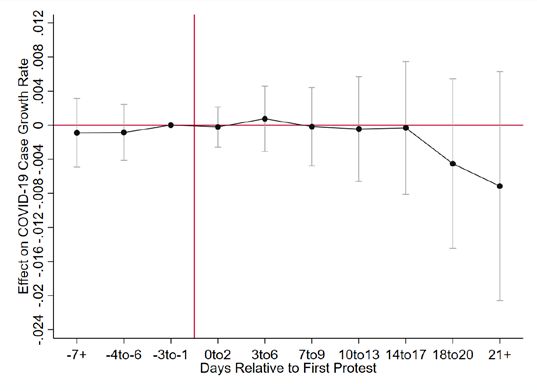
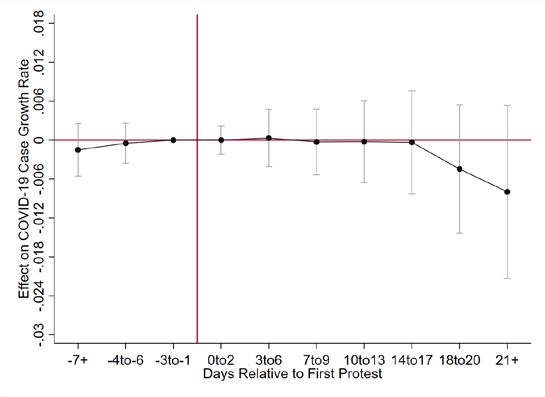
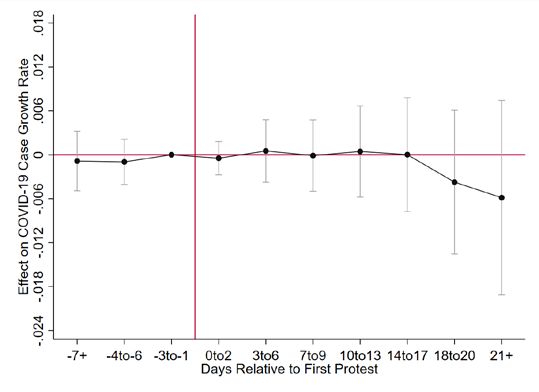
others. In this case, it is possible that we may see an increase in COVID-19 case growth, as a

result of community spread from this subset of population (protest participants) for whom there

was by definition an increase in out-of-home mobility and reduced social distancing.

 Panel (d) in Figure 2 presents the event study analysis for daily growth in confirmed

cases. Trends between the treated and non-treated counties are virtually identical prior to the

protests. This is reassuring and suggests that the timing of the protests is not correlated with

trends in COVID-19 case growth or unobservable determinants of case growth. We find no

significant divergence in the trends after the protests. While there is some suggestive decrease in

the daily growth rates in cases after 21 or more days subsequent to the start of the protests, the

estimates are statistically insignificant and also fairly small in magnitude.

 Estimates in Table 3, based on equations (2) and (3b), confirm these findings. In no case

do we find any significant or substantial increase in the growth in COVID-19 caseload (Panel I).

Our point estimates are close to zero and our confidence intervals are tight enough to rule out,

with 95 percent confidence, an increase in daily case growth exceeding 0.51 percent in a county

after 21 or more days following the onset of protests.

 These results are robust to widening the geographic unit of analysis to include primary

and secondary counties (Panel II) and border counties (Appendix Table 4); hence, accounting for

potential spillovers over a larger spatial unit as protesters travel back home does not alter our

results. Our estimates are also robust to controlling for county-specific linear trends (Appendix

Table 5). The trends help to account for unobserved factors driving the exponential growth

trajectory of COVID-19 transmissions, and effects in these models are identified off deviations

from this trend growth. These controls may also be important in controlling for heterogeneity

across counties in the timing of coronavirus outbreak as well as for heterogeneity in growth of

 21
COVID-19 testing. Finally, as reported in Panel III, we do not find any evidence of differential

effects on case growth across specific dimensions of the protest (violent protests, persistent

protests, size of protests, or the existence of curfews). 15

 One concern regarding the lack of any strong effects for COVID-19 case growth is that

the post-protest sample period might not be sufficiently long enough as of yet to detect a

resurgence or increase in the infection rates. While this is a possibility, we also note that our

sample includes at least 21 days of data following the early protests that took place in 154 cities

(during the first five days following George Floyd’s death), at least 18 days of data following

protests in 242 cities, and at least 16 days of data for 257 cities that experienced protests (during

the first week following George Floyd’s death). The median incubation period for COVID-19 is

5.1 days, with 75 percent of all infected individuals experiencing symptoms within 6.7 days and

97.5 percent within 11.5 days (Li et al. 2020). Prior work has uncovered strong effects of

shelter-in-place orders on confirmed cases within five to ten days following the adoption of the

policy (Friedson et al. 2020; Dave et al. 2020 a, b; c; Courtemanche et al. 2020a, b). Further,

other work in economics has detected secondary spread of COVID-19 from travel due to spring

break at a 2-week time horizon (Mangrum and Niekamp 2020). Hence, if there are any

meaningful changes in COVID-19 cases as a result of the mass protests, our post-protest window

is long enough to be able to capture them.

15
 Appendix Figure 8 presents the event study graphs for COVID-19 case growth across these margins. If anything,
there is a very slight declining trend in case growth following protest onset where we also generally found a
relatively larger increase in social distancing; all effects however are small and statistically insignificant. Appendix
Table 6 assesses heterogeneous effects across: whether the protests occurred early in calendar time (Panel I); larger
vs. smaller cities (Panel II); and racial composition of the county (Panel III). There are no indications of any
significant or substantial increase in the growth of COVID-19 cases across any of these margins, by three or more
weeks following the start of the protests.

 22
We also estimate separate protest effects for each of the early protest cities (cities

experiencing protests on May 28 or earlier), in order to assess whether our finding of no

significant or substantial effects on COVID-19 cases is masking any meaningful changes for

certain cities. We employ a synthetic control approach to generate a counterfactual for each

primary county (Abadie et al. 2010), with the donor pool comprising counties where no large

city held any protest during the sample period or where the first protest occurred much later (less

than five days prior to the end of the sample, a period not long enough to generate substantial

effects on COVID-19 cases given the disease’s incubation period) (Li et al. 2020; Friedson et al.

2020; Dave et al. 2020a). Analyses for the 13 counties for which pre-treatment COVID-19 case

levels and trends were well-matched are visually presented in Appendix Figure 9. 16 Cases are

expectedly trending upwards across all of these counties and their synthetic controls. However,

with the exception for Maricopa County, Arizona, we find essentially no evidence that protests

contributed to significant or substantial increases in COVID-19 during the period following

protest onset, consistent with our main difference-in-differences findings in Table 3. 17

 Finally, we assess the sensitivity of these estimates to different sources of timing-based

identification. As our research design is capitalizing on variation in the timing of the protests

across cities, in conjunction with cities that did not experience any protests, the estimated

16
 We match on the COVID-19 confirmed case rate (per 100,000 population) for each of the pre-protest days. We
focus on protest counties where the quality of the pre-treatment match was good, as measured by the mean squared
prediction error over the pre-protest period. For four of the early protest counties (Hennepin, MN; San Bernardino,
CA; Los Angeles, CA; and Solano, CA), the quality of the pre-treatment match, between the county and its
synthetically generated counterfactual from the donor pool, was quite poor. Thus, estimated post-protest effects for
these counties are not regarded as credible.
17
 The effect size for Maricopa County implies an increase of 33.2 COVID-19 cases per 100,000 population within
13 days following the start of protests on May 28. The permutation-based p-value for this estimate is 0.067. The p-
values for the effects for other protest counties shown in Appendix Figure 9, that show COVID-19 case increases
relative to their synthetic control (Jefferson, Texas and Shelby, Tennessee), were never shown to have estimated
effects that were statistically distinguishable from zero at conventional levels, with p-values ranging from 0.53 to
0.67.

 23
treatment effect is identified off the many sub-experiments comparing: 1) counties with early and

later-occurring protests with counties containing large cities that did not experience any protests;

2) counties witnessing early protests with counties where protests occurred later; and 3) counties

with later-occurring protests compared to counties with early onset of protests as controls

(Goodman-Bacon 2018). With dynamic treatment effects, as there appear to be for social

distancing outcomes and which also may be likely with COVID-19 cases, using counties with

early protests as a control for the treated later-protesting counties may underestimate the

treatment effect. 18 In Appendix Table 7, we draw on subsets of the treated counties to identify

our effects, in turn excluding counties with late-occurring protests, counties with early-occurring

protests, and counties that saw no protests from the sample. These results confirm that there is

no discernible change in the growth of COVID-19 cases, among early- or later-protesting

counties, even after three or more weeks subsequent to the onset of protests, irrespective of

which counties form the counterfactual. 19

 6. Conclusions

 This study is the first to empirically examine the linkage between the 2020 Black Lives

Matter protests and the spread of COVID-19, which has been a point of concern among public

health officials and the media (Bacon 2020; Goldberg 2020; Harmon and Rojas 2020). While it

18
 This is because the trajectory in outcomes for counties with the early protests, at the time when other counties
witness their own protests at a later point in time, may still be affected by the “treatment” (that is, by the early
protests). In this context, it may be better to compare treated early-protesting counties with yet untreated later-
protesting counties or never-protesting counties, and compare treated later-protesting counties with never-protesting
counties (Goodman-Bacon 2018). At the same time, however, counties with large cities that did not contain any
protests may be different than counties that contained cities with protests. This suggests that it may also be
important draw on variation just among the protest counties, excluding the “never protesters” from contributing any
identifying variation (Dave et al. 2020b).
19
 This is consistent with the results presented in Appendix Table 6 (Panel I), which separated out the effects across
counties that saw the early wave of protests during the first three days following the death of George Floyd.

 24
is almost certain that the protests caused a decrease in social distancing behavior among protest

attendees, we demonstrate that effect of the protests on the social distancing behavior of the

entire population residing in counties with large urban protests was positive. Likewise, while it

is possible that the protests caused an increase in the spread of COVID-19 among those who

attended the protests, we demonstrate that the protests had little effect on the spread of COVID-

19 for the entire population of the counties with protests during the more than three weeks

following protest onset. In most cases, the estimated longer-run effect (post-21 days) was

negative, though not statistically distinguishable from zero. 20

 While the exact mechanisms for these findings cannot be conclusively known with the

data available, the results are consistent with avoidance behavior on the part of the non-attending

population. This is consistent with the literature on crime, violence, and perceived safety

amongst the general population, who in the presence of crime or violence choose to remain home

more often (Bennet et al. 2007; Stafford et al. 2007; Chalfin 2008; Janke, Propper and Shields

2016; Yu and Lippert 2016; Stolzenberg, D’Alessio and Flexon 2019). While Black Lives

Matter protests are protected speech and not criminal activities, they may still be viewed as

dangerous by non-attendees due to the occasional presence of violence, including police

response to these protests, and elicit avoidance behavior.

 There are other possible explanations for our findings as well, such as avoiding travel

outside the home due to additional traffic congestion or street closures, or due to lack of

available activities from businesses closures near protest sites. Additionally, non-attendees may

perceive a higher risk of COVID-19 infection due to the protests and choose to stay home.

20
 Our results do not necessarily extrapolate to imply that large outdoor gatherings per se are safe. In the case of the
protests that we study, compensatory behavioral responses among the non-participating subpopulation appear to be
driving the net effects that we find in the overall population.

 25
Finally, it is possible that the result of suggestive lower spread of COVID-19 relative to

non-protesting cities is due in part to characteristics of the protesters. For example, protest

attendees may have mitigated the spread of COVID-19 via infection countermeasures such as

wearing masks. The attendees may further be a selected subpopulation of younger individuals

who if infected have less severe symptoms (Liao et al. 2020) and thus may never get tested and

not show up in the official COVID-19 numbers.

 Regardless of the underlying mechanisms, our findings show that the protests and the

fight against COVID-19 were on net aligned. It is important to underscore that our findings do

not imply that that this was the case for all parts of the population. The net effect of increased

sheltering and decreased case growth could mask adverse outcomes within a subset of the

population (specifically protest attendees). This could hypothetically cause a redistribution of

public health benefits (and costs) across demographic groups, and could only be measured with

more granular data that to our knowledge does not exist at present.

 However, when considering the results’ implications for the entire population: public

speech and public health did not trade off against each other in this case. Our findings also

highlight the importance of understanding the behavior of all relevant populations when

conducting analysis in the realm of social science in general, and public health in particular: the

most visible portion of the population is not always the primary driver of the outcome of interest.

 26
You can also read