The Political Impact of Immigration: Evidence from the United States - Bank of Canada
←
→
Page content transcription
If your browser does not render page correctly, please read the page content below

Staff Working Paper/Document de travail du personnel 2018-19

The Political Impact of
Immigration: Evidence from the
United States

by Anna Maria Mayda, Giovanni Peri and Walter Steingress

Bank of Canada staff working papers provide a forum for staff to publish work-in-progress research independently from the Bank’s Governing
Council. This research may support or challenge prevailing policy orthodoxy. Therefore, the views expressed in this paper are solely those of the
authors and may differ from official Bank of Canada views. No responsibility for them should be attributed to the Bank.

                                                                                                               www.bank-banque-canada.ca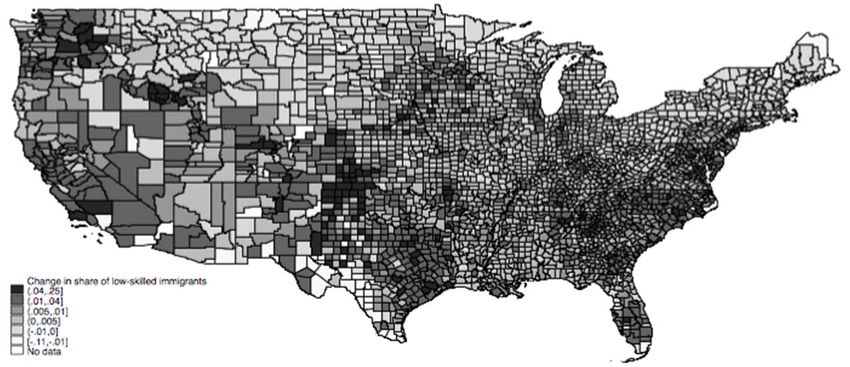
Bank of Canada Staff Working Paper 2018-19

                                        May 2018

    The Political Impact of Immigration: Evidence
                from the United States

                                             by

          Anna Maria Mayda,1 Giovanni Peri2 and Walter Steingress3

                                 1 Georgetown
                                           University
                                amm223@georgetown.edu

                              2 University
                                         of California, Davis
                                    gperi@ucdavis.edu

                     3   International Economic Analysis Department
                                       Bank of Canada
                             Ottawa, Ontario, Canada K1A 0G9
                               wsteingress@bankofcanada.ca

ISSN 1701-9397                                                        © 2018 Bank of Canada
Acknowledgements

The authors would like to thank Michel Beine, George Borjas, Claudia Goldin, Daniel
Hopkins and Alexander Wagner for useful comments. Seminar participants at Vanderbilt
University, Duke University, Banque de France, Georgetown University, Université Libre
de Bruxelles (ECARES), Lancaster University, Oxford University, the 14th IZA AM2 and
the 2016 NBER Summer Institute in Political Economy provided suggestions on earlier
drafts of this paper. The views expressed in this paper are those of the authors alone and
do not reflect those of the Bank of Canada.

                                            i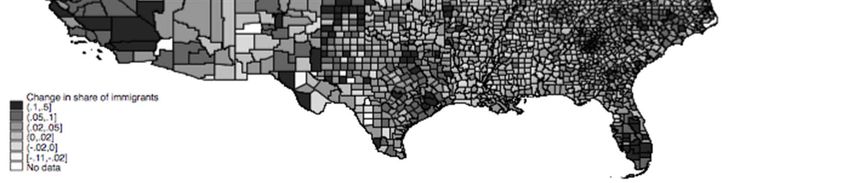
Abstract

In this paper we study the impact of immigration to the United States on the vote for the
Republican Party by analyzing county-level data on election outcomes between 1990 and
2010. Our main contribution is to separate the effect of high-skilled and low-skilled
immigrants, by exploiting the different geography and timing of the inflows of these two
groups of immigrants. We find that an increase in the first type of immigrants decreases
the share of the Republican vote, while an inflow of the second type increases it. These
effects are mainly due to the local impact of immigrants on votes of U.S. citizens and they
seem independent of the country of origin of immigrants. We also find that the pro-
Republican impact of low-skilled immigrants is stronger in low-skilled and non-urban
counties. This is consistent with citizens' political preferences shifting towards the
Republican Party in places where low-skilled immigrants are more likely to be perceived
as competition in the labor market and for public resources.
Bank topics: International topics; Labour markets
JEL codes: F22, J61

                                         Résumé

Nous étudions l’incidence de l’immigration aux États-Unis sur les votes en faveur du Parti
républicain. Pour ce faire, nous analysons des données par comté sur les résultats des
élections pour la période de 1990 à 2010. Notre principal apport consiste à isoler l’effet des
immigrants peu qualifiés et des immigrants hautement qualifiés sur l’orientation du vote,
en nous appuyant sur la répartition géographique de ces deux groupes et le moment de leur
arrivée. Nous constatons qu’une hausse de l’afflux migratoire de travailleurs hautement
qualifiés abaisse la proportion d’électeurs qui votent pour les républicains, tandis qu’une
hausse de l’afflux migratoire de travailleurs peu qualifiés l’augmente. Ces effets semblent
indépendants du pays d’origine des immigrants et s’expliquent surtout par l’incidence
locale de ces derniers sur les votes des citoyens américains. Par ailleurs, nous constatons
que l’incidence pro-républicaine de l’afflux d’immigrants peu qualifiés est plus forte dans
les comtés non urbains ainsi que dans les comtés où la population locale est peu qualifiée.
Ce résultat sous-entend que les préférences politiques des citoyens se réorientent vers le
Parti républicain dans les comtés où les citoyens perçoivent les immigrants peu qualifiés
comme une source de concurrence sur le marché du travail et pour l’accès aux biens
publics.
Sujets : Questions internationales; Marchés du travail
Codes JEL : F22, J61

                                              ii
Non-technical summary
Political leaders' positions on the issue of immigration can be an important determinant of their electoral
success or failure. Immigration took center stage in the 2016 U.S. presidential elections and its aftermath
as now-President Donald Trump took strong stands on illegal immigration, the construction of a border
wall, refugees from Syria, and “sanctuary cities”. The “Brexit” vote in the United Kingdom and recent
political elections in Germany (2017) and Italy (2018) have highlighted the controversial political role of
immigration and the electoral success of strong anti-immigration stands.
Existing studies on the effect of immigrants on election outcomes have mainly focused on Europe and
provide evidence consistent with the idea that right-wing parties stand to gain votes from the inflow of
immigrants. The anti-immigration stance of those parties, it appears, has become more appealing to citizens
as new immigrants have grown to have a larger local presence. Does this rhetoric work in the U.S.? Are
voters in a country built on successive generations of immigrants driven to vote Republican because of
increasing immigration pressure?
The substantial inflow of immigrants to the United States during the last 30 years has significantly shaped
the U.S. economy and society. Immigrants affect native workers' opportunities in the labor market, their
productivity, and their specialization (see, for example, the book by Borjas (2014) and the recent review by
Peri (2016)). Immigrants can also have an impact on other aspects of the host country's economy (for
example through fiscal effects, innovation and consumption), as well as on its culture, social norms, and
sense of security. In addition, immigration can affect political outcomes through voting behavior. In this
paper, we analyze the latter outcomes but, in doing so, we also need to consider the impact of immigration
through the other channels. Indeed, we assume that, through their votes, U.S. citizens respond to the
perceived economic and psychological costs and benefits (through the labor-market, fiscal and non-
economic mechanisms) of having more immigrants in their county. We posit that their probability of voting
for the Republican Party goes up if the perceived cost of an increase in immigrants (high-skilled or low-
skilled) is larger than the perceived benefit. In this simple framework, we associate the Republican Party
with more restrictive immigration policies, which it usually championed in the 20 years we consider.
Immigration may also affect the outcome of elections by extending the pool of voters, i.e. directly, by
adding the new votes of recently naturalized immigrants.
Our strongest and most significant finding is that an increase in high-skilled immigrants as a share of the
local population is associated with a strong and significant decrease in the vote share for the Republican
Party. To the contrary, an increase in the low-skilled immigrant share of the population is associated with
a strong and significant increase in Republican votes. These effects are common to presidential, House and
Senate elections. Combining the two effects, the net impact of the increased immigrant share on the average
U.S. county was negative for the Republican Party between 1990 and 2010. This was because immigration
in this period was, on average, college-biased. In addition, we find evidence suggesting that the main effect
of immigrants on Republican votes comes from the indirect impact on preferences of existing voters.
Compared to the previous findings from European countries, the evidence presented in this paper is not
inconsistent. Immigrants to Europe have been, on average, less skilled than immigrants to the United States,
and the local labor force in Europe is also less skilled (lower share of college-educated) than in the United
States. Our analysis shows that the local economic conditions of a region, together with the skill level of
immigrants, affect citizens' perceived impact of immigration and their vote response. Specifically, areas
with low education levels and low urbanization may be more ready to embrace nationalistic views in
response to low-skilled immigrants. This seems as true in the U.S. as in Europe.
1       Introduction
Political leaders’ positions on the issue of immigration can be an important determinant
of their electoral success or failure. Immigration took center stage in the 2016 U.S.
presidential elections and its aftermath, as now-President Donald Trump took strong
stands on illegal immigration, the construction of a border wall, refugees from Syria,
and “sanctuary cities”. The “Brexit” vote in the United Kingdom and recent political
elections in Germany (2017) and Italy (2018) have highlighted the controversial political
role of immigration and the electoral success of strong anti-immigration stands. That
immigration has an effect on political outcomes has been pointed out in the academic
literature (see, for example, Ortega (2005) and other works discussed in Section 2).
Yet, to our knowledge, no empirical study has looked at the direct connection between
election outcomes and immigration in the United States.1 We tackle this question by
analyzing the link between immigration and the vote share received by the Republican
Party, across U.S. counties and over time, in the 20-year election cycle between 1990
and 2010.
    Three aspects of this paper are novel. First, we combine economic and demographic
data from the U.S. Census and American Community Survey with data on electoral
outcomes, for all types of elections, from the National Library of Congress at the U.S.
county level. We exploit the large variation in immigration across U.S. counties and
time to identify the correlation between immigration and votes to the Republican Party.
Second, we focus on the distinction between high-skilled (college-educated) and low-
skilled (non-college-educated) immigrants and exploit their differential variation, driven
by past networks and differences in skills across countries of origin to separately iden-
tify a causal effect of each group. These two types of immigrants affect the economy
and labor markets differently (see, for instance, Ottaviano and Peri (2012) and Card
(2009)) and, it turns out, they have a very different impact on the vote of U.S. citizens.
Third, we allow for heterogeneous effects of high- and low-skilled immigrants on voting
outcomes depending on the economic and demographic characteristics of the receiving
county. In analyzing these heterogeneous effects we shed light on the possible mecha-
nisms through which immigration may have impacted the vote share of the Republican
Party.
    The substantial inflow of immigrants to the United States during the last 30 years
has significantly shaped the U.S. economy and society. Immigrants affect native work-
ers’ opportunities in the labor market, their productivity, and their specialization (see,
for example, the book by Borjas (2014) and the recent review by Peri (2016)). Immi-
grants can also have an impact on other aspects of the host country’s economy (for
example through fiscal effects, innovation and consumption), as well as on its culture,
    1
    One partial exception (that we know of) is a recent paper by Baerg et al. (2014), which estimates a
negative impact of the share of unauthorized workers on the proportion of votes going to the Democrats,
focusing only on the U.S. state of Georgia. As we document below, there are several papers analyzing
the impact of immigrants on voting in European countries.

                                                  2
social norms, and sense of security.2 In addition, immigration can affect political out-
comes. In this paper we analyze the latter outcomes but, in doing so, we also need to
take into account the impact of immigration through the other channels. Indeed, we
assume that, through their votes, U.S. citizens respond to the perceived economic and
psychological costs and benefits – through the labor-market, fiscal and non-economic
mechanisms – of having more immigrants in their county. We posit that their proba-
bility of voting for the Republican Party goes up if the perceived cost of an increase
in immigrants (high-skilled or low-skilled) is larger than the perceived benefit. In this
simple framework we associate the Republican Party with more restrictive immigration
policies, which it usually championed in the 20 years we consider.3 Immigration may
also affect the outcome of elections by extending the pool of voters, i.e. directly, by
adding the new votes of newly naturalized immigrants. However, we find evidence sug-
gesting that the main effect of immigrants on Republican votes comes from the indirect
impact on preferences of existing voters.4
Our strongest and most significant finding is that an increase in high-skilled im-
migrants as a share of the local population is associated with a strong and significant
decrease in the vote share for the Republican Party. To the contrary, an increase in the
low-skilled immigrant share of the population is associated with a strong and signifi-
cant increase in Republican votes. These effects are common to presidential, House and
Senate elections. Combining the two effects, the net impact of the increased immigrant
share on the average U.S. county was negative for the Republican Party between 1990
and 2010. This was because immigration in this period was on average college-biased.5
Our results are robust to instrumenting the two types of immigration with shift-share
instrumental variables (IV) based on the historical (1980) location of immigrants by
origin, across U.S. counties, augmented with the skill-specific inflows of immigrants in
the 1990-2010 period. Including a rich set of dummy variables and several controls at
the local level (county and commuting zone) to address lingering concerns about omit-
ted variables does not change the estimates. Moreover, testing whether past electoral
outcomes affected the inflow of high- or low-skilled workers shows no evidence of such
reverse causation.
Those described above are average effects across U.S. counties. The perceived costs
and benefits of immigrants, however, should differ according to the local characteristics
of the county, and the heterogeneous effects across counties should depend on local
2
For example, Giuliano (2007) and Alesina and Giuliano (2011) show how immigrants affect the
transmission of social norms. Butcher and Piehl (1998), Chalfin (2015) and Spenkuch (2013) analyze
the effect of immigration on crime rates in U.S. cities.
3
Empirical evidence by Facchini and Steinhardt (2011) and Conconi et al. (2012) suggests that
Republican legislators are less likely to vote for pro-immigration policies compared with Democratic
ones.
4
Note that existing voters are those who are already citizens, i.e. natives (U.S.-born), who represent
the large majority of voters in most electoral districts, and naturalized immigrants who can vote as
well.
5
In addition, some specifications suggest that the negative Republican vote response to high-skilled
immigrants was stronger than the positive Republican vote response to low-skilled immigrants.
3labor-market characteristics, on the extent of local fiscal redistribution and on non-
economic characteristics of citizens, consistent with these perceptions. This is indeed
what we find. The estimates show that the pro-Republican effect of low-skilled im-
migrants was particularly strong in counties where the share of unskilled natives was
higher, where economic activity was less dense, and where the county was prevalently
non-urban. These findings are consistent with the fact that low-skilled natives and those
living in less dynamic and more rural economies are more likely to feel in competition
with low-skilled immigrants. At the same time, we find evidence of a pro-Democrat
shift in response to high-skilled immigrants in counties where the share of low-skilled
natives was large, but the impact was still significant and pro-Democrat in counties
with a large share of high-skilled natives. These findings are consistent with an overall
perceived positive effect of high-skilled immigrants on citizens, which is stronger where
citizens are unskilled. Overall, these effects are likely to be driven by a combination
of labor-market effects based on relationships of complementarity and substitutability
and, in the case of high-skilled immigration, positive externalities (for example, through
innovation) and positive fiscal effects (through greater tax revenues). This is consistent
with empirical evidence that fiscal transfers from highly educated immigrants to natives
are positive (see Smith and Edmonston (1997)) and that high-skilled workers benefit
the local economy and wages (see Peri et al. (2015)).
By providing systematic and robust evidence on the relationship between U.S. immi-
gration and voting outcomes, we are also able to shed light on “conventional wisdom” on
the topic and on puzzles in the literature. Anecdotal evidence suggests, and we confirm
in our data, that on average immigration in U.S. counties reduces the Republican vote
share. Political scientists and analysts seem to read this evidence as driven by a “pro-
Democratic Party” direct political effect – i.e. the idea that naturalized immigrants
vote predominantly for the Democratic party, which has a pro-immigrant platform –
and by the fact that this effect dominates whatever indirect effect immigration has on
the way existing voters vote.6 At first sight, this interpretation may seem consistent
with the empirical evidence: an increase in the share of citizen (voting) migrants re-
duces the Republican vote share, while an increase in the share of non-citizen migrants
has no effect on average (see Mayda et al. (2016)). However, a closer look suggests
that the main impact of immigration on voting outcomes comes from the skill level
of immigrants – which affects the voting behavior of existing voters – and not from
whether or how naturalized immigrants vote. We discuss this point further in the next
section.
Not only is systematic evidence on the link between immigration and election out-
comes scarce in the case of the United States, but the little evidence that does exist is
puzzling in light of the results found for other countries. For example, several papers on
continental European countries find that immigrants increased the electoral vote share
of right-wing, anti-immigration parties (see Barone et al. (2016) and Halla et al. (2017)).
6
For example, in a 2014 background paper for the Center for Immigration Studies (CIS), Gimpel
(2014) states: “... the enormous flow of legal immigrants to the country has remade and continues to
remake the nation’s electorate in favor of the Democratic Party.”
4What explains the opposite results across the two sides of the Atlantic? Why is the
average political impact of immigration (on conservative parties’ votes) positive in the
case of European countries and negative in the case of the United States? Our analysis
shows that the two sets of results are not inconsistent with each other. Immigrants
to Europe have been, on average, less skilled than immigrants to the United States,
and the local labor force in Europe is also less skilled (lower share of college-educated)
than in the United States. Our analysis shows that the local economic conditions of
a region, together with the skill level of immigrants, affect citizens’ perceived impact
of immigration and their vote response. Specifically, areas with low education levels
and low urbanization may be more ready to embrace nationalistic views in response
to low-skilled immigrants. This seems as true in the U.S. as in Europe. It is also in
line with the results of the 2016 “Brexit” referendum in which, following the message of
right-wing and anti-immigration parties, most non-urban areas outside of London voted
for the United Kingdom to leave the European Union, while the urban, high-skilled,
and densely populated region of London voted to stay within the European Union.
This suggests that the large recent inflow of immigrants in the United Kingdom had a
different impact in the rural low-skilled areas of England than in the urban high-skilled
metropolitan London region.
After estimating the impact of increased immigration on the Republican share of
votes, we use these estimates and the recent growth in immigrant populations to see
how much of the recent shift of votes toward the Republican Party (in the 2012 and
2016 elections) can be predicted using our empirical model with heterogeneous effects.
We find that about 22% of the variation in the growth of votes for the Republican party
across U.S. counties can be explained by the estimated marginal effect of immigration
in the specification that allows for different skill groups and heterogeneous effects.
The rest of the paper is organized as follows. Section 2 frames our paper within
the existing literature. In Section 3 we lay out a simple empirical framework that
characterizes the effect of immigrants and motivates the estimating equation. We then
describe the data and how we construct the key variables in Section 4. In Section 5 we
discuss identification, followed by the main empirical results in Section 6. In Section
7, we consider potential channels and investigate heterogeneity of the effects across
counties. In Section 8 we perform exercises to predict changes in the Republican vote
share as a function of increases of immigration. Section 9 concludes.
2 Related Literature
Our paper is related to both theoretical and empirical contributions in the literature
that analyze the effect of immigration on voting behavior. A few papers examine the
voting behavior with respect to immigration policies and show that it is a function of
the skill composition of immigrants and natives. The seminal theoretical paper in this
literature is Benhabib (1996), which derives the skill composition requirements that
would be imposed on potential immigrants, under majority voting, assuming that the
5only effect of migration is realized through competition/complementarity in the labor
market. Ortega (2005) extends such a model and analyzes the trade-off arising in a
dynamic version in which immigrants (or their offspring) gain the right to vote and
thus affect the political balance of the destination country, with a lag. The arrival of
immigrants, whose skill composition depends on the existing immigration policy, alters
the skilled-to-unskilled labor ratio of the workforce in the destination country. This, in
turn, affects the current-period skill premium, as well as the skill composition of next
period’s electorate, hence the political balance and migration policies in the future. On
the one hand, skilled (unskilled) natives prefer an immigration policy that admits the
complementary unskilled (skilled) immigrants to their country because of their wage
effects. On the other hand, the arrival of unskilled (skilled) immigrants potentially shifts
the political equilibrium by increasing the number of unskilled (skilled) voters in the
next period. These two opposite effects could produce a cycle equilibrium in which the
political majority switches from one group to the other. Razin et al. (2011) focus instead
on the joint decision of voters on immigration and redistribution policies, respectively.
This paper shows that, in terms of immigration and redistribution, a democratic country
will produce policies that are consistent with each other so that, when immigration is
more open, natives restrict redistribution for fear of net transfers to immigrants, while
when immigration is more restricted, natives are willing to allow more redistribution.
The theoretical model derives predictions of how natives of different skills prefer more
or fewer immigrants as a function of the amount of redistribution provided by the
county. Finally, a related line of research investigates empirically how U.S. politicians
vote on topics related to immigration policies, as a function of the characteristics of
their districts. The main papers in this literature are Conconi et al. (2012) and Facchini
and Steinhardt (2011).
While our paper is related to this literature in that it analyzes the connection be-
tween immigration and voting, we take a broader view as we analyze how immigration
affects the vote of citizens in elections, i.e. without focusing on a specific policy. Nev-
ertheless, our explicit consideration of the skill composition of immigrants and natives
is reminiscent of the central role that skill plays in Benhabib (1996), Ortega (2005),
Razin et al. (2011), Conconi et al. (2012) and Facchini and Steinhardt (2011).
Another line of inquiry provides indirect evidence for the effect of immigrants on
citizens’ voting behavior by analyzing what determines the individual preferences of
natives about immigration. Scheve and Slaughter (2001) explore the drivers of attitudes
towards immigration in the United States using the 1992 NES survey. They find that
skilled respondents are significantly less likely to be anti-immigration compared with
unskilled ones. Hence, voters’ perceptions appear to be consistent with the predictions
of a standard labor-market model given that, in the period analyzed by this paper, U.S.
immigrants were on average less skilled than natives. Hanson et al. (2007) extend the
previous analysis by accounting for the impact of public finance considerations on U.S.
immigration attitudes. This paper shows that the negative impact of individual skill
on anti-immigration preferences is weaker in counties characterized by high exposure to
fiscal pressures commonly associated with certain types of immigration. Other papers
6in the literature, such as Mayda (2006), Facchini and Mayda (2009) and O’Rourke and
Sinnott (2006), analyze the labor market and welfare channels as determinants of public
opinion about immigration across countries. Finally, Card et al. (2012) show that, while
the perception of economic gains from immigrants varies by skill level across natives,
it is the perception of the impact of immigrants on local culture and amenities that
drives their policy preference. Our paper is clearly related to these studies, as voting
is an expression of the opinions expressed in these surveys. However, our focus is more
broadly on general elections outcomes. This is new and more relevant to assess the
impact of immigration on political equilibria.
More directly related to our study are some recent papers that analyze how the inflow
of immigrants affects the electoral success of right-wing parties in Europe. In particular,
Barone et al. (2016) investigate the effect of immigration on political outcomes in Italy
for the 2001, 2006 and 2008 national elections. They find that inflows of immigrants
to a municipality increased the share of votes going to a center-right party that was
more conservative on immigration issues than the center-left one. Similarly, Halla et al.
(2017) estimate the impact of immigrant inflows in Austria on the share of votes for a
far-right-wing party (the Freedom Party of Austria). They find evidence of a positive
and significant effect at the neighborhood level. Both papers use shift-share instruments
à la Card (2001) to isolate supply-driven changes in immigrants and track their effects.
Finally, Otto and Steinhardt (2014) estimate the impact of the share of foreign citizens
on election outcomes using variation over time across districts in the city of Hamburg
between 1987 and 2000. The authors find evidence of a positive correlation between
the population share of immigrants in a district and the share of votes received by
extreme right-wing parties with a clearly anti-immigration stand, as well as evidence
of a negative correlation between the population share of immigrants in a district and
the share of votes received by the Green party, which held a pro-immigration position.
The authors give a causal interpretation of these results based on a fixed-effects OLS
empirical strategy and additional robustness checks, which account for the endogeneity
of the location decision of natives and immigrants. Relative to these papers, our paper
is the first to focus on U.S. elections, using variation across U.S. counties instrumented
with skill-specific shift-share instruments.
Finally, in previous work by the authors on the same topic (Mayda et al. (2016)),
we distinguished between citizen and non-citizen immigrants but we did not account
for the skill level of immigrants themselves. We showed that an increase in citizen (vot-
ing) immigrants as a share of the U.S. population had a homogeneous, negative and
significant effect on the share of Republican votes across counties over time. Differently,
an increase in non-citizen immigrants had an insignificant average effect and significant
heterogeneous effects, shifting votes towards the Republicans in the most rural, low-skill
and high public-spending counties, but towards the Democrats in all the other counties.
In this paper we do not emphasize the distinction between citizen and non-citizen mi-
grants. The reason is that, once we account for the skill level of immigrants themselves
by differentiating between high-skilled and low-skilled, we find that increases in the
share of citizen vs. non-citizen migrants have similar effects. Specifically, whether we
7consider citizen or non-citizen migrants, an inflow of high-skilled immigrants decreases
the share of the Republican vote, while an inflow of low-skilled immigrants increases
it. Our current interpretation of the old results (Mayda et al. (2016)) is that the “pro-
Democratic Party” effect of an increase in the share of citizen migrants is driven by
the fact that these people are, on average, more skilled than the average U.S. citizen.
Non-citizen immigrants are instead more balanced between skilled and unskilled and
hence have no significant impact on the vote.
3 Empirical Model
In this section we present a simple empirical framework that allows us to organize and
discuss the impact of immigration on the Republican share of electoral votes. Our goal
is to focus on this impact by distinguishing between the share of more- and less-educated
immigrants. A change in the share of immigrants, high- or low-skilled, will affect the
electoral preferences of citizens and change the share of votes going to the Republican
Party. Although immigrants could also affect voting outcomes directly, i.e. through the
new votes of recently naturalized immigrants, it turns out that, empirically, the indirect
effect through the preference shift of existing voters is the largest. Hence, we focus on
this indirect effect. Consider rit as the probability of voting Republican for an average
U.S. citizen in county i and year t and expressed by the following general function:
Lit Hit
rit = f i ( , , Xit ) (1)
P opit P opit
where Lit /P opit and Hit /P opit are the low-skilled and high-skilled immigrant shares
of the population in county i and year t and Xit are other socio-economic and demo-
graphic factors affecting the preference of the average citizen for the Republican Party.
By including the superscript i in the function f , we allow the relationship between
citizens’ votes and immigration to be county-specific. Later in the paper we will be
more explicit on how the effect depends on local socio-demographic characteristics. Ex-
pression (1) is a “behavioral” representation of the link between citizens’ votes and
the inflow of immigrants. The only structure that this representation imposes on the
relationship is that there may be an effect of high- and low-skilled immigrants on the
perception of citizens and it may affect their vote. One can think that a vote for the
Republican Party is a vote for less immigration and/or less redistribution. If low-skilled
immigrants are perceived to be “costly” by citizens – either because they change local
amenities or because they cause a labor market or fiscal drag on citizens – then such a
mechanism would imply a larger probability of voting for the Republican Party when
the number of low-skilled immigrants increases.
Next we consider the total differential of expression (1) given a change in the size
of each group of immigrants (low-skilled and high-skilled), assuming that the native
population and the other variables do not change in county i. We obtain the following
expression:
8∆Lit ∆Hit
∆rit = fNi AT,1 ∗ + fNi AT,2 ∗ (2)
P opit P opit
The term ∆ represents a change of the variable between time t and t + 1. In
expression (2) the term f1i is the partial derivative of the function f with respect to
the share of low-skilled immigrants in the local population and it captures the effect of
low-skilled immigrants on the Republican voting share. On the other hand, f2i is the
derivative with respect to the share of high-skilled immigrants in the local population
and it captures the effect of high-skilled immigrants on the Republican voting share.
Both are taken at the initial value t. The superscript i implies that this effect can be
heterogeneous across counties, depending on who the representative (median) voter is
in each county.
If we ignore the superscript i, equation (2) can be the basis to estimate the average
(across counties) electoral effect of changes in the number of immigrants. We assume
that slowly changing factors affecting the share of Republican votes in a county can be
captured by a set of linear fixed effects (si ), and that national trends can be controlled
for with year- and election-type fixed effects (qt ). A set of economic and demographic
variables for the county, Xit , will absorb some of the remaining important correlates.
We obtain the following equation that captures the effect of a change in low- and high-
skilled immigrants assuming a homogeneous marginal effect across counties:
Lit Hit
rit = si + qt + βL + βH + βx Xit + εit (3)
P opit P opit
Expression (3) is the first specification we bring to the data. It provides a simplified
representation of the link between immigration and voting outcomes.
Note that the perception of costs and benefits of low- and high-skilled immigrants
is likely to be quite different across counties, depending on the local socio-economic
composition of citizens. For instance, non-urban counties with less-educated citizens
may more strongly perceive competition from low-skilled immigrants, both in the labor
market and in terms of fiscal redistribution. In this case, an increase of these immigrants
will lead to a higher share of votes for the Republican Party, which is more likely to
advocate for restrictive immigration policies. On the other hand, densely populated,
high-skilled counties may perceive low-skilled immigrants as complements in the local
labor market. In this case, an increase of these immigrants may result in smaller pro-
Republican effects or even pro-Democrat shifts. We consider a specific way in which
the heterogeneous effects operate, by assuming that the impact of a change in high- or
low-skilled immigrants is a linear function of economic and demographic characteristics
of county i, which we call ki . For simplicity of interpretation, we standardize these
characteristics to vary between 0 and 1 and measure them at the beginning of the
period, in 1980. This way we can assess how the marginal effect on the vote of citizens
changes with the population characteristics in the county and allow the same inflow of
a given type of immigrants to have a different impact, depending on the county. We use
distinct characteristics of the local population that should be relevant for the operation
9of various channels of effect of immigrants on citizens’ labor market and fiscal interests.
This produces the following estimating equation:
Lit Lit Hit Hit
rit = si + qt + βL + βL1 (ki ) + βH 1
+ βH (ki ) + βx Xit + εit (4)
P opit P opit P opit P opit
In this specification we model the impact of low- and high-skilled immigrants as,
respectively, the constant effects βL and βH in counties with the lowest average value of
the characteristic ki , plus an additional effect equal to, respectively, βL1 (ki ) and βH
1
(ki )
in counties with an increasing value of ki . For instance, if the variable considered is the
share of less-educated natives in the labor force (measured as those with a high-school
diploma or less), then the county with ki = 1 is that with the largest share of low-
educated natives in the population and βL + βL1 is the effect of increasing the share of
low-skilled immigrants by one percent of the population, on the Republican vote share
in that county. To the contrary, βL captures the effect of low-skilled immigrants in the
county with the lowest level of less-educated natives. A similar interpretation holds for
1
the coefficients βH and βH in relation to an increase in high-skilled immigrants. The
term βx Xit controls for the effects of the county’s demographic characteristics on the
vote share of the county. εit captures the remaining idiosyncratic factors affecting the
Republican vote share and has an average of 0.
4 Data Description and Correlations
For each county i and year t we define the following population groups: the overall
population P opit , which is the number of adult (18+) residents of a county, both native
and foreign-born; the low-skilled immigrants Lit , which is the number of adult foreign-
born residents with no high-school degree; and the high-skilled immigrants Hit , which
is the number of adult foreign-born residents with a high-school degree or more.
Data on natives and on low-skilled and high-skilled immigrants for the years 1980,
1990, 2000 and 2010 are obtained combining U.S. Census data from the Census web-
site and 5% U.S. Census data from the IPUMS (Integrated Public Use Micro Samples)
website (Ruggles et al. (2004)). Specifically, the share of low-skilled immigrants is calcu-
Lzt Mit
lated as PLopitit = Mzt P opit
, where (Lzt /Mzt ) is the share of low-skilled adult immigrants
in commuting zone z at time t and (Mit /P opit ) is the immigrant share in the total
adult population of county i at time t. Only the total immigrant population figures
are available at the county level from the Census. For this reason we calculate the
county-level low-skilled and high-skilled shares by applying the ratios constructed at
the commuting-zone level.7
7
To alleviate the concerns of measurement-error bias, we want to stress that, in the construction of
our instruments, we rely on county-level information and not on information at the commuting-zone
level.
10The election data are from the Congressional Quarterly data set and include presi-
dential and congressional (House and Senate) elections from 1990 to the present. Our
main outcome variable is the share of votes going to the candidate affiliated with the
Republican Party:
Republican V otesit
rit = (5)
V otesit
Republican V otesit represents the number of people who voted for the Republican
Party, whereas V otesit is the number of actual votes in county i and year t. Since
elections do not necessarily coincide with the year the Census was taken, we average
the Republican vote share over the elections that coincide with the decennial Census
years and elections two years past the Census, i.e. the elections that took place in
1990/1992, 2000/2002 and 2010/2012 (with the exception of the House elections, for
which we have only data from 1992 onward). We consider 1990, 2000 and 2010 as the
years of analysis and we use the Census 1980 to construct our shift-share instruments,
as we will describe below.
4.1 Descriptive Statistics and Simple Correlations
After matching the election data with the Census data at the county-year-election
type level, the final sample contains 27,738 county-year-election observations across the
three types of elections (House, Senate and presidential), and each of which has 9,246
observations.8 Table 1 contains the summary statistics of the share of Republican
and Democratic votes across each type of election, in the upper part of the table.
Summary statistics for the key explanatory variables and for the other population data,
including the control variables that will be used in the empirical analysis, are reported
in the lower part of the table. The simple average – across all counties, elections and
years (1990, 2000 and 2010) – reported in Table 1 shows that the Republican Party
obtained 53.5% of the county vote and the Democratic party 42.5%. The lower average
percentage of the Democratic vote in Table 1 is an artifact of the simple average,
since Democrats and third-party candidates are over-represented in more urban and
densely populated areas.9 It is more relevant to consider the change in the share of the
vote to the Republican Party that occurred between 1990 and 2010, the period of our
analysis. Figure 1 shows the map of U.S. counties and the range of variation in the
change of intensity of the Republican vote between 1990 and 2010 (measured by the
change in Republican vote share). Darker shades of gray indicate an increase of the
Republican share, while lighter shades and white indicate a decrease in the Republican
share. Three interesting facts emerge from this map. First, non-urban counties in the
South and Mountain states have moved towards a larger share of the Republican vote.
8
Due to data limitations for some control variables (trade and employment), counties in Alaska
and Hawaii are not included. The results presented below are robust when we exclude these control
variables and at the same time include counties in Alaska and Hawaii.
9
The average weighted by voting population is much closer for the two parties.
11This is particularly apparent in Northern Texas, Oklahoma, Louisiana, Arkansas and
Kentucky. Second, urban counties in coastal locations of California, New England,
Florida and near the Great Lakes have moved towards a larger share of the Democratic
vote. Finally, some states have moved in one direction or another more than the rest of
the nation. For instance, New Mexico and Colorado have moved towards the Democrats
while Kansas and Oklahoma have moved towards the Republicans.
The overall share of immigrants in the adult population has also changed signifi-
cantly in the considered period, with very large differences across counties. The map in
Figure 2 represents (darker color indicating greater intensity) changes in immigrants as
a share of the adult population, between 1990 and 2010 in all Continental U.S. coun-
ties. While some traditional immigrant locations such as California, Illinois (mainly
Chicago), Florida and New England continued to attract immigrants and increase their
share in the local population, new destinations emerged as magnets, especially in New
Mexico, Colorado, Kansas, Nevada and Washington State. Also interesting is to con-
sider the maps of the change in low-skilled and high-skilled immigrants, which are
reported in Figure 3, Panels (a) and (b). While the traditional states of immigration
(California, Florida, Texas, Illinois) still had growth of low-skilled immigrants (light
gray color in Panel (a)), they seem to have experienced an even larger inflow of high-
skilled immigrants in the two decades considered (dark gray in Panel (b)). Interestingly,
the border counties with Mexico seem to have experienced a decline in the share of low-
skilled immigrants, likely as a result of enforcement and return migration, especially in
the last 10 years of this period.
Even a cursory glance at the maps in Figures 1 and 2 suggests a negative correla-
tion between the increase in total immigrants as a share of population and the share of
Republican vote. This is suggested by the fact that urban coastal areas, with larger pos-
itive changes in the share of immigrants, also experienced a decrease in the Republican
vote share. To visualize this correlation better, we show in Figure 4 the scatter plots
relating the changes in immigrant shares and changes in the Republican vote weighted
by the voting age population, between 1990 and 2010. The correlation is negative and
significant with a regression slope of -0.92 and a standard error of 0.03. Counties where
immigrants increased by one percent of the adult population experienced, on average,
a decrease of the Republican vote share by 0.92 percentage points.
This aggregate correlation, however, hides two very different components, which are
separated in Panels (a) and (b) of Figure 5. Panel (a) shows the correlation between
changes in the low-skilled immigrant share and changes in the Republican vote share
and panel (b) shows the correlation between changes in the high-skilled immigrant
share and changes in the Republican vote share across countries. While the first is
positive and significant (with a coefficient of 0.29 and a standard error of 0.10), the
second is negative and significant (with a coefficient of -1.3 with standard error of
0.03). It appears that the inflows of more- or less-educated immigrants are correlated
with very different shifts. If most of the effects are driven by changes in citizens’
voting preferences, and part of the correlation is causal, these scatter plots suggest that
citizens may react to unskilled immigrants by moving to the party that promises less
12immigration (and less redistribution). At the same time, the vote response to highly
educated immigrant inflows more than offsets this response, pushing them toward voting
Democrat, the party that stands for more immigration and more redistribution. In net,
the correlation of immigration and the Republican vote in the average U.S. county is
negative, because in the 1990-2010 period the inflow of high-skilled immigrants has been
larger than the inflow of less-skilled immigrants (see averages in Table 1). Some of our
results below also suggest that the pro-Democrat response to high-skilled immigrants
is stronger than the pro-Republican response to low-skilled immigrants.
Finally, Table 1 also shows the summary statistics of the control variables included
in the main empirical specifications. In choosing economic and demographic controls,
we follow the existing literature on the determinants of voting behavior in the United
States, in particular Della Vigna and Kaplan (2007), and include the share of low-
skilled natives in the adult population, the share of African-Americans and Hispanics,
the unemployment rate, the share of the population living in urban areas, as well as the
share of males and the average income per person (see lower panel of Table 1). As these
detailed demographic data are not available at the county level on the Census website,
we use the 5 per cent Census sample from the IPUMS website to compute these shares
at the commuting zone level and we apply those to all counties in the commuting zone.
In addition to the variables described above, we also control for the possible trade
impact in the county – as trade may have an impact on votes (Che et al. (2016))
and may affect wages and employment (Autor et al. (2013)). More specifically, we
include the national industry-specific growth rate of manufacturing imports between
1990 and year t, weighted by the commuting zone’s employment composition across
sectors in manufacturing in the year 1990 (as in Autor et al. (2013)). We also control
for a “Bartik” indicator that proxies for sector-specific labor demand shocks in a given
commuting zone. We constructed it by taking a weighted average of the national
industry-specific growth rate of employment between 1990 and year t, using as weights
the employment shares across industries of the commuting zone in the year 1990.10 This
is an indicator of how technological forces have affected productivity and labor demand
in the long run.
5 Identification
The estimation of equation (3) with least squares (LS) risks producing biased estimates
if there are unobservable local characteristics affecting the vote of citizens (captured in
the term εit ) that are correlated with the change in high- and low-skilled immigrants as a
share of the population. If immigrants are attracted to locations where the attitudes of
citizens are becoming more favorable to immigration, and these attitudes are correlated
with the change in the local vote, then a spurious correlation between the inflow of
new immigrants and the change in Republican votes may ensue. Moreover, economic
and demographic changes that attract new immigrants and push local votes towards a
10
This follows Bartik (1992).
13specific party will also induce bias. In order to avoid or at least reduce these sources
of omitted variable bias, we use two instrumental variables to capture the variation in
more- and less-educated immigrants that should have little correlation with other local
economic or political determinants of the vote. They are an extension of the shift-share
instruments typically used in the migration literature.
5.1 Instrumental Variables
Our IV approach consists of identifying sources of variation for the change in more-
and less-educated immigrants, ∆Hit and ∆Lit , in county i between decade t − 10 and
t, which are uncorrelated with local political and economic factors that affect the local
vote. Since we are considering two distinct populations of immigrants, the IV variation
of the groups needs to be sufficiently differentiated to identify two separate effects.
To do so, we leverage the different timing and sizes of the inflow of high-skilled and
low-skilled immigrants across national groups, interacted with the 1980 distribution
of immigrants by country of origin across U.S. counties. Our two instruments build
on the shift-share methodology, widely used in this literature (since Altonji and Card
(1991) and Card (2001)), which we adjust in order to make it skill-specific. First, let us
define the terms shU S,i,1980 and shc,i,1980 as the U.S.-born adults and adult immigrants
from country c, respectively, living in county i in 1980, as a share of their total adult
population (age 18 and older) in the U.S. in 1980,11 namely:
Ni,1980
shU S,i,1980 = P (6)
i Ni,1980
and
Mc,i,1980
shc,i,1980 = P (7)
i Mc,i,1980
The predicted size of the population of county i is given by the sum of the predicted
number of immigrants and the predicted number of natives in county i (P[ opit = Mdit +
Nit ). Each term in the latter sum uses imputed population changes, which are obtained
c
by multiplying aggregate changes of the population (of natives or of immigrants by
country of origin) by the 1980 shares of that population across counties. In particular,
the imputed native (N ) and immigrant (M ) population changes in county i are given
by the following two equations:
X
4Mcit = shc,i,80 (Mct − Mct−10 ) and 4N bit = shU S,i,80 (Nt − Nt−10 )
c
and these changes are then added to the initial distribution in 1980 to obtain the
11
We aggregate the countries of origin of immigrants into 14 origin-country groups, (Mexico, Canada,
Rest of Americas, Western Europe, Eastern Europe, China, Japan, Korea, Philippines, India, Rest of
Asia, Africa, Oceania, Others), thus the index c in shc,i,1980 varies across these groups.
14imputed 1990 immigrant and native population in county i:
ci1990 = Mi1980 + 4M
M ci1990 and bi1990 = Ni1980 + 4N
N bi1990
We iterate the process to obtain the imputed populations for the years after 1990:
M cit−10 + 4M
cit = M cit and N bit−10 + 4N
bit = N bit
The imputed total population is then simply the sum of the two (P[ opit = M
d it + Nit ).
c
Next, we calculate the imputed number of skilled and unskilled immigrants, using
the same 1980 share across counties by country of origin, shc,i,1980 , and distributing the
total number of high-skilled and low-skilled foreign-born immigrants from each country
of origin c at time t in the U.S. (Hct and Lct , respectively) proportionally to those
shares.12 Thus, the predicted number of skilled immigrants in county i is given by
X
Hb it = shc,i,80 Hct
c
and similarly, the imputed number of skilled immigrants is given by:
X
L
bit = shc,i,80 Lct
c
The instrument for the share of skilled immigrants in county i is then simply the pre-
dicted number of high-skilled immigrants divided by the predicted population H opit ,
b it /P[
and for the low-skilled immigrants it is L bit /P[
opit . We will use the instruments to
predict the share of skilled and unskilled immigrants in regression (3) and (4). We
note that the ability of the two instruments to proxy high- and low-skilled immigrants
depends only on the difference in skill intensity of immigrant groups, interacted with
their 1980 location by country of origin. Counties with similar shares of immigrants as
of 1980, but from different origins, generated very different imputed changes of high-
and low-skilled, due to the interaction of those shares with the educational composition
of immigrants by nationality.
5.2 Discussion
The shift-share instrument has been widely used in immigration economics and it is
convenient.13 It usually has reasonable power, because networks of existing immigrants
attract new immigrants from the same country, and its exclusion restriction is plausi-
ble. It is based on assuming that the distribution of immigrants by country of origin,
12
One advantage of this method is to avoid aggregation issues due to the use of commuting zone
level data for the skill level.
13
See a review of its use and refinements in Lewis and Peri (2015).
1510 years before the period of analysis, in 1980, is not correlated with economic and
demographic changes for the native population, after 1990, other than via their impact
on current immigration. While persistent local conditions that attract immigrants and
affect political votes can threaten the identification, one can test the plausibility of the
assumptions and reduce the omitted variable concerns. We will discuss some of them
here.
The first threat to identifying a causal connection from immigration to votes consists
of the possible reverse causation combined with persistence and correlation over time.
If places that are more likely to vote for the Republican Party also attract/push away
low-skilled (or high-skilled) immigrants and correlation over time is strong, this channel
can bias the estimates. One falsification exercise we perform to address this issue is to
regress the change in the subsequent share of low-skilled and high-skilled immigrants,
respectively, on past vote share, to show that there is no significant correlation.
The second threat is that some counties have persistent economic, cultural and insti-
tutional features appealing to immigrants and also affecting their political preferences.
Location, geography and historical heritage of a county could be such factors. The
introduction of county fixed effects and of economic and demographic controls at the
commuting zone level contributes to reducing these concerns, but may not eliminate all
of them.
Finally, as we estimate a reduced form and not a structural relation, it is impor-
tant to enrich our understanding of the average effect with the potential interaction
of immigrants with different local features. The fact that we allow the effects to be
heterogeneous across counties, depending on their initial characteristics, improves our
identification as well, in that it shows which local characteristics strengthen or weaken
a certain effect. This lends support to different hypotheses and channels, and may rule
out others. In addition, when the estimated effects are heterogeneous, it is much harder
to formulate an alternative interpretation of the results based on endogeneity. Hence,
we will implement the two-stage least squares (2SLS) estimates, and we will also try to
produce OLS estimates that reduce the worries of omitted variable bias. First we will
analyze some basic OLS regressions that allow us to choose a parsimonious specification
and focus on the most relevant partial correlations.
6 OLS and 2SLS Estimates
6.1 Basic OLS Estimates
Table 2, Panel (b) shows the estimates of coefficients βL and βH from equation 3 when
we use LS and include time effects, county effects and the commuting-zone specific
controls as described above (i.e. the share of low-skilled natives, the share of men,
the share of African-Americans, the share of Hispanics, the share of unemployed, the
average income per person in the adult population as well as the Bartik employment
shifter and the Import competition shock). These variables capture a wide range of
16economic and demographic characteristics of the commuting zone that may affect the
vote percentages, measured at the beginning of the decade. Specifically, the Bartik
shifter captures the sector-driven employment growth at the local level, and the Autor
et al. (2013) “trade shock” captures the impact of import competition from China and
other countries on the local manufacturing sectors. In Panel (a) of Table 2 we show,
for comparison, the coefficient estimates for the specifications that use the aggregate
share of immigrants as an explanatory variable.
These specifications are reminiscent of the reduced-form regressions that are often
used to analyze the local impact of immigrants on labor market and other economic
outcomes (e.g. Card (2001), Basso and Peri (2016)). They provide prima facie evidence
of the correlation between the increase in foreign-born residents in a county, and then
separately of more- and less-educated foreign-born residents, and the change in the
share of Republican votes.
In specification (1) we include all types of elections pooled, while in specifications
(2)-(4) we include separately presidential, Senate and House elections. The standard
errors are clustered at the commuting zone level to account for potential correlation of
errors within each commuting zone – given that a commuting zone encompasses a labor
market.
Three clear facts emerge from Table 2. First, there is a significant and robust positive
correlation between the share of low-skilled immigrants and the Republican vote share
across counties, when pooling all elections as well as for each election type separately.
Second, there is a similarly robust and significant negative correlation between the share
of high-skilled immigrants and the vote share of the Republican Party in the pooled
election specification and in each election type. Third, although the coefficients are of
similar magnitude and opposite sign, when combining the two effects, in Panel (a), we
are left with a negative and significant coefficient. The reason is the larger increase
in high-skilled immigrants relative to low-skilled immigrants as a percentage of the
population in the 1990-2010 period. Counties in which less-skilled immigrants in the
adult population increased by 1 percentage point are also those where the share of the
Republican Party increased on average by 0.87 points. Conversely, a similar increase
in high-skilled immigrants reduced the Republican share by 0.75 percent.
These correlations may be driven by many different factors and channels. First,
it may be that, rather than the level of skills of immigrants, which is certainly the
most relevant variable in determining their economic and labor market effect, it is the
origin of the immigrants that produces the voting response. Immigrants from poor
countries, no matter what their skill level is, may be perceived as being different and
imposing a cost, and hence the level of skill may just be proxying for immigrants coming
from rich and poor countries. In Table 3, column 2, we show the correlation after we
have split immigrants in four groups to estimate a separate coefficient on low-skilled
from poor countries, low-skilled from rich countries, high-skilled from poor countries
and high-skilled from rich countries. The set of rich countries are those in the OECD.
Interestingly, the coefficient on high-skilled immigrants is negative and significant (both
for rich and poor countries of origin) and the coefficient on low-skilled immigrants is
17You can also read