Mega-COV: A Billion-Scale Dataset of 100+ Languages for COVID-19
←
→
Page content transcription
If your browser does not render page correctly, please read the page content below
Mega-COV: A Billion-Scale Dataset of 100+ Languages for COVID-19
        Muhammad Abdul-Mageed, AbdelRahim Elmadany, El Moatez Billah Nagoudi,
                       Dinesh Pabbi, Kunal Verma, Rannie Lin
                           Natural Language Processing Lab
                            University of British Columbia
                 {muhammad.mageed,a.elmadany,moatez.nagoudi}@ubc.ca,
                  {dinesh09,vkunal96}@ece.ubc.ca, krieyalam@gmail.com

                        Abstract

      We describe Mega-COV, a billion-scale
      dataset from Twitter for studying COVID-19.
      The dataset is diverse (covers 268 countries),
      longitudinal (goes as back as 2007), multilin-
      gual (comes in 100+ languages), and has a
      significant number of location-tagged tweets
      (∼ 169M tweets). We release tweet IDs
      from the dataset. We also develop two pow-
      erful models, one for identifying whether or              Figure 1: Global coverage of Mega-COV based on our
      not a tweet is related to the pandemic (best              geo-located data. Each dot is a city. Contiguous cities
      F1 =97%) and another for detecting misinfor-              of the same color belong to the same country.
      mation about COVID-19 (best F1 =92%). A                      As a result of the pandemic, most countries
      human annotation study reveals the utility of
                                                                around the world went into lockdown and the pub-
      our models on a subset of Mega-COV. Our
      data and models can be useful for studying                lic health emergency has restricted physical aspects
      a wide host of phenomena related to the pan-              of human communication considerably. As hun-
      demic. Mega-COV and our models are pub-                   dreds of millions of people spend more time shel-
      licly available.                                          tering in place, communication over social media
                                                                became more important than ever. In particular, the
 1    Introduction                                              content of social media communication promises
                                                                to capture significant details about the lives of tens
 The seeds of the coronavirus disease 2019 (COVID-              of millions of people. Mega-Cov is intended as a
 19) pandemic are reported to have started as a local           repository of such a content.
 outbreak in Wuhan (Hubei, China) in December,
 2019, but soon spread around the world (WHO,                      There are several ongoing efforts to collect Twit-
 2020). As of January 24, 2021, the number of con-              ter data, and our goal is to complement these. More
 firmed cases around the world exceeded 99.14M                  specifically, we designed our methods to harvest a
 and the number of confirmed deaths exceeded                    dataset that is unique in multiple ways, as follows:
 2.13M.1 In response to this ongoing public health              Massive Scale: Very large datasets lend them-
 emergency, researchers are mobilizing to track the             selves to analyses that are not possible with smaller
 pandemic and study its impact on all types of life in          data. Given the global nature of COVID-19, we
 the planet. Clearly, the different ways the pandemic           realize that a large-scale dataset will be most useful
 has its footprint on human life is a question that             as the scale allows for slicing and dicing the data
 will be studied for years to come. Enabling schol-             across different times, communities, languages,
 arship on the topic by providing relevant data is an           and regions that are not possible otherwise. For this
 important endeavor. Toward this goal, we collect               reason, we dedicated significant resources to har-
 and release Mega-Cov, a billion-scale multilin-                vesting and preparing the dataset. Mega-COV has
 gual Twitter dataset with geo-location information.            solid international coverage and brings data from
                                                                1M users from 268 countries (see Section 3.1).
    1
      Source: The Center for Systems Science and Engi-          Overall, our dataset has ∼ 1.5B tweets (Section 2).
 neering, Johns Hopkins University. Dashboard: https:
 //www.arcgis.com/apps/opsdashboard/index.                      This is one order of magnitude larger than #COVID-
 html#/bda7594740fd40299423467b48e9ecf6.                        19 (Chen et al., 2020), the largest dataset we know

                                                           3402
Proceedings of the 16th Conference of the European Chapter of the Association for Computational Linguistics, pages 3402–3420
                            April 19 - 23, 2021. ©2021 Association for Computational Linguistics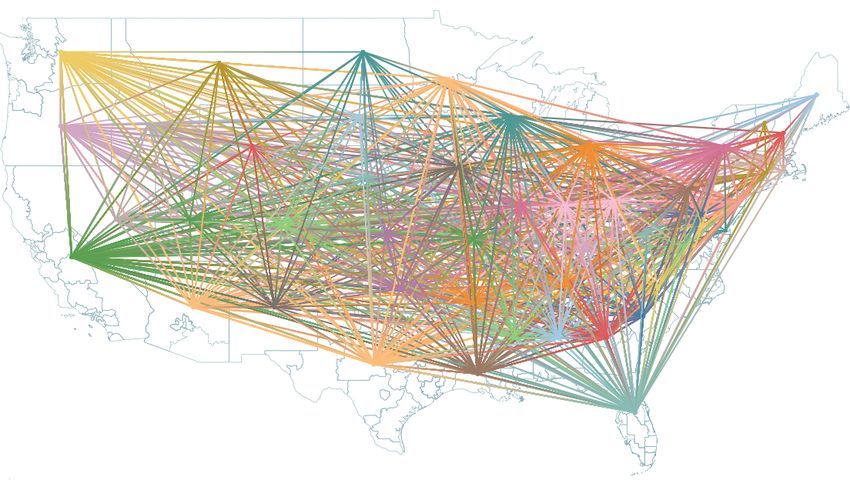
of (∼ 144M tweets as of June 1, 2020).2                          wild. This warrants more generalizable findings
Topic Diversity: We do not restrict our collection               and models.
to tweets carrying certain hashtags. This makes the              A dataset as large as Mega-COV can be hard to
data general enough to involve content and topics                navigate. In particular, an informative description
directly related to COVID-19, regardless of exis-                of the dataset is necessary for navigating it. In
tence of accompanying hashtags. This also allows                 this paper, we provide an explanation of a number
for investigating themes that may not be directly                of global aspects of the dataset, including its ge-
linked to the pandemic but where the pandemic                    ographic, temporal, and linguistic coverage. We
may have some bearings which should be taken                     also provide a high-level content analysis of the
into account when investigating such themes. This                data, and explore user sharing of content from par-
is important because users can, and indeed do, post              ticular web domains with a focus on news media.
about activities impacted by the health crisis with-             In the context of our investigation of Mega-COV,
out using any hashtags. In fact, users may not men-              we make an array of important discoveries. For
tion COVID-19 at all, even though what they are                  example, we strikingly discover that, perhaps for
posting about could be affected by the pandemic                  the first time in Twitter history, users address one
one way or another (e.g., “eating habits”, “shop-                another and retweet more than they post tweets. We
ping behavior”). Section B and Section C in the                  also find a noticeable rise in ranks for news sites
Appendix provide a general overview of issues dis-               (based on how frequent their URLs are shared) dur-
cussed in the dataset.                                           ing 2020 as compared to 2019, with a shift toward
Longitudinal Coverage: We collect multiple data                  global (rather than local) news media. A third find-
points (up to 3,200) from each user, with a goal                 ing is how use of the Twitter platform surged in
to allow for comparisons between the present and                 March, perhaps making it the busiest time in the
the past across the same users, communities, and                 history of the network.
geographical regions (Section 3.2). Again, this is               Furthermore, we develop two groups of effective
desirable since without data from pre-COVID-19                   neural models: (1) COVID-relevance models (for
time it will be challenging to hold any such compar-             detecting whether a tweet is related to COVID-19
isons. For example, some users may have stopped                  or not). (2) COVID-misinformation models (for
posting about “exercising” during the pandemic but               detecting whether a text carries fake information
we cannot definitely identify this without access                or not). In addition to releasing our best models,
to these users’ previous data where they may have                we also apply them to a total of 30M tweets from
been posting about their physical activities.                    Mega-COV and release our tags to accelerate fur-
Language Diversity: Since our collection method                  ther research on the topic.
targets users, rather than hashtag-based content,                   The rest of the paper is organized as follows:
Mega-COV is linguistically diverse. In theory, any               In Section 2, we describe our data collection
language posted to Twitter by a user whose data                  methods. Section 3 is where we investigate ge-
we have collected should be represented. Based on                ographic, linguistic, and temporal dimensions of
Twitter-assigned language codes, we identify a total             our data. We describe our models for detecting
of 65 languages. However, applying two different                 COVID-19 tweets and COVID-misinformation in
language detection tools to the whole dataset, we                Section 4. Section 5 is where we apply our rele-
identify more than 100 languages. (Section 3.3).                 vance and misinformation models to a large sample
No Distribution Shift: Related to the two previ-                 of Mega-COV. Section 6 is about data release and
ous points, but from a machine learning perspec-                 ethics. We provide a literature review in Section 7,
tive, by collecting the data without conditioning on             and conclude in Section 8.
existence of specific (or any) hashtags we avoid in-
troducing distribution bias. In other words, the data            2       Data Collection
can be used to study various phenomena in-the-                   To collect a sufficiently large dataset, we put
   2
    Both our own dataset and that of Chen et al. (2020) are      crawlers using the Twitter streaming API3 on
growing over time. All our statistics in the current paper are   Africa, Asia, Australia, Europe, North America,
based on our collection as of May 15, 2020. As of Octo-
ber 6, 2020, authors of #COVID-19 report 649.9M tweets           and South America starting in early January, 2020.
on their GitHub (https://github.com/echen102/                    This allows us to acquire a diverse set of tweets
COVID-19-TweetIDs), and our own dataset has exceeded
                                                                     3
5B tweets.                                                               API link: https://github.com/tweepy/

                                                            3403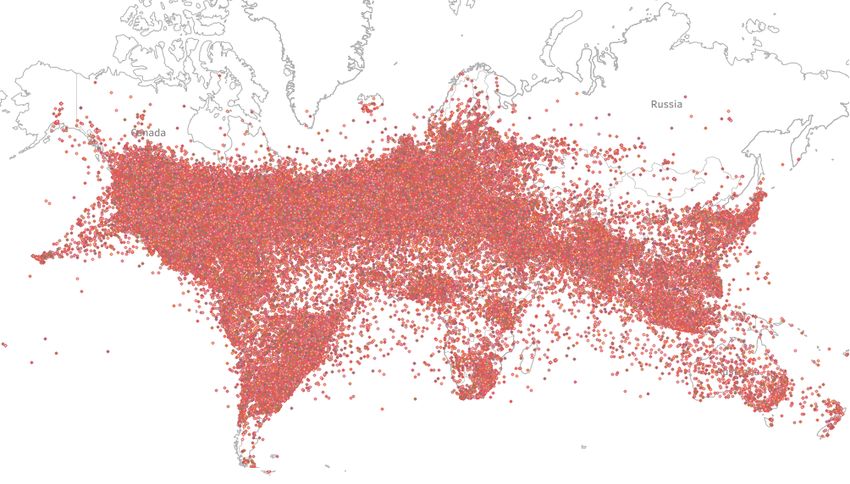
Data        Tweets    Retweets    Replies       All
    2007-2020    612M        507M      369M       1.5B
    2020         122M        174M      129M      425M
    Users          1M        976K      994K        1M

Table 1: Distribution of tweets, retweets, and replies in
Mega-COV (numbers rounded).
from which we can extract a random set of user
IDs whose timelines (up to 3,200 tweets) we then
iteratively crawl every two weeks. This gave us
data from July 30th , 2020 backwards, depending              Figure 2: World map coverage of Mega-COV. Each
on how prolific of a poster a user is (see Table 4a for      dot is a point co-ordinate (longitude and latitude) from
a breakdown.). In this paper, we describe and ana-           which at least one tweet was posted. Clearly, users
lyze the version of Mega-COV collected up to May             tweet while traveling, whether by air or sea.
15, 2020 and use the term Mega-COV to refer it.              tinent). As explained, to allow comparisons over
Mega-COV comprises a total of 1, 023, 972 users              time (including behavioral changes during COVID-
who contribute 1, 487, 328, 805 tweets. For each             19), we include pre-2020 data in Mega-COV. For
tweet, we collect the whole json object. This                the year 2020, Mega-COV has ∼ 66M geo-located
gives us access to various types of information,             tweets from ∼ 670K users and ∼ 3M geo-tagged
such as user location and the language tag (includ-          tweets from ∼ 109K users.5 We note that signif-
ing “undefined”) Twitter assigns to each tweet. We           icant parts from the data could still belong to the
then use the data streaming and processing engine,           different countries but just not geo-located in the
Spark, to merge all user files and run our analy-            original json files retrieved from Twitter. Fig-
ses. To capture a wide range of behaviors, we keep           ure 2 shows actual point co-ordinates of locations
tweets, retweets, and responses (i.e., direct user-to-       from which the data were posted. Figure 3 shows
user interactions) as independent categories. Ta-            the geographical diversity in Mega-COV based on
ble 1 offers a breakdown of the distribution of the          geo-located data. We show the distribution in terms
different types of posts in Mega-COV. Tweet IDs              of the number of cities over the 20 countries from
of the dataset are publicly available at our GitHub4         which we retrieved the highest number of locations
and can be downloaded for research. To the extent            in the dataset, broken by all-time and the year
it is possible, we intend to provide semi-regular            2020. Overall, Mega-COV has data posted from a
updates to the dataset repository.                           total of 167, 202 cities that represent 268 countries.
                                                             Figure A.2 in Appendix A shows the distribution
3     Exploring Mega-COV                                     of data over countries. The top 5 countries in the
                                                             data are the U.S., Canada, Brazil, the U.K., and
3.1    Geographic Diversity
                                                             Japan. As we mention earlier, other top countries
A region from which a tweet is posted can be asso-           in the data across the various continents are shown
ciated with a specific ‘point’ location or a Twitter         in Table 3.
place with a ‘bounding box’ that describes a larger
area such as city, town, or country. We refer to             3.2    Temporal Coverage
tweets in this category as geo-located. A smaller            Our goal is to make it possible to exploit
fraction of tweets are also geo-tagged with longi-           Mega-COV for comparing user social content over
tude and latitude. As Table 2 shows, Mega-COV                time. Since we crawl user timelines, the dataset
has ∼ 187M geo-located tweets from ∼ 740K                    comprises content going back as early as 2007. Fig-
users and ∼ 31M geo-tagged tweets from ∼ 267K                ure 4a shows the distribution of data over the pe-
users. Table 2 also shows the distribution of tweets         riod 2007-2020. Simple frequency of user posting
and users over the top two countries represented in          shows a surge in Twitter use in the period of Jan-
the dataset, the U.S. and Canada (North America),            April 2020 compared to the same months in 2019
and other locations (summed up as one category,              (see Figure A.1 in Appendix A). Indeed, we iden-
but see also Table 3 for countries in the data by con-       tify 40.53% more posting during the first 4 months
  4                                                              5
    Accessible at: https://github.com/UBC-NLP/                     The dataset has ∼ 134K “locations” which we could not
megacov.                                                     resolve to a particular country using only the json information.

                                                          3404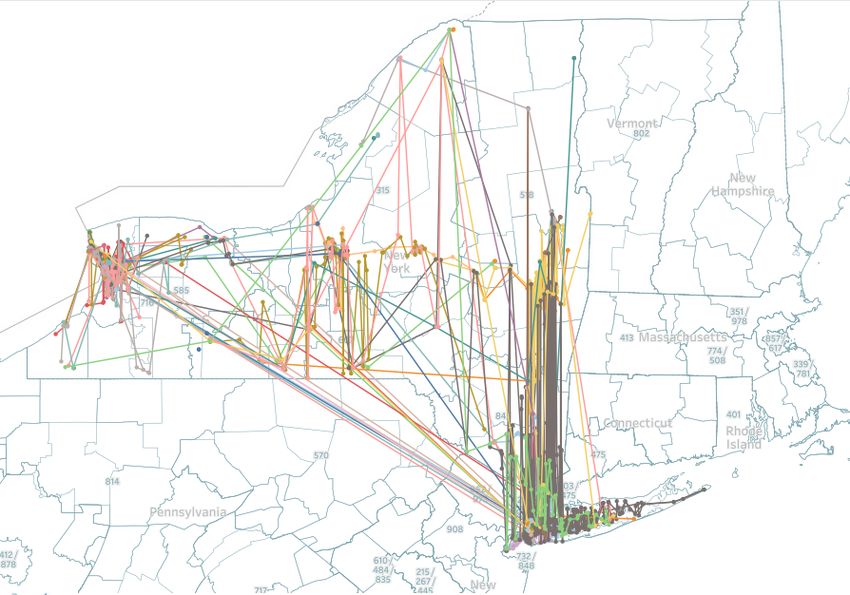
Tweeted From                                               Tweeted From
                  Geolocated                                                               Geotagged
                                        Canada                    U.S.         Other                      Canada             U.S.       Other
 All-Time         186,939,854        16,459,655             70,756,282     99,723,917      31,392,563   3,600,952      11,449,400   16,342,211
 All-Users            739,645           102,388                327,213        463,673         266,916      47,622         117,096      165,860
 2020              65,584,908         3,331,720             24,259,973     37,993,215       2,942,675     246,185       1,187,131    1,509,359
 2020-Users           670,314            61,205                254,067        392,627         109,348      14,525          43,486       62,837

Table 2: Mega-COV geolocated and geotagged users and their tweets from North America vs. Other loca-
tions. See also Table 3 for statistics from top countries by continent.

                                         All                      2020
Continent        Country
                               Geo-Located      Users    Geo-Located   Users       of March, and somewhat continues in April, as
                Nigeria           1,876,879     16,220      1,057,742  14,872
                South Africa      1,503,181      9,751        692,367   6,373
                                                                                   shown in Figure 4b. Figure 4a and Figure 4b also
Africa          Egypt               873,079      8,840        452,738   5,900      show a breakdown of tweets, retweets, and replies.
                Ghana               373,996      3,942        202,470   3,089
                Kenya               373,667      4,480        172,796   3,026      A striking discovery is that, for 2020, users are
                Japan             7,646,901     32,038      2,752,890  23,773
                Indonesia         4,540,286     22,893      1,871,154  18,056      engaged in conversations with one another more
                Spain             4,327,475     43,236      1,431,567  20,902
Asia
                Philippines       4,078,410     15,477      1,636,265  11,011
                                                                                   than tweeting directly to the platform. This may
                India             3,107,917     33,931      1,576,549  27,940      be the first time this pattern exists, perhaps in the
                Saudi Arabia      2,158,584     18,402        833,634  15,087
Australia       Australia         1,179,205     12,090        352,215   5,454      history of the network. At least based on our mas-
                UK              11,714,012      70,787      2,970,848  44,420
                Turkey            5,067,118     32,589      1,463,550  25,477      sive dataset, this conclusion can be made. In addi-
Europe          France            2,030,523     36,017        729,500  12,497
                Italy             1,829,369     27,071        527,648   8,308
                                                                                   tion, for 2020, we also see users retweeting more
                Germany           1,272,339     24,215        385,306   7,412      than tweeting. Based on Mega-COV, this is also
                US              69,515,949     327,213    23,578,430 254,067
North America   Canada          16,066,337     102,388      3,200,804  61,205      happening for the first time.
                Mexico            3,665,791     36,190      1,106,352  17,406
                Brazil          15,879,664      48,339      8,060,537  41,277
                Argentina         3,142,778     14,576      1,298,381  10,901      3.3      Linguistic Diversity
South America   Colombia          1,612,765     10,319        629,426   6,884
                Chile             1,003,459      6,212        378,770   3,674
                Ecuador             447,250      3,435        170,098   2,221
                                                                                   We perform the language analysis based on tweets
                                                                                   (n=∼ 1.5B), including retweets and replies. Twit-
Table 3: Distribution of data over top countries per con-                          ter assigns 65 language ids to ∼ 1.4B tweets, while
tinent in Mega-COV (all data vs. 2020).                                            the rest are tagged as “und” (for “undefined”).
of 2020 compared to the same period in 2019. This                                  Mega-COV has ∼ 104M (∼ 7%) tweets tagged
is expected, both due to physical distancing and a                                 as “und”. We run two language identification
wide range of human activity (e.g., “work”, “shop-                                 tools, langid (Lui and Baldwin, 2012) and Com-
ping”) moving online. More precisely, moving ac-                                   pact Language Detector (Ooms and Sites, 2018)6
tivities online causes users to be on their machines                               langid (Lui and Baldwin, 2012),7 on the whole
for longer times and hence have easier access to so-                               dataset (including tweets tagged “und” by Twit-
cial media. The clear spike in the month of March                                  ter).8 After merging language tags from Twitter and
2020 is striking. It is particularly so given a shifted                            the 2 tools, we acquire a total of 104 labels. This
pattern of use: retweeting and replying (to others)                                makes Mega-COV very linguistically rich. Table 4
are both observably more frequent than tweeting                                    shows the top 20 languages identified by Twitter
itself. This especially takes place during the month                               (left) and the top 20 languages tagged by one of the
                                                                                   two tools, langid (Lui and Baldwin, 2012), after
                                                                                   removing the 65 Twitter languages (right).

                                                                                   4       Models
                                                                                   We develop two groups of models suited for an-
                                                                                   swering important questions related to COVID-
                                                                                   19, including making use of Mega-COV. These
                                                                                   are (1) COVID-relevance, where a classifier will
                                                                                       6
                                                                                         https://code.google.com/p/cld2.
                                                                                       7
                                                                                         https://github.com/saffsd/langid.py
                                                                                       8
Figure 3: Geographical diversity in Mega-COV based                                       As (Lui and Baldwin, 2014) point out, langid makes er-
on geo-located data.                                                               ror on Twitter data. For this reason, we opted for adding
                                                                                   predictions from CLD2.

                                                                                3405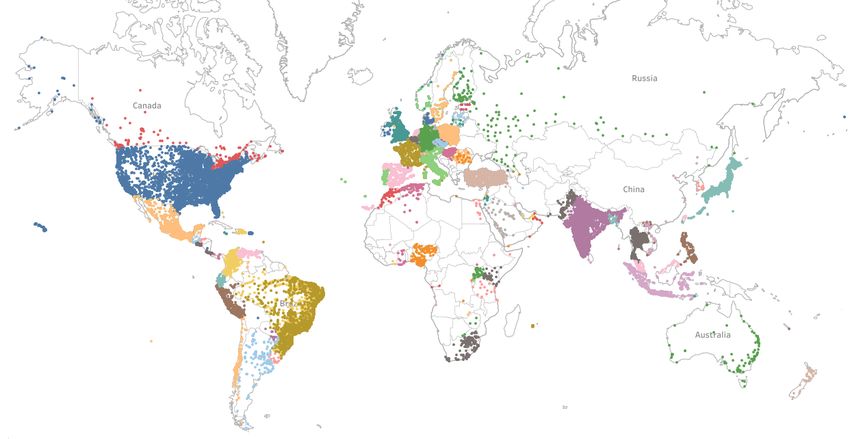
(a) Twitter user activity for Jan-May, 2020.                     (b) Distribution of Mega-COV (2007-2020)

                                      Figure 4: Data distribution and user activity.

 Lang                    Freq   Lang                     Freq      the 3 models use a masking objective, the XLM-R
 English (en)          900M     Hebrew (he)              1.2M
                                                                   models do not include the next sentence prediction
 Spanish (es)           122M    Croatian (hr)            685K
 Portuguese (pt)       79.5M    Maltese (mt)            325K       objective used in BERT.
 Japanese (ja)         46.6M    Slovak (sk)              246K
 Arabic (ar)              45M   BI (id)                 208K       4.2   Hyper-Parameters and Optimization
 Indonesion (in)         37M    Latin (la)              183K
                                                                   For each model, we use the same pre-processing
 French (fr)           29.5M    Bosnian (bs)             143K
 Turkish (tr)          28.5M    Dzongkha (dz)          137.8K      in the respective code released by the authors. For
 Tagalog (tl)             19M   Swahili (sw)              92K      all models, we typically use a sequence length of
 Italian (it)            8.8M   Azerbaijani (az)        68.9K      50 tokens. We use a learning rate of 5e−6 and a
 Thai (th)               7.7M   Quechua (qu)              61K
                                                                   batch size of 32. We train each model for 20 epochs
 Hindi (hi)                7M   Albanian (sq)             61K
 Dutch (nl)              6.9M   Malay (ms)                59K      and identify the best epoch on a development set.
 Russuian (ru)           6.2M   Kinyarwanda (rw)        56.8K      We report performance on both development and
 German (de)               6M   Esperanto (eo)            55K      test sets. We describe our baseline for each of
 Catalan (ca)            3.5M   Javanese (jv)             53K
                                                                   the relevance and misinformation models in the
 Korean (ko)            2.9M    Xhosa (xh)              47.7K
 Haitian Creole (ht)    2.8M    Irish (ga)              44.6K      respective sections below. We now introduce each
 Polish (pl)             2.4M   Kurdish (ku)              43K      of these two model groups.
 Estonain (et)          2.1M    Volapük (vo)             41K
                                                                   4.3   COVID-Relevance Models
Table 4: Top 20 languages assigned by Twitter (left)
and top 20 languages assigned by langid (right) in                 Data. Our COVID-relevance models predict
Mega-COV. BI: Bahasa Indonesia.                                    whether a tweet is related to COVID-19 or not
                                                                   (i.e., not related). To train the models, we sam-
label a tweet as relevant to COVID-19 or not
                                                                   ple ∼ 2.3M multilingual tweets (65 languages)
and (2) COVID-misinformation, where a model
                                                                   collected with COVID-19 hashtags from (Chen
predicts text veracity pertaining COVID-19 (i.e.,
                                                                   et al., 2020) and use them as our positive class
whether a text carries true or fake information re-
                                                                   (i.e., related to COVID-19). Examples of hashtags
lated to the pandemic). We now describe our meth-
                                                                   include #Coronavirus, #covid-19, and #pandemic.
ods.
                                                                   That is, we use the hashtags as a proxy for labels.
                                                                   This type of distant supervision has been validated
4.1   Methods
                                                                   and widely used in many NLP models (Go et al.,
For all our models, we fine-tune 3 popular pre-                    2009; Mohammad and Kiritchenko, 2015; Abdul-
trained language models: (1) Multilingual cased                    Mageed and Ungar, 2017). For the negative class
BERT (mBERT) (Devlin et al., 2018) and (2-3)                       (i.e., not related to COVID-19), we use a random
XLM Roberta base and large (XLM-RBase , XLM-                       sample of ∼ 2.3M from the 2019 part (Jan-Nov)
RLarge ) (Conneau et al., 2020). The mBERT and                     of Mega-COV. More description of the dataset we
XLM-RBase models have similar architectures, with                  created for training the relevance models and the
12 layers each with 12 attention heads, and 768 hid-               distribution of the data over the various languages
den units. XLM-RLarge has 24 layers each with 16                   is in Table E.1 (Appendix E).
attention heads, and 1, 024 hidden units. While all                Splits and Training. We split the data into 80%

                                                                3406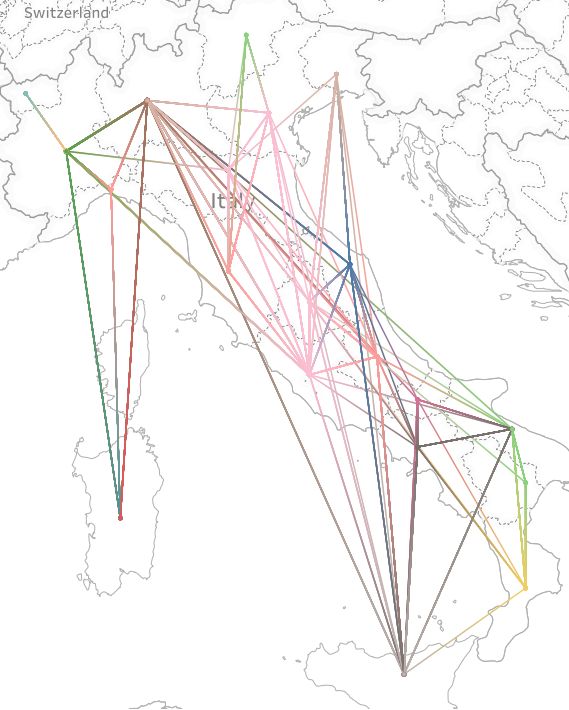
DEV                TEST                               Data                Acc             F1
     Model
                    Acc         F1        Acc     F1                            COAID              76.25        86.52
  Baseline I       55.10      71.05      54.99     70.96                        ReCOVery           89.46        94.44
                                                                                Average            82.46        90.38
  Baseline II      79.88      88.81      75.33     85.93
  mBERT            97.35      97.33      97.39     97.37
                                                                Table 6: Performance of our COVID-relevance mod-
  XLM-RBase        97.72      97.70      97.71     97.69        els on the Twitter data in CoAID, ReCOVery, and
  XLM-RLarge       97.92      97.90      97.95     97.93        CoAID+ReCOVery.
                                                                4.4        COVID-Misinformation Models
Table 5: Performance of COVID-relevance models.
Baseline I: Majority class in TRAIN. Baseline II: A             To train models for detecting the veracity of news
model that chooses the majority class (related class)           related to COVID-19, we exploit two recent and
75% of the time.                                                publicly available fake news datasets (in English):
TRAIN (n=3,146,334), 10% DEV (n=393,567),                       CoAID (Cui and Lee, 2020), and ReCOVery (Zhou
and 10% TEST (n=392,918). We then remove all                    et al., 2020). We now describe each of these
hashtags which were used by (Chen et al., 2020)                 datasets:
for collecting the data and fine-tune each of the 3
                                                                                         Fake                            True
language models on TRAIN.                                                      Claims    News     Tweets   Claims        News     Tweets

Results. As shown in Table 5, XLM-RLarge ac-                       CoAID        839      837      10,900    376          2716     149,343

quires best results with 97.95 acc and 97.93 macro                 ReCOVery      -       665      26,418        -        1,364    114,402

F1 on TEST. These results are significantly better                 Total        839      1,502    37,318    376          4,080    263,745

than a majority class baseline (based on TRAIN)
                                                                      Table 7: COVID-19 Misinformation Datasets.
and another arbitrarily-chosen (yet quite competi-
tive) baseline model that chooses the related class
(majority class in TRAIN) 75% of the time.
                                                                                                       Tweets
                                                                                         Fake                            True
Model Generalization. Our COVID-relevance
                                                                               TRAIN      DEV     TEST     TRAIN          DEV      TEST
models are trained with distant supervision (hash-
                                                                   CoAID        8,072     1,009    1,009   110,076       13,759    13,759
tags as surrogate labels). It is conceivable that                  ReCOVery     18,272    2,284    2,284    86,437       10,805    10,805
content related to COVID-19 would still occur in                   CoAID*       8,072      163      171    110,076        6,314     6,388
real world without accompanying hashtags. To test                  ReCOVery*    18,272     154      139     86,437        1,218     1,263

the extent to which our best model would perform
on external data, we evaluate it on two external                Table 8: Statistics of CoAID and ReCOVery datasets across
                                                                the data splits. CoAID∗ and ReCOVery∗ are de-duplicated
Twitter datasets, CoAID (Cui and Lee, 2020) and                 versions.
ReCOVery (Zhou et al., 2020), both of which are
claimed by the authors to be completely (100%)                  CoAID. Cui and Lee (2020) present a Covid-19
related to COVID-19.9                                           heAthcare mIsinformation Dataset (CoAID), with
  As Tabel 6 shows, We do observe a drop in                     diverse COVID-19 healthcare misinformation, in-
model performance as compared to our best model                 cluding fake news on websites and social platforms,
on our own TEST set in Table 5 (acc drops on                    along with related user engagements (i.e., tweets
average by 15.5% and 7.6% F1 ). However, the                    and replies) about such news. CoAID includes
best model is still highly effective. It acquires an            3, 235 news articles and claims, 294, 692 user en-
average acc of 82.46% and F1 of 90.38% on the                   gagement, and 851 social platform posts about
CoAID and ReCOVery datasets. We now introduce                   COVID-19. The dataset is collected from Decem-
our misinformation models.                                      ber 1, 2019 to July 1, 2020. Table 7 shows class
                                                                distribution of news articles and tweets in CoAID.
                                                                More information about CoAID is in Appendix F.
    9
      Each of the two datasets are also labeled for fake news   ReCOVery. Zhou et al. (2020) choose 60 news
(true vs. fake) focused on COVID-19, but our focus here is      publishers with ‘extreme’ levels of credibility (i.e.,
exclusively on using the two datasets as gold-labeled TEST      true vs. fake classes) from an original list of ∼
sets for evaluating our COVID-relevance model. Note that we
will use these two datasets again as explained in Section 4.4   2, 000 to collect a total of 2, 029 news articles on
as well.                                                        COVID-19, published between January and May

                                                            3407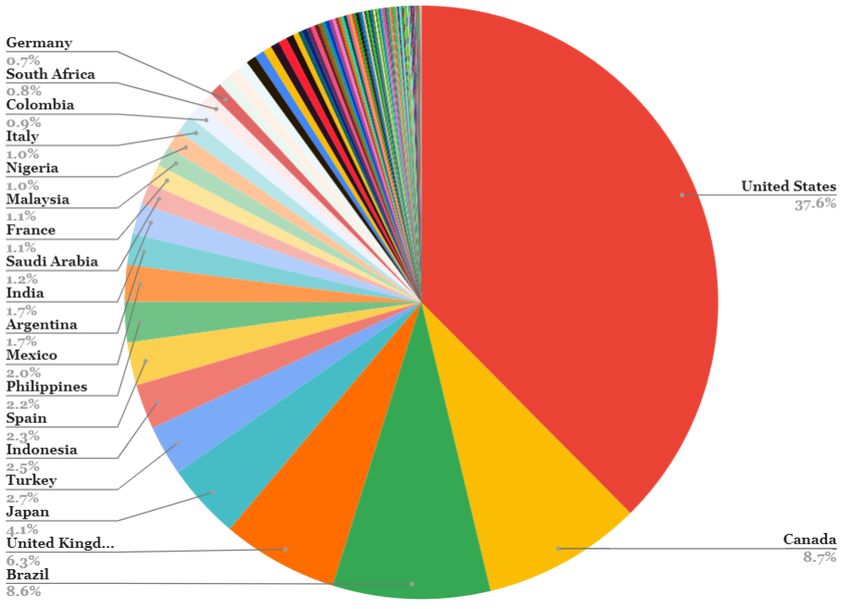
2020. They also collect 140, 820 tweets related to               Data          Model
                                                                                                        DEV                          TEST
                                                                                            Precision   Recall    F1     Precision   Recall    F1
the news articles, considering those tweets related
                                                                               LSTM          81.00      91.00    86.00    95.00       78.00   86.00
to true articles to be true and vice versa. Table 7                            mBERT         91.00      84.00    87.00    94.00       87.00   90.00
                                                                 CoAID
shows class distribution of news articles and tweets                           XLM-RBase     93.00      87.00    90.00    87.00       88.00   88.00

in ReCOVery.                                                                   XLM-RLarge    98.00      86.00    92.00    97.00       93.00   90.00

                                                                               LSTM          60.00      56.00    58.00    54.00       57.00   55.00
Splits and Cleaning. Table 8 shows the distribu-
                                                                               mBERT         81.00      59.00    68.00    87.00       55.00   68.00
tion of tweets in CoAID and Recovery before and                  ReCOV
                                                                               XLM-RBase     72.00      58.00    64.00    75.00       55.00   64.00
after the de-duplication process. As Table 8 shows,                            XLM-RLarge    89.00      52.00    66.00    89.00       51.00   65.00

de-duplication results in significantly reducing the                           LSTM          79.00      58.00    67.00    66.00       70.00   68.00
                                                                               mBERT         94.00      89.00    91.00    94.00       89.00   92.00
sizes of DEV and TEST sets in the two resources.                 CoAID+ReCOV
                                                                               XLM-RBase     88.00      88.00    88.00    88.00       88.00   88.00
The distribution of news article is shown in Ta-                               XLM-RLarge    86.00      94.00    90.00    85.00       93.00   89.00

ble F.1 (Appendix F).
Training. We use both CoAID and ReCOVery after                 Table 9: Performance of our COVID-misinformation Twitter
                                                               models on the fake class only across the 3 settings CoAID,
de-duplication for training neural models to detect            ReCOVery, and CoAID+ReCOVery. LSTM is our baseline.
fake news related to Covid-19. Using the same
                                                               our misinformation models are focused only on
hyper-parameters and training setup as the COVID-
                                                               English (due to the external gold data we used for
relevance models, we fine-tune the pre-trained lan-
                                                               training being English only), we will restrict this
guage models on the Twitter dataset and the news
                                                               analysis to the English language.11 We were curi-
dataset, independently.10 Since Mega-COV is a so-
                                                               ous whether model predictions will have different
cial media dataset, we only focus on training Twit-
                                                               distributions on the different types of Twitter posts
ter models here and provide the news models in Ap-
                                                               (i.e., tweets, retweets, and replies). Hence, to en-
pendix F. For the Twitter models, we develop one
                                                               able such comparisons, we extract a random sample
model on CoAID, another on ReCOVery, indepen-
                                                               of 10M samples from each of these post types (for
dently, and a third model for CoAID+ReCOVery
                                                               a total of 30M) from the year 2020 in Mega-COV.
(concatenated). Again, for each of these 3 datasets,
                                                               We then apply the XLM-RLarge relevance and mis-
we fine-tune on TRAIN and identify the best model
                                                               information models on the extracted samples. Ta-
on DEV. We then report the best model on both
                                                               ble 10 shows the distribution of predicted labels
DEV and TEST.
                                                               from each of the two models across the 3 posting
Results. Since our focus is on detecting fake texts,
                                                               types (tweets, retweets, and replies). Strikingly, as
we show results on the positive class only in Ta-
                                                               the top half of the table shows, while only 7.77%
ble 9. We report results in terms of precision, re-
                                                               of tweets are predicted as COVID-related, almost
call and F 1 . Our baseline is a small LSTM with
                                                               all retweets (99.84%) are predicted as related. This
2 hidden layers, each of which has 50 nodes. We
                                                               shows that users’ retweets were focused almost ex-
add a dropout of 0.2 after the first layer and arbi-
                                                               clusively on COVID-19. The table (bottom half)
trarily train the LSMT for 3 epochs. As Table 9
                                                               also shows that retweets are highest carriers of con-
shows, our best results for fake tweet detection
                                                               tent predicted as fake (3.67%), followed by tweets
on TEST for CoAID is at 90% F1 (mBERT/XLM-
                                                               (2.3%). From the table, we can also deduce that
RLarge ), for ReCOV 68% (mBERT), and for these
                                                               only 2.45% of all English language Twitter con-
two combined is 92%. All results are above the
                                                               tent (average across the 3 posting types) are pre-
LSTM baseline. We show results of the COVID-
                                                               dicted as fake. Given the global use of English,
misinformation news models in Table F.2 (Ap-
                                                               and the large volume of English posts Twitter re-
pendix F).
                                                               ceives daily, this percentage of fake content is still
5   Applications on Mega-COV                                   problematically high.

Now that we have developed two highly effective                5.1       Annotation Study
models, one for COVID-relevance and another for                We perform a human annotation study on a small
COVID-misinformation, we can employ these mod-                 sample of 150 random posts from those the model
els to make discoveries using Mega-COV. Since                  predicted as both COVID-related and fake. Two
   10
      Even though we could have used the monolingual ver-      annotators labeled the 150 samples for two types of
sions of the transformer-based language models (i.e., BERT
                                                                 11
and RoBERTa), we stick to the multilingual versions for con-        But we emphasize the multilingual capacity of our
sistency.                                                      COVID-relevance model.

                                                          3408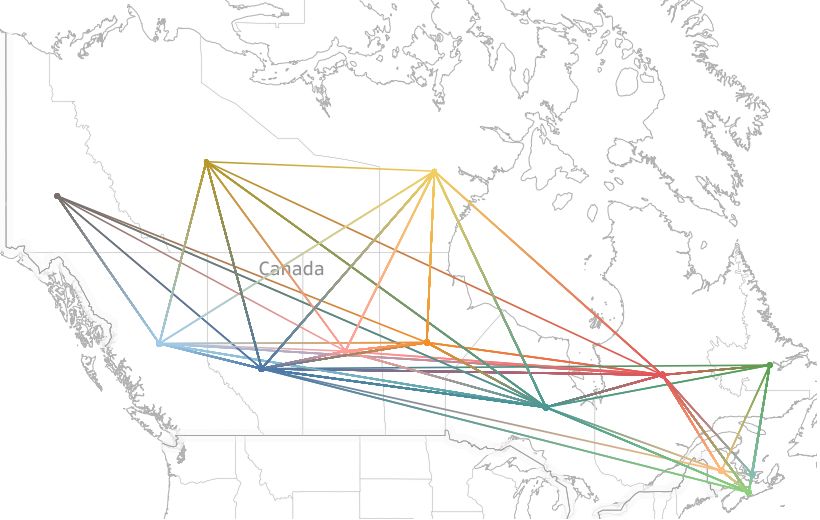
tags, relevance and veracity. For relevance, all the     Ethical Considerations. We collect Mega-COV
150 posts were found relevant by the two annota-         from the public domain (Twitter). In compliance
tors (perfect agreement). For veracity, since some       with Twitter policy, we do not publish hydrated
posts can be very challenging to identify, we asked      tweet content. Rather, we only publish publicly
annotators to assign one of the 3 tags in the set        available tweet IDs. All Twitter policies, includ-
{true, fake, unknown}. We did not ask annotators         ing respect and protection of user privacy, apply.
to consult any outside sources (e.g., Wikipedia or       We decided not to assign geographic region tags
independent fact-checking sites) to identify verac-      to the tweet IDs we distribute, but these already
ity of the samples. Inter-annotator agreement is at      exist on the json object retrievable from Twit-
Kappa (K)=77.81%, thus indicating almost perfect         ter. Still, location information should be used with
agreement. On average, annotators assigned the           caution. Twitter does not allow deriving or infer-
fake class 39.39% of the time, the true class 3.02%,     ring, or storing derived or inferred, potentially sen-
and the unknown class 57.05%. While these find-          sitive characteristics about users. Sensitive user
ings show that it is hard for humans to identify data    attributes identified by Twitter include health (e.g.,
veracity without resorting to external sources, it       pregnancy), negative financial status or condition,
also demonstrates the utility of the model in detect-    political affiliation or beliefs, religious or philo-
ing actual fake stories in the wild. We provide a        sophical affiliation or beliefs, sex life or sexual
number of samples from the posts that were auto-         orientation, trade union membership, and alleged
matically tagged as COVID-related and either true        or actual commission of a crime. If they decide to
or false by our misinformation/veracity model in         use Mega-COV, we expect researchers to review
Table 11.                                                Twitter policy12 and applicable laws, including the
                                                         European Union’s General Data Protection Regu-
      Model      Data       Prediction   Percentage      lation (GDPR)13 , beforehand. We encourage use
                 Tweets
                            Related            7.77      of Mega-COV for social good, including applica-
                            Unrelated         92.23      tions that can improve health and well-being and
      COVID                 Related           99.84
                 Retweets                                enhance online safety.
     Relevance              Unrelated          0.16
                            Related           12.94
                 Replies                                 7        Related Works
                            Unrelated         87.06

                 Tweets
                            Fake                2.3      Twitter Datasets for COVID-19. Several works
                            True              97.10      have focused on creating datasets for enabling
     COVID                  Fake               1.38      COVID-19 research. To the best of our knowl-
                 Retweets
     Misinfo.               True              98.33
                                                         edge, all these works depend on a list of hashtags
                            Fake               3.67
                 Replies                                 related to COVID-19 and focus on a given period
                            True              96.62
                                                         of time. For example, Chen et al. (2020) started col-
Table 10: Distribution of predicted labels from our
                                                         lecting tweets on Jan. 22nd and continued updating
COVID-relevance and COVID-misinformation mod-            by actively tracking a list of 22 popular keywords
els on randomly selected 30M English samples from        such as #Coronavirus, #Corona, and #Wuhancoro-
Mega-COV data.                                           navirus. As of May 30, 2020 (Chen et al., 2020)
                                                         report 144M tweets. Singh et al. (2020) collect a
                                                         dataset covering January 16 2020-March 15 2020
6   Data Release and Ethics                              using a list of hashtags such as #2019nCoV, #Chi-
Data Distribution. The size of the data makes it         naPneumonia and #ChinesePneumonia, for a total
an attractive object of study. Collection and explo-     of 2.8M tweets, ∼ 18M re-tweets, and ∼ 457K di-
ration of the data required significant computing in-    rect conversations. Using location information on
frastructure and use of powerful data streaming and      the data, authors report that tweets strongly corre-
processing tools. To facilitate use of the dataset, we   lated with newly identified cases in these locations.
organize the tweet IDs we release by time (month         Similarly, Alqurashi et al. (2020) use a list of key-
and year) and language. This should enable inter-        words and hashtags related to Covid-19 with Twit-
ested researchers to work with the exact parts of            12
                                                              https://developer.twitter.com/en/
the data related to their research questions even if     developer-terms/policy
                                                           13
they do not have large computing infrastructure.              https://gdpr-info.eu.

                                                      3409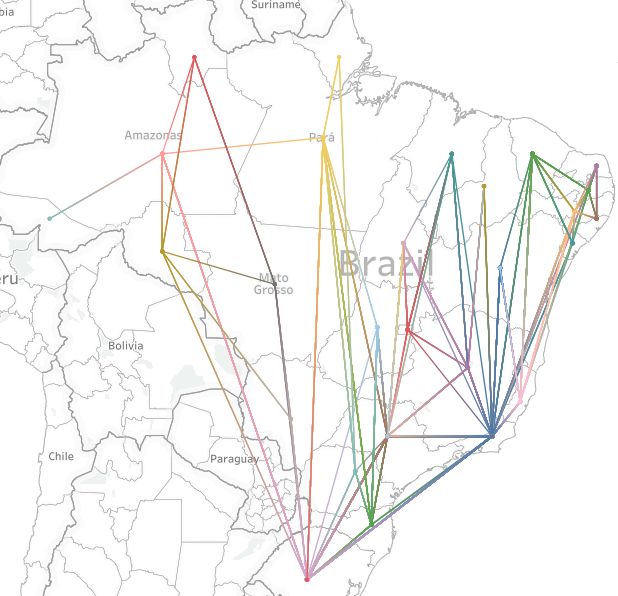
Post                                                                      Prediction

 Vatican confirms Pope Francis and two aides test positive for Coronavirus - MCM Whoaa       URL                                               Fake
   ∼CDC recommends men shave their beards to protect against coronavirus – USER URL                                                            Fake
 COVID - 19 : Chinese health authorities confirm patient zero ’ had sex with bats ’ URL                                                        Fake
 Royal Palace confirms Queen Elizabeth tests positive for coronavirus URL                                                                      Fake
 Is COVID - 19 airborne contagious ? New study shows that coronavirus may be caught from the air * 3 - hours * after it has been exposed .     True
 A close relative of SARS-CoV - 2 found in bats offers more evidence it evolved naturally URL                                                  True
 Antiviral remdesivir prevents disease progression in monkeys with COVID - 19 — National Institutes of Health ( NIH ) URL                      True
 COVID Surges Among Young Adults URL                                                                                                           True

            Table 11: Sample Mega-COV posts predicted as COVID-related, and either true or fake by our models.

ter’s streaming API to collect a dataset of Arabic                            pattern of rumours about COVID-19 on Twitter and
tweets. The dataset covers the period of March                                Weibo (Do et al., 2019), check-worthiness (Wright
1 2020-March 30 2020 and is at 4M tweets. The                                 and Augenstein, 2020), modeling the spread of
authors’ goal is to help researchers and policy mak-                          misinformation and related networks about the
ers study the various societal issues prevailing due                          pandemic (Cinelli et al., 2020; Osho et al., 2020;
to the pandemic. In the same vein, Lopez et al.                               Pierri et al., 2020; Koubaa, 2020), estimating the
(2020) collect a dataset of ∼ 6.5M in multiple                                rate of misinformation in COVID-19 associated
languages, with English accounting for ∼ 63.4%                                tweets (Kouzy et al., 2020), the use of bots (Fer-
of the data. The dataset covers January 22 2020-                              rara, 2020), predicting whether a user is COVID19
March 2020. Analyzing the data, authors observe                               positive or negative (Karisani and Karisani, 2020),
the level of retweets to rise abruptly as the crisis                          and the quality of shared links Singh et al. (2020).
ramped up in Europe in late February and early                                Other works have focused on detecting racism and
March.                                                                        hate speech (Devakumar et al., 2020; Schild et al.,
Twitter in emergency and crisis. Social media                                 2020; Shimizu, 2020; Lyu et al., 2020) and emo-
can play a useful role in disaster and emergency                              tional response (Kleinberg et al., 2020).
since they provide a mechanism for wide informa-
tion dissemination (Simon et al., 2015). Examples                              8     Conclusion
include use of Twitter information for the Typhoon
Haiyan in the Philippines (Takahashi et al., 2015),                           We presented Mega-COV, a billion-scale dataset of
Tsunami in Padang Indonesia (Carley et al., 2016),                            104 languages for studying COVID-19 pandemic.
the Nepal 2015 earthquakes (Verma et al., 2019),                              In addition to being large and highly multilingual,
Harvey Hurricane (Marx et al., 2020). A number                                our dataset comprises data pre-dating the pandemic.
of works have focused on developing systems for                               This allows for comparative and longitudinal in-
emergency response. An example is McCreadie                                   vestigations. We provided a global description of
et al. (2019). Other works focused on developing                              Mega-COV in terms of its geographic and tempo-
systems for detecting misuse of social media (Al-                             ral coverage, over-viewed its linguistic diversity,
shehri et al., 2018, 2020; Nagoudi et al., 2020;                              and provided analysis of its content based on hash-
Elmadany et al., 2020).                                                       tags and top domains. We also provided a case
Misinformation About COVID-19. Misinforma-                                    study of how the data can be used to track global
tion can spread fast during disaster. Social data                             human mobility. The scale of the Mega-COV has
have been used to study rumors and various types                              also allowed us to make a number of striking dis-
of fake information related to the Zika (Ghenai and                           coveries, including (1) the shift toward retweeting
Mejova, 2017) and Ebola (Kalyanam et al., 2015)                               and replying to other users rather than tweeting in
viruses. In the context of COVID-19, a number of                              2020 and (2) the role of international news sites as
works have focused on investigating the effect of                             key sources of information during the pandemic. In
misinformation on mental health (Rosenberg et al.,                            addition, we developed effective models for detect-
2020), the types, sources, claims, and responses                              ing COVID relevance and COVID misinformation
of a number of pieces of misinformation about                                 and applied them to a large sample of our dataset.
COVID-19 (Brennen et al., 2020), the propagation                              Our dataset and models are publicly available.

                                                                          3410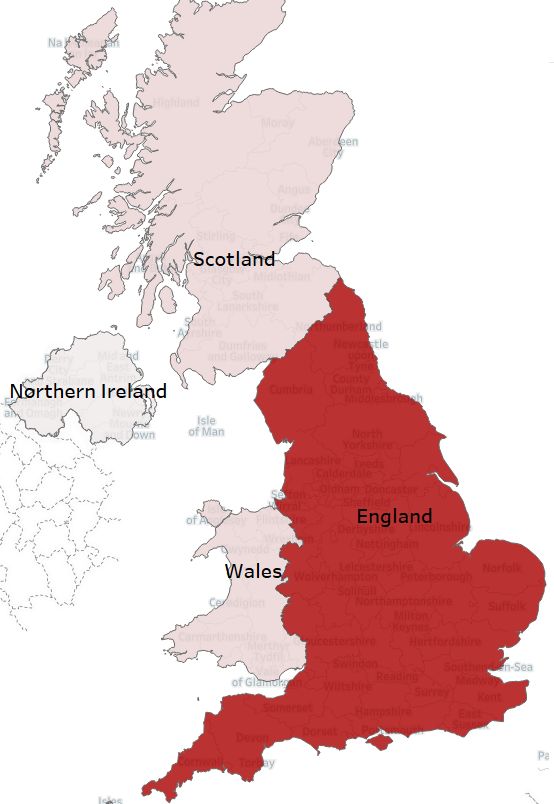
References                                              Delan Devakumar, Geordan Shannon, Sunil S Bhopal,
                                                          and Ibrahim Abubakar. 2020. Racism and discrimi-
Muhammad Abdul-Mageed and Lyle Ungar. 2017.               nation in covid-19 responses. Lancet (London, Eng-
 EmoNet: Fine-grained emotion detection with gated        land), 395(10231):1194.
 recurrent neural networks. In Proceedings of the
 55th Annual Meeting of the Association for Compu-      Jacob Devlin, Ming-Wei Chang, Kenton Lee, and
 tational Linguistics (Volume 1: Long Papers), vol-        Kristina Toutanova. 2018. Bert: Pre-training of deep
 ume 1, pages 718–728.                                     bidirectional transformers for language understand-
                                                           ing. arXiv preprint arXiv:1810.04805.
Sarah Alqurashi, Ahmad Alhindi, and Eisa Alanazi.
                                                        Tien Huu Do, Xiao Luo, Duc Minh Nguyen, and Nikos
  2020. Large arabic twitter dataset on covid-19.
                                                           Deligiannis. 2019. Rumour detection via news prop-
  arXiv preprint arXiv:2004.04315.
                                                           agation dynamics and user representation learning.
                                                           arXiv preprint arXiv:1905.03042.
Ali Alshehri, El Moatez Billah Nagoudi, and Muham-
  mad Abdul-Mageed. 2020. Understanding and de-         Tien Huu Do, Duc Minh Nguyen, Evaggelia Tsili-
  tecting dangerous speech in social media. In Pro-        gianni, Bruno Cornelis, and Nikos Deligiannis. 2018.
  ceedings of the 4th Workshop on Open-Source Ara-        Twitter user geolocation using deep multiview learn-
  bic Corpora and Processing Tools, with a Shared          ing. In 2018 IEEE International Conference on
  Task on Offensive Language Detection, pages 40–47,      Acoustics, Speech and Signal Processing (ICASSP),
  Marseille, France. European Language Resource As-        pages 6304–6308. IEEE.
  sociation.
                                                        AbdelRahim Elmadany, Chiyu Zhang, Muhammad
Ali Alshehri, El Moatez Billah Nagoudi, Alhuzali Has-     Abdul-Mageed, and Azadeh Hashemi. 2020. Lever-
  san, and Muhammad Abdul-Mageed. 2018. Think             aging affective bidirectional transformers for offen-
  before your click: Data and models for adult con-       sive language detection. In The 4th Workshop on
  tent in Arabic twitter. In The 2nd Text Analytics       Open-Source Arabic Corpora and Processing Tools
  for Cybersecurity and Online Safety (TA-COS-2018),      (OSACT4), LREC, pages 102–108.
  LREC.
                                                        Emilio Ferrara. 2020. # covid-19 on twitter: Bots, con-
                                                          spiracies, and social media activism. arXiv preprint
J Scott Brennen, Felix M Simon, Philip N Howard, and      arXiv:2004.09531.
   Rasmus Kleis Nielsen. 2020. Types, sources, and
   claims of covid-19 misinformation. Reuters Insti-    Amira Ghenai and Yelena Mejova. 2017. Catching
   tute.                                                 zika fever: Application of crowdsourcing and ma-
                                                         chine learning for tracking health misinformation on
Kathleen M Carley, Momin Malik, Peter M Landwehr,        twitter. arXiv preprint arXiv:1707.03778.
  Jürgen Pfeffer, and Michael Kowalchuck. 2016.
  Crowd sourcing disaster management: The complex       Alec Go, Richa Bhayani, and Lei Huang. 2009. Twit-
  nature of twitter usage in padang indonesia. Safety     ter sentiment classification using distant supervision.
  science, 90:48–61.                                      CS224N project report, Stanford, 1(12):2009.
                                                        Mark Graham, Scott A Hale, and Devin Gaffney. 2014.
Emily Chen, Kristina Lerman, and Emilio Ferrara.         Where in the world are you? geolocation and lan-
  2020. Covid-19: The first public coronavirus twit-     guage identification in twitter. The Professional Ge-
  ter dataset. arXiv preprint arXiv:2003.07372.          ographer, 66(4):568–578.
Matteo Cinelli, Walter Quattrociocchi, Alessandro       Bo Han, Afshin Rahimi, Leon Derczynski, and Timo-
 Galeazzi, Carlo Michele Valensise, Emanuele Brug-        thy Baldwin. 2016. Twitter geolocation prediction
 noli, Ana Lucia Schmidt, Paola Zola, Fabiana Zollo,      shared task of the 2016 workshop on noisy user-
 and Antonio Scala. 2020. The covid-19 social media       generated text. In Proceedings of the 2nd Workshop
 infodemic. arXiv preprint arXiv:2003.05004.              on Noisy User-generated Text (WNUT), pages 213–
                                                          217.
Alexis Conneau, Kartikay Khandelwal, Naman Goyal,
  Vishrav Chaudhary, Guillaume Wenzek, Francisco        Janani Kalyanam, Sumithra Velupillai, Son Doan,
  Guzmán, Edouard Grave, Myle Ott, Luke Zettle-           Mike Conway, and Gert Lanckriet. 2015. Facts
  moyer, and Veselin Stoyanov. 2020. Unsupervised          and fabrications about ebola: A twitter based study.
  cross-lingual representation learning at scale. In       arXiv preprint arXiv:1508.02079.
  Proceedings of the 58th Annual Meeting of the Asso-   Negin Karisani and Payam Karisani. 2020. Mining
  ciation for Computational Linguistics, pages 8440–      coronavirus (covid-19) posts in social media. arXiv
  8451, Online. Association for Computational Lin-        preprint arXiv:2004.06778.
  guistics.
                                                        Bennett Kleinberg, Isabelle van der Vegt, and Maxi-
Limeng Cui and Dongwon Lee. 2020.            Coaid:       milian Mozes. 2020. Measuring emotions in the
  Covid-19 healthcare misinformation dataset. arXiv       covid-19 real world worry dataset. arXiv preprint
  preprint arXiv:2006.00885.                              arXiv:2004.04225.

                                                    3411
Anis Koubaa. 2020. Understanding the covid19 out- Francesco Pierri, Carlo Piccardi, and Stefano Ceri.
break: A comparative data analytics and study. 2020. Topology comparison of twitter diffusion
arXiv preprint arXiv:2003.14150. networks effectively reveals misleading information.
Scientific reports, 10(1):1–9.
Ramez Kouzy, Joseph Abi Jaoude, Afif Kraitem,
Molly B El Alam, Basil Karam, Elio Adib, Jabra Stephen Roller, Michael Speriosu, Sarat Rallapalli,
Zarka, Cindy Traboulsi, Elie W Akl, and Khalil Benjamin Wing, and Jason Baldridge. 2012. Super-
Baddour. 2020. Coronavirus goes viral: Quantify- vised text-based geolocation using language models
ing the covid-19 misinformation epidemic on twitter. on an adaptive grid. In Proceedings of the 2012 Joint
Cureus, 12(3). Conference on Empirical Methods in Natural Lan-
guage Processing and Computational Natural Lan-
Christian E Lopez, Malolan Vasu, and Caleb Galle- guage Learning, pages 1500–1510. Association for
more. 2020. Understanding the perception of Computational Linguistics.
covid-19 policies by mining a multilanguage twitter
Hans Rosenberg, Shahbaz Syed, and Salim Rezaie.
dataset. arXiv preprint arXiv:2003.10359.
2020. The twitter pandemic: The critical role of
twitter in the dissemination of medical information
Marco Lui and Timothy Baldwin. 2012. langid. py:
and misinformation during the covid-19 pandemic.
An off-the-shelf language identification tool. In Pro-
Canadian Journal of Emergency Medicine, pages 1–
ceedings of the ACL 2012 system demonstrations,
7.
pages 25–30. Association for Computational Lin-
guistics. Leonard Schild, Chen Ling, Jeremy Blackburn, Gian-
luca Stringhini, Yang Zhang, and Savvas Zannettou.
Marco Lui and Timothy Baldwin. 2014. Accurate lan- 2020. ” go eat a bat, chang!”: An early look on
guage identification of twitter messages. In Proceed- the emergence of sinophobic behavior on web com-
ings of the 5th workshop on language analysis for munities in the face of covid-19. arXiv preprint
social media (LASM), pages 17–25. arXiv:2004.04046.
Hanjia Lyu, Long Chen, Yu Wang, and Jiebo Luo. 2020. Kazuki Shimizu. 2020. 2019-ncov, fake news, and
Sense and sensibility: Characterizing social media racism. The Lancet, 395(10225):685–686.
users regarding the use of controversial terms for
covid-19. arXiv preprint arXiv:2004.06307. Tomer Simon, Avishay Goldberg, and Bruria Adini.
2015. Socializing in emergencies—a review of
Julian Marx, Milad Mirbabaie, and Christian Ehnis. the use of social media in emergency situations.
2020. Sense-giving strategies of media organ- International Journal of Information Management,
isations in social media disaster communication: 35(5):609–619.
Findings from hurricane harvey. arXiv preprint
Lisa Singh, Shweta Bansal, Leticia Bode, Ceren Budak,
arXiv:2004.08567.
Guangqing Chi, Kornraphop Kawintiranon, Colton
Padden, Rebecca Vanarsdall, Emily Vraga, and
Richard McCreadie, Cody Buntain, and Ian Soboroff.
Yanchen Wang. 2020. A first look at covid-19 infor-
2019. Trec incident streams: Finding actionable
mation and misinformation sharing on twitter. arXiv
information on social media. Proceedings of the
preprint arXiv:2003.13907.
16th International Conferenc e on Information Sys-
tems for Crisis Response and Management, Valencia, Bruno Takahashi, Edson C Tandoc Jr, and Christine
Spain. Carmichael. 2015. Communicating on twitter dur-
ing a disaster: An analysis of tweets during typhoon
Saif M Mohammad and Svetlana Kiritchenko. 2015. haiyan in the philippines. Computers in Human Be-
Using hashtags to capture fine emotion cate- havior, 50:392–398.
gories from tweets. Computational Intelligence,
31(2):301–326. Rakesh Verma, Samaneh Karimi, Daniel Lee, Om-
prakash Gnawali, and Azadeh Shakery. 2019.
El Moatez Billah Nagoudi, AbdelRahim Elmadany, Newswire versus social media for disaster response
Muhammad Abdul-Mageed, Tariq Alhindi, and and recovery. arXiv preprint arXiv:1906.10607.
Hasan Cavusoglu. 2020. Machine Generation and
Detection of Arabic Manipulated and Fake News. In WHO. 2020. Who statement regarding cluster of pneu-
Proceedings of the Fifth Arabic Natural Language monia cases in wuhan, china. Beijing: WHO, 9.
Processing Workshop, pages 69–84.
Dustin Wright and Isabelle Augenstein. 2020. Fact
check-worthiness detection as positive unlabelled
J Ooms and D Sites. 2018. cld2: Google’s Compact
learning. arXiv preprint arXiv:2003.02736.
Language Detector 2. Retrieved Feburary, 7:2019.
Xinyi Zhou, Apurva Mulay, Emilio Ferrara, and Reza
Abiola Osho, Caden Waters, and George Amariucai. Zafarani. 2020. Recovery: A multimodal reposi-
2020. An information diffusion approach to ru- tory for covid-19 news credibility research. arXiv
mor propagation and identification on twitter. arXiv preprint arXiv:2006.05557.
preprint arXiv:2002.11104.
3412Appendices
A Data Distribution
Figure A.2: Geographical diversity in Mega-COV. We
show the distribution of our geo-located data over the
top 20 countries with most tweets and responses. Over-
all, 268 countries are represented in the data.
2019 2020
Hashtag Freq Hashtag Freq
Figure A.1: Frequency of tweeting during Jan-May NewProfilePic 64,922 COVID19 260,024
(10th ) 2020 vs. Jan-May 2019. love 41,964 coronavirus 219,615
Repost 39,128 NewProfilePic 102,724
art 35,825 BBB20 91,775
music 28,335 Covid-19 70,106
B Hashtag Content Analysis travel 28,236 COVID-19 67,737
GameofThrones 21,484 Coronavirus 53,251
Hashtags usually correlate with the topics users nature 18,563 covid19 47,940
post about. We provide the top 30 hashtags in the instagood 18,491 StayHome 44,165
photooftheday 18,032 NintendoSwitch 42,812
data in Table B.1. As the table shows, users tweet tbt 17,332 love 42,497
heavily about the pandemic using hashtags such as realestate 17,255 bbb20 39,974
COVID19, coronavirus, Coronavirus, COVID19, shopmycloset 16,760 NowPlaying 39,069
GameOfThrones 16,127 Repost 37,036
Covid19, covid19 and StayAtHome. Simple word peing 15,930 AnimalCrossing 36,369
clouds of hashtags from the various languages (Fig- fitness 15,623 ACNH 35,528
food 15,358 photography 35,209
ure B.1 provides clouds from the top 10 languages) BellLetsTalk 14,853 COVID2019 33,512
also show COVID-19 topics trending. We also ob- NowPlaying 14,849 shopmycloset 31,428
serve hashtags related to gaming (e.g., NowPlaydo, family 14,060 music 30,537
style 14,041 StayAtHome 30,313
PSshare, and NintendoSwitch). This reflects how SoundCloud 13,904 QuedateEnCasa 30,194
users may be spending part of their newly-found WeTheNorth 13,579 stayhome 27,540
home time. We also note frequent occurrence of GOT 13,458 PS4share 27,487
np 13,335 SocialDistancing 27,376
political hashtags in languages such Arabic, Farsi, MyTwitterAnniv. 12,965 lockdown 27,344
Indian, and Urdu. This is in contrast to discussions Toronto 12,964 TikTok 27,287
in European languages where politics are not as vis-
Table B.1: Top 30 hashtags in Mega-COV for 2019 vs.
ible. For example, in Urdu, discussions involving
2020.
the army and border issues show up. This may be
partly due to different political environments, but shows (e.g., Big Boss), doctors, and even fake news
also due to certain European countries such as Italy, along with the pandemic-related hashtags.
Sweden, Spain, and the U.K. being hit harder (and An interesting observation from the Chinese
earlier) than many countries in the Middle East and language word cloud is the use of hashtags such as
Asia. In Indian languages such as Tamil and Hindi, ChinaPneumonia and WuhanPneumonia to refer to
posts also focused on movies (e.g., Valimai), TV the pandemic. We did not observe these same hash-
3413Figure B.1: Word clouds for hashtags in tweets from the top 10 languages in the data. We note that tweets in
non-English can still carry English hashtags or employ Latin script.
tags in any of the other languages. Additionally, for Domain Rank Domain Rank
theguardian.com ↑3 thehill.com ↑ 51
some reason, Apple seems to be trending during nytimes.com ↑ 10 globeandmail.com ↓ -38
the first 4 months of 2020 in China owing to hash- cnn.com ↑ 18 businessinsdr.com ↑ 31
tags such as appledaily and appledailytw. Some apple.news ↑4 theatlantic.com ↑ 27
languages, such as Romanian and Vietnamese, in- washingtonpost.com ↑ 16 newsbreakapp.com ↑ 472
cbc.ca ↓ -13 eldiario.es ↑ 62
volve discussions of bitcoin and crypto-currency. bbc.co.uk ↓ -4 apnews.com ↑ 48
This was also seen in the Chinese language word bbc.com ↑3 abc.es ↑ 89
cloud, but not as prominently. nyti.ms ↓ -11 reuters.com ↑ 59
foxnews.com ↑ 51 thestar.com ↓ -64
C Domain Sharing Analysis forbes.com ↓ -14 francebleu.fr ↑ 424
nbcnews.com ↑ 39 globalnews.ca ↓ -78
Domains in URLs shared by users also provide a wsj.com ↑ 11 independent.co.uk ↓ -10
window on what is share-worthy. We perform an bloomberg.com ↑ 13 elmundo.es ↑ 21
ctvnews.ca ↑2 indiatimes.com l0
analysis of the top 200 domains shared in each of nypost.com ↑ 100 radio-canada.ca ↓ -66
2019 and 2020. The major observation we reach cnbc.com ↑ 43 lavanguardia.com ↑ 96
is the surge in tweets involving news websites, and usatoday.com ↑6 dailymail.co.uk ↑ 23
the rise in ranks for the majority of these websites latimes.com ↑ 23 politico.com ↑ 403
huffpost.com ↑ 66 sky.com ↑ 114
compared to 2019. Table C.1 shows the top 40
news domains in the 2020 data and their change Table C.1: Top 40 domains in 2020 data and their rank
in rank compared to 2019. Such a heavy sharing change relative to their rank in 2019.
of news domains reflects users’ needs: Intuitively, nomic impact of the pandemic, shopping domains
at times of global disruption, people need more such as etsy.me and poshmark.com have markedly
frequent updates on ongoing events. Of particular risen in rank as people moved to shopping online
importance, especially relative to other ongoing in more significant ways. We now introduce a case
political polarization in the U.S., is the striking rise study as to how our data can be used for mobility
of the conservative news network Fox News, which tracking.
has moved from a rank of 118 in 2019 to 67 in
2020 with a swooping 51 positions jump. We also D Case Study: Mapping Human
note the rank of some news sites (e.g., The Globe Mobility with Mega-COV
and Mail and The Star going down. This is perhaps
due to people resorting to international (and more Geolocation information in Mega-COV can be
diverse) sources of information to remain informed used to characterize and track human mobility in
about countries other than their own. various ways. We investigate some of these next.
Other domains: Other noteworthy domain activ- Inter-Region Mobility. Mega-COV can be ex-
ities include those related to gaming, video and ploited to generate responsive maps where end
music, and social media tools. Ranks of these do- users can check mobility patterns between differ-
mains have not necessarily shifted higher than 2019 ent regions over time. In particular, geolocation
but remain prominent. This shows these themes information can show mobility patterns between
still being relevant in 2020. In spite of the eco- regions. As an illustration of this use case, albeit
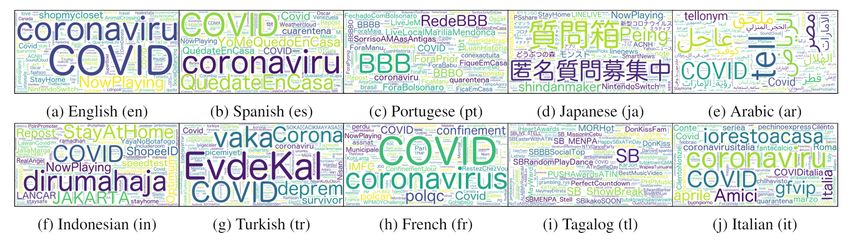
3414(a) Overall inter-state mobility (b) January (c) February
(d) March (e) April (f) May
Figure D.1: Inter-state user mobility in the U.S. for Jan-May, 2020.
in a static form, we provide Figure D.1a where we D.1 User Weekly Intra-Region Mobility
show how users move between U.S. states. We We can also visualize user mobility as a distance
can also exploit Mega-COV to show inter-state from an average mobility score on a weekly basis.
mobility during a given window of time.14 Fig- Namely, we calculate an average weekly mobility
ures D.1b- D.1e present user mobility between U.S. score for the year 2019 using geo-tag information
states. The figure shows a clear change from higher (longitude and latitude) and use it as a baseline
mobility in January and February to much less ac- against which we plot user mobility for each week
tivity in March, April, and May. Clear differences of 2019 and 2020 up until April. In general, we
can be seen in key states where the pandemic has observe a drop in user mobility in Canada starting
hit hard such as New York (NY), California (CA), from mid-March. For U.S. users, we notice a very
and Washington State (WA). We provide visualiza- high mobility surge starting around end of Febru-
tions of mobility patterns for a number of countries ary and early March, only waning down the last
where the pandemic has hit (sometimes hard), as week of March and continuing in April as shown
follows: Brazil, Canada, Italy, Saudi Arabia, and in Figure D.8. For both the U.S. and Canada, we
the United Kingdom. hypothesize the surge in early March (much more
Intra-Region Mobility. We also use information noticeable in the U.S.) is a result of people moving
in Mega-COV to map each user to a single home back to their hometowns, returning from travels,
region (i.e., city, state/province, and country). We moving for basic needs stocking, etc.
follow Geolocation literature (Roller et al., 2012;
Graham et al., 2014; Han et al., 2016; Do et al., E COVID-Relevance Model
2018) in setting a condition that a user must have
posted at least 10 tweets from a given region. How- E.1 Dataset
ever, we also condition that at least 60% of all user We randomly sample 200K tweets from the English
tweets must have been posted from the same re- data in Chen et al. (2020) and a maximum of 100K
gion. We use the resulting set of users whose home from each of the rest of languages. For languages
location we can verify to map user weekly mobility where there is < 100K tweets, we take all data. For
within their own city, state, and country exclusively the negative class, we extract data from Jan-Nov,
for both Canada and the U.S. as illustrating ex- 2019 from Mega-COV. For each language, we take
amples. We provide the related visualization in roughly the same number of tweets we sampled for
supplementary material under “User Weekly In- the positive class. Table E.1 shows the distribution
tra-Region Mobility”. of the positive class data from Chen et al. (2020).
14
Here, due to increased posting in 2020, we normalize
the number of visits between states by the total number of all
tweets posted during a given month.
3415You can also read