ADULT EDUCATION AND TRAINING CENTRES IN GAUTENG - Audit findings and recommendations for future provision REPORT prepared for the Gauteng ...
←
→
Page content transcription
If your browser does not render page correctly, please read the page content below
ADULT EDUCATION AND
TRAINING CENTRES IN GAUTENG

                Audit findings and
   recommendations for future
                    provision

                            REPORT prepared for
       the Gauteng Department of Education (GDE)
                                      June 2013

           February 2013
South African Institute for Distance Education P O Box 31822 Braamfontein 2017 South Africa Tel: +27 11 403 2813 Fax: +27 11 403 2814 http://www.saide.org.za © South African Institute for Distance Education ISBN: This project was funded by
AUDIT OF ADULT EDUCATION
AND TRAINING CENTRES IN
GAUTENG

REPORT PREPARED FOR GDE
Table of Contents
1.     Introduction ........................................................................7
2.     Methodology ......................................................................7
2.1 Sampling ............................................................................................ 8
2.2 Limitations....................................................................................... 10
3.     Setting the scene ..............................................................11
3.1 Centre Managers’ perception of performance.......................... 11
3.2 Characteristics of Centres ............................................................. 12
3.3 Programme Offering and Uptake ............................................... 14
3.4 Motivation to enrol at AETs......................................................... 17
3.5 Learner numbers and average class size.................................... 19
4.     Findings .............................................................................19
4.1 Learner demographics ................................................................... 19
4.2 Access................................................................................................ 21
4.3 Vision................................................................................................ 23
4.4 Governance and Administration ................................................ 23
4.5 Financial Management .................................................................. 24
4.6 Learner Registration and Data Management Processes ......... 25
4.7 Learner Dropout ............................................................................. 26
4.8 Interactions with Satellites .......................................................... 29
4.9 Collaboration with other community organisations and learning
initiatives ............................................................................................... 30
4.10 Quality of service provision ...................................................... 30
       4.10.1 Qualifications of educators ........................................................................... 30
       4.10.2 Employment conditions for educators ........................................................ 32
       4.10.3 Staff turnover................................................................................................... 33
       4.10.4 Frequency of classes ....................................................................................... 33
       4.10.5 Infrastructure ................................................................................................... 34
4.11 Relevance ....................................................................................... 36
5 Conclusion ............................................................................38
6 Recommendations ...........................................................39
6.1     Programme design and delivery .............................................. 39
6.2     Delivery ........................................................................................ 42
6.3     Learner Retention ....................................................................... 43
6.4     Satellite Centres .......................................................................... 43
6.5     Data quality and accuracy ......................................................... 44
6.6 Staffing ......................................................................................... 44 6.7 Facilities and Infrastructure ..................................................... 45 7 Proposed Institutional Landscape Model ..................46 7.1 Identification of catchment areas ............................................ 46 7.2 Distributed resource-based learning model ......................... 47 7.3 Overall Educational Structure.................................................. 48 7.4 Establishing the viability of Centres ...................................... 55 7.5 Quality Assurance ...................................................................... 57 List of tables Table 1: Sample size for the GDE Audit ................................................................................................ 10 Table 2: Programmes offered at Main Centre and Satellites ............................................................... 14 Table 3: Learner Registration by Programme ....................................................................................... 15 Table 4: Learner enrolment numbers per Centre ............................................................................... 17 Table 5: Motivation for enrolling at an AET Centre .............................................................................. 18 Table 6: Learner enrolment .................................................................................................................. 19 Table 7: Distances travelled by some learners ..................................................................................... 23 Table 8: Reasons for dropout indicated by learners ............................................................................. 28 Table 9: Highest qualifications of educators per Centre ...................................................................... 32 Table 10: Computer facilities at AETs ................................................................................................... 34 Table 11: Computer use by administrators .......................................................................................... 34 Table 12: Computers used by learners ................................................................................................. 35 Table 13: Staffing Model proposed for GDE AET Audit, March 2013 (based on 12 month academic year, 250 work days) ............................................................................................................................. 54 Table 14: Sample exercise to determine viability of existing Main Centres ......................................... 56 List of Figures Figure 1: Gauteng Education Districts.................................................................................................... 9 Figure 2: Centre Managers’ levels of satisfaction with Centre and Satellite performance .................. 11 Figure 3: Learner demographic information, by percentage ............................................................... 19 Figure 4: Distribution of learners by nationality, age, sex and race ..................................................... 20 Figure 5: Average demographic spread of learners at Gauteng AETs .................................................. 20 Figure 6: Learner Employment status by sex, age, and programme .................................................... 21 Figure 7: Main means of transport to attend classes broken down by percentage ............................. 22 Figure 8: Time taken to reach Centre by different means of transport ............................................... 22 Figure 9: Means of transport used, by time taken to reach Centre ..................................................... 22 Figure 10: Distributed resource-based learning model ........................................................................ 47
Annexures

A: Explanation of catchment algorithm – to follow
B: Data Collection instruments – to follow
C: High level data on catchment areas and uptake – separate attachment
D: Table depicting number of learners requiring Grades 10 and 11 who have no learning
options
1. Introduction
The South African Institute for Distance Education (Saide) has been contracted by the
Gauteng Department of Education to conduct an audit of 47 Adult Education and Training
(AET) Centres within Gauteng. The purpose of the audit is to establish the current state of
adult education in the province with a view to proposing recommendations for the
rationalisation and reorganisation of existing AET Centres in Gauteng. The report begins
with a macro (provincial) overview of Centre characteristics, learner numbers and
programme uptake.

The provincial overview is followed by District level findings which are organised under
three main themes; Access, Quality and Relevance. Each theme has a number of elements
which are discussed further in the report.
The findings of the audit and the compilation of Maps based on proposed catchment areas
for each AET Centre have been used to develop a proposed Institutional Landscape Model
for AET in Gauteng.
There are four annexures to the report. They are
A. An explanation of the catchment algorithm
B. The instruments;
C. High level data reflecting uptake of each Programme within the catchment areas and
D. High level data reflecting the number of learners with grades 9 or 10 who have no
learning options available to them if they are over 20 years and wish to return to school

2. Methodology
Four instruments were designed for the collection of data from the 47 Centres. These were:
   1. Centre Manager Questionnaire – to be administered with the manager of each
       Centre, to determine general trends and opinions about matters pertaining to the
       Centre. Included were questions about the modus operandi, vision, strengths and
       weaknesses of the Centre, the learner demographics, educator tenures and
       qualifications, management processes, governance of the Centre, relationship with
       host schools if applicable, Satellite operations, and financial administration.
   2. Audit questionnaire – to be administered with the manager or a designated
       administrator at each Centre, to collect data regarding the programmes offered, times
       of operation, registration process, learner demographics, governance and
       management processes, record keeping, computers and internet connectivity.
   3. Learner statistics sheet – for compilation of numbers of male and female learners
       registered for each programme, as well as the numbers who deregistered, who wrote
       exams, and who achieved passes in their courses.
   4. Self-administered Learner questionnaire – to be completed by learners available at
       the Centre at the time of the fieldwork visit. The content pertained to levels of
       satisfaction with various aspects of the education Centre and the education received,
demographics, accessibility to the Centre, reasons for other learners dropping out,
and future ambitions.
2.1 Sampling
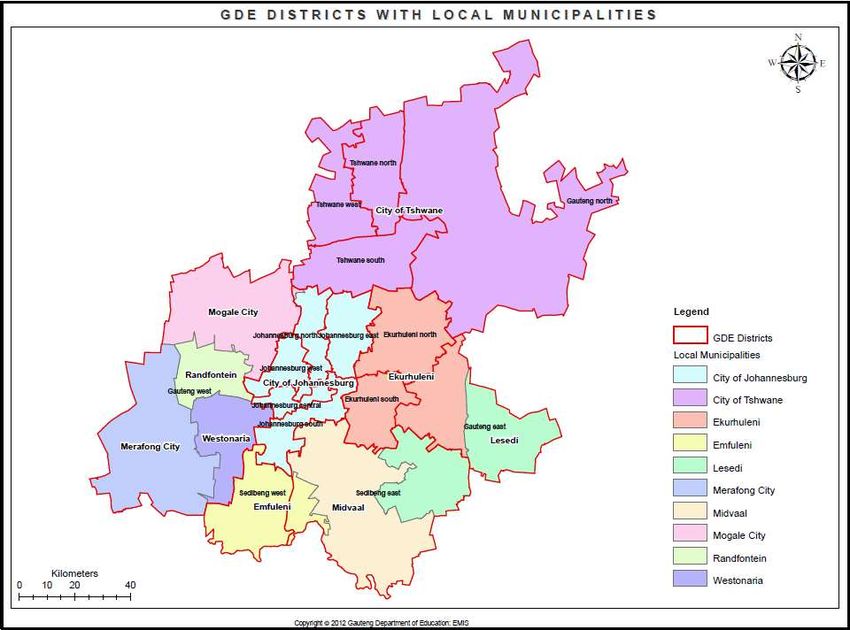
All 47 Adult Education Centres in Gauteng were included in the survey, thereby
constituting a 100% sample. The Centres are distributed across all the 15 education districts
of the province shown in Figure 1 below. Data collected by means of the Audit instrument
and the Centre Manager questionnaire can thus be interpreted as fully representative of the
situation prevailing in this sector across Gauteng as of end of 2012.
Additionally, fieldworkers were instructed to ask a sample of 20 learners at each Centre to
complete a short questionnaire. This proved to be difficult, because at many Centres there
were no learners on site at the time of the survey. The realised sample of learners amounted
to 496, an average of about 10 per Centre. Given that nine Centres yielded no learner
questionnaires and that those learners that did submit questionnaires constituted a
convenience sample of those who happened to be available at the other 38 Centres, the
learner survey findings should not be interpreted as representative of all learners, but only
broadly indicative of trends.
Subsequent to completing the draft report, further data collection took place and four
Centres were subjected to a more intense visit to gain additional information about specific
issues and to test recommendations. Feedback from these visits has been incorporated in the
report. The Centres visited include Sebokeng, Kagiso, Kwazini and Sydney Maseko. These
Centres were chosen for the following reasons:
1. Sebokeng: Highest number of potential learners based on the catchments identified;
2. Kagiso: Centre with one of the highest number of Satellites;
3. Kwazini: Good management and administration and high AET enrolment; and
4. Sydney Maseko: Low AET enrolment in catchment with high population density.Figure 1: Gauteng Education Districts
Table 1 below shows that the audit questionnaire, Centre Manager interviews and the
learner statistics sheet were administered in all the 47 Centres in the province. Due to the
constraints pointed out above, the table shows 14 of the 15 districts where the student
questionnaire was administered.

                                         Centre          Learner
                           Audit         Manager         Statistics        Learner
District                   questionnaire Interview       sheet             Survey
Ekurhuleni North                          4          4                 4             24
Ekurhuleni South                          4          4                 4             28
Gauteng East                              4          4                 4             63
Gauteng North                             1          1                 1
Gauteng West                              4          4                 4             62
Johannesburg Central                      5          5                 5             76
Johannesburg East                         3          3                 3             32
Johannesburg North                        4          4                 4             46
Johannesburg South                        2          2                 2             11
Johannesburg West                         2          2                 2             17
Sedibeng East                             2          2                 2             15
Sedibeng West                             1          1                 1             6
Tshwane North                             3          3                 3             42
Tshwane South                             5          5                 5             67
Tshwane West                              3          3                 3             7
Total sample                             47      47                   47         496
Table 1: Sample size for the GDE Audit

2.2 Limitations
An immediate and obvious limitation to this research is the disorganised state of
information and data at a large proportion of the 47 Centres. In the various research
instruments, respondents were asked to provide details of the overall learner population at
the Centre. The details were to be disaggregated by race, gender, age category, nationality,
and programmes for which the learners were registered. In almost all cases, the data
provided was inconsistent. Total numbers did not correlate with the sum of the
disaggregated categories. This necessitated numerous follow-up telephone calls or in-person
interviews to verify information and to determine which the correct data was. Even then,
there appeared to be uncertainty.

In order to further improve the data, comparisons were made with the 2012 Annual Survey.
Within the Centres visited, 16 (34%) were able to provide the official SNAP or Annual
School Survey data to fieldworkers. The assumption was made that where contradictions
occurred, the data collected in the 2012 Annual Survey was correct. All other numbers were
corrected to match the Annual Survey totals and breakdowns by programme, gender and
race, where this was available.
3. Setting the scene
3.1 Centre Managers’ perception of performance
Centre Managers expounded on their visions for their Centres, primarily with reference to
the provision of high quality education, including literacy and numeracy (64%); or to
broader developmental aims and poverty alleviation (51%); or to the teaching of specific
skills (43%). More than half (60%) indicated that they were satisfied with the performance of
the Centre and its Satellites, and 15% were very satisfied. In contrast, 15% were neither
satisfied nor dissatisfied, 2% were dissatisfied, and 8% were very dissatisfied. The table
below shows managers’ opinions about their centres.
Very dissatisfied 8.5
Dissatisfied 2.1
Neither satisfied nor dissatisfied 14.9
Satisfied 59.6
Very satisfied 14.9
0 10 20 30 40 50 60 70 80 90 100
Figure 2: Centre Managers’ levels of satisfaction with Centre and Satellite performance
The major strengths of Centres were articulated as being the high quality or commitment of
their educators (70%); the accessibility of the Centre (23%); the high demand for the
programmes offered (23%); the good quality of the Centre’s facilities (13%); and the
partnerships between the Centre and other institutions (6%). Significantly, where the Centre
Manager mentioned that ‘good/ committed educators’ was a strength of the Centre, the level
of satisfaction of the Centre Managers was highest (76% were either very satisfied or
satisfied with the Centre and its Satellites’ performance).1
The major difficulties identified by Centre Managers were the inadequacy of the facilities for
teaching (66%); the poor level of attendance or commitment of learners (15%); unqualified or
1
This is a multiple response question, and thus answers do not add up to 100%uncommitted educators (13%); the inaccessibility of the Centre (3%); or the occurrence of
burglaries or vandalism at the Centre (4%)2.
Among those Centre Managers who were very satisfied with their Centres’ performance,
sources of satisfaction included good results (14%), good cooperation with the community
(28%), infrastructure (14%), providing good quality education (14%), high enrolment (14%)
and enthusiastic learners (14%).
When asked how satisfied Centre Managers were with the Centre’s performance, 60% of
those who were dissatisfied or very dissatisfied identified under qualified educators as the
biggest challenge. Other sources of dissatisfaction included poor performance of NSC
learners and a shortage of adequate facilities.
3.2 Characteristics of Centres
AET Centres in Gauteng are offering four programmes, each with varying degrees of
teaching and support. The number and variety of programmes was higher at Satellite
Centres than at Main Centres. There are also instances of learners who registered at a
Satellite Centre but are attending classes or learning support at Main Centres. The
programme offering at Main Centres and Satellite Centres is similar in most cases, but in a
small number of Centres, ABET is only offered at Satellite level. Educators are shared
between the Main Centre and Satellite Centres. Table 2 in paragraph 3.3 below shows the
relative distribution of programmes at Main Centres and at Satellite level.
With the exception of three Centres, all Centres follow the school term. All of the Centres
visited had full-time administrators who typically worked a standard working day, until
16h00. These administrators are responsible for tasks such as, but not limited to, registration,
student administration and any tasks related to Satellite Centres. In comparison to the
working hours of administrative staff, teaching hours tended to run until 14h00 in some
Centres and 20h00 in others: 51% of the Centres reported that Main Centres were open for
teaching purposes until 19h00 or 20h00, while over 80% of Centres reported that their
Satellites were open until 19h00 or 20h00. Surprisingly for an Adult Education Centre, only
one Centre indicated that they are also open on a Saturday for teaching.
Many Centres are operating from school premises and are sharing facilities with the school.
In the majority of cases (52%), where facilities are being shared, there is no document
governing the relationship between the school and the AET Centre. This creates difficulties
where Centres are expected to use school facilities and services. Where schools are Section
2
This is a multiple response question, and thus answers do not add up to 100%21 schools and responsible for managing their own budget, there is an incentive to off load
some costs on the AET Centre. In many instances, there is disagreement about using toilet
facilities, paying for cleaning and maintenance services.
Where Centres are platooning with schools, only 19% of Centres are operating
simultaneously to school lessons. The majority of these Centres are able to make use of
toilets, classrooms and the school library, if in place. However, difficulties exist with this
arrangement. Educators are not always willing to share facilities with educators from the
AET Centre, schools have full control of the budget and administration system and the AET
Centres experience a lack of space during registration and exams.
In 89% (42) of the 47 Centres, the number of learners enrolled for matric equivalent (NSC
and NATED 550) programmes exceeds those enrolled for ABET. This suggests that the main
activities of an AET Centre fall outside of the formal mandate of the Centre, and costs of
providing such programmes are not always covered by the AET Centre budget, meaning
that some costs need to be funded by learner fees, or, in some instances, in the absence of
adequate resources, there is limited support provided to NSC3 or NATED 550 candidates.
NSC and NATED 550 candidates pay a registration fee, and a fee per subject. Typically, costs
for writing the NSC exceed those of writing NATED 550. ABET fees are considerably lower,
and in some instances, there are no fees for ABET 1-3. This confirms that fees are typically
levied where there is a possibility of obtaining an exit level qualification. The fees are
retained by Centres and while receipts are issued to learners, it is often unclear how these
funds are managed and used. Main Centres have their own bank account into which student
fees are paid. Typically, fees for learners registered at Satellite Centres are paid into the Main
Centre’ bank account.
Across the province, staffing patterns vary. Data collected indicates vast discrepancies
between the number of educators employed and the time for which they are employed, and
the number of full time equivalent posts allocated to each Centre. There are a small number
of Centres who report employing educators for ten hours and less per week. As one might
expect in an Adult Education Centre, the data shows that there are more educators
employed part time than full time across the Centres. It is evident that Centres’ are allocated
a total number of staffing hours and they decide how to allocate these across full or part
time positions. However, Centres report that their staffing is insufficient because of high
demand for some learning areas, while some educators appear to have a very limited
workload. More careful consideration is needed when employing educators and considering
their own subject level expertise in relation to need. This is particularly important where
some educators may only be teaching one learning area. Given that demand for particular
learning areas is likely to change from year to year, care should be taken not to employ
3
NSC refers to National Senior Certificate, associated with the ‘new matric’ based on the National Curriculum Statementeducators on a full-time permanent basis unless there is a degree of confidence that the
educator will have a full workload for a number of years.
3.3 Programme Offering and Uptake
AET Centres are primarily providing ABET 1-3, ABET 4, NSC and NATED 5504. These are
offered at Main Centres as well as at Satellite level. Very few centres offer non-formal non-
accredited programmes (19%). Only three main centres and one Satellite offer computer
classes. Table 2 below shows the distribution of programmes by Main Centre and Satellites.
Programme Number of main centres Number of satellites
ABET 1 28 42
ABET 2 31 44
ABET 3 33 44
ABET 4 38 45
NSC 43 33
NATED 550 36 36
Non formal non accredited 9 3
Other (computers) 3 1
Table 2: Programmes offered at Main Centre and Satellites
The table below indicates that the majority of learners are registered to rewrite the National
Senior Certificate orNATED550. Across all districts, the lowest learner enrolment is at ABET
1 level. Enrolment for ABET 4 exceeds enrolment for all other levels in all districts,
confirming that a large number of ABET learners are enrolling midway through the GETC.
Most learners are enrolled for GETC, NSC and NATED 550 which have an exit level
qualification suggesting that many learners may be enrolled at AET Centres with the
intention of obtaining a qualification.
The high numbers of learners who are enrolled for Matric equivalent courses is of
importance given that some Centres report providing very little to these learners, other than
some learning materials and past examination papers, raising questions about how
optimally facilities are being used when the numbers of learners registered for ABET 1-4
across all districts is comparatively very low. Data about what programmes are being
provided at each Centre and its Satellites also indicates that NSC and NATED 550 are
offered more frequently than ABET Programmes in all districts. Of the 47 Centres, 19
Centres provided disaggregated data for NSC and NATED 550 candidates. With the
exception of two centres (11%) all reported an increase in learners registering for the
NATED 550 qualification in 2012. This is likely due to the intention to phase out NATED 550
by 2014, closing the door to any candidate who attended school prior to the introduction of
the National Curriculum Statement (NCS) writing their matric.
Based on available data, Tshwane South District has the highest number of learners, and
similarly has the highest number of Satellite Centres (38) in the province. In comparison,
4
NATED 550 is regarded as the ‘old matric’ and is sometimes referred to as the Senior Certificate, due to be phased out by 2014Taamane AET, situated in Gauteng North, has the lowest number of learners but is covered by 12 Satellites. This is likely due to the large geographical area, as this is the largest district within Gauteng. At Centre level, numbers for NSC and NATED 550 are frequently aggregated, making it difficult to establish accurate learner numbers for each programme. As part of the audit, follow-up interviews were done with AET Centres to obtain a disaggregation of the Grade 12 learners (either NSC or NATED 550) but it could not be done in 16 (34%) of the 47 Centres. Imputed values for enrolments in these two programmes in the 16 Centres concerned were calculated, based on the ratio between these two programmes at the other centres, where disaggregated data was obtained. Overall, the vast majority (90%) of learners were registered for one of three specific programmes, namely 37043 (43%) for NSC; 29011 (34%) for ABET; and 19274 (23%) for NATED 550. With the exception of the AET Centre in Kagiso, no Centres provided complete promotion data for all programmes. The AET located in Tembisa did indicate that their promotion data for AET was not accurate as it is difficult to tell ‘older learners’ that they are not competent, and thus many are promoted to the next ABET level (Levels 1-3) without achieving competence in the prior level. Programme Number of learners Percentage ABET Levels 1 to 3 8 417 (24.4%) ABET Level 4 20594 (75.6%) Total ABET 29011 28.5& NSC 37043 48.1% NATED 550 19274 32.1% Skills 97 0.1% Total 85 485 100.00% Table 3: Learner Registration by Programme The data reported above depicts the overall trend in terms of programme uptake at provincial level. In order to show more detailed trends at micro level, Table 4 below shows programme uptake at centre and district levels. This is based on the data collected during field visits as part of the Audit. Table 4 below demonstrates that the number of candidates enrolled for ABET 4 considerably exceeds those registered for levels 1-3.
AET Main Centre District ABET1-3 ABET4 Total ABET NSC NATED550 SKILLS TOTAL
Daveyton Ekurhuleni North 215 580 795 983 374 2152
Kwazini Ekurhuleni North 39 813 852 658 603 2113
Tembisa Ekurhuleni North 182 493 675 850 960 2485
Wattville Ekurhuleni North 66 505 571 1009 362 1942
Total per programme per district 502 2391 2893 3500 2299 8692
% per programme per district 17.4% 82.6% 33.3% 40.3% 26.4%
Aaron Moeti Ekurhuleni South 193 962 1155 3330 0 4485
St Anthony's Ekurhuleni South 101 282 383 741 0 1124
Thokoza Ekurhuleni South 279 373 652 594 0 1246
ThutoMfundo Ekurhuleni South 128 108 236 637 0 873
Total per programme per district 701 1725 2426 5302 0 7728
28.90% 71.10% 31.39% 68.61%
Duduza Gauteng East 50 266 316 388 496 1200
KwaThema Gauteng East 372 620 992 1994 0 2986
Tsakane Gauteng East 229 331 560 402 488 1450
Vunanimfundo Gauteng East 110 325 435 725 0 1160
Total per programme per district 761 1542 2303 3509 984 6796
% per programme per district 33.0% 67.0% 33.9% 51.6% 14.5%
Taamane Gauteng North 272 553 825 724 16 1565
Total per programme per district 272 553 825 724 0 16
% per programme per district 33.0% 67.0% 52.7% 46.3% 1.0% 1565
Bekkersdal Gauteng West 551 593 1144 834 735 81 2794
Kagiso Gauteng West 418 605 1023 430 1385 2838
Khutsong Gauteng West 268 290 558 597 0 1155
Wedela-Siedegile Gauteng West 246 368 614 111 354 1079
Total per programme per district 1483 1856 3339 1972 2474 81 7866
% per programme per district 44.4% 55.6% 42.4% 25.1% 31.5% 1.0%
Chiawelo Johannesburg Central 36 208 244 478 370 1092
Josiah Khumalo Johannesburg Central 77 203 280 741 563 1584
PQ Vundla Johannesburg Central 58 278 336 652 396 1384
Setlakalane Molepo Johannesburg Central 11 215 226 560 259 1045
Sydney Maseko Johannesburg Central 85 83 168 562 709 1439
Total per programme per district 267 987 1254 2993 2297 6544
% per programme per district 21.3% 78.7% 19.2% 45.7% 35.1%
Alexandra Johannesburg East 185 205 390 901 1291
Denver Johannesburg East 149 394 543 362 185 1090
Ivory Park Johannesburg East 186 394 580 732 0 1312
Total per programme per district 520 993 1513 1995 185 3693
% per programme per district 34.4% 65.6% 41.0% 54.0% 5.0%
Diepkloof Johannesburg North 159 171 330 494 642 1466
Fourways Johannesburg North 378 459 837 546 0 1383
Herbert Mdingi Johannesburg North 63 380 443 349 435 1227
Peter Lengene Johannesburg North 131 405 536 402 609 1547
Total per programme per district 731 1415 2146 1791 1686 5623
% per programme per district 34.1% 65.9% 38.2% 31.9% 30.0%
21 Battalion Johannesburg South 235 1192 1427 1632 1088 4147
City Deep Johannesburg South 183 310 493 1448 1941
Total per programme per district 418 1502 1920 3080 1088 6088
% per programme per district 21.8% 78.2% 31.5% 50.6% 17.9%
Ed Mafole Johannesburg West 123 418 541 689 440 1408
Morakapula Santho Johannesburg West 288 446 734 991 31 1756
Total per programme per district 411 864 1275 1680 471 3164
% per programme per district 32.2% 67.8% 40.3% 53.1% 14.9%
Sharpeville Sedibeng East 143 315 458 950 0 1408
Tswinyane Sedibeng East 162 112 274 375 0 649
Total per programme per district 305 427 732 1325 0 2057
% per programme per district 41.7% 58.3% 35.6% 64.4%AET Main Centre District ABET1-3 ABET4 Total ABET NSC NATED550 SKILLS TOTAL Sebokeng Sedi beng Wes t 332 795 1127 1210 435 2772 Total per programme per district 332 795 1127 1210 435 2772 % per programme per district 29.5% 70.5% 40.7% 43.7% 15.7% Ga erobe Ts hwa ne North 184 486 670 580 1171 2421 Vi ctory Ts hwa ne North 107 318 425 1034 0 1459 Total per programme per district 291 804 1095 1614 1171 3880 % per programme per district 26.6% 73.4% 28.2% 41.6% 30.2% Ga egol el we Ts hwa ne South 81 279 360 438 579 1377 Hol y Tri ni ty Ts hwa ne South 191 182 373 146 737 1256 Ma mel odi Ts hwa ne South 91 546 637 385 2157 3179 Pretori a Centra l Ts hwa ne South 254 312 566 499 203 1268 Renei l we Ts hwa ne South 159 1418 1577 409 327 2313 Total per programme per district 776 2737 3513 1877 4003 9393 % per programme per district 22.1% 77.9% 37.4% 20.0% 42.6% Beths a i da Ts hwa ne Wes t 308 175 483 956 1019 2458 DWT Ntha the Ts hwa ne Wes t 163 749 912 2026 2938 Moepa thus e Ts hwa ne Wes t 117 425 542 1100 800 2442 Ha mma ns kra a l Ts hwa ne North 59 654 713 389 362 1464 Total per programme per district 647 2003 2650 4471 2181 9302 % per programme per district 24.4% 75.6% 28.5% 48.1% 23.4% Total across Gauteng 8417 20594 29011 37043 19274 97 85425 % distribution per Programme 29.0% 71.0% 34.0% 43.4% 22.6% 0.1% 99.9% Table 4: Learner enrolment numbers per Centre5 3.4 Motivation to enrol at AETs The study also sought information about why learners choose to enrol at AETs. As stated in the beginning of the report, the survey of learners used a convenience sample and is too small to be properly representative. It does indicate trends. When learners were asked what their main motivation for enrolling at an AET was, the most commonly reported motivation was “to complete my Senior Certificate” (27%), followed by “to improve my Senior Certificate” (21%).6 The next most common motivation across the province is to find a job (16%) suggesting that learners regard the GETC/matric equivalent qualification as making them more employable. It is important to note that fieldworkers visited the Centre during the day, and thus there is an inevitable bias towards students who are not working. The table below gives a breakdown per district of the reasons given by learners for enrolling in an AET. 5 The two dark cells represent the distribution of ABET learners between levels 1-3 and level 4. The lighter grey cells are totals of learner enrolment per Programme per Centre. 6 The term Senior Certificate includes both NSC and NATED 550 for this question item.
Reason
                                To       for enrolling at AET
                                complete
                                my                                                                         To assist
                                National      To            To learn to To improve                         my children Total
                                Senior        complete      read and    my senior To socialise To find a   with school number of
District                        Certificate the GETC        write       certificate with others job        work        reasons
Ekurhul eni North               44          28           29           46          31           35          35         248
                                17.7%       11.3%        11.7%        18.5%       12.5%        14.1%       14.1%      100.0%
Ekurhul eni South               18          0            8            12          9            16          7          70
                                25.7%       0.0%         11.4%        17.1%       12.9%        22.9%       10.0%      100.0%
Ga uteng Ea s t                 40          11           9            28          4            24          6          122
                                32.8%       9.0%         7.4%         23.0%       3.3%         19.7%       4.9%       100.0%
Ga uteng Wes t                  41          21           3            20          3            13          5          106
                                38.7%       19.8%        2.8%         18.9%       2.8%         12.3%       4.7%       100.0%
Joha nnes burg Centra l         50          12           12           45          12           22          10         163
                                30.7%       7.4%         7.4%         27.6%       7.4%         13.5%       6.1%       100.0%
Joha nnes burg Ea s t           29          0            6            26          5            15          8          89
                                32.6%       0.0%         6.7%         29.2%       5.6%         16.9%       9.0%       100.0%
Joha nnes burg North            41          7            11           23          10           26          11         129
                                31.8%       5.4%         8.5%         17.8%       7.8%         20.2%       8.5%       100.0%
Joha nnes burg South            6           0            1            5           1            2           2          17
                                35.3%       0.0%         5.9%         29.4%       5.9%         11.8%       11.8%      100.0%
Joha nnes burg Wes t            17          1            1            12          1            9           4          45
                                37.8%       2.2%         2.2%         26.7%       2.2%         20.0%       8.9%       100.0%
Sedi beng Ea s t                14          0            3            14          11           1           0          43
                                32.6%       0.0%         7.0%         32.6%       25.6%        2.3%        0.0%       100.0%
Sedi beng Wes t                 1           0            0            4           0            0           0          5
                                20.0%       0.0%         0.0%         80.0%       0.0%         0.0%        0.0%       100.0%
Ts hwa ne North                 19          14           15           14          9            23          14         108
                                17.6%       13.0%        13.9%        13.0%       8.3%         21.3%       13.0%      100.0%
Ts hwa ne South                 45          20           15           33          16           29          26         184
                                24.5%       10.9%        8.2%         17.9%       8.7%         15.8%       14.1%      100.0%
Ts hwa ne Wes t                 2           1            1            1           1            7           1          14
                                14.3%       7.1%         7.1%         7.1%        7.1%         50.0%       7.1%       100.0%
Total across Gauteng            367         115          114          283         113          222         129        1343
% of reasons across Gauteng       27.3%      8.6%        8.5%         21.1%       8.4%         16.5%       9.6%       100.0%
Table 5: Motivation for enrolling at an AET Centre

There have also been reports of grade 12 learners who have registered to write their Senior
Certificate under the AET Centre, though they may have been attending classes at a regular
mainstream school. Many times, such learners are those who are perceived to have limited
academic potential and schools are concerned that their poor academic performance and
likelihood of passing Grade 12 will colour the perception of their school. While the majority
of Centre Managers report that this does not happen, this may be because it is in the
interests of the Centre Manager to report higher learner enrolment figures, with the
intention of increasing the resources (staffing and budget) allocated to the Centre. During
Centre visits, Centre Managers were asked to approximate what percentage of learners
registered to write the NSC were attending classes at the Main Centre or its Satellites. The
percentage suggested in various districts ranges from 30% to 100%. This suggests that in
some districts as many as 70% of learners may be registered at the Centre but attending
elsewhere, probably at a school.
3.5 Learner numbers and average class size
The number of learners registered at each Centre ranged from 649 at Tswinyane (Sedibeng
East) to 4485 at Aaron Moeti (Ekurhuleni South). The overall mean was 1819 learners. The
table below places Centres in categories according to their enrolment.
Enrolment categories
640 to 1250 1251 to 1460 1461 to 2400 2401 to 4500
Chiawelo Alexandra City Deep 21 Battalion
Herbert Mdingi Duduza Daveyton Aaron Moeti
Khutsong Fourways Diepkloof Bekkersdal
Rand Mutual Gaegolelwe Ed Mafole Bethsaida
Setlakalane Molepo Holy Trinity Hammanskraal DWT Nthathe
St Anthony's Ivory Park Josiah Khumalo Gaerobe
Thokoza PQ Vundla Kwazini Kagiso
ThutoMfundo Pretoria Central Morakapula Santho KwaThema
Tswinyane Sharpeville Peter Lengene Mamelodi
Vunanimfundo Sydney Maseko Reneilwe Moepathuse
Wedela Tsakane Taamane Sebokeng
Victory Wattville Tembisa
Table 6: Learner enrolment
4. Findings
4.1 Learner demographics
The majority (98%) of learners are black Africans, with small proportions of Coloured, White
and Indian learners. There is a 35:65 split between males and females. Most learners are
South Africans (98%), with less than 2% having Zimbabwean, Mozambican or other
nationalities. By age, the largest group (42%) is in the 22 to 35 year-old category. There are
also substantial numbers aged 16 to 21 years (33%) or 36 to 55 years (22%).
100
98.2 98.1
90
80
70
60 64.6
50
%
40 42.5
30 33.2 35.4
20
21.8
10
0.2 0.5 1.1 2.2 0.4 0.3 1.4 0.3
0
Figure 3: Learner demographic information, by percentage90000 83824
Total number of students per criteria
80000
70000
60000 53380
49450
50000
40000
29583 29207
30000 23128
20000 15175
10000
107 244 562 1499 268 259 1175 217
0
Figure 4: Distribution of learners by nationality, age, sex and race
The average composition of an AET is thus 1783 black African learners, and a ratio of 35
males to 65 females. Most learners are in one of three age categories, namely 22 to 35 years
(759); or 16 to 21 years (593); or 36 to 55 years (389). The vast majority are South Africans
(1766 of the average of around 1786).
Black 1783
White 5
Coloured 25
Indian 6
Male 649
Female 1186
Under 16 7
16-21 593
22-35 759
36-55 389
Over 55 38
South African 1766
Zimbabwean 21
Mozambican 9
Other 4
0 200 400 600 800 1000 1200 1400 1600 1800
Figure 5: Average demographic spread of learners at Gauteng AETs
The table below shows the employment status of the learners interviewed as part of follow-
up visits. As these visits took place during the day, the sample is somewhat biased against
people who are employed.Figure 6: Learner Employment status by sex, age, and programme Overwhelmingly, the majority (54%) of learners who completed the survey are looking for work. The only exception to this is learners who are over the age of 55 years. The second largest group of learners who are unemployed and not looking for work fall within the 16-21 years age band. This would likely be those learners who are registered to complete the NSC or NATED 550 qualification. Across all programmes, the majority of the learners who are looking for work are enrolled for the NATED 550 qualification. Of the learners surveyed, more female than male learners are looking for work. This is consistent with other demographic data showing that the majority of learners attending AET Centres in Gauteng are female. Similarly, with the exception of the 55+ years age band, the proportion of learners who are employed is far outweighed by those who are unemployed whether or not they are looking for work. 4.2 Access Almost half of the learners who completed questionnaires indicated that they walk to the Centre which they attend. Just over one-third (36%) get to their Centres by taxi. The others travel by train (6%), by bus (4%), or in their own car (4%). The data shows that for 50% of the learners who responded to the questionnaire, travelling to an AET entails a cost.
Figure 7: Main means of transport to attend classes broken down by percentage

Of interest is that 79% of those who walk; 63 % of those who travel by taxi; and 75% of those
who travel in their own car, reach the Centre within half an hour or less. Most of those who
travel by bus (56%) or train (67%), on the other hand, take more than 45 minutes to reach the
Centre.

 Own car

      Bus                                                                         0-15 mins

    Train                                                                         16-30 mins
                                                                                  31-45 mins
     Taxi
                                                                                  46-240 mins
     Foot

          0.0%      10.0%    20.0%     30.0%     40.0%     50.0%       60.0%

Figure 8: Time taken to reach Centre by different means of transport

Figure 9 below however shows that about 26% of learners take less than 15 minutes and 43%
take between 15 and 30 minutes; i.e. nearly 70 % of learners take less than 30 minutes to get
to the centre.

 46-240 mins

                                                                                     Foot
  31-45 mins
                                                                                     Taxi
                                                                                     Train
  16-30 mins
                                                                                     Bus
                                                                                     Own car
    0-15 mins

             0.0%        10.0%       20.0%       30.0%       40.0%        50.0%

Figure 9: Means of transport used, by time taken to reach Centre
Learner sample data shows travel times that range from 240 minutes (for a learner enrolled
at Reneilwe centre) to only 2 minutes (for a learner enrolled at St. Anthony). Some of the
travel times noteworthy are highlighted below:
Travel time in minutes Centre name & mode of transport
240 Reneilwe (on foot)
195 Pretoria (on foot)
180 Victory (on foot)
150 Diepkloof (by train, Denver (by train)
120 ED Mafole (by train); City Deep (by taxi); St Antony(by
train), Bekkersdal (by taxi)
105 Sharpeville (by taxi)
90 Peter Lengene (on foot); Denver (by taxi)
Table 7: Distances travelled by some learners
The aspects of travel time and distances travelled by learners to the nearest AET need to be
looked at more closely in order to identify where such factors constrain participation by
potential learners in the centres. Only two Centre Managers cited transport problems as one
of the major difficulties faced by their centres. The manager of Sharpeville in Sedibeng East
reported that 40% of the learners leave early because of transport problems, and the
manager of Gaegolelwe in Tshwane West reported that one of the challenges faced is that
learners stay far away from the centre.
4.3 Vision
As per the audit, Centre Managers were asked to articulate the vision for the AET Centre
they managed, as part of the surrounding community. Three common elements came up:
that of life-long learning and improving literacy or numeracy (64%), broader developmental
issues such as poverty alleviation (51%) or the teaching of specific skills (43%). Two of the 47
Centres (4%) indicated that their vision involved operating fully-fledged AET providing
skills and academic programmes and operating on a full-time basis. Of the Centre Managers
interviewed, 34 Centres (76%) indicated that AETs should offer skills programmes;
including, but not limited to plumbing, carpentry, leather tanning, sewing, bricklaying and
welding. It is recognised that this overlaps with the mandate of Further Education and
Training Colleges (FETs).
One centre indicated that there is potential to offer skills programmes at Centres where these
Programmes are accredited by the relevant Sector Education and Training Authority
(SETA). It is recognised that this may imply a considerable administrative burden, both in
terms of materials development, teaching and assessment.
4.4 Governance and Administration
The decentralised management model adopted by GDE involves the devolution of some
management authority to District Officials who are responsible for conducting Centre visits,
collecting and integrating Centre data and managing AET Centre based issues before theseare escalated to provincial level. The audit found that the level of support provided by District Officials focussed on the implementation of ABET Levels 1-4 and did not include any support related to the NATED 550 or NSC Programmes, despite that the majority of learners enrolled at AET Centres across Gauteng are enrolled for the latter two Programmes. District visits were focussed on monitoring, curriculum support and happened more frequently during examinations. Some Centres reported receiving District Officials two to three times per week, whereas one Centre in Tshwane South reported that a District Official had visited the Centre once in two years. Centres indicated that Provincial Officials were providing curriculum support, assistance with formulating policies and structuring finances. Of the Centres visited, 80% indicated that they do prepare reports on Centre activities. However, at least one Centre located in Johannesburg North, West and Central indicated that they do not prepare reports on Centre activities. In the absence of regular visits by District Officials, this lack of monitoring and reporting can result in poor teaching and learning which goes unaddressed. Within the province, 45 Centres (96%) have a Governing Body in place with a Constitution. Among those who have a Governing Body in place, 2 of these Centres do not have a Constitution. These are located in Johannesburg North. Where there are Governing Bodies in place, members include educators, learners, community members and the Centre Manager. Examples of recent decisions taken are primarily operational in nature relating to maintenance and construction. In a small number of Centres (26%), the Governing Body had some decision making power pertaining to budgetary allocations, method of banking and payment of service providers. Among those Centres where a Governing Body is in place, five meet monthly (11 %), two (5%) have never met or taken any decisions despite having a Constitution in place, and all other Centres report meeting on a quarterly or on an ‘as needed’ basis. In Centres where Governing Body members had been trained, the training focused on financial management. There is no indication of any Centres having received any subsequent training on new developments or requirements. Centre Managers identified that Governing Body members needed training in budgeting, interviewing skills, governance, policy interpretation and labour relations. Each of these is an operational skill which would contribute to the smooth running of an AET Centre. 4.5 Financial Management Operating budgets are determined by the number of learners enrolled at a Centre. In the words of one Centre Manager, “less learners = less money”. The funding received by the Main Centre is also disbursed to Satellite Centres based on their expressed needs and requisitions. Incomplete information about what programmes are being offered at Satellites would suggest that some Main Centres are not very conversant with activities at Satellite Centres. This lack of knowledge becomes particularly problematic in light of the potential for under or over funding Satellite Centres. While some of the Main Centres report
submitting audited financial statements, it is unclear whether this is routinely done and if
so, whether this process is also able to identify any such issues at Satellite Centres.

The practice of determining Centre Managers’ salaries based on student numbers further
contributes to the incentive to maintain poor records and overstate the number of learners
enrolled. However, it is not clear whether learner numbers for NSC and NATED 550 would
influence a Centre Managers’ salary as these are not formally part of the Centres mandate. It
is likely that budgetary allocations are unreliable when there is a large discrepancy in
learners who enrol at AET Centres and those who attend and ultimately complete the
summative assessment, contributing to a high level of expenditure that has little to no result.

Learner data for NSC and NATED 550 seems to be particularly unreliable based on the data
provided at Centre level. The two Programmes are also not disaggregated in the Annual
School Survey (ASS) or SNAP Survey data.

Of the Centres visited, 44% (21) had a Finance or Procurement Committee in place that was
responsible for overseeing financial management and administration at Centre level. Centres
reported that costs related to maintenance, services and administration are typically funded
by GDE, whereas any other costs that do not fall within these categories are the
responsibility of the Centre and are funded by learner fees, donations and fund raising.
Learner fees range from Centre to Centre, but it is clear that fees are always levied for NSC
or NATED 550 Programmes. Variations in learner fees for grade 12 equivalent programmes
is consistent with procedures at Section 21 schools who are responsible for a large number of
costs other than salaries, and are thus able to determine learner fees.

4.6 Learner Registration and Data Management Processes
All Centres reported that there is a structured learner enrolment process in place, stipulating
that administrators are responsible for registering learners, and deciding when learners are
able to register and what documents are required. With the exception of Johannesburg East,
there is no systematic process of collating learner registrations within or across districts.
However, it is clear that enrolment/registration is handled differently for ABET and Matric
equivalent courses. In most Centres, there are little or no fees for ABET Programmes, while
there is a registration fee levied on NSC and NATED 550 candidates. It would seem that
many of the registration documents are paper-based, in part owing to the limited
availability of computers in some Centres. Some Centres are using the registration forms
provided by GDE which collects personal information and the curriculum offerings selected.
This form also contains fields to allocate a student number, Centre stamp and a declaration
for learners to sign. In the registration form reviewed, all of these fields were blank.
Information from Centres suggests that there are limited individual learner records, and that
monitoring tends to take place at programme level. The absence of individual learner
records makes it difficult to track learner progress and to provide remedial support as
necessary.

Placement tests are conducted for learners applying to enter ABET Programmes, and the
most recent Statement of Results collected for NSC and NATED 550 Programmes. Similarly,
it seems that learner registration takes place throughout the year for ABET, but is restricted
to January and June for NSC and NATED 550 candidates, in line with the calendar for
supplementary examinations. Learners registering for NSC are required to submit their
prior Statement of Results; narrowing the opportunity to achieve Grade 12 to those who
wished to change their subjects or did not have a site mark.

Despite GDE’s requirement that Centres maintain programme records for the preceding ten
years, it was not possible to obtain information even for 2010 in many districts. Much of the
NSC and NATED 550 data is also derived from registration for learning areas, meaning that
Centres are not able to establish how many unique candidates are registered for these
Programmes. This, along with the absence of unique learner records is a major concern. It is
also evident that Centres tend to regard NSC and NATED 550 candidates as one group, and
only a small number of Centres were routinely tracking data separately for these two
Programmes. This is also evident in that the Annual Survey (ASS) Instrument completed by
Centres provides one field for Grade 12 and no differentiation between the numbers of
learners enrolled for NATED 550 programmes or NSC programmes. GDE needs to formalise
the routine tracking of Matric equivalent candidates per Programme, in order to assess
uptake per Programme. This tracking should be based on learner numbers, and not
enrolments per learning area, as this considerably overestimates the number of learners per
Programme. Though many of the Centres were unable to provide fieldworkers with data for
2010, the information is contained in the ASS instruments prepared by the Centre. GDE has
provided Centres with a template of an Attendance Register to be completed for each class.
This template allows for educators to mark learners as present or absent and does not
stipulate that a learner needs to sign to confirm they were present. Where educators are
using this template, there is little way of establishing whether such lessons did take place.
Many Centres have created their own attendance register which does require a student to
sign and confirm attendance. This is very positive and will assist in monitoring teaching and
learning.

4.7 Learner Dropout
Centres acknowledge that attendance patterns vary at different times of the year, with
lowest attendance during winter. In the absence of a formal definition for dropout, centres
cannot report on the number of learners who have registered and then stopped attending at
the Centre. There are also instances where learners can register for exams without attending
lessons at the Centre and are thus not counted officially in learner numbers. This may affect
the number of full time equivalent posts allocated to each AET in two ways; either
overestimating learner numbers where some such learners are not receiving any curriculum
support or underestimating learner numbers (uptake) in some areas. This suggests that it
would be most useful to collect routine data subsequent to the Annual School Survey. This
will also improve the reliability of data entered into the Education Management Information
System (EMIS). One Centre reported that they count a learner as having dropped out as
someone who never wrote the exam, but there is no clear indication of whether any follow
up takes place. This highlights the need for adequate learner support and resource-based
learning materials for independent study so that a learner can remain in the system and feel
adequately prepared to write the exam.

The majority of Centres (57%) acknowledged that operating hours affected attendance and
participation. Some of the reasons for learner dropout cited by Centre Managers included
that AET Centres were not meeting their skills needs, the lack of textbooks for NSC
candidates and learners wanting to register for Grade 12 after ABET 4. These are all systems
barriers. Other reasons cited were socio-economic in nature such as pregnancy, poverty and
unemployment which are beyond the influence of GDE. All Centres in Gauteng East
reported that participation was affected by operating hours, and reasons presented were
socio-economic in nature.

When learners were asked the same question, 37% of learners indicated that they knew a
learner who had stopped attending. Reasons cited included family problems, the distance to
the Centre being too great, work commitments and that there were insufficient learning
materials. The first three reasons are socio-economic, while the fourth is a systems issue
which requires attention. Table 8 gives a summary of the common reasons cited by learners.

The shortage of learner materials for NSC and NATED 550 candidates was raised as a
challenge for Centres. Interestingly, issues around distance being too far are particularly
prominent in Johannesburg Central despite it having a high number of Centres and being
one of the smallest districts in the province. Examples of these have been reported in
paragraph 4.2 above.
Reason for dropout
Learning Total
Travelling Alternative materials Not Family reasons
Subjects did Time of distance centre Educators Educators Learner Work is too were sufficient moved to
not match classes was was too closer to are not well could not Family Work time difficult to learning another
District needs inconvenient much home unreliable prepared afford fees problems commitments consuming understand materials area Other
Ekurhuleni North 14 14 16 15 18 17 21 21 23 21 22 27 25 25 279
5.0% 5.0% 5.7% 5.4% 6.5% 6.1% 7.5% 7.5% 8.2% 7.5% 7.9% 9.7% 9.0% 9.0%
Ekurhuleni South 1 1 0 0 0 2 0 0 0 0 0 3 0 0 7
14.3% 14.3% 0.0% 0.0% 0.0% 28.6% 0.0% 0.0% 0.0% 0.0% 0.0% 42.9% 0.0% 0.0%
Gauteng East 2 3 3 3 5 2 2 5 5 2 0 3 4 1 40
5.0% 7.5% 7.5% 7.5% 12.5% 5.0% 5.0% 12.5% 12.5% 5.0% 0.0% 7.5% 10.0% 2.5%
Gauteng West 4 4 4 4 2 1 1 8 4 3 2 3 1 2 43
9.3% 9.3% 9.3% 9.3% 4.7% 2.3% 2.3% 18.6% 9.3% 7.0% 4.7% 7.0% 2.3% 4.7%
Johannesburg Central 3 2 14 2 1 9 6 10 5 3 4 7 4 3 73
4.1% 2.7% 19.2% 2.7% 1.4% 12.3% 8.2% 13.7% 6.8% 4.1% 5.5% 9.6% 5.5% 4.1%
Johannesburg East 1 0 0 0 1 3 4 0 0 0 1 3 0 3 16
6.3% 0.0% 0.0% 0.0% 6.3% 18.8% 25.0% 0.0% 0.0% 0.0% 6.3% 18.8% 0.0% 18.8%
Johannesburg North 4 5 10 4 6 5 4 10 9 4 6 7 4 1 79
5.1% 6.3% 12.7% 5.1% 7.6% 6.3% 5.1% 12.7% 11.4% 5.1% 7.6% 8.9% 5.1% 1.3%
Johannesburg South 0 0 0 0 0 0 0 0 0 0 0 0 1 0 1
0.0% 0.0% 0.0% 0.0% 0.0% 0.0% 0.0% 0.0% 0.0% 0.0% 0.0% 0.0% 100.0% 0.0%
Johannesburg West 6 5 7 2 7 3 4 5 5 2 4 6 3 2 61
9.8% 8.2% 11.5% 3.3% 11.5% 4.9% 6.6% 8.2% 8.2% 3.3% 6.6% 9.8% 4.9% 3.3%
Sedibeng East 0 0 0 2 0 0 0 1 1 0 0 1 1 1 7
0.0% 0.0% 0.0% 28.6% 0.0% 0.0% 0.0% 14.3% 14.3% 0.0% 0.0% 14.3% 14.3% 14.3%
Sedibeng West 0 0 0 0 0 0 0 0 2 0 0 1 0 0 3
0.0% 0.0% 0.0% 0.0% 0.0% 0.0% 0.0% 0.0% 66.7% 0.0% 0.0% 33.3% 0.0% 0.0%
Tshwane North 4 5 9 4 1 0 3 11 4 4 7 5 4 4 65
6.2% 7.7% 13.8% 6.2% 1.5% 0.0% 4.6% 16.9% 6.2% 6.2% 10.8% 7.7% 6.2% 6.2%
Tshwane South 7 7 7 8 4 3 11 11 8 6 3 7 6 2 90
7.8% 7.8% 7.8% 8.9% 4.4% 3.3% 12.2% 12.2% 8.9% 6.7% 3.3% 7.8% 6.7% 2.2%
Tshwane West 1 0 3 0 0 0 0 0 1 0 0 1 0 3 9
11.1% 0.0% 33.3% 0.0% 0.0% 0.0% 0.0% 0.0% 11.1% 0.0% 0.0% 11.1% 0.0% 33.3%
Total across Gauteng 47 46 73 44 45 45 56 82 67 45 49 74 53 47 773
% of reasons 6.1% 6.0% 9.4% 5.7% 5.8% 5.8% 7.2% 10.6% 8.7% 5.8% 6.3% 9.6% 6.9% 6.1% 100.0%
Table 8: Reasons for dropout indicated by learnersDuring interviews Centre Managers were asked what the GDE should do to address the
drop-out rate. Some common suggestions given include:
Providing buildings and other facilities for the AETs
Appointing qualified and experienced educators
Organising transport for learners
Curriculum change- moving from academic to skills programmes
Support with advocacy – running community workshops, mounting radio and
television awareness programmes and advertising in the local newspapers
Providing textbooks to learners
Monitoring Centre Managers
Promoting weekend lessons for working learners.
4.8 Interactions with Satellites
Satellite Centres were in place across all Districts, with the greatest number of Satellites
being located in Gauteng West. There is no correlation between overall enrolment figures
and the number of Satellites per district, suggesting that some Satellites may be in place
because districts are geographically larger, to ensure adult education opportunities are
available in remote areas. This is particularly the case in Tshwane North and Tshwane West.
All districts reported having a good relationship with Satellites and with educators teaching
at both the Main Centre and surrounding Satellites. Administrative tasks and duties take
place at the Main Centre in Ekurhuleni North and Sedibeng East. There is some variation in
the programmes being offered between Main Centres and Satellites, where the predominant
pattern in some Districts is to only offer NSC and NATED 550 at Main Centres, and ABET 1-
3 at Satellites. When reviewing NSC and NATED 550 data, Johannesburg North and
Johannesburg South were the only two districts offering NSC and NATED 550 Programmes
at both Main Centres and Satellites.
With the exception of Gauteng West, new Satellites had been opened in all districts in the
past five years. As indicated previously, Gauteng West already has the highest number of
Satellites in the province. Despite Sedibeng East and Sedibeng West reporting very low
learner numbers, they are the only two districts where no Satellites had been closed in the
past five years.
Information on what programmes are being offered at Satellite Centres is inconsistent in 11
of the 15 districts. Districts where information is consistent are Ekurhuleni North,
Johannesburg North, Johannesburg South and Tshwane North.
The inconsistent information about the number of learners on different programmes at
Satellite Centres occurs across all programmes (ABET 1 – NATED 550), but is most common
for the NSC and NATED 550 programmes. This may be owing to the indication by many
Centres that they only function as exam Centres and do not provide on-going support orYou can also read