Deoxygenation in Marginal Seas of the Indian Ocean - Frontiers
←
→
Page content transcription
If your browser does not render page correctly, please read the page content below
ORIGINAL RESEARCH
                                                                                                                              published: 25 February 2021
                                                                                                                         doi: 10.3389/fmars.2021.624322

                                            Deoxygenation in Marginal Seas of
                                            the Indian Ocean
                                            S. Wajih A. Naqvi* †
                                            Council of Scientific & Industrial Research, New Delhi, India

                                            This article describes oxygen distributions and recent deoxygenation trends in three
                                            marginal seas – Persian Gulf and Red Sea in the Northwestern Indian Ocean
                                            (NWIO) and Andaman Sea in the Northeastern Indian Ocean (NEIO). Vertically mixed
                                            water column in the shallow Persian Gulf is generally well-oxygenated, especially
                                            in winter. Biogeochemistry and ecosystems of Persian Gulf are being subjected to
                                            enormous anthropogenic stresses including large loading of nutrients and organic
                                            matter, enhancing oxygen demand and causing hypoxia (oxygen < 1.4 ml l−1 ) in central
                                            and southern Gulf in summer. The larger and deeper Red Sea is relatively less affected
                                            by human activities. Despite its deep water having remarkably uniform thermohaline
                                            characteristics, the central and southern Red Sea has a well-developed perennial
                                            oxygen minimum at mid-depths. The available data point to ongoing deoxygenation
                         Edited by:
                                            in the northern Red Sea. Model simulations show that an amplified warming in the
                      Xianghui Guo,         marginal seas of the NWIO may cause an intensification of the Arabian Sea oxygen
             Xiamen University, China       minimum zone (OMZ). Increases in particulate organic carbon and decreases in oxygen
                       Reviewed by:         contents of the outflows may also have a similar effect. In the Andaman Sea, waters
                            Tim Rixen,
    Leibniz Centre for Tropical Marine      above the sill depth (∼1.4 km) have characteristics similar to those in the Bay of Bengal,
             Research (LG), Germany         including an intense OMZ. As in the case of the Bay of Bengal, oxygen concentrations
                          Birgit Gaye,
     University of Hamburg, Germany
                                            within the Andaman Sea OMZ appear to have declined slightly but significantly between
                  *Correspondence:
                                            early 1960s and 1995. The exceedingly isothermal and isohaline water that fills the deep
                    S. Wajih A. Naqvi       Andaman Basin is also remarkably homogenous in terms of its oxygen content. A very
                    wnaqvi@iitk.ac.in       slight but statistically significant decrease in oxygen content of this water also seems to
                  † Present address:        have occurred over three decades preceding 1995. New information is badly needed
                    S. Wajih A. Naqvi,
Department of Earth Sciences, Indian        to assess the extent of further change that may have occurred over the past 25 years.
Institute of Technology, Kanpur, India      There have been some reports of coastal “dead zones” having developed in the Indian
                                            Ocean marginal seas, but they are probably under-reported and the effects of hypoxia
                   Specialty section:
         This article was submitted to      on the rich and diverse tropical ecosystems – coral reefs, seagrasses, and mangroves –
             Marine Biogeochemistry,        in these seas remain to be investigated.
               a section of the journal
          Frontiers in Marine Science       Keywords: deoxygenation, Indian Ocean, Red Sea, Persian Gulf, Andaman Sea, marginal seas
         Received: 31 October 2020
         Accepted: 21 January 2021
        Published: 25 February 2021         INTRODUCTION
                             Citation:
    Naqvi SWA (2021) Deoxygenation
                                            The northern Indian Ocean is distinguished by several unusual oceanographic processes arising
in Marginal Seas of the Indian Ocean.       from its unique geographical setting. The presence of landmass that limits the Indian Ocean at
           Front. Mar. Sci. 8:624322.       rather low latitudes (∼25◦ N) has a profound impact on its climate in the form of seasonally
    doi: 10.3389/fmars.2021.624322          reversing winds – the monsoons. Regional geomorphology dominantly controls climate dynamics,

Frontiers in Marine Science | www.frontiersin.org                                   1                            February 2021 | Volume 8 | Article 624322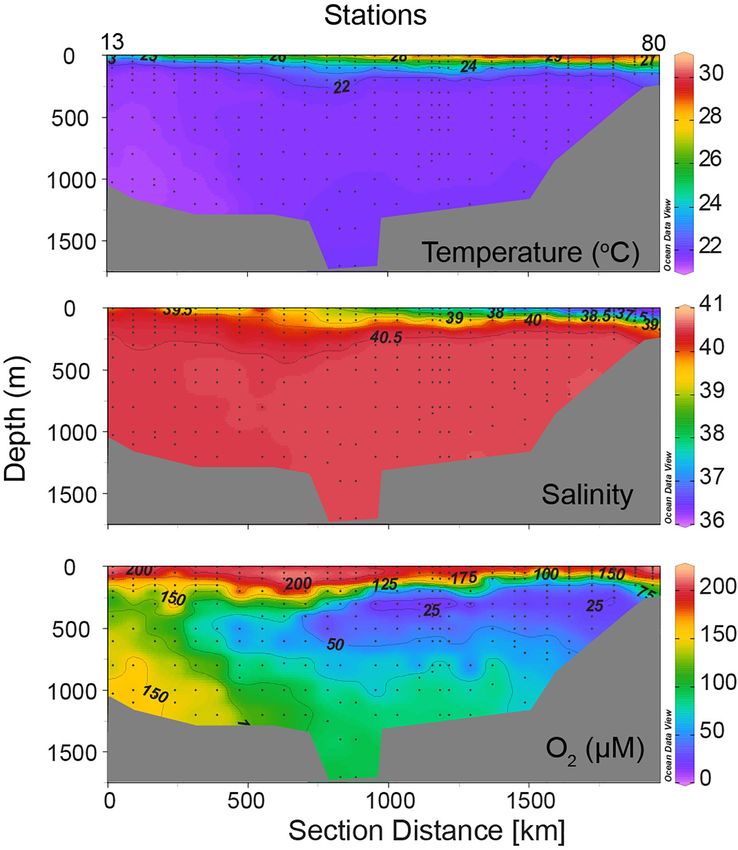
Naqvi                                                                                                                  Indian Ocean Marginal Seas Deoxygenation

particularly the distribution of monsoonal energy and rainfall,               separating from the African Plate during the late Oligocene, ∼25
and the resultant variability of oceanographic processes. The                 million years before present (Ma) (Stern and Johnson, 2010),
contribution of orography (especially the presence of the                     creating the Red Sea, and as the Arabian Plate collided with
Himalayas, Western Ghats, and East African Highlands) is crucial              the Eurasian Plate, the Persian Gulf was formed during the
in this regard (e.g., Chakraborty et al., 2002). Also important is            early Miocene (23–16 Ma) (Allen et al., 2004). The two basins
the eastward sloping of the Deccan Peninsula and the Ganges                   are quite different in terms of the geomorphology. The Red
Basin (east of the Delhi Ridge) as a result of which most South               Sea is ∼1,930 km long, extending in the SSE-NNW direction
Asian rivers flow into the Bay of Bengal (the Northeastern Indian             from the Strait of Bab-el-Mandeb (latitude 12.58◦ N, longitude
Ocean, NEIO) and not into the Arabian Sea (the Northwestern                   43.33◦ E) up to latitude ∼28◦ N, where it bifurcates into the Gulf
Indian Ocean, NWIO). This creates a fresher, warmer surface                   of Suez and the Gulf of Aqaba. It is on an average ∼280 km
layer and a very strong thermohaline stratification in the NEIO               wide, and measures ∼438,000 km2 in area (Morcos, 1970).
(Naqvi et al., 2006). Moreover, winds are generally weaker in the             Much of the Red Sea is comprised of shallow shelves, but the
NEIO than in the NWIO, which in conjunction with the strong                   central axial trough is quite deep, reaching a maximum depth
stratification prevents large-scale upwelling of cold subsurface              of ∼3,000 m; the average depth is 491 m (Morcos, 1970).
waters, even along the eastern boundary (e.g., off Myanmar –                  The Red Sea is a silled basin connected to the Gulf of Aden
Naqvi et al., 2006). Together these processes create favorable                through the Strait of Bab-el-Mandeb where the maximum depth
conditions for large-scale deep convection in the atmosphere,                 is 160 m according to Sofianos and Johns (2007) and 137 m
providing positive feedback to rainfall (Shenoi et al., 2002), which          according to Lambeck et al. (2011).
is quite high in the NEIO. Consequently, the NEIO is a region                     Like the Red Sea, the Persian Gulf is also almost completely
of highly positive water balance (large excess of precipitation               land-locked, having only a narrow connection to the Arabian
and runoff over evaporation). The situation is quite different                Sea through the Gulf of Oman at the Hormuz Strait (latitude
in most of the NWIO, where strong southwesterly winds drive                   26.6◦ N, longitude 56.25◦ E); however, unlike the Bab-el-Mandeb
intense and large-scale upwelling (Naqvi et al., 2006), resulting             the Hormuz Strait does not have a sill. The Persian Gulf is
in low sea surface temperatures (SSTs) during summer in the                   bounded in the northwest by the Tigris-Euphrates Delta at
western Arabian Sea, greatly contributing to regional aridity.                ∼30◦ N latitude, in the east by Iran and in the west by the
The freshwater runoff is very modest and the rainfall is scanty               Arabian Peninsula. The Persian Gulf basin is wedge-shaped.
except along the west coast of India. As a result, except for a               It is about 1,000 km long, but with a maximum width of
narrow belt in the eastern Arabian Sea, evaporation far exceeds               336 km, the total area of the Persian Gulf is only 251,000 km2
precipitation and runoff (Prasad, 2004). The contrasting climatic             (Sheppard et al., 2010). With reference to the main axis the
and hydrographic conditions in the NWEO and NWIO are also                     bottom topography of the Persian Gulf is highly asymmetrical
reflected in oceanographic characteristics of the marginal seas, as           with a steep slope on the Iranian side and a very gentle slope
described below.                                                              on the Arabian side. Thus, the deepest part of the Persian Gulf
    Of the three marginal seas of the Indian Ocean, two (the                  is off the Iranian coast, but even here the water depth does
Red Sea and Persian Gulf) are connected to the NWIO, while                    not exceed ∼90 m. The average depth of the Persian Gulf is
the third (the Andaman Sea) forms a part of the NEIO                          only 36 m, and so, in spite of a fairly large area, the total
(Figure 1). The Mediterranean-type marginal seas of the NWIO                  volume of the Persian Gulf is only ∼8,600 km3 (Sheppard et al.,
have been fairly well investigated (Morcos, 1970; Grasshoff,                  2010) about 1/27 of the volume of the Red Sea (∼233,000 km3 )
1975, 1976; Brewer and Dyrssen, 1985; Yao et al., 2014a,b;                    (Morcos, 1970).
Al-Yamani and Naqvi, 2019). In comparison, oceanographic                          The Andaman Sea extends ∼1,250 km from Myanmar to
processes of the Andaman Sea are not so well known                            Sumatra (Indonesia). This basin was formed by the oblique
(Sen Gupta et al., 1981; Sarma and Narvekar, 2001; Jithin                     converging boundaries of the Indian Oceanic Plate and South
and Francis, 2020). All three marginal seas are connected                     East Asian Plate, a process that started in the early Cretaceous
to open ocean basins having some of the most intense                          and is still ongoing (Scaife et al., 2010). The Andaman-Nicobar
mesopelagic oxygen minimum zones (OMZs) of the world                          island arc created during this process bounds the basin in the
oceans, although the redox status of these OMZs are quite                     west. Due to the complex tectonics the bottom topography is
different (Rao et al., 1994; Naqvi et al., 2006; Bristow et al., 2017).       quite rugged (Cochran, 2010). The East Basin is the largest and
Utilizing historical and the most recent data available in public             deepest basin of the Andaman Sea where the maximum depth
domain (Table 1), the present study investigates distributions                exceeds 4,200 m. To the north and east of this basin lies the broad
of dissolved oxygen and current trends of deoxygenation                       continental shelf of Myanmar and Thailand, with the Irrawaddy
in these basins.                                                              Delta in the north being another prominent geographical feature.
                                                                              The average depth of the Andaman Sea is 1,096 m.1 However,
                                                                              the connection with the Bay of Bengal through the deepest
STUDY AREAS                                                                   saddle in the Andaman-Nicobar Ridge is only ∼1,400 m deep at
                                                                              the Great Passage (as determined by the divergence of vertical
Geological and Geographical Settings
The marginal seas of the NWIO were formed as a result of
tectonic movement of the Arabian Plate. The Arabian Plate began               1
                                                                                  http://bse.sci-lib.com/article057639.html

Frontiers in Marine Science | www.frontiersin.org                         2                                             February 2021 | Volume 8 | Article 624322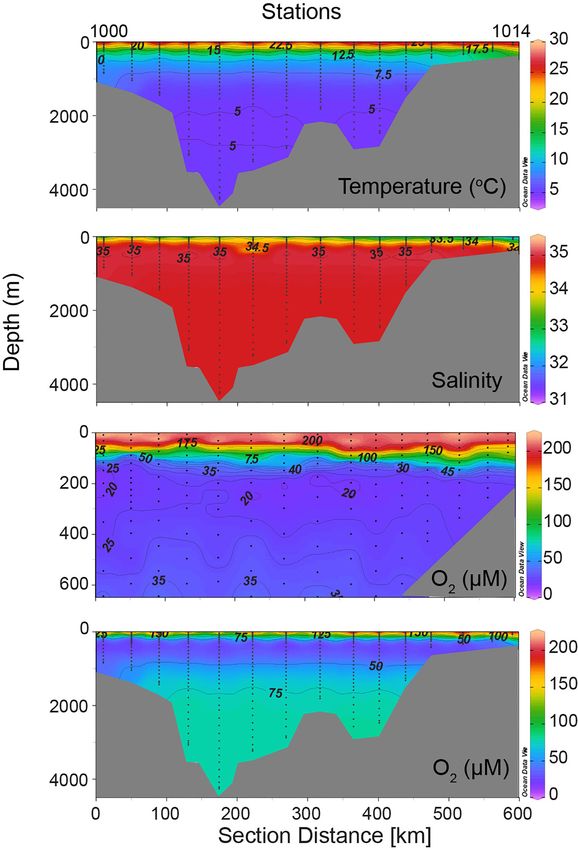
Naqvi                                                                                                                      Indian Ocean Marginal Seas Deoxygenation

  FIGURE 1 | The marginal seas of the Indian Ocean and locations of stations constituting vertical sections presented in Figures 2, 4, 5: (A) Red Sea, R.V. Sagar
  Kanya cruise in May 1983 (black symbols); (B) Persian Gulf, R.V. Atlantis II cruise in February 1977; and (C) Andaman Sea, R.V. Knorr cruise in October 1995. The
  red symbols in (A) denote locations of GEOSECS Station 407 and the two Tyro stations data from which are compared with Sagar Kanya data in Figure 3.

profiles of temperature within and just outside the Andaman                           in order to maintain the salt balance, there must also be export
Basin – Naqvi et al., 1994).                                                          of more saline waters out of these basins. This mostly occurs
                                                                                      close to the bottom by outflowing currents through the Straits of
Hydrography and Oxygen Distribution                                                   Bab-el-Mandeb and Hormuz. Estimates of respective inflows and
As stated above, the Red Sea and the Persian Gulf on one hand                         outflows are ∼12,620 km3 year−1 and 11,680 km3 year−1 for the
and the Andaman Sea on the other are located in contrasting                           Red Sea (Murray and Johns, 1997), and 7,250 km3 year−1 and
climatic regimes. Moreover, unlike the Andaman Sea, the Red                           6,620 km3 year−1 for the Persian Gulf (Sheppard et al., 2010).
Sea, and the Persian Gulf are almost land locked. Evaporation                         Circulation in the Hormuz Strait is two layered: surface water
rates in both basins are exceedingly high (>2 m year−1 ) while                        from the Gulf of Oman flows in through the northern part of the
rainfall is negligible (Sofianos et al., 2002; Sheppard et al., 2010).                strait, although a part of it re-circulates and flows out through
While the Red Sea does not receive any river runoff, some                             the southern part, while the dense, high-salinity water exits the
freshwater flow does occur into the Persian Gulf, although it                         Persian Gulf close to the bottom throughout the year with little
is quite modest (35–133 km3 year−1 ) and restricted to the                            seasonal variability (Johns et al., 2003; Pous et al., 2015). A two-
northwestern region, mainly from the Shatt al-Arab River which                        layer circulation also prevails in the Bab-el-Mandeb Strait for
carries the combined flows from the Tigris, Euphrates, and Karun                      most parts of the year, but in the summer (June–September)
rivers (Sheppard et al., 2010). The resultant Mediterranean-type                      northwesterly winds drive weak outflow at the surface while
(anti-estuarine) exchanges (near surface inflow and near-bottom                       strong intrusion of Gulf of Aden Intermediate Water (GAIW)
outflow) between the Red Sea and the Persian Gulf with the                            occurs at mid-depth above the greatly weakened outflowing
Gulf of Aden and Gulf of Oman, respectively, are primarily                            current close to the bottom (Maillard and Soliman, 1986; Murray
driven by the highly negative water balance. That is, in order                        and Johns, 1997; Sofianos et al., 2002; Sofianos and Johns, 2007;
to compensate for the net loss of water within these basins,                          Yao et al., 2014a). The outflows from the Red Sea and the Persian
there is inflow of fresher waters from the Gulf of Aden and the                       Gulf, easily distinguished by prominent salinity maxima, spread
Gulf of Oman. However, these inflows also bring in salt, and                          widely across the NWIO with their cores located around 27.2 and

Frontiers in Marine Science | www.frontiersin.org                                 3                                          February 2021 | Volume 8 | Article 624322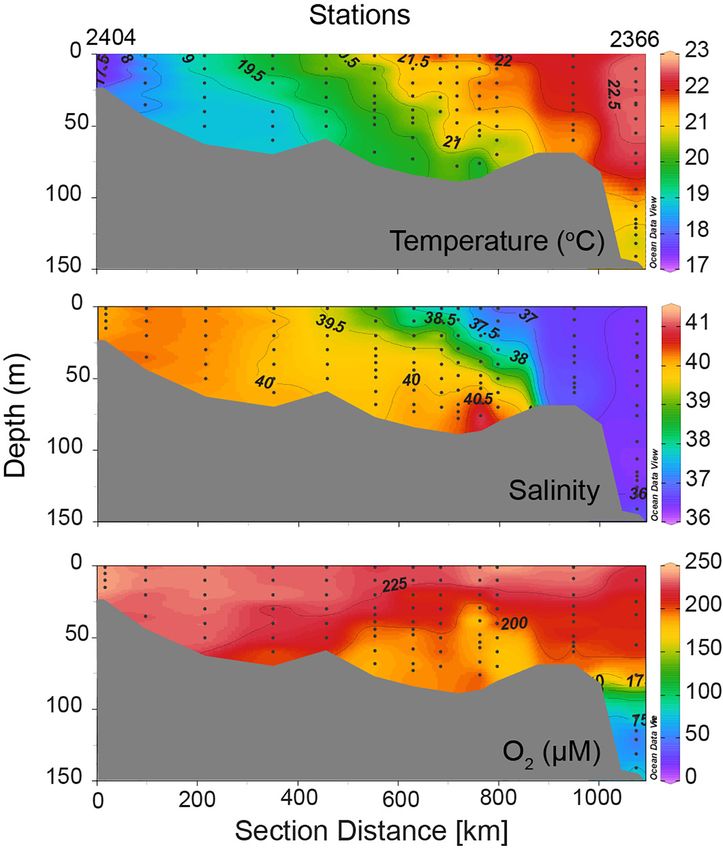
Naqvi                                                                                                                         Indian Ocean Marginal Seas Deoxygenation

TABLE 1 | Sources of data.

Red Sea
Vessel/platform, project/program               Period                                Data availability                               Remarks/reference
                                                                                     URL
R.V. Melville                                  December 1977                         https://epic.awi.de/id/eprint/34721/1/          Weiss et al., 1983
GEOSECS Indian Ocean Leg 4                                                           indian-exped_geosces.pdf
R.V. Sagar Kanya                               May 1983                              https://did.nio.org/                            Sections unpublished, but data
Test Trial III Cruise                                                                                                                used by Naqvi et al. (1986)
R.V. Tyro                                      May 1992, February 1993               National Centers for Environmental
Cruises 43 and 52                                                                    Information, National Oceanic and
Netherlands Indian Ocean Program                                                     Atmospheric Administration (NOAA)
                                                                                     https://www.nodc.noaa.gov
Argo floats                                    September 29, 2015–February 19,       http://www.ifremer.fr/co-argoFloats/float?
#6901573 #6901577                              2017                                  ptfCode=6901573&lang=en\penalty-\@M
EURO-ARGO                                      September 30, 2015–December           http://www.ifremer.fr/co-argoFloats/float?
                                               29, 2016                              ptfCode=6901577&lang=en
Persian Gulf
Vessel, project/program                        Period                                Data availability                               Remarks/reference
                                                                                     URL
R.V. Lesnoye                                   September 1968                        https://www.nodc.noaa.gov                       Al-Said et al., 2018
Cruise 188
R.V. Atlantis II                               February 1977                         https://www.nodc.noaa.gov                       Brewer et al., 1978; Brewer and
Cruise 2968                                                                                                                          Dyrssen, 1985
R.V. Mukhtabar al-Bahr                         September–October 2000                                                                Read from: Al-Ansari et al., 2015
                                               February–March 2001
KISR’s research boats                          July 19, 2011, April 30, 2017                                                         Al-Yamani et al., 2020; raw data
                                                                                                                                     provided by Faiza Al-Yamani
Andaman Sea
Vessel project/program                         Period                                Data availability                               Remarks/reference
                                                                                     URL
R.V. Vityaz                                    March 1961                            https://www.nodc.noaa.gov
Cruise 9506
International Indian Ocean Expedition (IIOE)
U.S.S. Serrano                                 November–December 1961                https://www.nodc.noaa.gov                       Cast 55 data suspect; not included
Cruise 545
IIOE
U.S.S. Serrano                                 March 1963                            https://www.nodc.noaa.gov
Cruise 90
IIOE
I.N.S. Kistna                                  September 1963                        https://www.nodc.noaa.gov                       Only Cast 212 data included
Cruise 414
IIOE
R.V. Kushi Maru                                November 1963                         https://www.nodc.noaa.gov
Cruise 30184
IIOE
R.V. Pioneer                                   April 1964                            https://www.nodc.noaa.gov
Cruise 201
IIOE
I.N.S. Kistna                                  August 1964                           https://www.nodc.noaa.gov                       Only Cast 309 data included
Cruise 409
IIOE
R.V. Knorr                                     October 1995                          https://www.nodc.noaa.gov                       Talley, 2013
Cruise 14517
World Ocean Circulation Experiment
(WOCE)

26.5 σθ surfaces (Wyrtki, 1971). They play an important role in                      cooling of high-salinity waters in winter. In the Red Sea this
mesoplelagic water mass structure and biogeochemical cycling                         happens in the northern extreme of the Red Sea proper and in
in the NWIO (Naqvi et al., 2006). Dense waters within the two                        the Gulf of Suez and Gulf of Aqaba (Wyrtki, 1974). While the
seas, from which these outflows originate, are formed through                        upper deep water (above ∼300 m), which is the source of the

Frontiers in Marine Science | www.frontiersin.org                                4                                             February 2021 | Volume 8 | Article 624322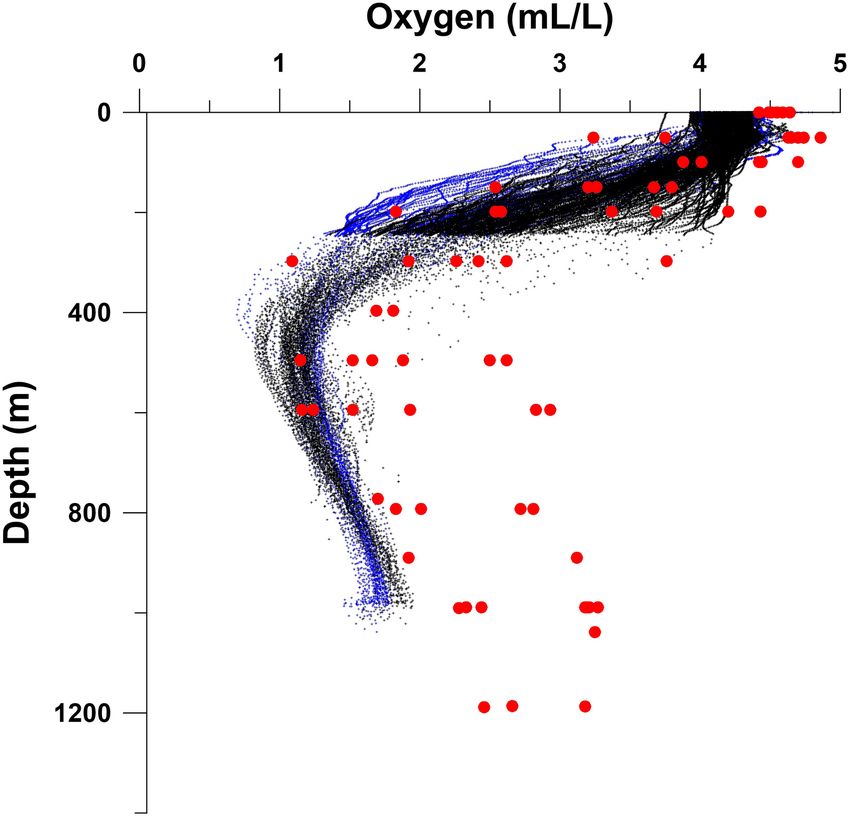
Naqvi Indian Ocean Marginal Seas Deoxygenation
outflow, is formed in the northern Red Sea (Cember, 1988; Yao expected to be the most intense in the southern Red Sea. Such is
et al., 2014b), the deeper waters are supplied by the two gulfs not exactly the case. However, it must be pointed out that the deep
(Woelk and Quadfasel, 1996; Plahn et al., 2002). central axis of the Red Sea is a relatively narrow and elongated
Despite the very similar geographical and climatic settings feature (Figure 1A). In such a system benthic processes are
there are three important depth-related hydrographic differences expected to substantially influence water column characteristics
between the Red Sea and the Persian Gulf: (1) The Persian through lateral exchanges/mixing, and this might contribute
Gulf is far more rapidly ventilated (renewal time ∼1.2 year – to the observed slight deviation of oxygen distribution from
Al-Said et al., 2018) than the Red Sea (renewal time 36 years the expected trend. Moreover, the presence of eddies (Sofianos
according to Cember (1988), and 40–90 years according to Woelk and Johns, 2003, 2007; Yao et al., 2014b) might also cause the
and Quadfasel (1996); (2) water column in the Persian Gulf observed patchiness.
is, in general, vertically well mixed; and (3) seasonality is far In order to check the representativeness of the Sagar Kanya
more pronounced throughout the Persian Gulf as reflected by data, oxygen profiles from three selected Sagar Kanya stations
the very wide SST range (∼12–35◦ C – Al-Yamani et al., 2004; are compared in Figure 3 with those from nearby sites sampled
Al-Said et al., 2018). on other cruises (SK Station 40 with GEOSECS 407, sampled
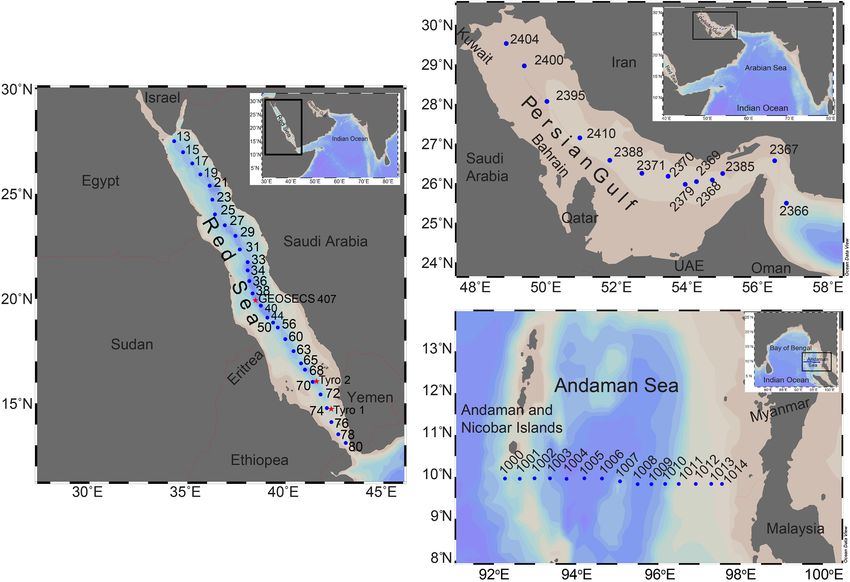
Distributions of temperature, salinity and dissolved oxygen on board R.V. Melville on December 22, 1977; SK Stations 70
along the main axes of the Red Sea and the Persian Gulf are and 74 with two stations sampled on board R.V. Tyro during
presented in Figures 2, 4, respectively. While the data from the Netherlands Indian Ocean Program on February 03, 1993
the Red Sea were collected by the author on board R.V. Sagar and May 27, 1992, respectively). Although sampled over 5 years
Kanya in May 1983, those from the Persian Gulf were generated apart and in different seasons, the GEOSECS 407 and SK Station
during a cruise of R.V. Atlantis II in February 1977 (Brewer 40 profiles are remarkably similar. The Sagar Kanya data also
et al., 1978; Brewer and Dyrssen, 1985). Despite marked seasonal compare well with the Tyro data collected 9 years later, indicating
changes that are known to occur, especially in the Persian Gulf, that oxygen distribution seen in Figure 2 is typical of the Red Sea.
these data adequately describe main features of hydrography and Observations in the Persian Gulf (Figure 4) show weak or
spatial oxygen variability in the two seas, and highlight their no thermal stratification. This is because of low atmospheric
depth-dependent differences. temperatures and shallow depths ensure vertical mixing
As the Sagar Kanya observations were made in early summer, throughout the water column. However, the density does
the effect of winter cooling could still be seen in lower SSTs increase with depth. As the Persian Gulf basin is not separated
and relatively weaker thermocline near the northern end of by a sill, the Gulf Deep Water formed along the coasts of Kuwait
the transect, close to the formation zones of deep waters. The and UAE is not topographically confined. The highest densities
isothermal and isohaline character of deep water is evident from (σθ reaching up to 29.856) occurred off UAE on this cruise. In
the temperature and salinity panels (Figure 2). The mean values comparison the maximum σθ value off Kuwait was 29.36 (winter-
(±SD) for temperature and salinity at depths ≥400 m at and time density has increased greatly off Kuwait in recent years –
south of Station 25 are 21.709 ± 0.035 and 40.569 ± 0.019◦ C, Al-Said et al., 2018). The highest density in the deepest part of the
respectively, with a σθ value of ∼28.59. In fact, the deep Persian Gulf in the south was slightly lower (σθ 29.159 at 76 m at
water in the Red Sea is warmer and more saline than in Station 2368), but the near-bottom densities were quite variable
any other marine basin (WOA-182 ). Despite the remarkably (σθ 28.388–29.36 north of Station 2385) along the transect.
uniform thermohaline characteristics, oxygen concentrations are However, as in the case of the Red Sea Outflow, the density of
not uniformly distributed within this layer. Instead, the Red Sea water that flows out of the Persian Gulf and spreads into the Gulf
exhibits a typical mid-depth oxygen minimum observed in most of Aden and then in the Arabian Sea is much lower (σθ 26.5 –
other parts of the ocean (Figure 2). The oxygen distribution Wyrtki, 1971), reflecting modification of this watermass through
pattern is similar to that reported by Sofianos and Johns (2007), mixing in the Hormuz Strait region (Swift and Bower, 2003).
except that the minimum associated with the intruding GAIW Considering the above-mentioned estimates of the volumes of
with its core around 75 m, reported by these authors, is not seen water within the Persian Gulf and of the outflows and inflows,
in the Sagar Kanya data. This is consistent with the observations the flushing time of Persian Gulf is just over 1 year (Al-Said et al.,
of Murray and Johns (1997) in terms of the timing of initiation of 2018), and this is reflected by the well-oxygenated conditions
the GAIW intrusion. Subsurface oxygen concentrations generally prevailing in the water column. There is one other data set
decrease southward from the source regions of deep water, but with basin-wide oxygen measurements made on a cruise of F.S.
the distribution is somewhat patchy, arising from the complex Meteor in the Persian Gulf slightly later in the year (March–
balance between supply and consumption. One would expect April 1965), that shows similar distribution pattern (Grasshoff,
respiration, fuelled by organic matter exported from the euphotic 1976). Oxygen concentrations below 70% saturation at mid
zone, to be important in controlling the intensity of the oxygen depths in the southern Gulf were observed on this occasion.
minimum. Going by the chlorophyll distribution, the southern At one station located in the central Gulf off Iran, however,
extreme of the Red Sea is more productive than the central a single near-bottom sample had 1.84 ml l−1 O2 (82.11 µM),
and northern parts (Brewin et al., 2015), and as it is also most ∼36% of the saturation value; at two other nearby stations the
downstream of the deep water flow, the oxygen minimum is observed oxygen depletion was more moderate (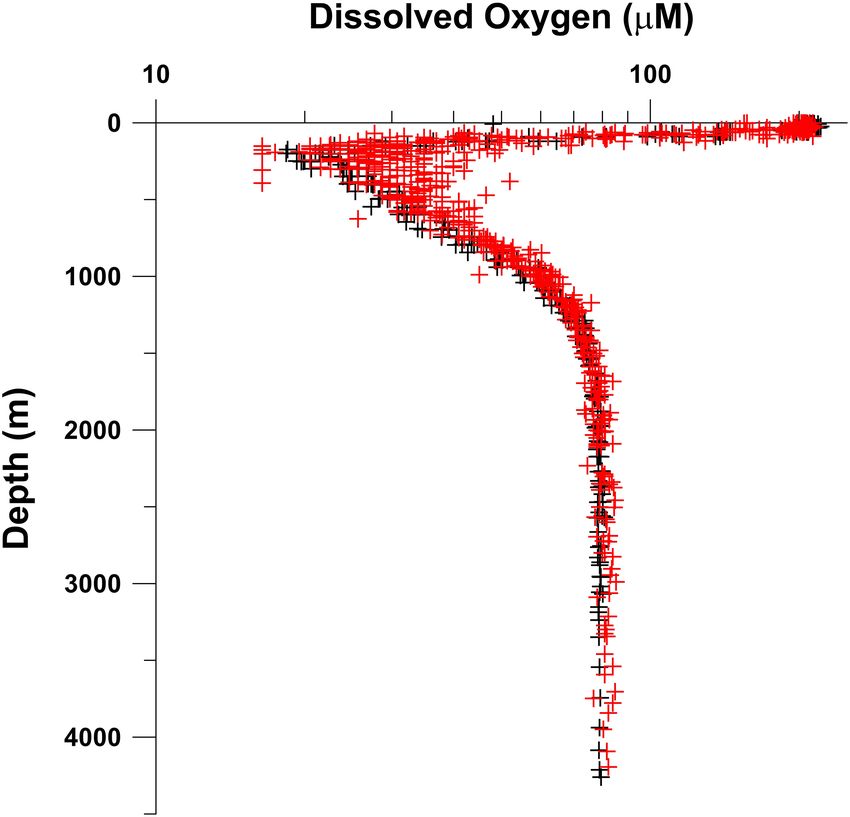
Naqvi                                                                                                                        Indian Ocean Marginal Seas Deoxygenation

  FIGURE 2 | Vertical sections of temperature, salinity, and dissolved oxygen along the axial trough of the Red Sea (data collected by the author during the Third
  Test-Trial Cruise of R.V. Sagar Kanya in May 1983).

during a cruise of R.V. Mukhtabar al-Bahr in the southeastern                              The hydrography of the Andaman Sea is greatly influenced
Gulf (El Samra and El Gindy, 1990), and Hashimoto et al. (1998)                         by (a) large runoff from the Irrawaddy River that, like other
found even lower oxygen concentrations during the cruise of                             parts of the NEIO, creates a low-salinity surface layer resulting in
R.V. Umitaka-Maru – 1.12 ml l−1 (49.98 µM) in December 1993                             strong thermohaline stratification (Naqvi et al., 2006), and (b) the
and 1.00 ml l−1 (44.62 µM) – in December 1994. Unfortunately,                           isolation of deep waters by the Andaman-Nicobar Ridge below
other than the observations to be described later that were made                        the sill depth (∼1,400 m). As a result, the deep and bottom waters
on board the Russian Research Vessel Lesnoye in the summer of                           cannot flow into the Andaman Basin, and the water throughout
1968, there are no basin-wide oxygen data in the global data base                       the basin below the sill depth is derived from the Bay of Bengal
from the Persian Gulf for peak summer.                                                  from the sill depth, and so the thermohaline characteristics of

Frontiers in Marine Science | www.frontiersin.org                                   6                                          February 2021 | Volume 8 | Article 624322
Naqvi                                                                                                                Indian Ocean Marginal Seas Deoxygenation

                                                                                       that measured over the Myanmar-Thailand shelf (22.9 µM at
                                                                                       217 m, Station 1013). What prevents the OMZ of the NEIO
                                                                                       from turning fully anoxic (supporting vigorous reductive loss
                                                                                       of combined nitrogen) is still not fully understood (Rao et al.,
                                                                                       1994; Bristow et al., 2017). One possible explanation is that
                                                                                       ballast provided by the terrigenous mineral particles rapidly
                                                                                       removes particulate organic matter from the water column
                                                                                       to the seafloor with little pelagic degradation (Ittekkot et al.,
                                                                                       1992; Rao et al., 1994; Naqvi et al., 1996; Rixen et al., 2019).
                                                                                       Anomalous near-bottom anomalies in oxygen and nutrients in
                                                                                       the Bay of Bengal (Broecker et al., 1980; Mantyla and Reid, 1995)
                                                                                       have been taken as a proof of relatively fresh organic matter
                                                                                       reaching the seafloor in the NEIO. Consequently, one should
                                                                                       expect significant oxygen depletion in the deep Andaman Basin.
  FIGURE 3 | Comparison of oxygen profiles from selected Sagar Kanya (SK)              Clearly, such is not the case. The remarkably uniform oxygen
  stations with those from nearby stations occupied during other cruises: (A) SK       concentrations (77.9–80.67 µM, mean ± SD = 79.06 ± 0.69 at
  Station 40 (black crosses) sampled on May 24, 1983 with GEOSECS Station
                                                                                       depths >2 km along the Knorr section) are intriguing. These
  407 (red crosses) sampled on December 22, 1977; (B) SK Station 70 (black
  circles) sampled on May 29, 1983 with Tyro Station 1 (red circles) sampled on
                                                                                       are consistent with the observations of Naqvi et al. (1994) who
  May 27, 1992, and SK Station 74 sampled on May 29, 1983 (black crosses)              reported the apparent oxygen utilization (AOU) at depths
  with Tyro Station 2 (red crosses) sampled on February 03, 1993. See                  >1.3 km in the Andaman Sea (239 ± 2 µM) to be the same as
  Figure 1 for station locations.                                                      the AOU at 1.3 km just outside the Andaman Sea in the Bay of
                                                                                       Bengal, leading them to conclude that the renewal of deep waters
                                                                                       in the Andaman Sea is rapid, with minimal chemical changes
water at depths exceeding 2 km are extraordinarily homogenous.                         occurring during the residence of water below the sill depth.
Observations along a zonal (∼10◦ N) transect in the Andaman
Sea made during a cruise of R.V. Knorr in October 1995
(Figure 5) show a potential temperature range of 4.693–4.761                           RECENT DEOXYGENATION TRENDS IN
(mean ± SD = 4.73 ± 0.014), and a salinity range of 34.854–                            OFFSHORE WATERS
34.861 (mean ± SD = 34.860 ± 0.001) with a highly invariable
σθ of 27.595 ± 0.001. Just outside the Andaman Sea in the Bay                          In this section, the most recent oxygen data from the three
of Bengal this density surface is found at ∼1.4 km, and so this                        marginal seas are compared with reliable historical data
should be the sill depth at the Great Passage.                                         available in the global data base to extract trends of the
    It has been proposed recently that the rate of tide-induced                        ongoing deoxygenation. All but one of the data sets used
vertical mixing in deep waters of the Andaman Sea is about                             here were generated following the classical Winkler procedure,
two-orders of magnitude higher than that in the Bay of Bengal                          the principle of which has remained essentially unchanged
and that this may contribute to downward diffusion of heat                             since its introduction in the late 19th century (Winkler, 1888).
in the Andaman Sea, in part accounting for the high deep-                              Modified applications of this technique for seawater dissolved
water temperature (Jithin and Francis, 2020). However, it must                         oxygen measurements since the 1960s claim an accuracy of
be pointed out that the greatly enhanced vertical mixing is by                         0.1% (Carpenter, 1965). While earlier Winkler titrations involved
itself a consequence of the lack of vertical stratification below                      manual titrations with visual end-point detection using starch as
the sill depth in the Andaman Sea, thereby making the proposed                         the indicator, automated titrations are increasingly being used in
mechanism secondary.                                                                   recent times. The two techniques give very similar results except
    The strong thermohaline stratification resulting from                              when oxygen levels approach zero, and manual titrations yield
freshwater runoff by the Irrawaddy is seen in Figure 5, which                          somewhat higher values (by ∼0.04 ml l−1 , 1.8 µM – Banse et al.,
also shows the absence of upwelling over the shelf in the eastern                      2014). Only one data set used here, viz. from the 1995 Knorr
Andaman Sea, typical of the eastern boundaries of the Pacific                          cruise in the Andaman Sea was obtained with the automated
and Atlantic Oceans at comparable latitudes. The regional OMZ                          measurements. The Argo float data, used in the case of Red
of the NEIO is present below the pycnocline, but unlike the                            Sea, are relatively less accurate, but with the existing protocol
eastern boundaries of the North and South Pacific and South                            for oxygen optode calibration and correction of any drift the
Atlantic where oxygen concentrations within the OMZ often                              accuracy of float data is still within 1% (Bettig and Körtzinger,
fall below the detection limit of even the highly sensitive STOX                       2015). The shifts in oxygen levels being reported here are well
oxygen sensors accompanied by the accumulation of nitrite                              beyond these uncertainties.
indicating microbial reduction of nitrate (e.g., Thamdrup et al.,
2012), such “functional anoxia” does not occur in the Andaman                          Red Sea
Sea. In fact, the minimum recorded oxygen concentration was                            There is a dearth of recent information from the Red Sea in the
slightly lower (15.6 µM O2 at 149 m, Station 1000) at the eastern                      available global databases to assess the ongoing deoxygenation
end of the transect (close to the Ten-Degree Channel) than                             trends in the region, except for the high-density profiles

Frontiers in Marine Science | www.frontiersin.org                                  7                                   February 2021 | Volume 8 | Article 624322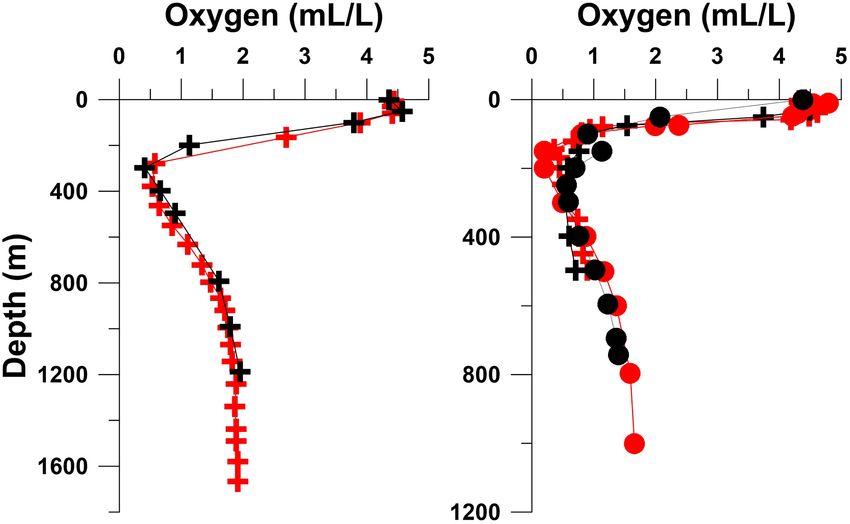
Naqvi                                                                                                                        Indian Ocean Marginal Seas Deoxygenation

  FIGURE 4 | Vertical sections of temperature, salinity, and dissolved oxygen along the main axis of the Persian Sea constructed using data collected during the R.V.
  Atlantis II cruise in February 1977 (Brewer et al., 1978). Salinity and oxygen sections are redrawn from Brewer and Dyrssen (1985).

generated by two Argo floats north of ∼23◦ N latitude (Table 1).                       (up to Station 29 – Figure 2) is made in Figure 6 (modified from
While one of these floats operated from September 29, 2015                             Naqvi, 2019). While the Sagar Kanya data provide a snapshot
to February 19, 2017, the other was active from September                              of the conditions prevailing at the time of the cruise, the float
30, 2015 to December 29, 2016. A comparison of the data                                data covered a period well beyond an annual cycle at a very high
from these floats with those generated north of 23◦ N latitude                         resolution. Despite the seasonal cooling in the northern Red Sea
during the above-mentioned cruise of R.V. Sagar Kanya                                  and in the Gulfs of Aqaba and Suez, which lead to convection and

Frontiers in Marine Science | www.frontiersin.org                                  8                                          February 2021 | Volume 8 | Article 624322
Naqvi                                                                                                                    Indian Ocean Marginal Seas Deoxygenation

  FIGURE 5 | Vertical sections of temperature, salinity, and dissolved oxygen along ∼10◦ N (part of WOCE I01 Line) in the Andaman Sea constructed using data
  collected during the R.V. Knorr cruise in October 1995. These data form a subset of those presented in the WOCE Indian Ocean Atlas (Talley, 2013;
  http://whp-atlas.ucsd.edu/indian_index.htm).

Frontiers in Marine Science | www.frontiersin.org                                9                                         February 2021 | Volume 8 | Article 624322
Naqvi Indian Ocean Marginal Seas Deoxygenation
FIGURE 6 | Comparison of oxygen profiles generated by two Argo floats
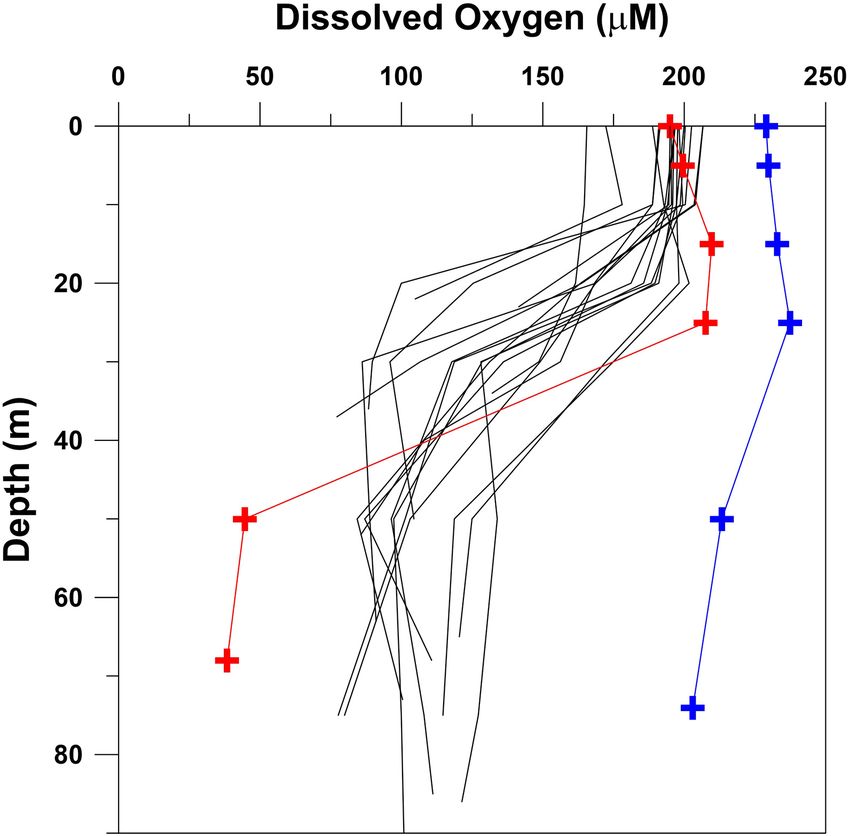
FIGURE 7 | Comparison of oxygen data in the Persian Gulf collected east of
deployed in the Red Sea north of ∼23◦ N latitude: #6901573 from September
longitude 51.77◦ E during a cruise of R.V. Lesnoye in September 1968 (black
29, 2015 to February 19, 2017 (black symbols) and #6901577 from
profiles) with measurements made north of the Qatar peninsula during cruises
September 30, 2015 to December 29, 2016 (blue symbols) with the Winkler
of R.V. Mukhtabar al-Bahr in September–October 2000 (red symbols) and
oxygen data (red circles) collected during the May 1983 cruise of R.V. Sagar
February–March 2001 (blue symbols).
Kanya (Figures 1A, 2).
deep water formation, the float data are fairly tightly clustered, scale shift, oxygen profiles at a number of stations sampled by the
with good overlapping of values from the two floats. In addition R.V. Lesnoye in September 1968 in the southern Gulf (Table 1)
to the seasonal change, geographical variability – southward have also been included in Figure 7. The Lesnoye data set is the
decrease in oxygen seen in Figure 2 – would also contribute only historical data set generated in summer from this region. It
to the spread seen in Figure 6. Even considering this scatter, is clear that summer-time oxygen depletion in the central Gulf
oxygen concentrations recorded by the floats during 2015–2017 also occurred in the 1960s, but not to the extent observed by
were generally much lower than those measured on the Sagar Al-Ansari et al. (2015). At the same time near-surface oxygen
Kanya cruise, especially in deeper water (below 400 m). As the values in the summer of 2000 were higher than most values in
concentration shift, most pronounced at the northern stations, 1968, a tell-tale sign of eutrophication. Extrapolating their highly
far exceeds any potential error in the float data it may be limited data, Al-Ansari et al. (2015) estimated the area of the
concluded that substantial deoxygenation has occurred the Red “hypoxic” zone to exceed 7,000 km2 . Obviously, this estimate
Sea over the past three decades. suffers from large uncertainty; nevertheless, in all likelihood
the emergence of hypoxia in Qatari EEZ appears to be linked
Persian Gulf to human activities. If so, it is expected that further declines
Substantial seasonal changes in oxygen distribution are expected in oxygen should have occurred over the past two decades,
to occur in the Persian Gulf due to wide temperature range. underlining the urgent need for generation of new data from the
Results of Grasshoff (1976) and Brewer and Dyrssen (1985) southern Gulf, especially in summer.
(Figure 4) showed that the water column is vertically well-mixed
and well-oxygenated during winter almost everywhere. However, Andaman Sea
an oxycline may develop in the deeper parts of the central and A large number of oxygen profiles were generated from the
southern Gulf during summer due to warming of surface waters. Andaman Sea during the International Indian Ocean Expedition
This is evident from the contrasting profiles (Figure 7) at a (IIOE), which can be used as the baseline for detecting and
station located close to the northern edge of the Qatar’s EEZ quantifying changes, if any, that have occurred in the region since
that was sampled in late summer (September–October, 2000) then. These data, extracted from the WOD-NOAA database for
and winter (February–March, 2001) (Al-Ansari et al., 2015). the period 1961–1964 (Table 1), were compared with the latest
While the bottom-water oxygen concentration was ∼90% of the publicly available data. Unfortunately, as the entire Andaman Sea
saturation value in winter, the saturation level fell to ∼18% in falls within the EEZs of surrounding countries, it is not easily
summer with the lowest recorded concentration of 0.86 ml l−1 accessible for international exploration. The Knorr cruise that
(38.38 µM). In order to resolve the seasonality from the decadal sampled WOCE I01 Line was an exception. Not only are there no
Frontiers in Marine Science | www.frontiersin.org 10 February 2021 | Volume 8 | Article 624322Naqvi Indian Ocean Marginal Seas Deoxygenation
more recent bottle data from this region in the global data base,
there have also not been any BIOARGO floats deployments in the
Andaman Sea so far.
While the Knorr data came from a zonal transect, the IIOE
stations were located over a wide latitudinal range. While this
would not make a difference for the data below the sill depth
(∼1.4 km) since the deep water is exceedingly homogenous
throughout the basin, it would matter for shallower depths
because oxygen concentrations below the surface mixed layer and
above the sill depth decrease steadily northward (Wyrtki, 1971).
This is reflected in the larger scatter of oxygen concentrations
at shallower depths, especially close to the oxygen minimum,
in Figure 8, where all IIOE data are plotted along with
the Knorr data. It must also be pointed out that the IIOE
observations covered different seasons (Table 1). However, as
stated earlier, one of the most distinguishing features of the
NEIO, including the Andaman Sea, is the extremely strong
stratification in the upper water column arising from the large
river runoff and local precipitation. The moderate winter cooling
is unable to overcome this barrier, and so in contrast with
the NWIO, subsurface layers in the NEIO are not affected by
seasonal mixing and are not ventilated by locally formed water FIGURE 8 | Comparison of oxygen data from the Andaman Sea collected
masses (Naqvi et al., 2006). The isolation of waters below the during the International Indian Ocean Expedition (1961–1964) (red symbols)
with those taken on a cruise of R.V. Knorr (black symbols) in October 1995.
pycnocline, including the OMZ, is reflected by low penetration
of anthropogenic tracers like tritium and chlorofluorocarbons
(Rao et al., 1994; Talley, 2013). Therefore, while no seasonal
changes are expected to occur in deep waters, such changes Coastal “Dead Zones”
are also most probably negligible within the OMZ. In general, Among the hundreds of hypoxic “dead zones” that are known
oxygen concentrations measured on the Knorr cruise are slightly to have developed globally in coastal waters over the past few
lower than those recorded in the early 1960s. At depths >1.5 km decades due to human activities, mainly eutrophication (Diaz
the mean ± SD of Knorr oxygen data is 78.40 ± 1.37 µM and Rosenberg, 2008), there are only two confirmed cases from
(1.76 ± 0.03 ml l−1 ) as compared to 79.73 ± 2.77 µM the Indian Ocean’s marginal seas (Breitburg et al., 2018). The
(1.79 ± 0.06 ml l−1 ) for the IIOE data. The difference, most severe oxygen depletion in this category has been reported
although small, is statistically significant (2-tailed Student t-test, from the vicinity of Jeddah, the largest city along the Red Sea
p = 0.000564). A similar comparison was also made for data shores having a population of around 3 million. Three coastal
from the OMZ, but only within the depth range 150–350 m lagoons in this area – Al-Shabab, Al-Arbaeen and Al-Salam –
and from stations located between latitudes 9◦ N and 11◦ N. The receive large quantities of treated or untreated sewage discharge
mean ± SD values for the Knorr data – 22.52 ± 2.51 µM from Jeddah City, which in conjunction with restricted flushing
(0.50 ± 0.06 ml l−1 ) – were even more significantly lower (two- creates low oxygen conditions. Hypoxic/anoxic conditions in
tailed Student t-test, p < 0.00001) than those for the IIOE data – the Al-Shabab and Al-Arbaeen lagoons have been described
28.88 ± 3.80 µM (0.65 ± 0.09 ml l−1 ). However, it may be in detail by Orif et al. (2017). Although similar data from
pointed out that while on the IIOE cruises Winkler titrations the water column are not available from the Al-Salam lagoon,
were carried out manually with visual end point detection, an considering the sedimentary characteristics described by Abu-
automated procedure involving photometric end-point detection Zied and Orif (2019) together with the waste-water runoff and
was followed on the Knorr. It has been pointed out earlier that organic matter/nutrients loadings, hypoxia probably affects this
at oxygen concentrations approaching zero, automated titrations lagoon as well. Oxygen concentrations have been observed to fall
yield consistently lower values (by ∼0.04 ml l−1 , 1.79 µM) to hypoxic level of 63 µM in Al-Shahab lagoon, and water in the
than manual titrations (Banse et al., 2014). However, even Arbaeen lagoon turns fully anoxic below 0.5 m with large build-
after considering this potential offset (i.e., subtracting it from up of H2 S (up to 55.5 µM). Substantial loss of fixed nitrogen also
each value for the IIOE data), the Knorr values would still be appears to occur in these lagoons along with huge production of
significantly lower (p < 0.00001). Thus, it appears that the core methane, probably in sediments (Orif et al., 2017). In fact, bottom
of the Andaman Sea OMZ had already lost small but significant water methane levels in the Al-Arbaeen lagoon (maximum
amount of oxygen by the mid-1990s. Accordingly, mean water 13.2 µM) are comparable to those recorded in the deep anoxic
column oxygen inventory, computed to a constant depth of basins of Black Sea and Cariaco Basin (Naqvi et al., 2010).
3,000 m for the deepest part of the Andaman Basin, decreased Shorter-lived episodes of deoxygenation have also been
from 206.9 mol m−2 (n = 5) during 1961–1964 to 199.9 mol m−2 reported from coastal waters of Kuwait that receive huge
(n = 2) in 1995. quantities of anthropogenic nutrients and organic matter from
Frontiers in Marine Science | www.frontiersin.org 11 February 2021 | Volume 8 | Article 624322Naqvi Indian Ocean Marginal Seas Deoxygenation land. The group of semi-enclosed bays (Kuwait Bay along with the embedded Sulaibikhat Bay and Doha Bay) located at the northwestern extreme of the Persian Gulf receive enormous quantities of sewage and other effluents from Kuwait City and nearby industrial establishments. The region has extensive mudflats that are highly important from the ecological and biogeochemical points of view (Al-Yamani et al., 2004). The conditions within these sediments are strongly reducing (Dr. Turki Al-Said, personal communication). The tidal amplitude is fairly high (∼4 m), and periodic inundation of reducing intertidal sediments probably causes substantial depletion of oxygen in the overlying waters. An analysis of data collected during January 2009–November 2011 at a number of monitoring stations in this area revealed low oxygen saturation (minimum < 39%) FIGURE 9 | Oxygen profiles at Rescue Station Marina in Salmiya, Kuwait off Kuwait City, extending from Sulaibikhat Bay to Doha Bay (latitude 29.34◦ N, longitude 48.10◦ E) during a fish kill incident on July 19, (Al-Mutairi et al., 2015). However, further away from the coast 2011 (A), and in Shuwaikh Port (latitude 29.36◦ N, longitude 47.93◦ E) on April in the center of the Kuwait Bay, monthly sampling at a fixed 30, 2017 (B). Redrawn from Al-Yamani et al. (2020). station (K6, latitude 29.45◦ N, longitude 47.967◦ E, depth 12 m) being carried out since 2004 revealed that bottom water oxygen content has almost always been above 4 mg l−1 (2.8 ml l−1 , DISCUSSION 125 µM), the nominal threshold for mild hypoxia (Dr. Faiza Al-Yamani, personal communication). However, eutrophication The results presented above show declining trends in oxygen has led to a marked increase in the frequency of algal blooms, levels in all three basins. Before discussing their significance including harmful blooms, in Kuwait’s waters in recent years it is necessary to address a few issues that have important (Al-Yamani et al., 2012; Al-Yamani and Naqvi, 2019). There bearings on the inferences being drawn. First and foremost is have been instances of fish mortality in Kuwait waters associated the concern about compatibility of oxygen data used. As already with hypoxia as described by Al-Yamani et al. (2020). In one discussed, the magnitudes of observed shifts are well beyond such incident mass mortality of sardines (Sardinella fimbriata) potential errors of measurements. The second issue relates to occurred in Ras Al-Adrdh Marina, Salimya, Kuwait on August seasonality in oxygen distribution. Again, as pointed out above, 10, 2005. As the oxygen content was low throughout the water seasonality is probably not very pronounced in the deep basins – column [1.26 ml l−1 (56.23 µM), 1.19 ml l−1 (53.10 µM) the Red Sea and the Andaman Sea – below the surface layer. and 0.70 ml l−1 (31.24 µM) O2 at the surface, mid-depth, Moreover, in the case of the Red Sea the Argo float data cover and bottom, respectively], hypoxia was considered to be a all seasons and the range of values recorded by the floats is possible cause of the observed mortality. A similar but more well below oxygen concentrations measured in 1983. On the extended mortality episode involving the same fish in the same other hand, seasonal changes are expected to be quite large area took place again in June–July, 2011, during which oxygen in the Persian Gulf. This is, in fact, apparent from the data concentrations were also quite low (Figure 9A). Fish kills also from the Qatari EEZ in the central Gulf taken during two occurred around the same time further to the south in the consecutive summer and winter periods in 2000–2001, with Messila Marina where the oxygen level in the upper 1 m fell the subsurface water being expectedly more oxygen depleted in to 0.14 ml l−1 (6.25 µM). Water discoloration by a bloom of summer (Figure 7). However, for the same month (September), the dinoflagellate Gonyaulax verior was conspicuously seen here. bottom water oxygen concentrations were much lower in 2000 An even more widespread mortality event involving two catfish as compared to those in 1968. Thus, after taking into account species, Netuma thalassina and Plicofollis tenuspinus, took place the seasonality, the results strongly indicate increasing summer- in Kuwait waters – especially in Kuwait Bay – in April–May, 2017. time deoxygenation in the Persian Gulf. The third issue pertains This was also associated with water discoloration due to blooms to shifting baselines. That is, it is not known to what extent of potentially harmful raphidophycean flagellate Heterosigma the data used as reference (collected in May 1983 in the case akashiwo and dinoflagellate Karenia papilionacea (known to of Red Sea, in September 1968 in the case of the Persian Gulf. produce Brevetoxin, a neurotoxin). Oxygen measurements made and during 1961–1964 in the case of the Andaman Sea) had during this period revealed generally well-oxygenated water already been anthropogenically impacted. Such an impact is column, except in one case where the vertical profile in Shuwaikh expected to have been largest in the Persian Gulf that is quite Port (Figure 9B) showed almost complete oxygen removal shallow and small in size and has been subjected to human close to the bottom (∼10.5 m) (Al-Yamani et al., 2020). Thus, activities for a long time, especially after the discovery of oil while oxygen-deficiency may or may not be the cause of the and the wealth and “development” it brought to the region observed fish mortality, it is clearly one of the effects of episodic, around the middle of the last century. However, even if the data excessive phytoplankton production (evident from very high used as reference might not represent “pristine” conditions, the oxygen concentration at the surface in Figure 9B) resulting from comparisons with more recent measurements still yield reliable nutrient-over enrichment in coastal waters of the Persian Gulf. trends of change. Frontiers in Marine Science | www.frontiersin.org 12 February 2021 | Volume 8 | Article 624322
Naqvi                                                                                                        Indian Ocean Marginal Seas Deoxygenation

    It is also not clear if or to what extent the observed                   intense oxygen minima are cooler. Changes in oxygen content
deoxygenation trends are contributed by long-term natural                    and temperature will combine to determine the extent of habitat
variability, an inherent problem with any two-point comparison,              compression of marine organisms in all areas, more so in the Red
but one that unfortunately cannot be addressed with the available            Sea (Seibel et al., 2016).
data. It may be pointed out that there is evidence for existence                 Besides impacting local biogeochemistry and ecology,
of such variability in the Red Sea on the decadal scale. Satellite           deoxygenation in the Persian Gulf and Red Sea is also expected
remote-sensed SST data have revealed a warming trend with                    to affect the intensity and volume of the Arabian Sea OMZ,
values ranging from 0.17 to 0.45◦ C decade−1 across the Red Sea              which is uniquely ventilated by outflows from these regional seas
basin for the period 1982–2015 (Chaidez et al., 2017). However,              (Naqvi, 2019). These outflows are strongly affected by the climate
the analysis of available water column data for the period 1958–             and local hydrography, particularly temperature (Lachkar et al.,
2017 showed a more complex pattern – a steady decrease in                    2019). Changes in water temperature in the Red Sea have been
SST from the 1960s up to the mid-1980s and an increasing                     discussed above. In the Persian Gulf, analysis of time series data
trend thereafter (Agulles et al., 2020). It has been suggested               from Kuwait’s coastal waters has revealed a long-term warming
that the long-term SST oscillations may be associated with the               rate of 0.38◦ C decade−1 (Al-Yamani et al., 2017), which is more
Atlantic Multidecadal Oscillation (AMO) and that the above-                  than thrice the average warming rate (0.11◦ C decade) in the
mentioned high warming rates over the past three decades or so               ocean (Rhein et al., 2013). Given the smaller size of the Persian
are probably a combined effect of global warming and a positive              Gulf, and the associated short renewal time, effects of warming
phase of natural SST oscillations (Krokos et al., 2019). According           of this magnitude are expected to be far more rapidly manifested
to Krokos et al. (2019) the cooling AMO phase may offset the                 than in the case of the Red Sea. Model simulations have shown
global warming related SST increase in the Red Sea in the future.            that warming of the Persian Gulf has a particularly strong impact
What is really intriguing is that the temporal trends in subsurface          on the volume and intensity of the OMZ as the Persian Gulf
water temperatures appear to be decoupled to the SST trend,                  Outflow advects right into the core of the OMZ (Codispoti et al.,
showing an overall cooling trend in deep waters during 1958–                 2001; Lachkar et al., 2019). Warming will make the outflow
2017 (Agulles et al., 2020). The data compiled by Agulles et al.             lighter, thereby causing intensification of the OMZ and the
(2020) show that since the time of the Sagar Kanya cruise the                associated denitrification process. However, this response is
100–500 m layer cooled up to mid 1990s and has been warming                  projected to be non linear as under strong warming (e.g., by
thereafter; the deeper waters showed a similar pattern, except               4◦ C), loss of nitrate in the upper layer caused by denitrification
that the minimum occurred a little later (in the late 1990s) and             is expected to provide a negative feedback to deoxygenation.
the subsequent warming has been more subdued. It is hard                     The model simulations also suggested a relatively weaker effect
to reconcile the observed deoxygenation in deep waters of the                of increase in salinity in the Persian Gulf on the Arabian Sea
Red Sea with these temperature variations, but it is clear that              OMZ (Lachkar et al., 2019). Warming of the Red Sea is also
the oxygen decrease cannot be simply attributed to decreased                 projected to lead to intensification of the OMZ, but to a smaller
solubility in warmer water.                                                  extent and at greater depths; as a result of the latter, the response
    Interannual and decadal-scale variability in oxygen forced               to temperature increase is also more linear than in the case of
by regional climate modes (e.g., the Indian Ocean Dipole) has                the Persian Gulf Outflow. However, as discussed above, there
been reported to control the intensity of seasonal anoxia over               does not seem to be consistent trend of warming in the Red
the western Indian shelf (Vallivattathillam et al., 2017). Such a            Sea at depths from which the outflow is drawn. A more direct
variability may also occur in the off shore OMZs of the northern             effect of the ongoing deoxygenation in the Persian Gulf and the
Indian Ocean (Rixen et al., 2020), but convincing evidence for               Red Sea on the Arabian Sea OMZ would be through depression
this is lacking so far. Nevertheless, even though it is unlikely, one        of preformed oxygen contents of the outflowing waters. This
cannot completely rule out such a variability to account for a part          is expected to be caused both by a lower solubility of oxygen
of the oxygen declines being reported here.                                  in warmer and more saline waters and an increase in oxygen
    Deoxygenation in the Mediterranean-type marginal seas is of              demand as a consequence of increased productivity fuelled by
special significance because of their unusual hydrography and                anthropogenically supplied nutrients. Recent intensification of
the potential for its impact extending beyond the marginal seas              OMZ in the Gulf of Oman, which directly receives the outflow
themselves. For example, it has been pointed out by Seibel et al.            from the Persian Gulf, has been reported by Queste et al. (2018).
(2016), who studied the metabolism and hypoxia tolerance of                  It may be noted that salinity in the northern Persian Gulf has
the Euphausiid species Euphausia diomedeae in the Red Sea, that              increased, especially during the crucial winter months when the
owing to the higher water temperature and consequently elevated              dense water is formed, by as much as 10 (Al-Yamani et al., 2017;
oxygen demand even moderate hypoxia may be physiologically                   Al-Said et al., 2018). The total organic carbon (TOC) content of
more challenging to organisms than more severe hypoxia in                    these waters is quite high (101.0–318.4, mean 161.2 µM – Al-Said
colder water. These authors postulated that E. diomedeae in                  et al., 2018). Even higher TOC values (336.7–543.3 µM) were
the Red Sea reached the limits of adaptation even though                     measured in Kuwait Bay in April 2017 during the phytoplankton
Pcrit , the partial pressure of oxygen (PO2 ) below which oxygen             bloom mentioned above. Al-Said et al. (2018) proposed that the
consumption rate becomes independent of PO2 , occurs deeper                  high oxygen demand arising from elevated TOC may be the
(∼270 m) in the water column as compared to the California                   principal driver of the emerging hypoxia in the Persian Gulf.
Current and the eastern tropical Pacific, where waters with more             They also speculated that the semi-labile portion of the TOC

Frontiers in Marine Science | www.frontiersin.org                       13                                    February 2021 | Volume 8 | Article 624322
Naqvi Indian Ocean Marginal Seas Deoxygenation
that escapes degradation in the water column may be exported (2.2–277.2 µM). The very low values, occurring more often
to the Arabian Sea by the outflow, potentially contributing in, but not confined to, summer and in the nearshore reef
further to the intensification of the Arabian Sea OMZ. To what (the lowest value was recorded in the offshore reef in winter,
extent similar processes also operate in the Red Sea, where the however, probably arising from community respiration at night),
magnitude of human perturbation is much smaller, still remains indicate high vulnerability of such ecosystems to human-
to be investigated. induced deoxygenation. As compared to temperate ecosystems,
The observed deoxygenation trend within the oxygen occurrence of such deoxygenation from tropical ecosystems is
minimum in the Andaman Sea is comparable to that reported probably greatly under-reported globally, and according to one
by Naqvi (2019) for the northern Bay of Bengal, even though estimate 13% of all coral ecosystems might have already turned
in the latter case the most recent data used for the comparison into “dead zones” (Altieri et al., 2017, 2019). The ecosystems
with the IIOE observations came from April 2007. This provides of Indian Ocean’s marginal seas probably also suffer from such
support to the view that the rate of oxygen decline in the Indian under-reporting. As exemplified by the above mentioned reports
Ocean, in general, and in the NEIO, in particular, is smaller from the relatively well-studied coastal waters of Kuwait, this
than in the OMZs of the Pacific Ocean (Stramma et al., 2008; may particularly apply to the entire Persian Gulf, which is one
Schmidtko et al., 2017). The present analysis shows that the of anthropogenically most impacted marine areas in the world
trend also extends down to the depth in the NEIO (1.4 km) (Sheppard et al., 2010), as well as to the poorly investigated shores
from where water in the deep Andaman Basin is derived. The of the Andaman Sea. The need for capacity building to adequately
extent to which the modest shift being reported here is caused by address this deficiency cannot be over-emphasized.
warming-related changes in oxygen solubility or circulation, or
even increases in oxygen consumption cannot be evaluated with
the present data. According to Oschlies (2019) the contribution DATA AVAILABILITY STATEMENT
of lower O2 solubility in seawater arising from global warming
to the observed decrease in oceanic O2 inventory is relatively Publicly available datasets were analyzed in this study. Data
small (15%), but it could be as much as 50% in the upper sources are listed in Table 1.
kilometer of the water column. He attributed the majority of
the change in deep waters to altered water circulation. The
role of warming-induced increase in respiration also appears AUTHOR CONTRIBUTIONS
to be small (You can also read