Fast Moving Consumer Goods Analytics Framework - Point of view Amsterdam, 2017 - Deloitte
←
→
Page content transcription
If your browser does not render page correctly, please read the page content below

Fast Moving Consumer Goods
Analytics Framework
Point of view
Amsterdam, 2017

Key Trends impacting FMCG

© 2017 Deloitte The Netherlands                                                          Fast Moving Consumer Goods Analytics Framework   2
            Source: Deloitte university press- Consumer product trends Navigating 2020
Using Analytics to stay ahead of the game
Effective use of analytical capabilities will enable FMCG companies to cope with and even
benefit from the key trends impacting FMCG

   1
        Unfulfilled economic              Analytics supports the shift to value by identifying key price points in the market, defining customer
        recovery for core consumer        segments, developing new pricing strategies based on competitive intelligence and increasing efficiency in
        segments                          manufacturing and logistics to reduce costs

   2
        Health, wellness and              Companies will experience greater pressure to better align offerings and activities with customer interests
        responsibility as the new basis   and values. Big Data and analytics help to better understand customer sentiment, preferences and behaviour.
        of brand loyalty                  At the same time data analytics enables supply chain visibility and identifies potential risks

   3
        Pervasive digitization of the     An increasingly larger share of consumer's spend and activity will take place through digital channels.
        path to purchase                  Analytics is key in better understanding of purchase and consumption occasions as well as tailoring channel
                                          experience

   4
        Proliferation of customization    In a world where customized products and personalized, targeted marketing experiences win companies
        and personalization               market share, technologies like digital commerce, additive manufacturing and artificial intelligence can give a
                                          company an edge by allowing it to create customized product offerings

   5
        Continued resource
                                          Analytics can fuel a better understanding of the resource market volatility and more efficient use of critical
        shortages and commodity
                                          resources in the production process
        price volatility

© 2017 Deloitte The Netherlands                                                                                      Fast Moving Consumer Goods Analytics Framework   3
FMCG Analytics Framework

© 2017 Deloitte The Netherlands   Fast Moving Consumer Goods Analytics Framework   4

FMCG Analytics Framework
Analytic capabilities for better decisions across the FMCG value chain

                   Marketing/Sales                                                  Manufacturing                                                        Logistics

           Brand Analysis           Pricing       Competitor               Production         Asset           Quality                  Inventory          Supply Chain                Reverse
                                   Strategy       Intelligence              Efficiency       Analytics       Analytics                Diagnostics          Diagnostics                Logistics

    Digital                Marketing         Trade                Production         Workforce       Production             Location           Resource &               Fulfilment
   Analytics                Mix ROI       Promotion               Forecasting         Safety          Planning              Analytics             Route                Intelligence
                                         Effectiveness                                                                                         optimization

                                                                       Business Management & Support

              Workforce                          Sustainability                  Finance                           Business Process                                  Program & Portfolio
              Analytics                          Analytics                       Analytics                         Analysis                                          Analytics

© 2017 Deloitte The Netherlands                                                                                                              Fast Moving Consumer Goods Analytics Framework       5
FMCG Analytics Framework – Marketing/Sales

© 2017 Deloitte The Netherlands               Fast Moving Consumer Goods Analytics Framework   6

FMCG Value Chain – Marketing/Sales
In the Marketing/Sales process of the FMCG value chain, analyses are geared towards
improving commercial performance and customer centricity

                                                                                Marketing/Sales
            Digital Analytics                                                               Pricing Strategy
            The online channels are of increasing importance, also in FMCG. Defining a      The analysis focuses on demand variation at different price levels with
            uniform digital KPI framework and building web analytics capabilities is key    different promotion/rebate offers. It is used to determine optimal
            to create insights into the digital performance on the ecommerce platforms.     prices throughout the product/service lifecycle by customer segment.
                                                                                            Benefits include increasing sales margin, decreasing markdowns and
                                                                                            aiding inventory management.

            Brand Analysis                                                                  Trade Promotion Effectiveness
            This analysis focuses on providing insights into the brand perception of        This analysis focuses on providing insight in both the effectiveness and
            a firm. With the use of (among others) sentiment analysis the firm can          planning of trade promotions. These insights allow the company to improve
            compare the perception of their brand with that of the main                     the aforementioned processes to increase sales while keeping the marketing
            competitors and create a data driven brand strategy.                            costs at the same level.

            Marketing Mix ROI                                                               Competitor Intelligence
            Analyses focus on determining the effectiveness of marketing investments.       Knowledge is power. Knowledge of what your competitors are doing allows
            By reducing ineffective spend and intensifying high return marketing tactics,   you to take action quickly in order to gain an advantage. This analysis
            the marketing mix is optimized leading to higher returns on the overall         focuses on obtaining this knowledge and extracting the actionable insights
            marketing spend.                                                                that allow one to form data-driven competitor strategy.

© 2017 Deloitte The Netherlands                                                                                                   Fast Moving Consumer Goods Analytics Framework   7
Case study – Digital Analytics
Defining a KPI framework and embedding it through online dashboards

                    Marketing

                                  Challenge
       Food company

                                              This global Food company wanted to undergo a digital transformation. However there was little visibility on web
                                              analytics capabilities, no accessibility to in-market web analytics, limited standards and KPI definitions and
                                              reporting. For e-commerce there little to no online market share data available in the countries

    Anonymized
    Anonymized
    Anonymized

                                  Approach
                                              Deloitte supported in defining uniform KPIs and a roadmap for implementation for both domains. Deloitte
                                              supported in extracting web analytics data and requesting in-market data about on-line market share from the
                 Digital Sales                countries. The first phases for both marketing and e-commerce were to develop tooling to measure and compare
                                              digital performance across target countries for both marketing and e-commerce
          Food company

                                              •   Delivered a marketing dashboard & KPI framework with global definitions
                                  Benefits

                                              •   Delivered a (hosted) e-commerce dashboard & KPI framework with global definitions, also making web
                                                  analytics more financial by measuring the financial impact of web analytics
                                              •   Finally, the roadmaps for both marketing and e-commerce providing clear guidance on maturing in the area of
                                                  online marketing and e-commerce

© 2017 Deloitte The Netherlands                                                                                      Fast Moving Consumer Goods Analytics Framework   8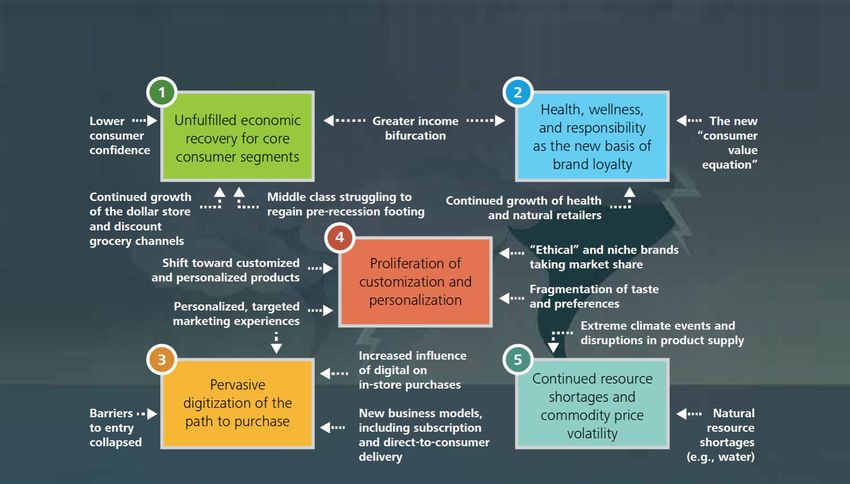
Case study – Brand Analysis
Investigating brand perceptions by assessing positive and negative opinions
regarding the firm

        Brand analysis

                                  Challenge
                                              The firm wanted to investigate its brand perception by assess positive and negative opinions regarding the firm.
                                              They wanted to be able to highlight locations showing positive and negative perceptions. The client also wanted
                                              to compare their firm with the main competitors in order to create a data-driven brand strategy

        Brand analysis

                                  Approach
                                              The project involves a web spider which extracts related and unstructured data from the internet from a number
                                              of different sources (social media, blogs, news feeds etcetera). The analysis is then carried out in a text mining
                                              tool to process the data for sentiment related content and output the results to an interactive dashboard for
                                              visualization

        Brand analysis
                                  Results

                                              The results of the analysis include sentiment scores across the business areas and a root cause analysis. These
                                              enable a real-time understanding of their online brand and identification of the differentiating factors between
                                              positive and negative perceived programs/areas. The delivered insights can be used to determine the necessary
                                              actions in order to promote the firm’s brand in certain programs/areas

© 2017 Deloitte The Netherlands                                                                                       Fast Moving Consumer Goods Analytics Framework   9
Case study – Omni channel voice of the customer
Analysis of customer voice topics and sentiment across multiple channels

    Sentiment analysis across channels

                                           Challenge
                                                       Customers leave their voices across different channels such as company website, third party resellers, customer
                                                       service emails, telephone and social. Capturing, classifying and combining data from these channels is
                                                       challenging. Our solution enables CMOs to focus their attention where it is most required

    Topic classification and frequencies

                                           Approach
                                                       This proof-of-concept focusses on three channels (own website, third party website and social). First web
                                                       scraping used to collect raw customer voices from different channels in different markets. Then a classification
                                                       model is used to identify key topics and subtopics for each voice, another classification model is used to identify
                                                       the product(category) of the topic, and finally sentiment analysis is performed on each of the voices. The results
                                                       are visualised in an interactive dashboard

  Trending topics per product / channel

                                                       •   The solution provides insights into the sentiment of voices per product category, per market
                                           Results

                                                       •   Key topics are visible and trending topics can be assessed by product category, channel or market
                                                       •   The solution provides a quick overview of all voices across all products, channels and markets, but also enable
                                                           drill-down to the voice level

© 2017 Deloitte The Netherlands                                                                                                 Fast Moving Consumer Goods Analytics Framework   10
Case study – Marketing Mix ROI
The use of combined online & offline Marketing Mix Modelling to improve the
Marketing ROI
Scenario analysis
Challenge
Deloitte was engaged in improving return on marketing spend and optimizing the advertising investment mix
with disparate departments, differing measuring systems and differing priorities to improve marketing ROI
across both offline and online channels simultaneously. This case was executed for an omnichannel retailer
Marketing ROI
Approach
First the metrics needed for the model were prioritized across products, channels, and categories. A data
warehouse was built to hold the required variables for each product that was needed to continuously run the
Marketing Mix Modelling. With all the data present, the Marketing Mix Model was developed to optimize
marketing ROI by using Scenario analysis and Optimization models. Finally the marketing ROI tracking system
was implemented to continuously track the results of the models
Marketing return curves
Results
• The most significant result was that the marketing ROI doubled over a two-year period
• To ensure recurring improvement, an investment mix allocation change was implemented
• Finally, there was also a strategy shift to target the most profitable customers
© 2017 Deloitte The Netherlands Fast Moving Consumer Goods Analytics Framework 11Case study – Pricing Strategy
Using analytics to reshape pricing strategies
Price per segment analysis
Years of inorganic growth and sales led customer negotiations to tailored pricing across trade customers,
Challenge
resulting in large and difficult to defend price variance across customers. Pricing differences between accounts
exposed this CPG client to downward pressure on pricing when trade partners consolidated or buyers
moved retailers
Existing pricing and trade terms structure were not compliant with internal accounting standards
Margin analysis
Approach
Deloitte developed a consistent, commercially justifiable list of pricing and trading terms. The potential impact of
Profitability analysis new pricing and terms on customers was assessed and a high-level roadmap for execution was established. The
business is supported in the preparation for the implementation of the new pricing and trading terms
Price Waterfall • Single common list price for each product
Benefits
• Revised ‘pricing waterfall’ and trade terms framework
• Customer and product level impact analysis
• Trade communication strategy
• High-level implementation roadmap
© 2017 Deloitte The Netherlands Fast Moving Consumer Goods Analytics Framework 12Case study – Trade Promotion Effectiveness
Building a shared reporting and analysis solution that allows for
trade promotion evolution
Trade promotion analysis
Challenge
A client’s desired end state with regard to BI was a single integrated and shared reporting and analysis solution;
delivering value in a single version of the truth throughout the organization. As part of this solution they wanted
to gain insight in trade promotion effectiveness through two key dimensions, promotional performance and
promotional planning. This case was executed for a CPG client
Account performance
Approach
Interviews within the company showed that trade promotion management & evaluation is not a focus on
corporate level, but very important on regional level. In order to create a cohesive overview into trade marketing
effectiveness across different dimension (regions, channels, categories, products & sales person) Deloitte had to
tie several data sources together, such as GFK panel data, Nielsen scanning data, IRI data and the client’s own
factory data
Budget analysis
• A tool that allows the client to evaluate trade promotion performance. This way they can evaluate the success
Results
of promotions and the drivers behind it
• A tool that allows the client to evaluate trade promotional planning. As a result they can easily gain insight
into what they are executing according to the year’s promotion plan and whether the trade promotion spend
and discounts are in check with planning & budget
© 2017 Deloitte The Netherlands Fast Moving Consumer Goods Analytics Framework 13Case study – Competitor Intelligence
Creating an overall view of the category market post
Overall view
It is important to understand how products are offered to the end consumers via the different retail outlets.
Challenge
Therefore, understanding the competitive market of suppliers as well as retailers is key
The aim of this initiative is to combine disparate data sources in order to develop a solid understanding of the
market position on individual product and category level. This case was executed from a retailer’s point of view
but can be directly applied to FMCG companies
Product category dashboard
Developing a workflow tool to obtain an overall view of the market as well as an interactive dashboard on
Approach
product sales and market positioning, by identifying and combining different data sources such as:
• Internal market sales & market research
• Third party (retailers) sales data (e.g. Nielsen)
• External data sources
Dashboard Deepdive
• Overall view of the market positioning on individual product/category level
Results
• Ability to focus on root cause analyses for positive or negative developments in product/market sales using
interactive dashboarding
• Uncover relative market positions of product groups vis a vis main competitors
© 2017 Deloitte The Netherlands Fast Moving Consumer Goods Analytics Framework 14FMCG Analytics Framework – Manufacturing © 2017 Deloitte The Netherlands Fast Moving Consumer Goods Analytics Framework 15
FMCG Value Chain – Manufacturing
In the Manufacturing process of the FMCG value chain, analyses are focused on
optimizing production processes taking in consideration forecasting, planning, efficiency
and risk exposure

                                                                                    Manufacturing
            Production Forecasting Optimization                                                Asset Analytics
            Analyses focus on the evaluation of promotion forecasting based on a               Analyses focus on the prediction of the lifetime of long term assets such as
            measurement framework of forecasting accuracy/error, bias and                      building, large machinery and other structural elements. This is done by
            stability. Improving forecasting accuracy can potentially lead to                  calculating the influence of for instance weather, material and usage of
            reductions in excess inventory, lower labour costs, lower expedite                 the assets.
            costs, holding costs, spoilage discounts and reduced stock-outs.

             Production Efficiency                                                             Production Planning
             Analyses focus on proactively addressing challenges such as the increase of       Analyses focus on the support of delivering more scientific and data based
             efficiency and reduction of costs, but also to help identify opportunities for    real time contingency plans by generating optimal solutions in short time
             consolidating facilities and determine outsourcing and offshore transfer          windows after certain disruptions happen.
             solutions for international and domestic organizations.

            Workforce Safety                                                                   Quality Analytics
            Analyses focus on the identification of the key factors impacting safety           Analyses focus on identifying the high impact issues and understanding
            related incidents, the design of measurable interventions to minimize              a facility’s past performance. The solution consolidates information
            safety risk and the prediction of types of person(s) who are most at               allowing a better understanding of the organization’s scope drilling
            risk to get hurt.                                                                  down to a single facility to make actionable decisions.

© 2017 Deloitte The Netherlands                                                                                                      Fast Moving Consumer Goods Analytics Framework   16
Case study – Production Forecasting Optimization
Production forecasting is a key capability for many manufacturers, improving
forecasting performance is vital to improve product stock-out, while decreasing costs
due to excess inventory
Extra-large error every
x periods may indicate
Accuracy consistently incorrect
Challenge
assumption(s)
Accurate forecasting is a key ability to ensure competitive advantages for every manufacturer. Improving
forecasting capability should be a continuous effort in which periodic or continuous forecasting performance
Autocorrelation
evaluation is an important element. Forecasting demand in FMCG is challenging due to three main reasons: (1)
Demand noise and volatility of demand in market (2) introduction of new products and (3) product promotions
Planner Level of
Accuracy
LAG
Received
Statistical by Supply
Forecast Planning
1 2 3 4 5 6 7 8 9 10 11 12 13 14
Approach
accuracy Promotion forecasting evaluation is performed based on a three-pronged measurement framework. Performance
is measured in terms of (1) forecasting accuracy (or forecasting error), (2) forecasting bias and (3) forecasting
stability. For each of these measurements, several metrics exist and care should be taken to use the most
Production forecast suitable performance metric
performance
Bias stability
Results
Noise Bias Period 1 Period 2
Improving forecasting accuracy can lead to reduction of excess inventory, lower labor costs, lower expedite cost,
holding cost, spoilage discount and reduce stock-outs
+ + + +
- - - -
© 2017 Deloitte The Netherlands Fast Moving Consumer Goods Analytics Framework 17Approach – Production Efficiency
Analytics is imperative to quickly and comprehensively evaluate your production
process, identify opportunities for improvement and customize solutions that quickly
drive measurable results
Throughput statistics
Challenge
At any stage of a company’s evolution, improving operating performance is important. Lean methodologies
applied to nearly any organization enable an efficient and lean enterprise. Analytics can support manufacturers
to proactively address the challenges they face today. If applied correctly, analytics can become a major driver
for Lean Six Sigma and other process improvement disciplines seeking to increase efficiency and reduce costs
Analytics assist management teams to devise the appropriate process control strategy and support its
implementation.
Approach
Different methods are applied to uncover potential inefficiency and cost reduction opportunities such as:
Value added activities • Outlier detection
• Predictive modelling
• Scenario modelling
• Optimization & simulation
Key results of production efficiency analytics include;
Results
• identifying opportunities for consolidating facilities, outsourcing and off shore transfer solutions
• identifying unprofitable product lines for manufacturing operations
• reducing idle time for production facilities
• reducing defects and waste
© 2017 Deloitte The Netherlands Fast Moving Consumer Goods Analytics Framework 18Case study – Workforce Safety Analytics
Thorough understanding of the dynamics of workplace incidents through the use of
advanced analytics
Injury Risk Profiles
Traditional safety analytics defines the scale of the safety problem, but routinely lacks the insights as to why
Challenge
those safety events occur. A strategic safety profiling analysis can:
• Objectively identify the key factors and behaviours that impact safety related incidents and then design
measurable interventions to minimize safety risk
• Use the profiling model to predict which type of person(s) will get hurt and which employees are most at risk
Injury & Accidents by site
Approach
Over 1.000 unique employees over three years of employee or contractor related data sets have been analysed.
Next, a model is estimated based on this data and the results have been visualized in a dashboard
Injury Impact Driver
• Reduced overall safety risk profile and associated disruption costs
Results
• Actionable and targeted recommendations regarding what operational changes to consider to help
minimise incidents
• Ability to track, measure and report of the effectiveness of the safety compliance program and internal efforts
to minimise risk
© 2017 Deloitte The Netherlands Fast Moving Consumer Goods Analytics Framework 19Case study – Asset Analytics
Asset Analytics enables effective decision making by identification and quantification
of asset-related risks
Data exploration
Challenge
For a water distribution utility company, Deloitte developed a model to predict maintenance of pipes. Asbestos
cement pipes may fail due to deterioration caused by lime aggressive water, in combination with other factors
such as traffic loads, point loads and root growth. Errors could have major consequences for the water utility,
customer satisfaction, safety and the environment
Pattern recognition
Approach
During a five week project, asset data such lime aggressiveness of the water, diameter, wall thickness and age of
the pipes was combined with geographical data such as region, soil type and pH and groundwater level. Based
on this dataset, 3 predictive models were trained and evaluated to predict the deterioration of the cement pipes
due to lime aggressive water
Model evaluation
Results
The analysis revealed which asset properties and geographical variables were most informative in the prediction
of pipe failure. Combined with information about the consequences of pipe failure, a quantitative risk model for
the failure of cement pipes could be developed
© 2017 Deloitte The Netherlands Fast Moving Consumer Goods Analytics Framework 20Case study – Production Planning
By taking into account certain production planning variables this analysis enables
real time contingency planning for a complex, multi-layered network in case of disruptions
Network visualization
Challenge
Analytics is supporting production planners to proactively address possible unforeseen planning challenges.
This analysis enables real time contingency planning for a complex, multi-layered supply chain network when
certain disruption happen by taking into consideration information about cost, service level, and historical
disruption durations
Real-time contingency input
Approach
An optimal routing plan for a supply chain network is generated under normal conditions using network
programming with the following input: manufacturing costs, capacity and the customer demand of retailers.
Disruptions are real-time resulting in a better suited contingency plan, which enables cost reductions
Trade-off evaluation
Results
Compared to traditional predefined contingency plans, a real time contingency plan is set-up (also incorporating
the considerations of current supply chain status, including initial stock, utilization rate, etc.) to achieve the
expected customer service level with cost efficiency
© 2017 Deloitte The Netherlands Fast Moving Consumer Goods Analytics Framework 21Case study – Quality Analytics
Quality Analytics enables to filter to high impact issues and understand a facility’s
past performance
Facilities overview
Challenge
The client was an organization responsible for assessing the security compliance of a large number of
organizations. Disparate reporting and data collection techniques made it difficult for staff and leadership to
prioritize action and identify problem areas
Region overview
Approach
The dashboard gathered all facility information consistently, provided the ability to filter to high impact issues
and understand a facility’s past performance. The solution consolidates all the organizations information that
allows the user to understand the scope of their organization while also being able to drill down to a single
facility in order to make actionable decisions
Facility prioritization tool
Results
The solution provides views for the three types of individuals in the organization (Representative, Field office,
and Regional Manager) as well as prioritization tools and facility details. The tool allows an individual user to
focus on high priority facilities, but with changing definitions of priority. In addition each user can see all the
information they need to understand the scope of their assignments and make decisions
© 2017 Deloitte The Netherlands Fast Moving Consumer Goods Analytics Framework 22FMCG Analytics Framework – Logistics © 2017 Deloitte The Netherlands Fast Moving Consumer Goods Analytics Framework 23
FMCG Value Chain – Logistics
In the Logistics process of the FMCG value chain, analyses are focused on optimizing
delivery, shipments and warehousing performances

                                                                                        Logistics
             Location Analytics                                                                     Supply Chain Diagnostics
             This type of analysis helps solve the problem on what the optimal location is          Supply chain diagnostics aims at enabling and improving the ability to
             for a certain facility, based on geographical data. As an example, the fire            view every item (Shipment, Order, SKU, etc.) at any point and at all
             department would want their facilities to be spread throughout a city, so              times in the supply chain. Furthermore its goal is to alert on process
             that a fire at any point in the city can be reached with an acceptable                 exceptions, to provide analytics, and to analyse detailed supply chain
             response time.                                                                         data to determine opportunities of cycle time reduction.

            Inventory Diagnostics                                                                    Fulfilment Intelligence
            What is the optimal inventory level that on the one hand makes sure                      Focuses on increased reliability of purchase order submission process
            that the customer receives their goods on time, and on the other hand                    until delivery. Analysing supply chain for identification of common or
            ensure that the holding and ordering costs are as low as possible? The                   consistent disruptions in fulfilment of orders. Reliability is key, even more
            goal of the analysis is to solve this problem for the client.                            so than speed.

            Resource & Route Optimization                                                            Reverse Logistics
            The goal of the model is to optimize the available resources and truck                   In case of malfunctioning products, companies have to deal with the process
            routes. This is executed to maximize profitability by implementing the                   of reverse logistics. By getting more detailed insights in the costs of this
            new optimized route planning model which leads to a reduction of the                     process, companies can have a better focus on how to reduce these costs.
            resource usage.

© 2017 Deloitte The Netherlands                                                                                                             Fast Moving Consumer Goods Analytics Framework   24
Approach – Location Analytics
Find whitespots in distribution centers locations
Current distribution
locations
Challenge
Distribution
center A company the Netherlands wanted to expand their business. They want to improve delivery times to the store
location by creating one or more extra distribution centres in the Netherlands. The centres should be placed in
Distribution locations such that they get maximum value in lower delivery times, now and in the near future
center
Determine travel-time
to centers
Approach
For the approach we start from the current distribution centre locations. From these locations we can calculate
the traveling time to stores using Dijkstra’s algorithm. This gives us for each location on the map the travel time
to a distribution centre. These results can then be visualized in a heatmap to immediately locate whitespots in
the store distribution. Furthermore an optimization algorithm was run to determine the optimal distribution of
distribution centres
Visualize and
monitor results
Results
With our results and the new locations the fire departments were able to:
• Significantly reduce the response time, saving lives and reducing costs at the same time
• Reduce the total number of fire departments, while giving better response time performance
© 2017 Deloitte The Netherlands Fast Moving Consumer Goods Analytics Framework 25Case study – Inventory Diagnostics
Delivering a robust and user friendly Global Transit Planning Tool
Lane detail
To empower transportation personnel to more efficiently analyse ocean and air supply chain shipment data, a
Challenge
global operating company internally designed a Global Transit Planning (GTP) tool in Tableau. However, the
tool did not achieve high user adoption, since analyses were not intuitive and high manual data updates
were required
The Deloitte team was asked to enhance the tool and incorporate a robust data blending process
Carrier rank
Approach
Enhancing the GTP dashboard and blending the data was achieved in four subsequent phases consisting of:
research, visioning, prototyping and iterating
In the prototyping phase, the team built and refined the dashboards and wrote a Python script which indicates
how the various data sources should feed into the unified view of data
Carrier comparison
Results
The existing GTP tool was adjusted to provide maximum flexibility, automation and collaboration. The user flow
allows users to interact in one cohesive interface, while providing tailored information to their specific role.
The redesigned GTP tool is now well adopted within the organization and used on monthly basis to enable more
effective inventory planning decisions, resulting in the gradual and continuous reduction of in-transit inventory
© 2017 Deloitte The Netherlands Fast Moving Consumer Goods Analytics Framework 26Case study – Resource & Route optimization
Maximizing profitability by optimizing resource planning and route optimization
Clear understanding of
all steps
Challenge
A Dutch client that handled waste disposal for large companies struggled with its profitability. After analysis it
was confirmed the one of the key issues was the suboptimal resource planning. Resource planning of trucks and
drivers was done manually, even sometimes by the drivers themselves. The client asked Deloitte to develop and
system for finding optimum routes for their trucks
Approach
First Deloitte created an overview of all different customer locations, the number of available trucks per location,
the working hours, pickup points. Next we calculated the drive time matrix between the different locations.
Subsequently Deloitte created a model that would use a customized ‘cost function’ in which weights could be
given to driving time and driving distance. The cost function would then be optimized and by doing so, providing
the optimal routing for each truck for each day
Optimization process
Results
The model Deloitte created was able to plan to optimal routes for the different trucks much faster and efficiently
than the client was able to do. The new route planning model showed that it was possible to significantly reduce
resource usage – it was possible to sell trucks without loss of client service and satisfaction
© 2017 Deloitte The Netherlands Fast Moving Consumer Goods Analytics Framework 27Case study – Supply Chain Diagnostics
Provide insight into key drivers of delivery in full and on time and improving
coverage throughout the supply chain
Clusters of coverage rates and insights visualized in a dashboard
In this particular company, millions of products are continuously being produced and
Challenge
shipped to distribution centres around the globe. In order to satisfy customer demand in
time, it is necessary that the coverage is in order, i.e. the percentage of the products
that arrives at the distribution centres on time and in full. In order to improve the
coverages and meet the set targets, the company wanted insight into the drivers that
most influence the coverage and eventually also the delivery in full and on time.
Therefore they asked Deloitte to perform a detailed analysis on their data
Approach
Collected the ‘15 week coverage rate’ for full year of orders. A clustering technique was
used to cluster 26,000 coverage rates. This technique groups the coverage patterns in
Collected coverage patterns transformed into the identified clusters
buckets of similar patterns, which then comprise a single cluster. Eight buckets of
different coverage patterns were visualized and these buckets gave insight in the drivers
of the coverage for the orders
Coverage patterns of 26000 orders
Coverage
Extracted key insights with incremental business potential such as:
Results
• Carrier performance has the largest impact on the coverage
• Good coverage is usually caused by slack in factory performance
• Identified significant number of orders that were only slightly (1–7 days) late and
1 2 3 4 5 6 7 8 9 10 11 12 13 14 15 could be quick wins
Week • Actionable insights to improve process and areas of the order pipeline
© 2017 Deloitte The Netherlands Fast Moving Consumer Goods Analytics Framework 28Case study – Fulfilment Intelligence
Gaining insights into the digital order pipeline to improve order fulfilment and
speed of delivery
Clear understanding of
all steps
Challenge
Over the last years, online sales channels have become more and more important for companies. With the
increase of online channels, however, customers have become more demanding in terms of delivery time and
service. Reliability is therefore extremely important, even more so than speed. Therefore a large company asked
Deloitte to create a clear picture of the Direct-to-consumers online purchase order submission process through
the different systems and increase the reliability of this process
Deviation from reference
time per order per step
Of the 70,000 total submissions, roughly 70% was completed within the allowed time. 22% was completed at
Approach
around roughly twice the maximum amount of time, 7% within about 6 times the maximum and 1% took even
longer. The analysis was focused on the group that was completed in twice the maximum time (22%) which held
the largest opportunity to identify the delay drivers. Timestamps were created for different stages in the order
submission process combined from multiple source systems. A clustering on deviation from the reference per
time stamp was performed
Optimization opportunities
Results
The analysis led to the identification of several steps within the process that could be improved with low effort
for a relatively high gain. In total more than 20 improvements were made based on the analysis results, leading
not only to a more reliable order submission process, but also to an average time reduction per order of 50%. As
a results, customer satisfaction and loyalty increased
© 2017 Deloitte The Netherlands Fast Moving Consumer Goods Analytics Framework 29Case study – Reverse Logistics
Reducing costs on reverse logistics by analysing end-to-end process
Sankey diagram of
product flow
Challenge
A global technology firm struggled with high costs on their service logistics. The scope of service logistics
consisted of shipping parts to client sites and take care of returning the defective parts to global re-
manufacturing sites. Clients were served with premium service levels (i.e.FMCG Analytics Framework – Business Management & Support © 2017 Deloitte The Netherlands Fast Moving Consumer Goods Analytics Framework 31
FMCG Value Chain – Business Management & Support
In the Support process of the FMCG value chain analyses are focused on determining
potential improvements in the organization

                                                                 Business Management & Support
            Workforce Analytics                                                           Business Process Analytics
            Encompasses workforce planning and analytics across all phases of the         Help clients to understand their risk exposure better, and to proactively
            talent lifecycle. The workforce planning component provides insights          identify and mitigate sources of risk on an enterprise scale. Armed with this
            and foresight into addressing current and future talent segment               information, executive management and boards will be better equipped to
            related challenges and development. Moreover, this offering applies           navigate challenging economic conditions.
            analytics solutions to key talent processes.

            Sustainability Analytics                                                      Program/portfolio analytics
            Helps clients with sustainability related strategies such as assessing        Enables clients to model their program/portfolio performance y providing fact
            future environmental and health impacts. Using an overview of the             based insight into the performance of the total portfolio down to project
            most important resources and an insights in the product lifecycle, a          level. Among other things, It allows clients to prioritize projects better,
            prioritisation can be made which product categories are most at risk          identify potential budget overruns in an early stage and optimize resource
            and which show the most potential.                                            allocation.

            Finance Analytics
            • Working capital, spend analytics, double payment, risk and tax analyses
            • Helping clients to get control of their financial data, finance analytics
              enable clients to model business processes and gain deeper insight into
              cost and profitability drivers.

© 2017 Deloitte The Netherlands                                                                                                 Fast Moving Consumer Goods Analytics Framework   32
Case study – Workforce Analytics
Strategic Workforce Planning: planning the talent needed for sustainable growth
Clear process to ensure evidence
based outcomes
Challenge
Clients experience a continuously changing environment in which they have to operate. Within this environment
new products and new sales channels are discovered. In order to be able to gain full advantage of these new
opportunities a variety of new skills within the workforce are needed
Using data from different sources such as People-, Customers-, Work- and Finance data, insights can be
Approach
derived in:
• Identifying critical workforce segments. Mapping segments/skills that drive a disproportionate amount of value
Workforce planning tools
creation in comparison to their peers
• Identifying current demand drivers and defining a demand model
• Defining and executing a workforce planning to analyze gaps in the current supply and demand for critical
workforce
Clients get a view of how they should move from the current workforce to the workforce needed in 5 years
Results
from now
The approach used makes sure that clients can use evidence based decision making supported by a variety of
fact based workforce planning tools
© 2017 Deloitte The Netherlands Fast Moving Consumer Goods Analytics Framework 33Case study – Sustainability Analytics
Sustainability analytics enforces company’s sustainability-related initiatives
Prioritization of
Product Categories
Challenge
Sustainability analytics can help companies reduce key resource use and at the same time making them less
vulnerable to price and supply volatility. Future risks and opportunities can be identified in areas such as
environmental and health impacts – both within the organization and across the extended supply chain. The
challenge lies in generating the most influential insights from relevant data. These insights are necessary to
develop sustainability related strategies and to improve overall (resource use) efficiency
Reduction Product Analysis
Approach
The approach is divided into three actions:
• Develop a normalized and comprehensive view of resource use to understand (and prioritize) the hot spots
• Conduct a comprehensive analysis of products/services lifecycles to quantify the risks/opportunities
• Align/develop a sustainability strategy using the results of the executed analyses
Supplier Ranking
• Prioritization of product categories: an identification of the top product categories and a prioritization of
categories with most improvement potential
Results
• Reduction product analysis: Development of an implementation strategy and value propositions for the
opportunities of the highest prioritized product groups (how to reduce costs, increase customer preference and
reduce risk)
• Supplier ranking: Ranking of suppliers based on sustainability performance to create individualized
“sustainability report cards” which can be integrated in category buying decision making
© 2017 Deloitte The Netherlands Fast Moving Consumer Goods Analytics Framework 34Case study – Working capital
“The Dash for Cash”: Using the Deloitte WCR Cashboard to drive sustainable
performance improvements in working capital
WCR Cashboard
Cash-Conversion-Cycle
As companies try to stay their course in the downturn and beyond, cash is back as king. Working capital is one
Challenge
of the few remaining areas which can rapidly deliver a significant amount of cash to a business without a large
restructuring program
The client asked Deloitte to help in the challenge to free up working capital. Reducing working capital in the
short term is fairly easy; making reductions sustainable and changing the mind-set in operations to that of a
Payables – Purchase to Pay CFO is more difficult
Approach
To enable sustainable reductions, Deloitte deploys a cash-oriented, entrepreneurial approach to working capital
Inventory – Forecast
management that focuses on concrete actions and creating a “cash flow mind-set" to shorten the cash
to Fulfill conversion cycle. The Cashboard™ is a flexible & configurable dashboard that is powerful but still exceptionally
easy to use. As such, it allows frontline operations staff at companies to zoom in on the key opportunities, risks,
trade-offs and root causes
Receivables – Order
to Cash
• It enables continuous monitoring of the working capital levels throughout the entire company – including all
Results
Business units and all geographies
• The interactive environment enables context driven analysis by time, customer, product, business line etc.
• Real time insight into current performance
• Easily adjustable and expandable to your company’s specific needs
© 2017 Deloitte The Netherlands Fast Moving Consumer Goods Analytics Framework 35Case study – Spend Analytics
Deloitte Spend & Procurement Analytics provides deep insight in the composition of
the volume of spend and identifies key savings opportunities
General overview
The client was struggling with identifying improvement opportunities because of inaccessible information. As a
Challenge
result, the client was unable to drill down and analyse individual orders and problem solving was limited to the
strategic level
The client asked Deloitte to help identify opportunities for continuous improvement for cost reduction and
provide additional insights into the spending trends of the organization
Price analytics
Approach
Our Spend & Procurement Analytics approach facilitates short time-to-deploy and delivers easy-to-use insight
and contains these key components:
Supplier view • Easy upload of procurement data through standard interfaces
• Engine to create a bottom up calculation of your company’s most important Spend KPIs
• Interactive dashboard enabling context driven analysis by time, supplier, product, business line
Geographical view
Through the Spend & Procurement Analytics Dashboard efficiency and savings opportunities can be identified in
Results
several areas:
• Improve process efficiency by identifying fragmented spend and invoicing
• Identify and expel maverick buying
• Negotiate better contracts
• Reduce costs by optimizing the purchase to pay process
© 2017 Deloitte The Netherlands Fast Moving Consumer Goods Analytics Framework 36Case study – Double Payments
Because paying once is enough!
Double invoice tracker
Who pay their invoices twice? Well, for one, all major organizations in 1% of the
Challenge
cases. They usually know this but have no means for pinpointing exactly which
invoices are paid twice
Many organizations check for invoices paid twice, but rarely detect them all. This can
be caused by inaccurate master data or errors due to invoice entries. The
organization asked Deloitte to help in detecting double payments in a better way
The Deloitte Double Invoice Tracker examines all individual invoices, over multiple
Approach
periods in full detail. The Invoice Tracker detects inaccuracies in the master data by
using specially designed algorithms.
By cleverly cross-referencing inaccuracies in the master data with those in the
invoice entries, the Double Invoice Tracker can find lost cash and insights into the
master data quality
The Deloitte Double invoice tracker saves money and helps improving master data
Results
quality, by giving:
• An overview of all the invoices paid twice, including supplier information, so the
restitution process can be started immediately
• Insights into the master data quality
• Insights into the aggregate purchasing expenditures and how these are divided
© 2017 Deloitte The Netherlands Fast Moving Consumer Goods Analytics Framework 37Solution – Business Process analytics
Deloitte’s process analytics solution Process X-ray reconstructs what really happened
in the process and provides the capabilities to find the root cause
End-to-end process view
Process variation is at least 100 times greater than clients imagine. In fact, 5,000 or more variations are
Challenge
common in most end-to-end processes. Such high levels of variability are a natural enemy of scalability,
efficiency, and process control
Process -ray
Process execution is facilitated by different departments and functions, making it difficult to get and end-to-end
view of the process
Throughput times
X TM
Process analytics provides visibility of what is really happening based on the actual event data captured in
Approach
transactional systems. This is far different from the subjective recollections or assertions of people
It provides end-to-end visibility of the process, tearing down the walls between functions and departments and
providing an internal benchmark
Process analytics offers the scalability to analyze large volumes of transaction data from different systems (SAP,
Oracle, JDEdwards, SalesForce, etc.)
Handovers
Organizations can benefit from iPL by:
Results
• Reducing operational cost
• E.g. identify and reduce rework activities
• Increasing control & compliance
• Monitor segregation of duties
• Reducing working capital
© 2017 Deloitte The Netherlands Fast Moving Consumer Goods Analytics Framework 38Solution – Program Portfolio Analytics
Deloitte’s iPL solution enables timely monitoring by disclosing project portfolio
performance anytime anywhere
Deloitte’s iPL
Portfolio management
Typical challenges that an organization faces relating to monitoring the portfolio performance:
Challenge
• Getting performance reports is very time consuming and therefore the frequency of delivering these reports is
usually low
• The reports created are static and therefore provide no possibilities to analyze into a detailed level and from
different perspectives
Finance
• Decision making is mostly based on one dimension only (e.g. time spent)
Approach
Deloitte’s iPL solution is aimed at fact based prioritization and tracking of project performance and enables
financial, resourcing, risk and issue analyses
Resource management iPL combines data from multiple sources and visualizes the results in an interactive analysis environment which
can be accessed online
Organizations can benefit from iPL by:
Results
Planning & Scheduling
• Prioritizing based on the progress made and effort utilized by projects
• Proactively managing potential underperforming projects
• Better predicting the cost at the completion of the project based current performance
• Resource gap analysis and earned value analysis (budget spent vs value delivered).
© 2017 Deloitte The Netherlands Fast Moving Consumer Goods Analytics Framework 39Project Approach © 2017 Deloitte The Netherlands Fast Moving Consumer Goods Analytics Framework 40
Our Analytic Insights project approach
Our comprehensive and flexible methodology for Analytics projects ensures we can deliver
business critical insights within time and budget

                                     A typical Analytic Insights project takes 8-12 weeks following three main phases connected to our approach

                                   2-3 weeks                                      4-6 weeks                                      2-3 weeks

                                  Understand                                       Analyze                                         Insights

             Assess Current                 Acquire &                 Prepare &                                         Evaluate &                        Report &
                                                                                            Analyze & Model
               Situation                 Understand Data            Structure Data                                       Interpret                       Implement

Approach
Our structured approach has been built up from our experience in analytical engagements. It comprises of 6 steps to maximize project oversight. Each step
allows looping back to previous steps to apply the insights gained in subsequent steps.

Critical success factors
To ensure maximal knowledge transfer in both ways we would need to work closely with key experts in client’s business and IT departments. Rapid access to potentially
disparate source data and support in understanding the data is essential in order to build up the data structures required for the analytical models.

© 2017 Deloitte The Netherlands                                                                                                      Fast Moving Consumer Goods Analytics Framework   41
Why Deloitte? © 2017 Deloitte The Netherlands Fast Moving Consumer Goods Analytics Framework 42
Deloitte maintains a market-leading global Analytics practice with extensive
experience in FMCG
We understand what your challenges are as well as the current and future analytics
market, placing Deloitte in a unique position to assist you

                                     Global Reach                                                                           Recognized leader in Analytics
                                                         •   With over 9,000 BI and                                                                    •   “Deloitte shows growth and innovation
                                                             analytics resources                                                                           leadership through investment in
                                                             worldwide, we are recognized                                                                  acquisitions (with 22 analytics-related
                                                             as one of the leading BI&A                                                                    acquisitions since 2010), technology
                                                             service providers                                                                             partnerships, alliances and intellectual
                                                         •   Unique combination of                                                                         property.”
                                                             deep industry expertise,                                                                  •   “Deloitte has a strong focus on
                                                             analytics capability and                                                                      innovation, including Deloitte's Insight
                                                             understanding of decision-                                                                    Driven Organization (IDO) Framework,
                                                             maker’s roles to maximize                                                                     breakthrough labs to meet clients'
                                                             value                                                                                         demands, and Highly Immersive Visual
                                                                                                                                                           Environment (HIVE) labs, as well as a
                                                                                                                                                           breadth of analytics accelerators.”
                                  Vendor independent                                                                                                   •   “All is available through its global network
                                     •   We recognize the importance of the right                                                                          of 21 Global Delivery Centers and
                                         technology, but we also understand the                                                                            25 Deloitte Greenhouses.”
                                         necessity of finding pragmatic and efficient ways
                                                                                             Source: Gartner, Magic Quadrant for Business Analytics Services, Worldwide. September 2015
                                         to iteratively build the required capabilities
                                     •   Our relationships with, and understanding of,
                                         technology vendors is strong, covering an
                                         impressive range of different products – but,
                                         crucially, we remain vendor independent.
                                     •   We are focused solely on helping clients to
                                         develop a practical Information and Analytics
                                         strategy - incorporating the necessary
                                         technologies and introducing the most
                                         appropriate vendors.

© 2017 Deloitte The Netherlands                                                                                                                             Fast Moving Consumer Goods Analytics Framework   43
Deloitte’s areas of expertise in Analytics
We have build a wide area of expertise, covering all important streams within the field of
Analytics & Information Management
Big Data Management Data Discovery & Visualization Advanced Analytics
Visualization is vital to Understanding the data is key
A clear vision is imperative for understand what can be done to advance to the next level,
success, policies, practices and with data, storytelling, nowadays more advanced
procedures that properly manage advanced visualization & methodologies allow for an
the collection, quality and dashboarding are useful tools to even deeper understanding than
standardization determine what is happening ever before
Big Data Management has to Information has to be
be future-proof and secure, displayed correctly, clearly
that connects with more and and without distraction in a Methodologies such as Text
more different data manner that can be quickly Mining, Segmentation or
sources; structured, examined and understood. Predictive Analytics go
unstructured, internal and
beyond traditional
external
understanding
Big Data is all about processing This allows for actionable
It allows the user to view both
huge amount of data using insights that have a direct effect
simple and complex data at a
commodity hardware that offer on the business and can help the
glance and see abnormalities,
better information, more insights user to understand what is
dependencies and trends that
and more opportunities for a happening and optimize their
would not have been apparent in
growing business business
tables
© 2017 Deloitte The Netherlands Fast Moving Consumer Goods Analytics Framework 44Deloitte’s approach towards becoming an Insight Driven Organization (IDO)
Considering analytics with a wider lens than just technology
IDO Framework Planning the Journey
• The application of analytics and The journey towards
its importance will increase in becoming an IDO is about
the coming years. The World is Evolution, not Revolution.
increasingly complex and fast The key principle is
moving which makes getting it sequencing the activities to
right increasingly difficult. deliver the Vision and early
benefits, recognizing existing
capability constraints.
• An IDO asks the right
Becoming an IDO relies on a
questions of itself, they are
foundation of the
more analytical, which
fundamental building blocks
improves the decision making
of People, Process, Data
process and the identification
and Technology, informed
of the most appropriate action.
by an Analytics Strategy.
• As an IDO, you could:
Making it Happen
• Make the same decisions Insight Process Enabling Platform
Outlook Non-IDO IDO faster
Purple People
Past What has happened? Why and how did it • Make the same decisions
happen? cheaper
Present What is currently What is the next best • Make better decisions
happening? action?
• Make innovations in products
Future What is going to What does simulation and services
happen? tell us; the options;
the pros and cons?
© 2017 Deloitte The Netherlands Fast Moving Consumer Goods Analytics Framework 45Deloitte Greenhouse
Deloitte Greenhouse offers different types of immersive analytics sessions
Analytics Lab
The Analytics Lab, hosted in Deloitte’s innovative Greenhouse environment, is an inspiring and energetic workshop to uncover the impact of data analytics and visualization for your
organization. Participants are provided with a unique opportunity to experience hands-on analytics in a fun and innovative setting, facilitated by Deloitte’s industry specialists and
subject matter experts.
Art of the Possible Visioning
An inspiring two-hour session including analytics and data A collaborative session to wireframe a custom analytics or
visualization demos, used as a starting point for an open visualization solution, supporting a selected business
discussion on the potential impact of analytics for your challenge. The session is facilitated by Deloitte’s user
organization. experience, data visualization and analytics experts.
42
© 2017 Deloitte The Netherlands Fast Moving Consumer Goods Analytics Framework 46You can also read