Crowdsourcing Analysis of Twitter Data on Climate Change: Paid Workers vs. Volunteers - MDPI
←
→
Page content transcription
If your browser does not render page correctly, please read the page content below
sustainability

Article
Crowdsourcing Analysis of Twitter Data on Climate
Change: Paid Workers vs. Volunteers
Andrei P. Kirilenko 1, *       ID
                                    , Travis Desell 2 , Hany Kim 3 and Svetlana Stepchenkova 1
 1    The Department of Tourism, Recreation and Sport Management, University of Florida, P.O. Box 118208,
      Gainesville, FL 32611-8208, USA; svetlana.step@ufl.edu
 2    The Department of Computer Science, University of North Dakota, Streibel Hall, 3950 Campus Road Stop
      9015, Grand Forks, ND 58202-9015, USA; tdesell@cs.und.edu
 3    The Department of Business Administration and Tourism and Hospitality Management, Mount Saint
      Vincent University, 166 Bedford Highway, Halifax, NS B3M 2J6, Canada; Hany.Kim@msvu.ca
 *    Correspondence: andrei.kirilenko@ufl.edu; Tel.: +1-352-294-1648

 Received: 25 September 2017; Accepted: 30 October 2017; Published: 3 November 2017

 Abstract: Web based crowdsourcing has become an important method of environmental data processing.
 Two alternatives are widely used today by researchers in various fields: paid data processing mediated
 by for-profit businesses such as Amazon’s Mechanical Turk, and volunteer data processing conducted
 by amateur citizen-scientists. While the first option delivers results much faster, it is not quite clear
 how it compares with volunteer processing in terms of quality. This study compares volunteer and
 paid processing of social media data originating from climate change discussions on Twitter. The same
 sample of Twitter messages discussing climate change was offered for processing to the volunteer
 workers through the Climate Tweet project, and to the paid workers through the Amazon MTurk
 platform. We found that paid crowdsourcing required the employment of a high redundancy data
 processing design to obtain quality that was comparable with volunteered processing. Among
 the methods applied to improve data processing accuracy, limiting the geographical locations of
 the paid workers appeared the most productive. Conversely, we did not find significant geographical
 differences in the accuracy of data processed by volunteer workers. We suggest that the main driver
 of the found pattern is the differences in familiarity of the paid workers with the research topic.

 Keywords: citizen-scientist; climate change; crowdsourcing; MTurk; social networks; Twitter

1. Introduction
      Development and applications of climate change policies require their acceptance and support
by the public. The traditional method of measuring public perceptions of climate change relied on
surveys, such as the Climate Change in the American Mind [1]. Recent development of social media,
however, offered new, unobtrusive opportunities for measuring public perceptions of climate change
worldwide. In this new line of research, Twitter, the fourth most popular social networking site,
is the medium most frequently used in research. EBSCO Academic Search Primer database contains
23 journal articles with the words “Twitter” and “Climate change” in the abstract as compared to
Facebook (the most popular social media site, 14 journal articles), YouTube (second most popular social
media site, 4 journal articles), Instagram (third most popular social media site, 1 journal article), and
Reddit (fifth most popular social media site, no journal articles).
      Very few of these papers, however, utilized the “Big Data” advantage of social media, exploring the
content of the large corpora of Twitter messages. Kirilenko and Stepchenkova [2] used a 1-million sample
of tweets to research geographical variations in climate change discourse worldwide. Cody et al. [3]
analyzed 1.5 million tweets containing the words “climate” to explore temporal changes in sentiment
(described in the paper as “a tool to measure happiness”) expressed by the people in relation to climate

Sustainability 2017, 9, 2019; doi:10.3390/su9112019                          www.mdpi.com/journal/sustainability
Sustainability 2017, 9, 2019                                                                            2 of 15

change. Yang et al. [4] researched the effect of climate and seasonality on depressed mood using
automated content analysis of 600 million tweets. Holmberg and Hellsten [5] studied 250 thousand
tweets to identify gender differences in climate change communication. Leas et al. [6] analyzed the
impact of a celebrity speaking on climate change on social media discussion. Kirilenko et al. [7]
and Sisco et al. [8] analyzed the impact of extreme weather events on attention to climate change in
social media.
      The scarcity of “Big Data” research on climate change perceptions expressed in social media is
related to the challenges in content analysis of large volumes of texts. Classification of social media
messages requires considerable monetary and time investments, which easily become prohibitive
when large datasets are processed. Even when machine learning methods are used, supervised
classification still requires a manually classified sample that serves for both algorithm training and
for groundtruthing. One popular solution to this research bottleneck is to break the work into small,
manageable, easily understandable tasks and then to use the Internet to outsource processing of each
task to amateur scientists (referred to as “workers”) acting as volunteers or contractors. This method
was popularized by Howe [9] as “crowdsourcing”. The most famous crowdsourcing effort is probably
the Galaxy Zoo project targeted at the classification of imagery of over one million galaxies collected
by the Sloan Digital Sky Survey [10], which so far has produced over 50 million classifications [11,12].
      The challenge of outsourcing data processing to untrained workers (either volunteered or paid)
is associated with quality control. While a significant body of literature studied the quality of paid
crowdsourcing (mostly Amazon’s Mechanical Turk; further “MTurk”), and few papers dealt with
the quality of volunteered crowdsourcing, we are aware of only two studies that attempted to compare
the performance of paid and volunteer workers processing the same data in crowdsourced projects.
A research completed by Mao et al. [13] investigated the performance of volunteer and paid crowd
workers in exoplanet detection through analysis of the planet transit light curves. A set of light
curves was offered to volunteer citizen-scientists through the crowdsourcing platform Planet Hunters
(www.planethunters.org). A visually similar interface was built as a set of the Amazon MTurk tasks and
offered to the paid workers. Overall, the performance of the paid workers was the same or only slightly
below that of the volunteer workers, which might be partially related to the high hourly earnings of
the paid workers of $4.8–5.6/h compared to the mean earning of below $2/h in paid crowdsourcing
projects, as reported by Ross et al. [14]. The authors also noticed that the unpaid citizen scientists were
spending almost twice the amount of time on each task as compared to the paid workers.
      In a similar study design, Redi and Povoa [15] compared the performance of volunteer participants
recruited via Facebook and paid crowdsourcing workers in the estimation of the aesthetic appeal of
photographs processed with various filters. The authors found that volunteered work returned a higher
correlation between the mean image ratings obtained through crowdsourcing and in a lab experiment,
which demonstrated better reliability from volunteered crowdsourcing. They also reported a smaller
number of unreliable volunteer workers; however, the volunteers tended to leave the work unfinished
more frequently.
      Scientific research in high visibility fields is likely to appeal to citizen scientists, making volunteer
crowdsourcing a viable alternative to paid workers and ensuring the return of supposedly better quality
data. Both of the abovementioned studies that compare the volunteer and paid platforms, however,
dealt with same type of data (images) and returned somewhat inconsistent outcomes. We are not aware
of a similar comparison done for the textual data from social media. The exploding popularity of social
networks led to an ever increasing number of publications using social media data to study public
discourse in relation to various natural and/or socio-economic phenomena. Among the available
social networking sites, Twitter is one of the most frequently researched, with over 4000 publications
on Twitter listed at the Thomson-Reuters’ Web of Science.
      The goal of our study was to compare the quality of volunteer and paid workers’ classification
of Twitter messages (tweets) on climate change and provide recommendations on quality control.
The study was a part of a larger project on studying the geographical patterns of public perceptions of
Sustainability 2017, 9, 2019 3 of 15
climate change worldwide [2]. This article is organized as follows. In the second section, we provide
a brief review of research dealing with crowdsourcing, with an emphasis on quality control. Then,
we present our data and methodology. The results are presented in Section four. The fifth section
contains a thorough discussion of our results. Finally, Section six provides a brief conclusion, study
limitations, and recommendations for further research.
2. Crowdsourcing and Quality Control Issues
2.1. Crowdsourcing in Scientific Research
Multiple authors used crowdsourcing in their research of climate change impacts. Muller et al. [16]
reviewed 29 crowdsourcing projects related to climate change that involved volunteer citizen-scientists
engaged in data collection and/or processing. The crowdsourced applications included measurements
of snow, rainfall, and other weather data, reporting severe weather outbreaks, recording air quality data,
estimating the length of plane contrails (important contributors to warming troposphere), classification
of the satellite imagery of tropical cyclones, digitizing weather records found in the 19th century
ship logs and many others. Other climate researchers used paid contractor workers. For example,
Olteanu et al. [17] used crowdsourcing to process data on climate change coverage in mainstream
news and online. Samsel et al. [18] used massive crowd processing of color schemes for digital
mapping of ocean salinity change, related to climate change. When data volume is too large for manual
processing, even when crowdsourcing is involved e.g., due to costs, crowdsourcing may be used to
process a sample of data, which can further be used for training and validation of machine learning
algorithms. Thus, Yzaguirre et al. [19] used crowdsourcing to validate their text mining application for
extraction of past environmental disaster events in news archives. Paid crowdsourcing platforms are
also frequently employed for collecting public opinion data. Ranney and Clark [20] used volunteer
and paid online participants to collect data on knowledge about climate change. Attari [21] researched
peoples’ perceptions on their water use and found over two-times underestimation of consumed water.
Multiple factors promote the growing popularity of crowdsourcing. Between those, the most
important is probably its speed and cost. When data processing is easily parallelized, large volumes of
data can be processed quickly by breaking data analysis into small, easily comprehended micro-tasks
that do not require special training and are then solved by hundreds of citizen-scientists. On one hand,
multiple studies reported hourly wages of the crowd workers well below the minimum hourly wage
(e.g., [14]). The crowd workers are regarded as independent contractors, which generally frees their
employers from tax and legal obligations, reducing costs even further. On the other hand, projects that
are deemed socially important appeal to volunteer labor and can be completed at no monetary cost
at all—for example, the abovementioned Sloan Digital Sky Survey attracted over 150,000 volunteer
workers [11].
Many crowdsourcing platforms are available on the Web (for a review, see [22]). Among those
platforms specialized on outsourcing the micro-tasks, the Amazon’s Mechanical Turk platform
is probably the most popular one, having over 0.5 million registered workers (“Turkers”) from
190 countries [23] The demographics of the Turkers and an introductory guide to conducting
a crowdsourcing research on MTurk platform was published by Mason and Suri [24].
2.2. Quality Issues in Crowdsourcing
It has been repeatedly demonstrated that complex problems normally requiring advanced
technical training can be solved by crowdsourcing; examples include civil engineering [25],
bioinformatics [26], astronomy [12] and many others. Furthermore, under certain conditions, even
generating novel ideas and innovations can be crowdsourced with results comparable to those obtained
from experts [27]. Crowdsourced results may, however, be unreliable due to the following factors:Sustainability 2017, 9, 2019 4 of 15
• Instrumental errors arising from complex data pre- and post-processing, which involves multiple
third-party platforms used to prepare data for processing, send tasks to workers, collect processing
results, and finally, join the processed data.
• Involuntary errors by human raters, e.g., due to insufficiently clear instructions and workers’
cognitive limitations.
• Deliberately poor performance of the human raters. A worker may vandalize the survey and
provide wrong data, may try to maximize the number of tasks processed per time unit for
monetary or other benefits, may provide incorrect information regarding its geographical location,
or may lack motivation [28].
The last item in this list of potential error sources has attracted a lot of attention from practitioners,
due to its high potential to render project results unusable. A widely cited experiment that consisted
of rating Wikipedia articles by Amazon Mechanical Turk workers demonstrated only a marginally
significant correlation between the crowdsourced and experts’ ratings [29]. However, the same
study showed that simple changes in task design aimed at discouraging workers’ cheating, increased
the median time spent by a worker to complete one task from 1.5 to 4.1 min, decreased the percentage of
unusable classifications from 49% to 6%, and noticeably improved correlation with expert classification.
On the other hand, it seems only logical to suppose that deliberately poor performance should
not occur with voluntary participants, as they do not seek maximization of monetary gain from their
work. Indeed, a study of motivations of volunteer workers in a crowdsourced scientific project on
galaxy image classification [30] found that the primary motivation was seeking to contribute to original
scientific research (39.8% of the respondents), followed by an interest in the scientific discipline (12.4%)
and discovery (10.4%). Other motivations supplied by participants may, however, contribute towards
a “cutting corners” behavior: they include a desire to complete more tasks than other participants,
seeking fame for discoveries, and completing a homework assignment [30].
The data quality problem is typically resolved by heavily redundant designs where a single task
is assigned to multiple workers; the “true” classification value is then defined as the majority vote
(the mode). The required redundancy, however, increases costs while reducing the benefits of using
crowdsourcing. Since the highest threat to reliability of paid crowdsourcing results come from a small
but highly active group of workers trying to game the system [29], there is an incentive to identify
the poorly performing workers and exclude their results from further consideration.
Multiple methods have been suggested to reduce the impact of this group on study results;
for an overview of quality control methods in crowdsourced solutions, see [31]. Rouse et al. [32]
demonstrated that an improvement in accuracy can be obtained simply by asking the workers if they
were attentive in completing the task, and giving them an option to remove their data from consideration.
A commonly used solution is to employ a worker reputation system with assigning tasks to workers
with approval ratings above a certain pre-set level [33]. Another set of methods of identification and
expulsion of the unethical workers is based on a set of indices measuring (1) agreement with the expert
“golden standard” data; (2) agreement with the other workers; (3) agreement with the attention check
questions and (4) an amount of effort estimated from the task completion time [34]. The “golden
standard” is a subset of data that is processed by experts in the field; an important condition is that a lay
person should be able to process this data easily and unambitiously. The agreement-based indices target
identification of outlier workers or weigh the contributions by worker’s deviation from the mean [35].
The attention check and language comprehension questions are verifiable questions [29] that do not
require factual knowledge [36]; the results obtained from the workers failing to answer the attention
questions correctly should be discarded. Finally, the average time to complete a single task is used to
identify low-quality workers presumably spending a lesser amount of time per task [34].
3. Data and Methodology
Twitter data was originally collected for a project on online discussions of climate change, and
early results were covered in [2]. Software was developed to systematically poll the Twitter socialSustainability 2017, 9, 2019 5 of 15
networking site for the terms “climate change” and “global warming”, which resulted in over 2 million
tweets collected; after filtering as described in [7], this dataset was reduced to 1.3 million georeferenced
tweets. Out of this database, 600 tweets in English published within the 2012–2014 period were
randomly selected for further processing.
The research design was similar to [13]. The same data were offered for processing to the volunteer
workers through the Climate Tweet project based on the Citizen Scientist platform hosted at
the University of North Dakota [37] and to the paid workers through the Amazon MTurk platform.
To follow the best crowdsourcing practices, we used only the best paid workers, defined as those with
at least 95% Human Intelligence Task (HIT) approval rating—see [33] for a detailed explanation. Note
that the HIT approval rating is a worker’s work quality measure, calculated as a fraction of his/her
completed tasks that were approved by requesters.
As a motivation, the volunteer workers were provided with an explanation of the scientific
importance of the project; additionally, the screen names of the best workers were published on
the project’s login page. The paid workers were provided with monetary compensation of $0.40 for
classification of a single bundle (HIT) of 20 tweets. Taking into account the mean processing time
discussed in the next section, the mean hourly earnings of a paid worker was $2.03, which is slightly
above the average Amazon MTurk earning of just below $2/h: cf. mean earnings of $1.58/h for
an Indian, vs. $2.30/h for a U.S. worker [14].
The quality comparisons of data produced by volunteer and paid workers were conducted along
the two dimensions: expressed attitudes to the phenomenon of climate change in a processed tweet
as well as topics raised. First, workers were asked to evaluate the attitude towards climate change
expressed in a tweet using a 5-point scale [−2, 2]:
−2: extremely negative attitude, denial, skepticism (“Man made GLOBAL WARMING HOAX EXPOSED”);
−1: denying climate change (“UN admits there has been NO global warming for the last 16 years!”),
or denying that climate change is a problem, or that it is man-made (“Sunning on my porch in
December. Global warming ain’t so bad”);
0: neutral, unknown (“A new article on climate change is published in a newspaper”);
1: accepting that climate change exists, and/or is man-made, and/or can be a problem (“How’s
planet Earth doing? Take a look at the signs of climate change here”);
2: extremely supportive of the idea of climate change (“Global warming? It’s like earth having
a Sauna!”).
Second, the workers were asked to classify the same tweet into up to three of the following
10 topics, unified into broader themes:
• Global warming phenomenon: (1) drivers of climate change, (2) science of climate change, and
(3) denial and skepticism;
• Climate change impacts: (4) extreme events, (5) unusual weather, (6) environmental changes, and
(7) society and economics;
• Adaptation and mitigation: (8) politics and (9) ethical concerns, and
• (10) Unknown.
For exact questions, refer to Appendix A.
While the task formulation offered to the workers was the same on both platforms, with very
similar visual survey layout, the work flow was different due to specifics of the paid and unpaid
work organization and differences in the platforms. The paid workers were offered classification tasks
in 20-tweet packets; for redundancy, each task was offered multiple times to different workers, so
that each tweet was processed by multiple MTurk workers (min = 20, mean = 26, max = 48). Tweets
were offered to volunteer workers individually, and each tweet was processed by a fewer number of
workers (min = 6, mean = 14, max = 21). For further analysis, we selected only those tweets that wereSustainability 2017, 9, 2019 6 of 15
processed by at least nine workers on both platforms, which reduced the number of tweets from 600 to
579. The final classification was produced by the “majority consensus” method, i.e., for each tweet,
its “true” classification was decided based on which topical category, or attitude, received the largest
number of “votes” from the workers [31].
For groundtruthing purposes, the “Gold Standard” tweets were selected based on [34]. For this,
579 tweets were screened by the first author, who was a climate scientist, and tweets that most easily
and transparently could be classified into one of the classification categories were selected (103 in total).
e.g., the tweet “What happened to global warming? It’s cold as **** outside” clearly falls into the category
“denial and skepticism” with a negative attitude towards climate change. The selected 103 tweets
classified by the experts will be further referred to as the “Expert processed” (E) dataset. The same
tweets processed by the paid and volunteer workers will be referred to as P and V datasets, respectively.
The study, therefore, followed the best practices of research employing MTurk workers [38]:
(1) utilizing workers’ qualifications in task assignment; (2) creating a “Gold standard” expert-processed
dataset; (3) using redundancy, and (4) using a majority consensus to adjudicate results. The abovementioned
best practices (2)–(4) were also employed with respect to the data produced by volunteers; however the
authors were unable to apply the best practice (1) controlling qualification of the volunteered workers.
4. Results
4.1. Descriptive Statistics
The processing of the whole pool of 579 tweets was done by 127 volunteers and 574 paid workers;
on average, each volunteer processed 65 tweets, while each paid worker processed only 26. For paid
workers, the mean processing time of a 20-tweet task was 11.8 min (35 s/tweet). Few raters spent
a very short time per tweet (min = 5 s/tweet), indicating potential cheating behavior. We do not have
processing time for the volunteer workers due to the software platform limitations.
Classification results differed for volunteer and paid workers with the former tending to classify
tweets into the fewer number of topics. The matched pair two-tail t-test found significant differences
between the number of categories in the V (mean = 1.64) and P (mean = 1.83) datasets (p = 3.3 × 10⁻³⁰ ).
We also found a better interrater agreement between the volunteer workers for all topical classifications:
c.f. 75% percentage agreement for V vs. 81% for P. Note that this percentage agreement is inflated by
the agreement by chance; Fleiss’ generalized kappa adapted by Uebersax [39] for the unequal number
of raters per subject (see also [40]) showed that in fact the interrater agreement was poor. Nevertheless,
it also showed a better agreement for V raters (mean kappa = 0.24) vs. P raters (mean kappa = 0.14).
For attitude classification, the paid workers demonstrated a tendency to use extreme values of
−2 and +2 more frequently than the volunteers; 25.8% of all tweets were rated as extremely positive
or extremely negative, vs. only 11.1% for volunteers. Similarly to topic classification, the interrater
agreement was higher for V as compared to P raters as measured by percentage agreement (86% for
V vs. 78% for P) and generalized kappa (0.22 for V vs. 0.13 for P). While manually examining the P
and V datasets, we observed lower quality of paid worker’s classification of more difficult content.
For example, the tweet “GW is fact but Sandy is hardly proof. Poor logic . . . Sandy confirms the obvious
impact of global warming ....” was (correctly) classified as having a positive attitude towards existence of
global warming by 83% of the volunteer workers vs. 56% of paid workers. Further, only one out of 17
(6%) of the volunteer raters classified the attitude as negative vs. 20% of the paid workers.
4.2. Crowdsourced vs. Expert Classification Quality
Tweet classification was validated by comparison with expert classification (dataset E of
103 tweets). We found consistently better performance from the volunteer workers, as exhibited
by a higher correlation between the V and E datasets (mean r = 0.40), as compared to the P and E
datasets (mean r = 0.29)—see Table 1. The difference was statistically significant (p < 0.05). Similarly,Sustainability 2017, 9, 2019 7 of 15
the mean Sørensen–Dice distance between the topic classification vectors was lower for the V vs. E
datasets (0.47), as compared to the P vs. E datasets (0.36).
Table 1. Pearson’s correlation between the crowdsourced volunteer (V) and paid (P) worker and expert
(E) classification of the tweets. The columns represent classification of the topics 1–10 found in Section 3
and of the attitude (A).
Comparison 1 2 3 4 5 6 7 8 9 10 A
V vs. E 0.17 * 0.41 ‡ 0.57 ‡ 0.40 ‡ 0.34 ‡ 0.57 ‡ 0.46 0.31 ‡ 0.32 ‡ 0.40 ‡ 0.46 ‡
P vs. E 0.13 0.24 ‡ 0.39 ‡ 0.36 ‡ 0.24 † 0.37 ‡ 0.34 ‡ 0.21 † 0.21 † 0.39 ‡ 0.33 ‡
* p < 0.05; † p < 0.01; ‡ p < 0.05.
The majority consensus method to extract the “true” classification from redundant ratings
provided equally high quality results for both paid and volunteer workers, with an accuracy (fraction
of matches with the E dataset) of ~0.8 for topic, and ~0.7 for sentiment classification (Table 2).
The acceptable “realistic” agreement between human coders as measured by an accuracy, coefficient
may vary between 0.70 and 0.79 [41], as evidenced by e.g., an Amazon MTurks data analysis [42].
Overall, we conclude that the lower work quality of an average individual paid worker is mitigated
by quality control based on massive redundancy, so that using volunteer workers has no data quality
benefits over paid workers.
Table 2. Matching expert (E) and majority consensus of volunteer (V) and paid (P) worker classifications
(classification accuracy) for the full dataset and the subsample used for groundtruthing. Note higher
redundancy rate for P workers as compared to V workers (every tweet was independently processed
by 26 and 14 workers on average, respectively). Refer to Figure 1 to compare classification accuracy for
the same redundancy rate.
Comparison Matching Topics Matching Attitudes Opposite Attitudes
V vs. P (full dataset) 0.73 0.65 0.01
V vs. P (groundtruthing dataset) 0.75 0.68 0.05
V vs. E (groundtruthing dataset) 0.80 0.70 0.04
P vs. E (groundtruthing dataset) 0.79 0.67 0.03
To estimate the effect of crowdsourcing redundancy on classification quality, we repeatedly
reduced the redundancy level in V and P datasets by limiting the maximum number of classifications
of a single tweet. The maximum redundancy level for tweets was reduced from 19 for the V dataset and
30 for the P dataset, down to zero. In effect, this emulated the designs in which each tweet was analyzed
by a regressive number of workers. To estimate uncertainty arising from a variability in the workers’
quality, we performed 10 permutations, each time removing a respective number of randomly selected
classifications. The results (Figure 1) showed the quality of majority consensus classification falling
faster for the paid as opposed to volunteer workers: e.g., a 70% match between a crowdsourced and
expert classification was on average achieved by 12 paid workers vs. just four volunteers.Sustainability2017,
Sustainability 2017,9,9,2019
2019 88of
of15
15
Figure
Figure1.
1. A
Afraction
fractionof
ofmatching
matchingclassifications
classificationsof
oftweets’
tweets’topics
topics(A)
(A)and
andattitude
attitude(B)
(B)as
asaafunction
functionofof
crowdsourcing
crowdsourcingredundancy.
redundancy. The
Theexpert
expert(E),
(E),majority
majorityconsensus
consensusvolunteer
volunteer(V),
(V),and
andpaid
paid(P)
(P)worker
worker
datasets
datasetsare
arebeing
beingcompared.
compared.Arial
Arialboundaries
boundariesshow
showthethebest
bestand
andthe
theworst
worstestimates
estimatesand
andsolid
solidlines
lines
show
showthe
themean
meanestimates
estimates(see
(seethe
thetext
textfor
forexplanation).
explanation).
4.3.
4.3.Geographical
GeographicalVariability
Variability
We used each
We used eachworker’s
worker’scomputer
computer internet
internet protocol
protocol (IP) address
(IP) address to determine
to determine the worker’s
the worker’s country
country of residence. For paid and volunteer crowdsourcing alike, the majority of
of residence. For paid and volunteer crowdsourcing alike, the majority of workers and the majority workers and the
majority of completed
of completed tasks originated
tasks originated from thefrom thebut
U.S., U.S.,
thebut the overall
overall geographical
geographical distributions
distributions werewerevery
very dissimilar (Table 3). Almost 95% of all paid workers and over 95% of their
dissimilar (Table 3). Almost 95% of all paid workers and over 95% of their completed tasks came from completed tasks
came from
just two just twothe
countries, countries,
U.S. andthe U.S. with
India, and India,
the nextwith the next
country, thecountry, the U.K., contributing
U.K., contributing to less
to less than 0.5% of
than 0.5% oftasks.
completed completed tasks. As
As opposed opposed
to that, 95%to ofthat, 95% ofworkers
volunteer volunteer
cameworkers came
from 16 from 16and
countries, countries,
95% of
and 95%
tasks wereof completed
tasks were incompleted in eightThe
eight countries. countries.
highest The highestof
percentage percentage
completedoftasks
completed tasksthe
came from came
U.S.
from
(64%),the U.S. (64%),
followed followed
by the by thewith
U.K. (13%), U.K.India
(13%), with India only
representing representing only 1% of
1% of completed completed
tasks tasks
(Figure 2).
(Figure 2).
Table 3. Geographical distribution of volunteer (Nv = 127) and paid (Np = 574) workers and their
Table 3. Geographical
completed distribution
tasks (Nv = 8198 and Np =of14860)
volunteer (Nv = 127) of
as a percentage andthepaid
total.(Np =top
The 574)
10workers
countriesand their
included
completed tasks (N = 8198 and N = 14860) as a percentage of the total. The top 10 countries included
into the table represent 78% of volunteer workers and 97% of their completed tasks. For paid workers,
v p
into the table
the table represent
represents 78%
97% of of volunteer
workers and 97%workers and 97%
of completed tasks.of their completed tasks. For paid
workers, the table represents 97% of workers and 97% of completed tasks.
Volunteer Workers Paid Workers
Country Volunteer Workers Paid Workers
Country Tasks Raters Tasks Raters
Tasks Raters Tasks Raters
U.S.U.S. 64.4
64.4 17.117.1 75.7 75.7 76.476.4
U.K. 13.0 12.4 0.4 0.5
U.K.
Australia 13.0
6.2 10.612.4 0.1 0.4 0.2 0.5
Australia
Canada 6.2
5.6 8.810.6 0.3 0.1 0.3 0.2
Canada
Indonesia 5.6
2.9 7.1 8.8 0.0 0.3 0.2 0.3
Germany
Indonesia 1.2
2.9 4.9 7.1 0.0 0.0 0.2 0.2
Ireland 1.1 5.4 0.0 0.2
Germany 1.2 4.9 0.0 0.2
India 1.0 4.2 20.6 18.2
Ireland
France 1.1
0.8 3.9 5.4 0.0 0.0 0.2 0.2
India
Brazil 1.0
0.7 3.6 4.2 0.0 20.6 0.218.2
France 0.8 3.9 0.0 0.2
Brazil 0.7 3.6 0.0 0.2
In terms of data quality, we found significant geographical differences in the P dataset (Table 4),
e.g., the crowdsourced topic classification matched the expert one in 80% of the U.S. subsample, but
In terms of data quality, we found significant geographical differences in the P dataset (Table 4),
only in 22% of the India subsample. Interestingly, we did not find a similar effect for the V dataset
e.g., the crowdsourced topic classification matched the expert one in 80% of the U.S. subsample, but
(Table 4). Manual examination of data originating from the IPs located in India showed multiple
only in 22% of the India subsample. Interestingly, we did not find a similar effect for the V dataset (Table
misclassifications. For example, a tweet “Global warming is a lie!!! Proof: Step outside!!! Brrrrr!” was
4). Manual examination of data originating from the IPs located in India showed multiple
mapped as a climate change impact on weather, on environment and on society. Similarly, a tweet
misclassifications. For example, a tweet “Global warming is a lie!!! Proof: Step outside!!! Brrrrr!” was
“The End of an Illusion or no global warming . . . ” was misclassified as global warming drivers, science
mapped as a climate change impact on weather, on environment and on society. Similarly, a tweet
“The End of an Illusion or no global warming …” was misclassified as global warming drivers, scienceSustainability 2017, 9, 2019 9 of 15
Sustainability
Sustainability2017,
2017,9,9,2019
2019 9 9ofof1515
and
andimpacts
and impactson
impacts ononweather.
weather.
weather.On On average,
Onaverage,
average, one
oneone tweet
tweet was
was
tweet was classified
classified into
into
classified 2.2
2.2
into categories
categories
2.2 inin
categories inthe
the India
India
the subset
subset
India vs.
subset
vs.
vs.1.78
1.78 categories
categories
1.78 ininthe
in the
categories theU.S.
U.S. subset.
subset.
U.S. subset.
Exclusion
Exclusion
Exclusionof ofof the
the rating
rating
the from
rating from the
the IPs
from IPs
IPsoriginating
originating
the in Indiain
originating inIndia
Indiaprovided
provided an an
animprovement
improvement
provided inin
in classification
improvement
classification
quality
classification quality
and, consequently, and, consequently,
quality and, allows allows
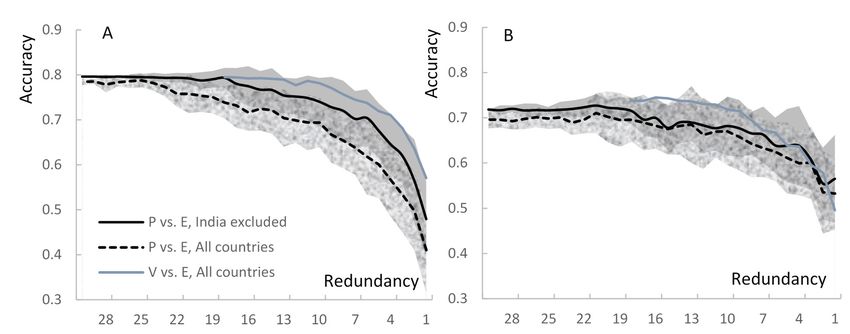
to greatly
consequently, to
reduce
allows greatly reduce
to redundancy
greatly reduce redundancy
level level
(Figure 3). level
redundancy (Figure
For example, 3).
(Figure 3). For
whenFor
example,
the India when
subset the
was India subset
excluded was
from excluded
the data, from
reducingthe data,
the reducing
dataset by
example, when the India subset was excluded from the data, reducing the dataset by 21%, a 70% the
21%,dataset
a 70% by 21%,
match a 70%
between
match
amatch between
betweenaand
crowdsourced acrowdsourced and
andexpert
expert classification,
crowdsourced wasclassification,
expert achieved was
wasachieved
on average
classification, on
onaverage
by six paid
achieved workersby
average vs.six
by 12paid
six paid
paid
workers
workersvs.
workers vs.1212paid
required paidforworkers required
the entire
workers dataset.
required for
forthe
theentire
entiredataset.
dataset.
AA BB
Percentage
Percentage
< 0.5
< 0.5
0.50.5
- 2- 2
2 -25- 5
5 -515
- 15
> 15
> 15
Figure
Figure2.2.2.Percentage
Percentageofofclassified
classifiedtweets
tweetsfor
forthe
thevolunteered
volunteered(A)
(A)and
andpaid
paid(B)
(B)workers.
workers.
Figure Percentage of classified tweets for the volunteered (A) and paid (B) workers.
Figure3.3.3.AA
Figure
Figure fraction
fractionofof
Afraction matchingclassifications
ofmatching
matching classifications
classifications of
ofof tweets’
tweets’
tweets’ topics
topics
topics (A)(A)
(A)and and
and attitude
attitude
attitude (B) (B)
(B)asasaasafunction
afunction
function ofof
of crowdsourcing
crowdsourcing redundancy.
redundancy. TheThe entire
entire expert
expert (E),
(E), majority
majority consensus
consensus volunteer
volunteer
crowdsourcing redundancy. The entire expert (E), majority consensus volunteer (V), and paid (P) (V),
(V), andand paid
paid (P)
(P)
worker
workerdatasets
worker datasets
datasetsare
are being
are beingcompared
being compared to subsets
compared of dataofof
totosubsets
subsets that excludes
data
data that India
thatexcludes (seeIndia
excludes the text
India for the
(see
(see explanation).
thetexttextforfor
explanation).
explanation).
Table 4. Fraction of matching majority consensus volunteer (V) and paid (P) worker classifications with
Table
an
Table 4.4.Fraction
expert Fraction ofofmatching
classification, the two
matching majority
top paid
majority consensus volunteer
crowdsourcing
consensus (V)
(V)and
countries
volunteer paid
(U.S.
and (P)
and
paid worker
India),
(P) worker classifications
and for all other
classifications
countries.
with The India V sample for volunteer classification was too small
with an expert classification, the two top paid crowdsourcing countries (U.S. and India),and
an expert classification, the two top paid crowdsourcing countries (Sustainability 2017, 9, 2019 10 of 15
N = 4 classifications per item. However, we found that for harder-to-process questions related to
science, much higher redundancy (N
10) is required for paid workers.
Despite the fact that only the best quality Amazon MTurk workers were selected (HIT approval
rating ≥ 95%), the performance of the paid workers was still inferior to the performance of volunteers.
Consequently, we found that for a particular task, the same accuracy level can be achieved with
12 paid workers as with only four volunteers. The associated cost increase may be prohibitive for many
scientific projects, which makes volunteer crowdsourcing an attractive alternative. The downside of
volunteer crowdsourcing is that it requires a much longer time to complete the project. In our case,
Amazon MTurk processing was completed in five days, with most of the time taken up with validation
of the already processed data. The Citizen Scientist platform processing took one year; on average,
~600 tweets per month were processed. We also found that an interaction between the scientists and
volunteers was required to keep the public interested in donating their time to the project.
To extract “true” classification from the large redundant pool returned by the crowdsourced
workers, we used the most popular and simple method of majority vote. Multiple algorithms have been
proposed to reduce the “noise” originating from workers’ inaccuracy e.g., [44,45] and others. Application
of data cleaning methods based on assigning dataset-specific quality rating to each of the paid workers
helps to reduce required redundancy. For example, Dawid and Skene [35] suggest that workers should
be weighted based on the deviation of their scores from the mean; the contribution from low quality
workers should then be discarded or used with a lesser weight. Ipeirotis et al. [46] demonstrate that
separation of workers’ error rates into true errors and systematic bias leads to significant improvement
of classification, and suggests that as far as each worker processes a large number of assignments
(at least 20), the redundancy can be kept to at five iterations per task without significant quality
deterioration. In practice, we found that the majority (90%) of the paid workers accepted just one or
two task bundles (20–40 tweets), which made these quality control methods marginally applicable. This
difference in the number of tweets classified by the paid workers and volunteers may also partially
explain the difference in work quality. Indeed, assuming that a higher number of samples processed by
a worker leads to better training and hence better quality on the subsequent tasks, volunteer workers
would outperform paid ones.
The task completion time presumably measures each worker’s thoughtfulness and hence may be
another measure of work quality; indeed, Snow et al. [43] found that the per-hour pay encouraged
the workers to spend twice as much time processing each task, and returned more accurate results
as opposed to the per-task pay. However, we did not find a significant correlation between the task
completion time (min 101 s, median 571 s, mean 708 s, max 6093 s) and accuracy. We also noticed that
the performance of the fastest and the slowest workers tended to be poor.
Another quality management strategy is to utilize a worker reputation system to employ only
the workers with approval ratings above a certain pre-set level [33]; commonly, a 90–95% rating
is used. We, however, speculate that workers’ reputation might not be a very reliable indicator of
their performance. Proliferation of the online rating system means that the workers have become
highly motivated in the protection of their online reputation. In a handful of cases, we had to reject
incomplete tasks; subsequently, we received complaints and threats to blacklist us as bad requesters.
Given the time and effort required to follow up requests from unsatisfied workers and a low cost of
individual tasks, there is a strong incentive to avoid a dispute and comply with workers’ requests,
which thus artificially boosts the approval ratings of workers.
The workers participating in our study were on average earning ~$2/h, which is similar to
average MTurk earnings. It is possible that a higher pay rate would return better quality results;
however, Gillick and Liu [47] hypothesized that lower compensation might attract the workers less
interested in monetary rewards and hence spend more time per task. Having read the online discussion
of the MTurk workers, we also noticed that they associate an unusually high pay rate with possible
fraud and recommend abstaining from taking such HITs.Sustainability 2017, 9, 2019 11 of 15
In our study, similarly to other research [48], the overwhelming majority (95%) of paid workers
came from the U.S. and India. This is not surprising, since the Amazon MTurk workers from other
countries are unable to transfer their earnings to a bank account [49]. We found that discarding results
from workers outside the U.S. significantly improved data quality and hence reduced the required
redundancy of the design; we did not find a similar effect for the volunteer workers. Note that
the geographical distribution of the volunteer and paid workers was very different; the volunteer
workers came predominantly from the countries with an active public discussion of climate change on
Twitter and a high level of Twitter penetration. For example, the daily number of English language
tweets originating from the U.S. is ~30 times higher than those for India, but this number is only
three times higher than those from the U.K. [2]. We therefore speculate that the main reason for the low
quality of India data was insufficient familiarity of the workers with climate change discourse in
general. Consequently, geographical worker selection may be an important factor to consider in order
to improve the quality of results.
6. Conclusions
The purpose of this research was to compare the quality of volunteer and paid workers’
classification of Twitter messages on climate change. We found lower accuracy of data returned
by paid crowdsourced workers as compared with volunteer workers, while the latter required
significantly longer time to complete. Consequently, a similar accuracy of processed data was
achieved with paid workers only with a higher design redundancy; this caused expenses to be high.
While conventional methods of accuracy improvement were largely unsuccessful due to the long-tail
distribution of processed tasks per worker, limiting the workers’ pool to those located in the U.S.
significantly improved paid workers’ data quality, making it only slightly lower than the volunteers’
performance. Therefore, geographical location is an important factor for worker selection. We suggest
the consideration of limiting the workers’ pool to those countries where the research topic is actively
discussed by the public in study designs.
The study has several limitations that might have an impact on its generalizability. While climate
change is a world-wide discussed issue, the framing of its various topical aspects could differ depending
on the country, thus potentially affecting classifications by the raters. At the same time, it is speculated
that topical aspects with little differences in framing could yield lesser geographical differences in
processing quality. Another limitation concerns the usage of the simplest, but also the most common
“majority filter” for error correction; more advanced methods of error correction might return more
precise results. Finally, despite our efforts to make the online interface for paid and volunteer workers
as similar as possible, the differences in technical configuration between crowdsourcing platforms
prevented us from designing a completely identical interface for the two web sites. These limitations
should be addressed in further research.
Acknowledgments: Publication of this article was funded by the University of Florida Open Access Publishing
Fund. The data used in this study were collected by the University of North Dakota Center for Regional Climate
Studies supported by the NSF ND EPSCoR grant.
Author Contributions: A.P.K. and S.S. conceived and designed the study and wrote the paper; A.P.K. analyzed
the data; T.D. and H.K. organized the volunteered and paid crowdsourcing processing, accordingly.
Conflicts of Interest: The authors declare no conflict of interest.
Appendix A. Coding Instructions
Note: Assume that “global warming” and “climate change” (further—CC) are synonyms.
Note: examples are written in Italics
Read a tweet. What is the attitude expressed towards CC? Use the −2 −1 0 1 2 codes:
0: neutral, unknown (A new article on CC is published in a newspaper) (He talked about CC)Sustainability 2017, 9, 2019 12 of 15
1: accepting that CC exists and/or is man-made and/or can be a problem (How’s planet Earth doing?
Take a look at the signs of climate change here)
2: extremely supportive of the idea of CC (Global warming? It’s like earth having a Sauna!!). Think of
code 2 as though it is code 1 plus a strong emotional component and/or a call for action
−1: denying CC (UN admits there has been NO global warming for the last 16 years!) or denying that CC
is a problem or that it is man-made (Sunning on my porch in December. Global warming ain’t so bad.)
−2: extremely negative attitude, denial, skepticism (“Climate change” LOL) (Man made GLOBAL
WARMING HOAX EXPOSED). Think of code −2 as though it is code −1 plus a strong
emotional component.
Classify each tweet using ten categories below. If you think that a tweet belongs to multiple
categories, you may use up to three categories. If you cannot find any suitable category, leave the cells
empty. The categories are in bold.
Categories of GLOBAL WARMING PHENOMENON
1. Drivers of CC. Examples:
• Greenhouse gases (Carbon Dioxide, Methane, Nitrous Oxide, etc.)
• Oil, gas, and coal
2. Science. Examples:
• The scientists found that climate is in fact cooling
• IPCC said that the temperature will be up by 4 degrees C
3. Denial, skepticism, Conspiracy Theory. Examples:
• Scientists are lying to the public
Categories of IMPACTS OF CLIMATE CHANGE
4. Extreme events. Examples:
• Hurricane Sandy, flooding, snowstorm
5. Weather is unusual. Examples:
• Hot or cold weather
• Too wet or too dry
• Heavy Snowfall
6. Environment. Examples:
• Acid rain, smog, pollution
• Deforestation, coral reef bleaching
• Pests, infections, wildfires
7. Society and Economics. Examples:
• Agriculture is threatened
• Sea rising will threaten small island nations
• Poor people are at risk
• Property loss, InsuranceSustainability 2017, 9, 2019 13 of 15
Categories of ADAPTATION AND MITIGATION
8. Politics. Examples:
• Conservatives, liberals, elections
• Carbon tax; It is too expensive to control CC
• Treaties, Kyoto Protocol, WTO, UN, UNEP
9. Ethics, moral, responsibility. Examples:
• We need to fight Global Warming
• We need to give this planet to the next generation
• God gave us the planet to take care of
UNKNOWN category
10. Unknown, jokes, irrelevant, hard to classify. Examples:
• Global warming is cool OMG a paradox
• This guy is so hot its global warming
References
1. Leiserowitz, A.; Maibach, E.W.; Roser-Renouf, C.; Rosenthal, S.; Cutler, M. Climate Change in the American
Mind: May 2017; Yale Program on Climate Change Communication; Yale University and George Mason
University: New Haven, CT, USA, 2017.
2. Kirilenko, A.P.; Stepchenkova, S.O. Public microblogging on climate change: One year of Twitter worldwide.
Glob. Environ. Chang. 2014, 26, 171–182. [CrossRef]
3. Cody, E.M.; Reagan, A.J.; Mitchell, L.; Dodds, P.S.; Danforth, C.M. Climate Change Sentiment on Twitter:
An Unsolicited Public Opinion Poll. PLoS ONE 2015, 10, e0136092. [CrossRef] [PubMed]
4. Yang, W.; Mu, L.; Shen, Y. Effect of climate and seasonality on depressed mood among twitter users.
Appl. Geogr. 2015, 63, 184–191. [CrossRef]
5. Holmberg, K.; Hellsten, I. Gender differences in the climate change communication on Twitter. Int. Res.
2015, 25, 811–828. [CrossRef]
6. Leas, E.C.; Althouse, B.M.; Dredze, M.; Obradovich, N.; Fowler, J.H.; Noar, S.M.; Allem, J.-P.; Ayers, J.W.
Big Data Sensors of Organic Advocacy: The Case of Leonardo DiCaprio and Climate Change. PLoS ONE
2016, 11, e0159885. [CrossRef] [PubMed]
7. Kirilenko, A.P.; Molodtsova, T.; Stepchenkova, S.O. People as sensors: Mass media and local temperature
influence climate change discussion on Twitter. Glob. Environ. Chang. 2015, 30, 92–100. [CrossRef]
8. Sisco, M.; Bosetti, V.; Weber, E. When do extreme weather events generate attention to climate change?
Clim. Chang. 2017, 143, 227–241. [CrossRef]
9. Howe, J. The rise of crowdsourcing. Wired Mag. 2006, 14, 1–4.
10. Clery, D. Galaxy Zoo volunteers share pain and glory of research. Science 2011, 333, 173–175. [CrossRef]
[PubMed]
11. Galaxy Zoo. Available online: https://www.galaxyzoo.org/ (accessed on 25 December 2016).
12. Lintott, C.; Schawinski, K.; Bamford, S.; Slosar, A.; Land, K.; Thomas, D.; Edmondson, E.; Masters, K.;
Nichol, R.C.; Raddick, M.J.; et al. Galaxy Zoo 1: Data release of morphological classifications for nearly
900,000 galaxies. Mon. Not. R. Astron. Soc. 2011, 410, 166–178. [CrossRef]
13. Mao, A.; Kamar, E.; Chen, Y.; Horvitz, E.; Schwamb, M.E.; Lintott, C.J.; Smith, A.M. Volunteering versus
work for pay: Incentives and tradeoffs in crowdsourcing. In Proceedings of the First AAAI Conference on
Human Computation and Crowdsourcing, Palm Springs, CA, USA, 7–9 November 2013.
14. Ross, J.; Irani, L.; Silberman, M.; Zaldivar, A.; Tomlinson, B. Who are the crowdworkers? Shifting
demographics in mechanical Turk. In Proceedings of the CHI’10 Extended Abstracts on Human Factors in
Computing Systems, Atlanta, GA, USA, 10–15 April 2001; ACM: New York, NY, USA, 2010; pp. 2863–2872.Sustainability 2017, 9, 2019 14 of 15
15. Redi, J.; Povoa, I. Crowdsourcing for Rating Image Aesthetic Appeal: Better a Paid or a Volunteer Crowd?
In Proceedings of the 2014 International ACM Workshop on Crowdsourcing for Multimedia, Orlando, FL,
USA, 7 November 2014; ACM: New York, NY, USA, 2014; pp. 25–30.
16. Muller, C.L.; Chapman, L.; Johnston, S.; Kidd, C.; Illingworth, S.; Foody, G.; Overeem, A.; Leigh, R.R.
Crowdsourcing for climate and atmospheric sciences: Current status and future potential. Int. J. Climatol.
2015, 35, 3185–3203. [CrossRef]
17. Olteanu, A.; Castillo, C.; Diakopoulos, N.; Aberer, K. Comparing Events Coverage in Online News and
Social Media: The Case of Climate Change. In Proceedings of the Ninth International AAAI Conference on
Web and Social Media, Oxford, UK, 26–29 May 2015.
18. Samsel, F.; Klaassen, S.; Petersen, M.; Turton, T.L.; Abram, G.; Rogers, D.H.; Ahrens, J. Interactive
Colormapping: Enabling Multiple Data Range and Detailed Views of Ocean Salinity. In Proceedings
of the 2016 CHI Conference Extended Abstracts on Human Factors in Computing Systems (CHI EA’16),
San Jose, CA, USA, 7–12 May 2016; ACM: New York, NY, USA, 2016; pp. 700–709.
19. Yzaguirre, A.; Warren, R.; Smit, M. Detecting Environmental Disasters in Digital News Archives. In Proceedings
of the 2015 IEEE International Conference on Big Data, Santa Clara, CA, USA, 29 October–1 November 2015;
pp. 2027–2035.
20. Ranney, M.A.; Clark, D. Climate Change Conceptual Change: Scientific Information Can Transform Attitudes.
Top. Cogn. Sci. 2016, 8, 49–75. [CrossRef] [PubMed]
21. Attari, S.Z. Perceptions of water use. Proc. Natl. Acad. Sci. USA 2014, 111, 5129–5134. [CrossRef] [PubMed]
22. Vukovic, M. Crowdsourcing for Enterprises. In Proceedings of the 2009 Congress on Services-I, Los Angeles,
CA, USA, 6–10 July 2009; pp. 686–692.
23. Overview of Mechanical Turk—Amazon Mechanical Turk. Available online: http://docs.aws.amazon.com/
AWSMechTurk/latest/RequesterUI/OverviewofMturk.html (accessed on 28 December 2016).
24. Mason, W.; Suri, S. Conducting behavioral research on Amazon’s Mechanical Turk. Behav. Res. Methods
2012, 44, 1–23. [CrossRef] [PubMed]
25. Staffelbach, M.; Sempolinski, P.; Kijewski-Correa, T.; Thain, D.; Wei, D.; Kareem, A.; Madey, G. Lessons
Learned from Crowdsourcing Complex Engineering Tasks. PLoS ONE 2015, 10, e0134978. [CrossRef]
[PubMed]
26. Kawrykow, A.; Roumanis, G.; Kam, A.; Kwak, D.; Leung, C.; Wu, C.; Zarour, E.; Sarmenta, L.; Blanchette, M.;
Waldispühl, J.; et al. Phylo: A citizen science approach for improving multiple sequence alignment. PLoS ONE
2012, 7, e31362. [CrossRef] [PubMed]
27. Poetz, M.K.; Schreier, M. The value of crowdsourcing: can users really compete with professionals in
generating new product ideas? J. Prod. Innov. Manag. 2012, 29, 245–256. [CrossRef]
28. Chandler, J.; Paolacci, G.; Mueller, P. Risks and rewards of crowdsourcing marketplaces. In Handbook of
Human Computation; Springer: New York, NY, USA, 2013; pp. 377–392.
29. Kittur, A.; Chi, E.H.; Suh, B. Crowdsourcing User Studies with Mechanical Turk. In Proceedings of
the SIGCHI Conference on Human Factors in Computing Systems, Florence, Italy, 5–10 April 2008; ACM:
New York, NY, USA, 2008; pp. 453–456.
30. Raddick, M.J.; Bracey, G.; Gay, P.L.; Lintott, C.J.; Cardamone, C.; Murray, P.; Schawinski, K.; Szalay, A.S.;
Vandenberg, J. Galaxy Zoo: Motivations of Citizen Scientists. Available online: http://arxiv.org/ftp/arxiv/
papers/1303/1303.6886.pdf (accessed on 27 October 2017).
31. Allahbakhsh, M.; Benatallah, B.; Ignjatovic, A.; Motahari-Nezhad, H.R.; Bertino, E.; Dustdar, S. Quality
control in crowdsourcing systems. IEEE Int. Comput. 2013, 17, 76–81. [CrossRef]
32. Rouse, S.V. A reliability analysis of Mechanical Turk data. Comp. Hum. Behav. 2015, 43, 304–307. [CrossRef]
33. Peer, E.; Vosgerau, J.; Acquisti, A. Reputation as a sufficient condition for data quality on Amazon Mechanical
Turk. Behav. Res. Methods 2014, 46, 1023–1031. [CrossRef] [PubMed]
34. Eickhoff, C.; de Vries, A.P. Increasing cheat robustness of crowdsourcing tasks. Inf. Retr. 2013, 16, 121–137.
[CrossRef]
35. Dawid, A.P.; Skene, A.M. Maximum likelihood estimation of observer error-rates using the EM algorithm.
Appl. Stat. 1979, 28, 20–28. [CrossRef]
36. Goodman, J.K.; Cryder, C.E.; Cheema, A. Data collection in a flat world: The strengths and weaknesses of
Mechanical Turk samples. J. Behav. Decis. Mak. 2013, 26, 213–224. [CrossRef]
37. Climate Tweets. Available online: http://csgrid.org/csg/climate/ (accessed on 25 December 2016).You can also read