A Pipeline for Rapid Post-Crisis Twitter Data Acquisition, Filtering and Visualization - MDPI
←
→
Page content transcription
If your browser does not render page correctly, please read the page content below
Communication
A Pipeline for Rapid Post-Crisis Twitter Data
Acquisition, Filtering and Visualization
Mayank Kejriwal ∗           and Yao Gu
 Information Sciences Institute, University of Southern California, Los Angeles, CA 90292, USA;
 yaogu@ads.isi.edu
 * Correspondence: kejriwal@isi.edu; Tel.: +1-217-819-6696

 Received: 18 January 2019; Accepted: 30 March 2019; Published: 2 April 2019

 Abstract: Due to instant availability of data on social media platforms like Twitter, and advances
 in machine learning and data management technology, real-time crisis informatics has emerged
 as a prolific research area in the last decade. Although several benchmarks are now available,
 especially on portals like CrisisLex, an important, practical problem that has not been addressed
 thus far is the rapid acquisition, benchmarking and visual exploration of data from free, publicly available
 streams like the Twitter API in the immediate aftermath of a crisis. In this paper, we present such a
 pipeline for facilitating immediate post-crisis data collection, curation and relevance filtering from
 the Twitter API. The pipeline is minimally supervised, alleviating the need for feature engineering
 by including a judicious mix of data preprocessing and fast text embeddings, along with an active
 learning framework. We illustrate the utility of the pipeline by describing a recent case study wherein
 it was used to collect and analyze millions of tweets in the immediate aftermath of the Las Vegas
 shootings in 2017.

 Keywords: data acquisition; social web; twitter; crisis informatics; case study; Las Vegas shootings;
 fastText; active learning; data preprocessing; visualization; embeddings

1. Introduction
      In recent years, crisis informatics has emerged as a field unto its own due to a growing recognition
that technology, especially intelligent systems, can be used to better mobilize resources and provide
valuable, rapid insights to field operators and analysts in the aftermath of a crisis [1]. Crises include not
just natural disasters, but also human-mediated disasters caused by e.g., certain incidents involving
shootings. An important reason that technology can help in such situations is the availability of data in
real-time from social media platforms like Twitter. In recent years, several efforts, such as CrisisLex [2]
and EPIC Analyze [3], have confirmed that useful crisis data is available on Twitter. While these
benchmark collections can be used for detailed posthoc analyses, as well as pre-training machine
learning systems, an open research problem in the crisis informatics literature is the rapid acquisition,
preprocessing and, potentially, analysis and visualization, of a crisis-specific dataset in the aftermath
of a new crisis. One example is the Twitter public API, which is available for free and can be used to
collect data up to a reasonable limit set by Twitter.
      Unfortunately, although the stream can be used to acquire a relatively high-recall dataset by
optimistically specifying keywords and hashtags in the query, a dataset acquired in this way is not
high-precision. Namely, there are many tweets in the acquired dataset that are irrelevant and only
contribute noise to the overall corpus. As a running example, consider the crisis of the Las Vegas
shootings, which occurred (on the night of 1 October 2017) in the vicinity of the Mandalay Bay resort
where the gunman had a room. To achieve sufficient recall, one would have to use keywords like ‘las
vegas’ and ‘mandalay bay’ in the Twitter API, but either keyword can (and does) lead to tweets that

Technologies 2019, 7, 33; doi:10.3390/technologies7020033                   www.mdpi.com/journal/technologies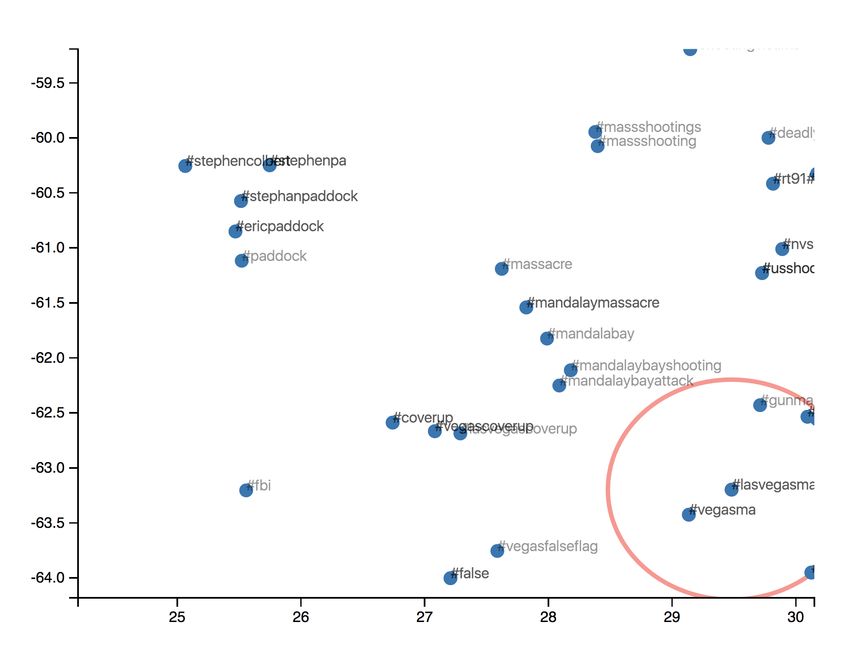
Technologies 2019, 7, 33                                                                             2 of 16

have nothing to do with the shooting. The problem is further compounded when one considers data
acquisition over time. In the immediate aftermath of the Las Vegas shootings, for example, it is much
more likely for a ‘las vegas’ tweet to be relevant to the shooting than several days later. Thus, precision
declines over time, making the acquisition of a high-quality, relevant dataset over a non-trivial time
period even more challenging than usual. If such a dataset can be acquired and analyzed in near
real-time, it would significantly aid practitioners and field operators looking to obtain situational
awareness into the crisis as it is unfolding [4].
      Practical applications of such situational awareness include flagging tweets to first responders
expressing urgent needs for help, as well as presence of dangers (’hotspots’). For the press and policy
analysts, a more medium-term application is understanding and defusing the potential for the spread
of malicious news, such as non-existent conspiracy theories stoking anxiety, mistrust and even panic.
As subsequently shown, conspiracy theories are quick to emerge in the aftermath of incidents such as
the Las Vegas shooting.
      In this article, we present ongoing work on an end-to-end data acquisition pipeline that can be
used to collect a crisis-specific dataset from the Twitter public API using minimal human supervision.
The pipeline includes key steps such as data preprocessing and filtering, but does not require a user
to engineer features or label thousands of tweets before delivering meaningful results. Instead, a
judicious combination of unsupervised text embeddings and active learning is leveraged to acquire
the dataset with minimal human engineering. Labeling effort is restricted to only tens of samples,
in addition to interactively specifying keywords and hashtags to obtain an initial data corpus from
Twitter when the crisis first strikes. The auxiliary outputs of the pipeline, such as the embedded input
vectors, can further be used to visualize and explore the data in a system called HashViz, also proposed
in this paper.
      Figure 1 illustrates an operationalized workflow of these ideas. First, intuitive inputs such as
simple keywords are used to acquire data (‘corpus’) from the Twitter API with high recall. By high
recall, what we mean is that the corpus contains many relevant tweets that can be used for gaining
situational insight into the crisis, but there are likely many irrelevant tweets as well. Next, the corpus
undergoes preprocessing, followed by unsupervised learning, which yields a text embedding for
the corpus. This text embedding model is both important and innovative in the context of this
application, since prior work such as CrisisLex and Project EPIC (see Related Work) have not been
able to successfully leverage embeddings with more classic machine learning techniques for acquiring
relevant data that is both high-precision and high-recall.
      Once the text embedding model has been learned, we use active learning to train a classifier
from a small seed training set that is labeled with relevant and irrelevant tweets. This corpus can
be extremely small, as we show subsequently in the evaluation section. By using active learning,
we ensure that the classifier converges quickly compared to a model that uses randomly selected and
labeled data. Although active learning is a ‘classic’ technique, we show that (when combined with
text embeddings) it can be highly effective in the crisis informatics domain and should be a method of
choice when acquiring training data in the face of an arbitrary disaster.
      Finally, the trained classifier model can be deployed on novel, incoming tweets from the data
acquisition phase to filter out irrelevant tweets and retain only relevant tweets. Our case study shows
that a good classifier model can be trained and deployed using just a few hundred tweets. In contrast,
in real disasters in countries that use social media, thousands (if not millions) of tweets are output
within just the first hour of the disaster striking. Manually labeling a few hundred tweets is also not
time-consuming (in our experiments, it took less than 1–2 h). In effect, using conservative estimates,
the proposed data acquisition and filtering system can be deployed within 3–4 h, allowing analysts
to mobilize rescue efforts and put a stop to negative news artifacts (like conspiracy theories and
fake news) in the immediate aftermath of the disaster. In that sense, the training and use of the
system is real-time and yields good performance, which distinguishes it from systems that require
lots of data or effort before being applicable (and are thus more suitable for studying a disaster
Technologies 2019, 7, 33 3 of 16
posthoc, rather than mobilizing effort in real time), or systems that are designed for a particular type of
disaster (like earthquakes) and not easily generalizable to new regions or disaster types. Our proposed
system is also lightweight, easy-to-use and uses open-source components, which makes it particularly
amenable to customization, further development and uptake without investments in infrastructure or
technical expertise.
Key contributions are described as follows. First, ongoing work is presented on a simple and
scalable end-to-end pipeline that ingests data from the Twitter streaming API and uses a combination
of unsupervised neural text embeddings and limited-label active learning to construct a crisis-specific
training set. Second, a validation case study is presented around the Las Vegas shooting massacre
that occurred on the night of 1 October 2017 to illustrate the significance and scale of the approach.
Compared to a baseline control, active learning is found to converge faster in the text embedding
space. Text embeddings are found to yield intuitive results, illustrating the combined robustness of
data collection and preprocessing. Third, a simple, quickly deployable visualization system called
HashViz is presented to enable rapid visualization and exploration of the raw tweet corpus. HashViz
does not require any labels at all, or large infrastructure and setup. All work based on this article
is based on open-source technology that can be distributed to agencies and first-responders free of
charge. Key elements of the pipeline are already being integrated into the THOR project funded under
the DARPA LORELEI program and featured in DARPA’s 60th anniversary.
The structure of the remaining article is as follows. Section 2 covers relevant related work, while
Section 3 describes the key components in Figure 1. Section 4 presents a brief but significant set of
empirical results using a case study, namely the Las Vegas shootings. Section 5 presents the HashViz
system and shows that it can be used to explore raw crisis tweet corpora, and detect emergence of
conspiracy theories. Section 6 presents promising avenues for future work and Section 7 concludes
the paper.
Figure 1. A workflow-level illustration of the data acquisition, filtering and labeling pipeline. The ‘Input
Vectors’ are also used in a system called HashViz to visually explore the data, as subsequently described.Technologies 2019, 7, 33 4 of 16
2. Related Work
Crisis informatics is emerging as an important field for both data scientists and policy analysts.
A good introduction to the field was provided in a recent Science policy forum article [1]. The field
draws on interdisciplinary strands of research, especially with respect to collecting, processing and
analyzing real-world data. We cover some relevant work below.
2.1. Social Media and Crisis Informatics
Social media platforms like Twitter have emerged as important channels (‘social sensors’ [5]) for
situation awareness in socially consequential domains like crisis informatics. While the initial primary
focus was on earthquakes [6,7], the focus has diversified in recent years to disasters as diverse as floods,
fire, and hurricanes [4,8]. We note that Twitter is by far the most monitored social media platform
during crises [9] due to the availability of the published data and its real-time nature. Increasingly
sophisticated approaches have been presented for data collection, including dynamic lexicons [2].
For free use of streaming Twitter data, the public API is the single point of query access. Since data
collection in this paper focuses on a single disaster, we assume that a user has access to some keywords
that she would use to input initial queries to the API. An advantage of our approach is that, because
we aim to improve precision subsequently, the user can afford to be liberal and optimistic in her choice
of query keywords and hashtags.
Another example of extracting situational awareness from Twitter using NLP methods was
presented by Verma et al. [10]. Another important line of work is in analyzing events other than natural
disasters (such as mass convergence and disruption events), but still relevant to crisis informatics.
For example Stabird et al. presented a collaborative filtering system for identifying on-the-ground
‘Twitterers’ during mass disruptions [11]. Similar techniques could be employed to further supplement
the work in this paper.
More generally, projects like CrisisLex and EPIC (Empowering the Public with Information in
Crisis) have emerged as major efforts in the crisis informatics space due to two reasons: first, the
abundance and fine granularity of social media data implies that mining such data during crises can
lead to robust, real-time responses; second, the recognition that any technology that is thus developed
must also address the inherent challenges (including problems of noise, scale and irrelevance) in
working with such datasets. CrisisLex provides a repository of crisis-related social media data and
tools, including collections of crisis data and lexicons of crisis terms [2]. It also includes tools to
help users create their own collections and lexicons. In contrast, Project EPIC, launched in 2009 and
supported by a US National Science Foundation grant, is a multi-disciplinary effort involving several
universities and languages with the goal of utilizing behavioral and technical knowledge of computer
mediated communication for better crisis study and emergency response. Since its founding, Project
EPIC has led to several advances in the crisis informatics space; see for example [12–16]. The work
presented in this article is intended to be compatible with these efforts.
2.2. Data Preprocessing
Social media content and text is generally heterogeneous, with unusual spellings and language
models. Systems that have been found to work well for Twitter have employed a variety of
preprocessing steps [17–19]. The system in this paper also employs some preprocessing steps.
2.3. Data Filtering and Curation
An important initial step when dealing with heterogeneous information sources is to separate
relevant (i.e., crisis-related) and irrelevant documents [20]. This allows the filtering of documents that
may have used a crisis-related term or hashtag, but does not contain information that is relevant to
a particular crisis event. Important filtering methods have been covered by a range of papers, such
as [21–23]. Importantly, the filtering in this paper assumes little domain knowledge and minimalTechnologies 2019, 7, 33 5 of 16
labeling effort from the user. A user is also not required to program a machine learning system or
devise inventive features. This enables benchmarks to be quickly collected in a matter of hours rather
than days or weeks, and could potentially be leveraged by efforts like CrisisLex to significantly expand
their current benchmark collection.
2.4. Data Analysis
Although the primary focus of this paper is on data acquisition, preprocessing and relevance
filtering, the ultimate goal of acquiring such a dataset is to conduct analysis. Many such analyses
require the underlying dataset to be composed of relevant documents, though some methods are
more robust to noise than others. Analysis tasks include (1) event detection (both extraction and
co-reference) [24–26], for which a variety of machine learning techniques have been proposed [27–29],
and that was surveyed in [30]; (2) data classification, which concerns identifying the type of
information expressed in a document (e.g., donations and volunteering, infrastructure and utilities, affected
individuals) [20], since such knowledge can be used by responders to provide actionable information
that is generally missing from general event categories. Deep learning methods have recently shown
a lot of promise in automatically identifying such information [21,22]; (3) named entity recognition,
especially for entity-centric querying (e.g., to answer questions such as what are the sentiments associated
with the UN in Ghana?) to acquire finer-grained situational awareness [31–33]; (4) visualization, which
is an important part of any human-centric system that is attempting to make sense of a large amount
of information. Several good crisis informatics platforms that provide visualizations include [34–41].
We present preliminary results on visualization, which is the most important component of a
forward-facing crisis informatics system that necessarily involves humans in the loop. The visualization
is generated in an unsupervised fashion, has a simple, interactive component that summarizes the
corpus using hashtags as visual units, and is freshly rendered for every new disaster. In other words, it
does not require pre-customization or extensive set-up.
2.5. Embeddings and Representation Learning
Research into embedding words, and more broadly, documents, sentences and paragraphs into
dense, real-valued and low-dimensional vector spaces precedes the current renaissance of neural
networks [42], but has become more popular due to the advent of neural models like skip-gram.
Recent work has used such embeddings in numerous NLP and graph-theoretic applications [43],
including information extraction [44], named entity recognition [45] and entity linking [46]. The most
well-known example is word2vec (for words) [47], followed by similar models like paragraph2vec (for
multi-word text) and fasttext [48,49], the last two being most relevant for the work in this paper. For a
recent evaluation study on representation learning for text, including potential problems, we refer the
reader to [50].
2.6. Minimally Supervised Machine Learning
Machine learning where there are few, and in the case of zero-shot learning [51,52], no observed
instances for a label has been a popular research agenda for many years [53,54]. In addition to
weak supervision approaches [54], of which Snorkel is an example [55], both semi-supervised and
active learning have also been studied in great depth, with surveys provided by [56,57]. However,
to the best of our knowledge, a successful systems-level conjunction of active learning, visualization
and representation learning has not been illustrated in the crisis informatics domain. An important
experimental contribution of this work is to explore how such a conjunction can be successfully
achieved in practice.
3. Approach
The overall approach is illustrated in Figure 1 and is quite simple. We assume that the crisis
has just struck, and the user has obtained some clues from an external source (e.g., a local breakingTechnologies 2019, 7, 33 6 of 16
news, or privileged first responder information). As a first step, the user has to specify some inputs
so that the Twitter API can start retrieving and storing a corpus in real-time from the stream. Details
on this search service may be found on the social media’s developer website; details on the API are
also available. there We serialize the real-time streaming inputs by storing the tweets in the raw JSON
format in which they stream, on disk, while isolating the text component and storing it in an external
text file for labeling and text embedding. The former setting (storing the raw tweets) is optional in
low-resource settings, where limited computational power or storage is available.
Next, we preprocess each tweet by converting all characters in the tweet to lowercase, and
stripping out URLs, user mentions and hashtags. The preprocessing can also be done on a per-tweet
basis in real-time. A real-world example of tweet preprocessing is expressed in Figure 2.
Figure 2. An illustration of pre-processing for a real-world tweet.
Currently, the next few steps take place in batch mode, but online options for many of these
algorithms are available in the literature and are in the process of being integrated into the pipeline.
We assume that a preprocessed corpus, serialized as text files, is available on disk. We execute the
unsupervised fastText word embedding package on this corpus to obtain a semantic embedding
model for the corpus vocabulary [49]. The fastText embedding has some notable advantages which
make it suited for Twitter data. First, as the name suggests, the model is very fast, and is well-suited
for millions of tweets and documents. Second, the model offers convenient modeling and querying
command line APIs. Finally, and most importantly, the model is robust, and can be used to deduce
vectors for words that were not seen during training. Since Twitter language has high variance and
can be quite irregular, we believe that this facility is paramount to inferring good text embeddings.
Thus far, all steps were completely unsupervised. In order to acquire the benchmark and
jumpstart the active learning process, we assume a set of a high-precision heuristics (e.g., a hashtag
like ‘lasvegasmassacre’) to sample and manually label a small set (say, 50) of tweets as positive, and
another small set of tweets as negative, with positive indicating that the tweet is related in some way
to the specific crisis. Using this small ‘initial pool’, we train a machine learning classifier using the text
embeddings as features, and bypassing the feature engineering process.
We now adopt the following active learning framework, assuming that the total user labeling
budget is X i.e., the user wants to label X more data points. To ensure the pipeline is minimally
supervised, we do not experiment with X higher than a few hundred tweets, although convergence
starts happening at only a few tens. Also assumed is a single hyperparameter p, which is the number
of samples that the user will label in each active learning iteration, leading to X/p iterations. In the
first iteration, we apply the classifier to the unlabeled pool of data, and select the data that the classifier
determines as most uncertain (Figure 3). The empirical advantages of using active learning in this
way for benchmark construction, as opposed to a baseline control that randomly samples from the
unlabeled pool in each iteration, will be illustrated in Section 4; other studies have found similar
benefits [58].Technologies 2019, 7, 33 7 of 16
Figure 3. A linear classification plot based on our Las Vegas case study experiments. The blue points
represent tweets relevant to the Las Vegas crisis (positive tweets), while the red points are irrelevant
to the crisis (negative tweets). Note that the active learning method would not have access to this
information and would pick the points closest to the line as the ‘uncertain’ data for the next iteration.
The figure expresses the intuition that there is a higher density of mis-classified points closer to the line
than further away.
4. Experimental Case Study: Las Vegas Shootings
The Las Vegas shooting incident was a major recent tragedy in the city of Las Vegas (we condense
the description provided by the news report detailed by CBS News and accessed at [59]). Some of the
statistics may change over time based on updates received. On the night of 1 October 2017, a gunman
(64-year-old Stephen Paddock of Mesquite, Nevada) fired more than 1100 rounds (from his suite on
the 32nd floor of the nearby Mandalay Bay hotel) on a crowd of over 22,000 concertgoers at the Route
91 Harvest music festival on the Las Vegas Strip in Nevada, leaving 58 people dead and 546 injured.
About an hour after the attack, he was found dead in his room from a self-inflicted gunshot wound.
At the time of writing (more than a year after the incident), the motive is controversial, although it has
been discovered that he possessed an arsenal of weapons.
According to Wikipedia [60], the incident is the deadliest mass shooting committed by an
individual in the United States. The shooting reignited the debate about gun laws in the U.S., with
attention focused on bump fire stocks, which Paddock used to allow his semi-automatic rifles to fire at
a rate similar to that of a fully automatic weapon.
We chose this case study for our analysis because the prototypical pipeline described herein
was developed shortly before this shooting took place, and we deployed it shortly after to test its
capabilities ‘in the wild’. The tragedy is also fairly recent, and ‘unusual’ and unpredictable in contrast
to more weather-related disasters.Technologies 2019, 7, 33 8 of 16
4.1. Initial Corpus
We collected real-time data from the Twitter public API on 3 October 2017 (i.e., on the second
date following the Las Vegas shooting) and terminated data collection on October 9. We used a small
set of manually specified keyword phrases such as ‘las vegas shooting’. We were able to make about
450 requests in every 15 min window, obtaining roughly 1000 tweets per 15 min window. The total
number of tweets collected over the temporal span of October 3–9 is about 1.35 million, a significant
number not amenable to manual perusal.
For future development and experiments supporting a second case study briefly described at the
end, we similarly collected about 237,480 tweets describing hurricanes, including hurricane disasters
that various places in the US (e.g., Houston) were still recovering from in late 2017, as well as hurricanes
that had just struck in other places in the world at that time. Using the facility offered by the Twitter
API, we also randomly sampled 1.014 million tweets from the API in the date range of 7–9 October to
provide a more unbiased negative data sample for both case studies (i.e., not intentionally describing
either the Las Vegas shootings or the hurricanes). The full corpus is thus a union of three ‘datasets’
(Las Vegas + Hurricane + Random) and contains more than 2.6 million tweets (Table 1). The unsupervised
fastText embedding was trained over the entire corpus. An important point to note is that, other than
supporting a potential second case study, the Hurricane dataset also provides a ‘non-trivial’ negative
sample for the LasVegas case study experiment, since it is a disaster dataset but is irrelevant, unlike
Random, which is (mostly) non-disaster to begin with.
Table 1. Datasets collected for case studies.
Name Number of Tweets Description
Las Vegas 1.35 million Collected in the aftermath of the Las Vegas shootings in 2017 between
the temporal span of October 3–9. Primary dataset for the case study
described in this article.
Hurricane 237,480 Hurricane disasters that various places in the US (e.g., Houston) were
still recovering from in late 2017, as well as hurricanes that had just
struck in other places in the world at that time.
Random 1.014 million Collected in the date range of October 7–9 to provide an unbiased
negative data sample for disaster-related case studies. The Twitter
sampling facility was used, but it is not certain if this yields truly
random data. The majority of (but not all) tweets in this corpus can be
assumed to be non-disaster related.
4.2. Evaluation Dataset Details
For evaluation purposes, we acquired a manually labeled ground truth of 600 tweets (200 from
each of the three corpora i.e., Las Vegas, Hurricane and Random) using one of three class labels
(Las Vegas Shooting, Hurricane and Non-Disaster). For the currently described case study, Hurricane and
Non-Disaster were both treated as negatively labeled data. The evaluation set is ‘featurized’ by using
the preprocessing steps described earlier, and querying for the sentence vector. Note that the fastText
API uses an averaging technique to derive such a sentence vector using the trained word embedding
model. We used the unsupervised fastText embedding model trained over the full corpus (of about 2.6
million tweets).
4.3. Experimental Protocol
For the fastText text embedding model, we use default parameters for the preliminary experiment
and set embedding dimensionality to 100. We use the evaluation set to test the effectiveness of the
proposed active learning against the non-active learning baseline. Using Logistic Regression for
supervised classification, we set up both the active learning (AL) and the baseline control as follows.
First, we do stratified sampling of 60% of the evaluation set, with the positive class comprisingTechnologies 2019, 7, 33 9 of 16
Las Vegas shooting-related tweets, and the negative class comprising a union of the other two classes.
We use this 60% for training, and the other 40% for testing. We further split the training set into a
10–50% partition, with the initial 10% (called the initial pool) used for training the base classifier (both
for AL and the baseline) and the other 50% used as the labeling pool. For the AL experiment, in each
iteration, the 5 most uncertain data points (according to the probabilities output by the current AL
classifier) are sampled and merged into the current labeled pool, followed by re-training the classifier.
For the baseline control, the protocol is exactly the same, except we randomly sample the 5 points from
the labeling pool, rather than consider the uncertainty of points when querying.
For evaluating performance, we use precision and recall. Precision is computed as the ratio of
true positives to the sum of true and false positives, while recall is the ratio of true positives to the sum
of true positives and false negatives. We compute each of these two metrics at every iteration, both to
measure the the performance of the current AL, as well as the baseline classifier (‘control’) on the test
set (the other 40% of the labeled data, which is not used by either classifier at any stage for learning).
Because we followed this protocol, the results of the baseline and the AL classifier will coincide both at
the beginning and at the end. In practice, both the size of the training set, as well as the relative scale
of base training and pooling, can both be tuned during evaluation.
4.4. Active Learning Results
Figure 4 illustrates the results of active learning. In the figure, we use red lines for the active
learning and blue lines for the baseline. The solid lines plot precision vs. iterations and dashed lines
plot recall vs. iterations. The result is significant because the recall converges much faster than the
control group (reaching a stable value just after 10 iterations while the green line is low), without
much decline in precision (compared to control) that continues to be maintained at stable levels as well.
This implies that we can use active learning to rapidly acquire a diverse set of data without necessarily
sacrificing precision or requiring large-scale training set construction.
4.5. Discussion
Being a classic machine learning technique, active learning has long been recognized as a technique
for achieving faster convergence of a classifier without requiring nearly as much data as ordinary
supervised learning. However, what the results in Figure 4 illustrate is that the difference can arise (at
least in the context of the current application) due to recall rather than precision. Both AL and Control
in Figure 4 achieve roughly the same level of precision throughout, without significant improvement
from the initial starting point (about 0.95). In fact, AL precision is even slightly lower than the Control
precision for many iterations. One reason why we might be observing this is because precision is
already high. If precision were lower, we may have observed trends different from the ones in Figure 4.
This is a result that we intend to explore further in future work.
On the recall (and consequently, F-measure) metric, however, the story is very different, since
there is a 10% gap in favor of AL compared to Control. In other words, active learning is helping the
classifier to achieve higher recall faster, without corresponding degradation in precision. At its peak,
the classifier manages to achieve F-measure close to 95%, compared to less than 90% for the original
classifier. Overall, this illustrates the clear and overwhelming benefits of active learning in the current
application and framework.Technologies 2019, 7, 33 10 of 16
Figure 4. Active learning results for the Las Vegas shooting case study. AL stands for Active Learning,
and P and R are meant to indicate the Precision and Recall metrics respectively.
5. HashViz: Interactive Hashtag Visualization and Exploration
In social media like Twitter, hashtags carry a lot of semantic information and can be easily
distinguished from the main text. Exploring and visualizing the space of hashtags in a meaningful way
can offer important insights into a dataset, especially in crisis situations. Ultimately, such insights can
stop a crisis from becoming worse e.g., by disseminating important information before a conspiracy
theory spins out of control on social media.
We have developed a functioning prototype, HashViz, that ingests the vectorized corpus of tweets
collected in the aftermath of a crisis situation (such as the Las Vegas shootings described earlier),
with the vectors obtained using an algorithm like fastText, and embeds words and hashtags into a
vector space. To address the dimensionality problem, HashViz uses t-Distributed Stochastic Neighbor
Embedding [61] for dimensionality reduction (to 2) of hashtag vectors and visualization in 2D space.
Similar hashtags will aggregate (implicitly) into clusters, with relative distance in 2D space providing
a rough estimate of semantic relatedness.
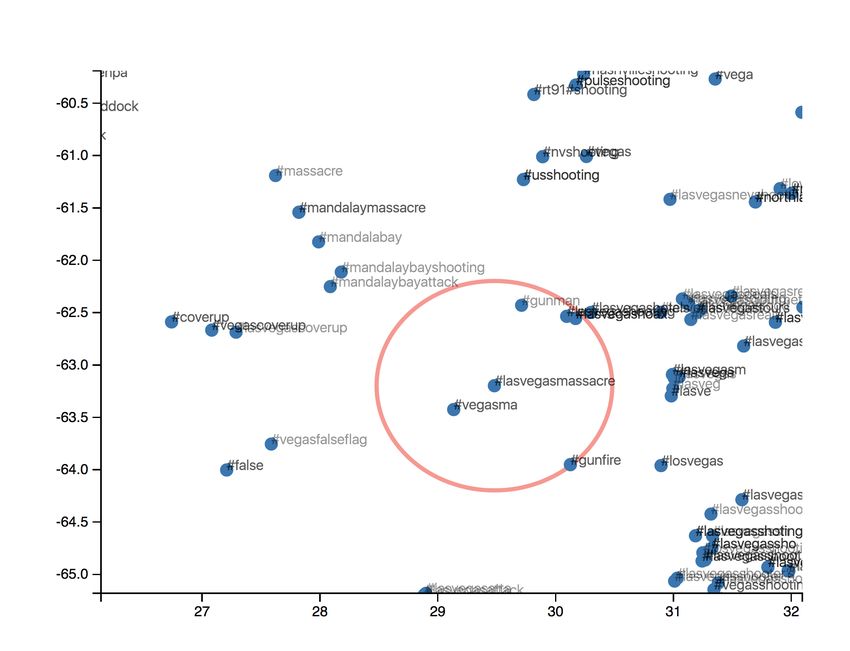
Returning to the case study, an example using ‘lasvegasmassacre’ as the query is shown in
Figure 5. In the scatter plot, the hashtag is encircled in red, and one can intuitively note the similarities
between that hashtag and other hashtags in the corpus. Similar hashtags, in the text embedding space
(which uses the context to determine similarity) tend to be closer together, even when they share little
in common in terms of the raw string. For example, when the user draws a bounding box around
‘lasvegasmassacre’ and zooms in, #lasvegasmassacre and #mandalaybayattack appear relatively close,
even though they share no terms in common. This has been achieved without any manual supervision
or labeling.Technologies 2019, 7, 33 11 of 16
Figure 5. Interactively visualizing hashtags using unsupervised text embeddings and t-SNE
dimensionality reduction. The units and numbers on the axes are without semantics, and are for
visualization purposes only.
In general, the user can also scroll around the ‘hashtag space’ to gain situational awareness and
insight that she might not fully be aware of otherwise. If we go a little bit further, in Figure 6 for
example, we gain an additional piece of information (the name of the shooter i.e., Stephen Paddock).
By ‘accident’ or otherwise, we also start to see the emergence of conspiracy theories through hashtags
such as #coverup, #vegascoverup etc. These hashtags are also clustered close together. Currently,
we are attempting to enrich the HashViz so that the hashtags are clickable, allowing the user to
collect more information about such hashtags by aggregating information (such as posting users and
timelines) from the underlying tweets.
Another important aspect of HashViz is that, by virtue of using the fastText embeddings, results
will be retrieved even when there is no hashtag that exactly matches the user’s query. In such cases,
fastText will revert to a sub-word embedding and attempt to locate embeddings of similar spellings.
The visualization can be restarted simply by entering another query. The system is currently
deployed on a cloud server and is completely unsupervised. Users can interact with the plot using a
combination of zooming, scrolling and querying, allowing them to explore a topic that is of interest
to them.
Although multiple Twitter visualization platforms exist, HashViz is distinguished by being simple,
scalable, interactive and portable enough to be deployed on a server for million-tweet corpora collected
in the aftermath of arbitrary disasters, without special-purpose installation, technical expertise, manual
supervision or costly software or infrastructure investment. Although simple, we use the Las Vegas
dataset to show that HashViz offers an intuitive way to summarize, and gain insight into, a developing
crisis situation. HashViz is also completely unsupervised, requiring no manual inputs to go from a
raw corpus to a visualization and search interface. HashViz is lightweight since it is deployed using
only a web browser on the client side.Technologies 2019, 7, 33 12 of 16
Figure 6. As the user interacts with the plot using simple actions like scrolling and zooming, more
details start emerging in an unsupervised fashion.
6. Future Work
The experimental results in this article raise some interesting questions and potential avenues
for research that we intend to pursue in the near future. First, as illustrated in the context of the case
study experiments, active learning seems to be having a disproportionate effect on one metric (recall)
compared to other metrics (precision). One hypothesis that we floated was that precision was already
high on the sampled evaluation dataset, which means that further improvements cannot be readily
observed. However, there is always the possibility that active learning inherently has a higher impact
on recall in such low-supervision, embedding-based settings than precision. We intend to investigate
this phenomenon further in future work.
The other improvements that can be made to the system are with respect to the embeddings.
Although we used the fastText model in this article, more advanced embeddings have since emerged,
including graph embeddings and hybrid graph-text embeddings. It remains to be seen whether
changing the embedding model will lead to faster convergence of the active learning or otherwise
better performance on various metrics.
Lastly, we intend to improve the HashViz visualization interface so that it can jointly illustrate
both hashtags and users, and allows for richer navigation and interaction facilities. Visualization is a
core component of any situational awareness system since it allows ordinary users to interact with the
data in intuitive and insightful ways. Thus, we are also looking to add more facets and views to the
HashViz interface.
7. Conclusions
This paper presented a pipeline for rapid acquisition and visualization of a crisis-specific dataset in
the immediate aftermath of a crisis. The pipeline uses a small number of interactively labeled samplesTechnologies 2019, 7, 33 13 of 16
in an active learning framework, coupled with unsupervised fastText text embeddings, to obtain a
relevant corpus without extensive labeling or feature engineering effort. Using the unsupervised,
interactive and lightweight HashViz system, hashtags in such a corpus, which contains millions of
unlabeled tweets, can be visualized in 2D to gain situational awareness into the crisis from the social
media comments and posts of the average citizen. The significance of the system and its potential
for assisting in future crises was illustrated using the Las Vegas massacre, arguably one of the most
tragic shootings in recent US history. The prototype is being actively developed and validated via
other carefully designed case, large-scale benchmarking, and user, studies.
Author Contributions: Conceptualization, M.K. and Y.G.; methodology, M.K.; software, Y.G.; validation, M.K.
and Y.G.; formal analysis, Y.G.; investigation, Y.G.; resources, Y.G.; data curation, Y.G.; writing–original draft
preparation, M.K.; writing–review and editing, M.K.; visualization, Y.G.; supervision, M.K.; project administration,
M.K.; funding acquisition, M.K.
Funding: This research was conducted under Next Century and ISI’s THOR effort funded by the DARPA
LORELEI program.
Acknowledgments: The authors gratefully acknowledge the ongoing support and funding of the DARPA
LORELEI program, and the aid of our partner collaborators and users in providing detailed analysis. The
views and conclusions contained herein are those of the authors and should not be interpreted as necessarily
representing the official policies or endorsements, either expressed or implied, of DARPA, AFRL, or the U.S.
Government.
Conflicts of Interest: The authors declare no conflict of interest. The funders had no role in the design of the
study; in the collection, analyses, or interpretation of data; in the writing of the manuscript, or in the decision to
publish the results.
Abbreviations
The following abbreviations are used in this manuscript:
API Application Programming Interface
AL Active Learning
P Precision
R Recall
DARPA Defense Advanced Research Projects Agency
THOR Text-enabled Humanitarian Operations in Real-time
LORELEI Low Resource Languages for Emergent Incidents
References
1. Palen, L.; Anderson, K.M. Crisis informatics—New data for extraordinary times. Science 2016, 353, 224–225.
[CrossRef] [PubMed]
2. Olteanu, A.; Castillo, C.; Diaz, F.; Vieweg, S. CrisisLex: A Lexicon for Collecting and Filtering Microblogged
Communications in Crises. In Proceedings of the Eighth International AAAI Conference on Weblogs and
Social Media (ICWSM), Ann Arbor, MI, USA, 1–4 June 2014.
3. Anderson, K.M.; Aydin, A.A.; Barrenechea, M.; Cardenas, A.; Hakeem, M.; Jambi, S. Design
Challenges/Solutions for Environments Supporting the Analysis of Social Media Data in Crisis Informatics
Research. In Proceedings of the 48th Hawaii International Conference on System Sciences, Kauai, HI, USA,
5–8 January 2015; pp. 163–172. [CrossRef]
4. Vieweg, S.; Hughes, A.L.; Starbird, K.; Palen, L. Microblogging during two natural hazards events: What
twitter may contribute to situational awareness. In Proceedings of the SIGCHI Conference on Human
Factors in Computing Systems, Atlanta, GA, USA, 10–15 April 2010; pp. 1079–1088.
5. Sakaki, T.; Okazaki, M.; Matsuo, Y. Earthquake shakes Twitter users: real-time event detection by social
sensors. In Proceedings of the 19th International Conference on World Wide Web, Raleigh, NC, USA, 26–30
April 2010; pp. 851–860.
6. Avvenuti, M.; Cresci, S.; La Polla, M.N.; Marchetti, A.; Tesconi, M. Earthquake emergency management
by social sensing. In Proceedings of the IEEE International Conference on Pervasive Computing and
Communications Workshops (PERCOM Workshops), Budapest, Hungary, 24–28 March 2014; pp. 587–592.Technologies 2019, 7, 33 14 of 16
7. Crooks, A.; Croitoru, A.; Stefanidis, A.; Radzikowski, J. # Earthquake: Twitter as a distributed sensor system.
Trans. GIS 2013, 17, 124–147.
8. Arthur, R.; Boulton, C.A.; Shotton, H.; Williams, H.T. Social Sensing of Floods in the UK. arXiv 2017,
arXiv:1711.04695.
9. Simon, T.; Goldberg, A.; Adini, B. Socializing in emergencies—A review of the use of social media in
emergency situations. Int. J. Inf. Manag. 2015, 35, 609–619. [CrossRef]
10. Verma, S.; Vieweg, S.; Corvey, W.J.; Palen, L.; Martin, J.H.; Palmer, M.; Schram, A.; Anderson, K.M. Natural
language processing to the rescue? extracting “situational awareness” tweets during mass emergency.
In Proceedings of the Fifth International AAAI Conference on Weblogs and Social Media, Barcelona, Spain,
17–21 July 2011.
11. Starbird, K.; Muzny, G.; Palen, L. Learning from the crowd: collaborative filtering techniques for identifying
on-the-ground Twitterers during mass disruptions. In Proceedings of the 9th International Conference on
Information Systems for Crisis Response and Management (ISCRAM), Vancouver, BC, Canada, 22–25 April
2012; pp. 1–10.
12. Barrenechea, M.; Anderson, K.M.; Aydin, A.A.; Hakeem, M.; Jambi, S. Getting the Query Right: User Interface
Design of Analysis Platforms for Crisis Research. In Engineering the Web in the Big Data Era; Cimiano, P.,
Frasincar, F., Houben, G.J., Schwabe, D., Eds.; Springer International Publishing: Cham, Switzerland, 2015;
pp. 547–564.
13. Palen, L.; Soden, R.; Anderson, T.J.; Barrenechea, M. Success & Scale in a Data-Producing Organization: The
Socio-Technical Evolution of OpenStreetMap in Response to Humanitarian Events. In Proceedings of the
33rd Annual ACM Conference on Human Factors in Computing Systems, Seoul, Korea, 8–23 April 2015;
pp. 4113–4122. [CrossRef]
14. Kogan, M.; Palen, L.; Anderson, K.M. Think Local, Retweet Global: Retweeting by the Geographically-
Vulnerable During Hurricane Sandy. In Proceedings of the 18th ACM Conference on Computer Supported
Cooperative Work and Social Computing, Vancouver, BC, Canada, 14–18 March 2015; pp. 981–993. [CrossRef]
15. Anderson, K.M.; Schram, A.; Alzabarah, A.; Palen, L. Architectural Implications of Social Media Analytics
in Support of Crisis Informatics Research. IEEE Data Eng. Bull. 2013, 36, 13–20.
16. Soden, R.; Budhathoki, N.; Palen, L. Resilience-building and the crisis informatics agenda: Lessons learned
from open cities Kathmandu. In Proceedings of the 11th International Conference on Information Systems
for Crisis Response and Management (ISCRAM), University Park, PA, USA, 18–21 May 2014.
17. Cotelo, J.M.; Cruz, F.L.; Enríquez, F.; Troyano, J. Tweet categorization by combining content and structural
knowledge. Inf. Fusion 2016, 31, 54–64. [CrossRef]
18. Li, Q.; Shah, S.; Liu, X.; Nourbakhsh, A.; Fang, R. TweetSift: Tweet Topic Classification Based on Entity
Knowledge Base and Topic Enhanced Word Embedding. In Proceedings of the 25th ACM International
on Conference on Information and Knowledge Management, Indianapolis, IN, USA, 24–28 October 2016;
pp. 2429–2432.
19. Ghorai, T. An Information Retrieval System for FIRE 2016 Microblog Track. In Proceedings of the Working
Note of FIRE 2016—Forum for Information Retrieval Evaluation, Kolkata, India, 7–10 December 2016; pp.
81–83.
20. Olteanu, A.; Vieweg, S.; Castillo, C. What to expect when the unexpected happens: Social media communications
across crises. In Proceedings of the 18th ACM Conference on Computer Supported Cooperative Work & Social
Computing (CSCW), Vancouver, BC, Canada, 14–18 March 2015.
21. Burel, G.; Saif, H.; Fernandez, M.; Alani, H. On Semantics and Deep Learning for Event Detection in Crisis
Situations. In Proceedings of the Workshop on Semantic Deep Learning (SemDeep), Portoroz, Slovenia,
29 May 2017.
22. Burel, G.; Saif, H.; Alani, H. Semantic Wide and Deep Learning for Detecting Crisis-Information Categories
on Social Media. In International Semantic Web Conference; Springer: Cham, Switzerland, 2017; pp. 138–155.
23. Khare, P.; Fernandez, M.; Alani, H. Statistical Semantic Classification of Crisis Information. In Proceedings
of the 1st Workshop of Hybrid Statistical Semantic Understanding and Emerging Semantics (HSSUES), 16th
International Semantic Web Conference (ISWC), Vienna, Austria, 21–25 October 2017.
24. Aone, C.; Ramos-Santacruz, M. REES: A large-scale relation and event extraction system. In Proceedings
of the sixth conference on Applied natural language processing, Seattle, WA, USA, 29 April–4 May 2000;
pp. 76–83.Technologies 2019, 7, 33 15 of 16
25. Ritter, A.; Etzioni, O.; Clark, S. Open domain event extraction from twitter. In Proceedings of the 18th ACM
SIGKDD International Conference on Knowledge Discovery and Data Mining, Beijing, China, 12–16 August
2012; pp. 1104–1112.
26. Ji, H.; Grishman, R. Refining Event Extraction through Cross-Document Inference. In Proceedings of the
ACL-08: HLT, Columbus, OH, USA, 15–20 June 2008; pp. 254–262.
27. Teng, J.; Li, P.; Zhu, Q.; Ge, W. Joint Event Co-reference Resolution and Temporal Relation Identification.
In Proceedings of the Workshop on Chinese Lexical Semantics, Singapore, 20–22 May 2016; pp. 426–433.
28. Teng, J.; Li, P.; Zhu, Q. Global Inference for Co-reference Resolution between Chinese Events. Acta Sci. Nat.
Univ. Pekin. 2016, 1, 013.
29. Peng, H.; Song, Y.; Roth, D. Event Detection and Co-reference with Minimal Supervision. In Proceedings of
the EMNLP, Austin, TX, USA, 1–5 November 2016; pp. 392–402.
30. Atefeh, F.; Khreich, W. A survey of techniques for event detection in twitter. Comput. Intell. 2015, 31, 132–164.
[CrossRef]
31. Chong, W.H.; Lim, E.P.; Cohen, W. Collective Entity Linking in Tweets Over Space and Time. In Proceedings
of the European Conference on Information Retrieval; Aberdeen, UK, 8–13 April 2017; pp. 82–94.
32. Greenfield, K.; Caceres, R.S.; Coury, M.; Geyer, K.; Gwon, Y.; Matterer, J.; Mensch, A.; Sahin, C.S.; Simek, O. A
Reverse Approach to Named Entity Extraction and Linking in Microposts. In Proceedings of the Workshop
on Making Sense of Microposts at the 25th International World Wide Web Conference, Montreal, QC, Canada,
11 April 2016; pp. 67–69.
33. Pappu, A.; Blanco, R.; Mehdad, Y.; Stent, A.; Thadani, K. Lightweight multilingual entity extraction and
linking. In Proceedings of the Tenth ACM International Conference on Web Search and Data Mining,
Cambridge, UK, 6–10 February 2017; pp. 365–374.
34. Banks, K.; Hersman, E. FrontlineSMS and Ushahidi-a demo. In Proceedings of the International Conference
on Information and Communication Technologies and Development (ICTD), Doha, Qatar, 17–19 April 2009.
35. Jadhav, A.S.; Purohit, H.; Kapanipathi, P.; Anantharam, P.; Ranabahu, A.H.; Nguyen, V.; Mendes, P.N.;
Smith, A.G.; Cooney, M.; Sheth, A.P. Twitris 2.0: Semantically Empowered System for Understanding
Perceptions from Social Data. 2010. Available online: https://corescholar.libraries.wright.edu/cgi/
viewcontent.cgi?referer=https://scholar.google.com.tw/&httpsredir=1&article=1253&context=knoesis
(accessed on 29 March 2019)
36. Abel, F.; Hauff, C.; Houben, G.J.; Stronkman, R.; Tao, K. Twitcident: Fighting fire with information from
social web streams. In Proceedings of the 21st International Conference on World Wide Web, Lyon, France,
16–20 April 2012; pp. 305–308.
37. Imran, M.; Castillo, C.; Lucas, J.; Meier, P.; Vieweg, S. AIDR: Artificial intelligence for disaster response.
In Proceedings of the 23rd International Conference on World Wide Web, Seoul, Korea, 7–11 April 2014;
pp. 159–162.
38. Rogstadius, J.; Vukovic, M.; Teixeira, C.; Kostakos, V.; Karapanos, E.; Laredo, J.A. CrisisTracker: Crowdsourced
social media curation for disaster awareness. IBM J. Res. Dev. 2013, 57, 1–13. [CrossRef]
39. Kumar, S.; Barbier, G.; Abbasi, M.A.; Liu, H. TweetTracker: An Analysis Tool for Humanitarian and Disaster
Relief. In Proceedings of the Fifth International AAAI Conference on Weblogs and Social Media, Barcelona,
Spain, 17–21 July 2011.
40. Choi, S.; Bae, B. The real-time monitoring system of social big data for disaster management. In Computer
Science and its Applications; Springer: Berlin, Germany, 2015; pp. 809–815.
41. Thom, D.; Krüger, R.; Ertl, T.; Bechstedt, U.; Platz, A.; Zisgen, J.; Volland, B. Can twitter really save your life?
A case study of visual social media analytics for situation awareness. In Proceedings of the Visualization
Symposium (PacificVis), Hangzhou, China, 14–17 April 2015; pp. 183–190.
42. Sahlgren, M. An Introduction to Random Indexing. 2005. Available online: http://eprints.sics.se/221/1/
RI_intro.pdf (accessed on 29 March 2019)
43. Collobert, R.; Weston, J.; Bottou, L.; Karlen, M.; Kavukcuoglu, K.; Kuksa, P. Natural language processing
(almost) from scratch. J. Mach. Learn. Res. 2011, 12, 2493–2537.
44. Kejriwal, M.; Szekely, P. Information Extraction in Illicit Web Domains. In Proceedings of the 26th International
Conference on World Wide Web, Perth, Australia, 3–7 April 2017; pp. 997–1006.
45. Nadeau, D.; Sekine, S. A survey of named entity recognition and classification. Lingvist. Investig. 2007,
30, 3–26.Technologies 2019, 7, 33 16 of 16
46. Moro, A.; Raganato, A.; Navigli, R. Entity linking meets word sense disambiguation: A unified approach.
Trans. Assoc. Comput. Linguist. 2014, 2, 231–244. [CrossRef]
47. Mikolov, T.; Sutskever, I.; Chen, K.; Corrado, G.S.; Dean, J. Distributed representations of words and
phrases and their compositionality. In Proceedings of the Advances in Neural Information Processing
Systems 26: 27th Annual Conference on Neural Information Processing Systems 2013, Lake Tahoe, NV, USA,
5–10 December 2013; pp. 3111–3119.
48. Dai, A.M.; Olah, C.; Le, Q.V. Document embedding with paragraph vectors. arXiv 2015, arXiv:1507.07998.
49. Joulin, A.; Grave, E.; Bojanowski, P.; Mikolov, T. Bag of tricks for efficient text classification. arXiv 2016,
arXiv:1607.01759.
50. Faruqui, M.; Tsvetkov, Y.; Rastogi, P.; Dyer, C. Problems with evaluation of word embeddings using word
similarity tasks. arXiv 2016, arXiv:1605.02276.
51. Palatucci, M.; Pomerleau, D.; Hinton, G.E.; Mitchell, T.M. Zero-shot learning with semantic output codes.
In Proceedings of the Advances in Neural Information Processing Systems 22: 23rd Annual Conference on
Neural Information Processing Systems, Vancouver, BC, Canada, 7–10 December 2009; pp. 1410–1418.
52. Romera-Paredes, B.; Torr, P. An embarrassingly simple approach to zero-shot learning. In Proceedings of
the International Conference on Machine Learning, Lille, France, 6–11 July 2015; pp. 2152–2161.
53. Uszkoreit, H.; Xu, F.; Li, H. Analysis and Improvement of Minimally Supervised Machine Learning for
Relation Extraction. In Natural Language Processing and Information Systems; Springer: Berlin, Germany, 2009;
pp. 8–23.
54. Aggarwal, C.C.; Zhai, C. Mining Text Data; Springer Science & Business Media: Berlin, Germany, 2012.
55. Ratner, A.J.; De Sa, C.M.; Wu, S.; Selsam, D.; Ré, C. Data programming: Creating large training sets, quickly.
In Proceedings of the Advances in Neural Information Processing Systems 29: 30th Annual Conference on
Neural Information Processing Systems, Barcelona, Spain, 5–10 December 2016; pp. 3567–3575.
56. Zhu, X. Semi-Supervised Learning Literature Survey. 2005. Available online: https://minds.wisconsin.edu/
handle/1793/60444 (accessed on 29 March 2019)
57. Settles, B. Active Learning Literature Survey; University of Wisconsin: Madison, WI, USA, 2010; Volume 52,
p. 11.
58. Wang, M.; Hua, X.S. Active learning in multimedia annotation and retrieval: A survey. ACM Trans. Intell.
Syst. Technol. (TIST) 2011, 2, 10. [CrossRef]
59. Becket, S. More Details Revealed about Las Vegas Shooter’s Arsenal of Weapons. 2017. Available online: https:
//www.cbsnews.com/news/more-details-revealed-about-las-vegas-shooters-arsenal-of-weapons/ (accessed
on 29 March 2019)
60. Wikipedia 2017 Las Vegas Shootings. Available online: https://en.wikipedia.org/wiki/2017_Las_Vegas_
shooting (accessed on 29 March 2019)
61. Maaten, L.v.d.; Hinton, G. Visualizing data using t-SNE. J. Mach. Learn. Res. 2008, 9, 2579–2605.
c 2019 by the authors. Licensee MDPI, Basel, Switzerland. This article is an open access
article distributed under the terms and conditions of the Creative Commons Attribution
(CC BY) license (http://creativecommons.org/licenses/by/4.0/).You can also read