A Twitter Data Credibility Framework-Hurricane Harvey as a Use Case - MDPI
←
→
Page content transcription
If your browser does not render page correctly, please read the page content below
International Journal of
           Geo-Information

Article
A Twitter Data Credibility Framework—Hurricane
Harvey as a Use Case
Jingchao Yang 1 , Manzhu Yu 1 , Han Qin 1,2 , Mingyue Lu 1,3 and Chaowei Yang 1, *
 1    NSF Spatiotemporal Innovation Center and Department of Geography and GeoInformation Science,
      George Mason University, 4400 University Drive, Fairfax, VA 22030, USA; jyang43@gmu.edu (J.Y.);
      myu7@gmu.edu (M.Y.); hqin@gmu.edu (H.Q.); mlu@gmu.edu (M.L.)
 2    Ankura Consulting Group, LLC, 1220 19th St NW #700, Washington, DC 20036, USA
 3    Nanjing University of Information Engineering, Pukou, Nanjing 210044, China
 *    Correspondence: cyang3@gmu.edu; Tel.: +1-703-993-4742

 Received: 10 January 2019; Accepted: 21 February 2019; Published: 28 February 2019

 Abstract: Social media data have been used to improve geographic situation awareness in the past
 decade. Although they have free and openly availability advantages, only a small proportion is related
 to situation awareness, and reliability or trustworthiness is a challenge. A credibility framework is
 proposed for Twitter data in the context of disaster situation awareness. The framework is derived
 from crowdsourcing, which states that errors propagated in volunteered information decrease as the
 number of contributors increases. In the proposed framework, credibility is hierarchically assessed
 on two tweet levels. The framework was tested using Hurricane Harvey Twitter data, in which
 situation awareness related tweets were extracted using a set of predefined keywords including
 power, shelter, damage, casualty, and flood. For each tweet, text messages and associated URLs were
 integrated to enhance the information completeness. Events were identified by aggregating tweets
 based on their topics and spatiotemporal characteristics. Credibility for events was calculated and
 analyzed against the spatial, temporal, and social impacting scales. This framework has the potential
 to calculate the evolving credibility in real time, providing users insight on the most important and
 trustworthy events.

 Keywords: social media; twitter; credibility; crowdsourcing; hurricane; location extraction; gazetteer;
 spatiotemporal patterns; natural hazard

1. Introduction
     During the 2017–2018 catastrophic Atlantic hurricane seasons, a series of hurricanes (e.g., Harvey,
Irma, Florence) caused hundreds of billions of asset loss and tens to thousands of lives [1]. When a
natural disaster occurs, emergency management and civil defense agencies need to determine the
impact and circumstance of the events. The determination process is called “situational awareness”.
Among the massive amount of information from multiple sources, only a small proportion is directly
related to situation awareness. Therefore, decision-makers need to determine the essential data (i.e.,
more relevant than others) and ensure the collection of timely and reliable information.
     Social media have contributed significantly to situation awareness during the past decade [2–4]
with their publicly available, real-time streaming, timely reporting, and local-specific information.
With the development of information technology, an increasing trend of social media platforms is that
users attach more multimedia information rather than using text exclusively. Users link external URLs,
upload images and videos, and contribute to multiple social media platforms through a third-party
platform. This trend leads to more incomplete sentences but more data conveying the same message.

ISPRS Int. J. Geo-Inf. 2019, 8, 111; doi:10.3390/ijgi8030111                      www.mdpi.com/journal/ijgi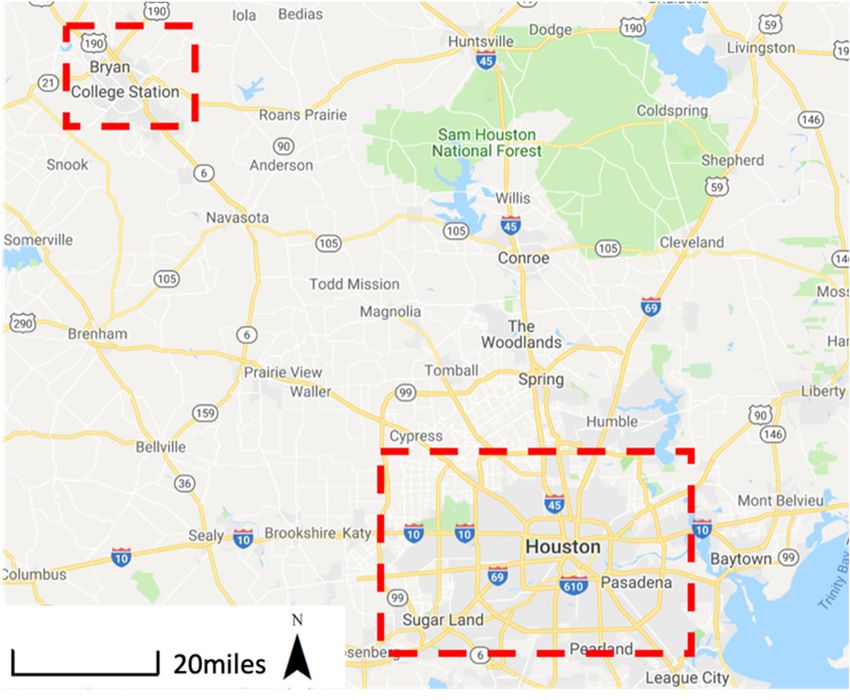
ISPRS Int. J. Geo-Inf. 2019, 8, 111                                                                 2 of 21

      Along with the benefits, however, twitter data contain a significant amount of noise. For example,
most tweets are not relevant to disaster management, generated by a robot or advertisement account,
or posted with questionable provenance (i.e., fake news). For making good use of Twitter data, a
primary procedure is to preprocess the data and extract actionable information (e.g., resource, casualty,
damage, aid) [5]. Since geo-tagged tweets compose only a small proportion of the massive streaming
data, extracting place names from the Twitter text and the related external URLs, images, and videos
is essential to capture a better understanding of the disaster situation with geographic information.
Based on the geographic information obtained, crisis maps can be produced for better situation
awareness [6,7].
      Additionally, the quality of publicly contributed data needs to be assessed and verified [8], and
the demand for identifying relevant, accurate, and credible data is high [9]. Quality assessment of
volunteered geographic information generated from social media [10] was proposed by Goodchild and
Li [11], with three categories of approach: Crowdsourcing, social, and geographic. The crowdsourcing
approach increases the number of contributors to improve validation and averaging the errors
contributed by any one individual. The social approach identifies trusted individuals with a positive
history of contribution. The geographical approach uses geographical knowledge to assess quality.
      This paper tried to answer three subsequent questions: (1) How to integrate the quality assessment
of Twitter data under disaster situation awareness with geographic information extracted from both
Twitter text and external URLs to assess the trustworthiness of the associated spatial information,
(2) in addition to the individual tweets, how can we use multiple tweets to identify a social event, and
(3) how to build in both spatial and temporal characteristics into the assessment process for events
happening in a spatiotemporal range?
      The objectives of this research include: (1) Develop a 3-factor (Twitter text, URL, and retweet)
hierarchical credibility framework with a scoring system to extract reliable situation awareness events
from massive Twitter data, and (2) build an event detection mechanism from local gazetteer contraction
and spacetime clustering with reference to prior studies.
      The basic idea of this framework was to increase the credibility of a detected event when multiple
sources (the 3-factor) refer to the same event. The credibility framework is hierarchical for several
reasons. First, the credibility of an event detected from tweets increases with the tweet, the linked URL,
and retweet referring to the same event. A tweet with a higher credibility score indicates that the tweet
self-increases the reliability. Second, the credibility of the mentioned event increases when multiple
tweets refer to the same event. An event with a higher credibility score indicates that there are more
tweets, more linked URLs, and more retweets mentioning this event.
      The remainder of the paper is structured as follows. Section 2 reviews the evolutionary work in
social media quality assessment and information extraction in the context of disaster management
and situation awareness. Section 3 describes the methodology to establish the proposed credibility
framework. Section 4 introduces the Hurricane Harvey Twitter dataset, data preprocessing procedure,
application of the credibility framework to the dataset, and credibility analysis results of the detected
events with high credibility scores. Section 5 validates the detected events with the news reports
covering Hurricane Harvey. Finally, Section 6 offers conclusions and provides limitations of the study
with future research directions.

2. Literature Review

2.1. Information Extraction from Social Media in Disaster Situation
     During a natural disaster, collected social media data are commonly massive, and only a small
portion of the data is related and contributing to situation awareness. Therefore, extracting essential
and related information from social media data is crucial for situation awareness. Previous research
has applied machine learning, and more recently deep learning algorithms, to analyze texts from
social media. For example, utilizing natural language processing (NLP) techniques, non-relevant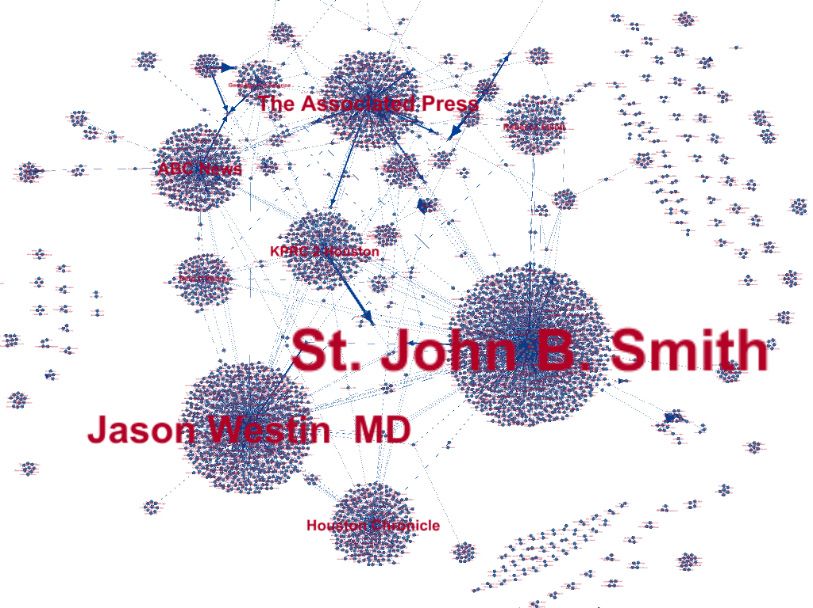
ISPRS Int. J. Geo-Inf. 2019, 8, 111                                                                 3 of 21

information is filtered [12]. To detect events, Benson et al. [13] developed a structured graphical model
to learn from a set of records and align record and message simultaneously. The model induced a
canonical value for each event. The method was applied to Twitter messages related to entertainment
events within New York City, and the detected events were verified with high precision using the city
calendar section of NYC.com. Ritter et al. [14] ranked events based on importance and defined the
importance as closely related to a unique date, rather than evenly distributed over a few days on the
calendar. In comparison, Becker et al. [15] applied an incremental clustering algorithm that generates
cluster events with a predefined threshold. Although these researches provided superior methods
in the field of general event detection from social media, the former one has the biased definition
of importance and the latter one can produce unstable results and might lead to topics that do not
belong to a certain cluster. Events defined within disaster situations are always considered to be events
that do not occur in daily bases and are specifically targeted and therefore should be detected within
the predefined topics based on their frequencies (e.g., casualty, damage, aid, alerts). Research has
discovered and examines the topics from social media data, especially in disaster management. For
example, Imran et al. [16] categorized tweets during natural disasters into caution and advice, casualty
and damage, donation and aid, and information sources. Huang and Xiao [5] examined the tweets
from Hurricane Sandy, categorizing them into more detailed groups referring to different stages of
disaster management, including preparedness, response, and recovery. These predefined categories of
topics serve as a useful foundation for topic classifications, assisting rapid information extraction from
massive social media data.
      Without predefined topics, similar social media messages are clustered into different topics using
topic modeling such as latent Dirichlet allocation [17]. The advantage of topic modeling is it allows
for quickly clustering a massive number of tweets into different groups to assist the understanding
of publicly contributed information. Utilizing Latent Dirichlet allocation (LDA), Chae et al. [18]
detected abnormal topics and their associating time periods from Twitter during tornado and hurricane
events. The detected abnormal topics assisted in understanding the spatiotemporal distribution and
movement pattern of Twitter users before, during, and after a disaster. Resch et al. [19] investigated
topic modeling with cascading LDA to extract subtopics under a higher-level topic. Using tweets
covering the occurrence of the Napa Earthquake in 2014, Resch et al. [19] explored four subtopics,
including ad-hoc reports during the event, post-event reports in the morning after the event, damage
reports, and bucket challenge.
      As multimedia data (e.g., images, videos) are hosted on social media platforms, research has
also included these evolving data for disaster management purposes. For example, Bischke et al. [20]
accessed Twitter texts and images to develop a real-time situation awareness framework to rapidly
locate the most demanding area for disaster response activities. The authors applied a deep learning
model, convolution neural networks, to the text and images to conduct sentiment analysis. When
more negative tweets occur within a particular area, it is labeled a more demanding area. Pouyanfar
and Chen [21] proposed an ensemble deep learning framework to extract information from YouTube
disaster videos in the context of a flood, damage, fire, mud-rock, tornado, and lightning. Videos
are initially preprocessed into shots by boundary detection and key-frame selection, and features
are subsequently extracted through deep learning reference models on each key-frame. Herein,
the goal of the proposed research is to include multiple data sources within tweets, including
text, spatial coordinates, and text-based linked URL (e.g., news reports, personal blogs) to detect
keyword-related events.

2.2. Quality and Trust for Crowdsourcing Data in Emergency Management
     Reuter and Kaufhold [8] reviewed the research of social media in emergency management over
the past fifteen years, focusing on issues of social media regarding trust and quality of social media
data (e.g., “credibility doubts of citizen-generated content, lack of knowledge and personnel issues,
absence of uniform terms of use, marginal accessibility for older generations”). For example, Gupta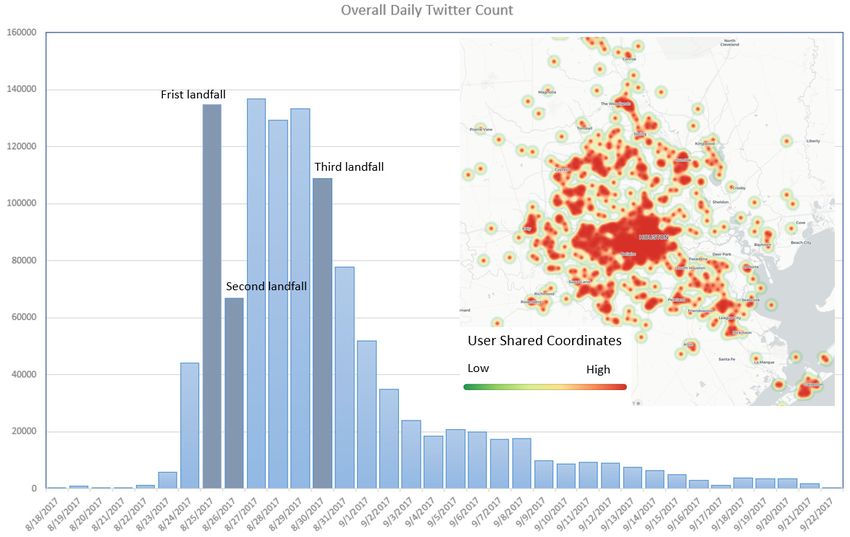
ISPRS Int. J. Geo-Inf. 2019, 8, 111                                                                   4 of 21

and Kumaraguru [22] calculated the credibility of a Twitter event via information propagation. The
authors examined the percentage of credible information and spam on Twitter, concluding that only
17% of the collected tweets contained credible situation awareness information. This highlights the
increasing need to identify trustworthy social media messages.
      Senaratne et al. [23] reviewed the credibility study of text-based crowdsourcing data. They
revisited the definition of credibility by Hovland et al. [24] as the “believability of a source or message,
which comprises primarily two dimensions, the trustworthiness (as explained earlier) and expertise.”
In addition, they reviewed the fundamental study by Mendoza et al. [25], which indicated that Twitter
operates as a self-filtering community as users can question and identify rumors during an emergency.
      Rice et al., Qin et al., and Qin [26–28] developed a comprehensive geospatial quality assessment
method based on a crowdsourcing testbed designed to provide transient obstacle information to people
with disabilities. They expanded the social quality assessment approach proposed by Goodchild and
Li [11] and suggested that crowdsourcing data quality involves the following aspects: Position, time,
attribute accuracy, completeness, malicious and mischievous content, logical consistency, and risk
and fitness for use. However, due to the limitation of the Twitter dataset on data biases, data noise,
and content length, this quality assessment method is not entirely adaptive. In addition, this quality
assessment method requires the users to provide a set of predefined types of information, whereas
Twitter, as an ambient crowdsourcing platform, cannot provide this information.
      Castillo et al. [29] developed a supervised learning approach to automatically classify and
identify credible news events from Twitter during the Chilean earthquake in 2010. First, time-critical
information was automatically extracted, and the tweets manually labeled as news, chat, or unsure.
Second, evaluators were asked to assign a credibility level (i.e., almost certainly true, likely to be false,
almost certainly false, and cannot decide). Third, a set of 68 features were proposed to model the
topics and associated information cascades, including features associated with the user, event, and
propagation base. However, the high number of features made it difficult to prioritize the features and
develop a unified credibility prediction model.
      Sociospatial dimension analytics proposed by Shelton et al. [30] suggests that understanding the
complexity of user-generated content should go beyond utilization of plotting coordinates to explicitly
theorize sociospatial relations through measurements in other dimensions, e.g., territorial, palatial, or
scalar. Herein and based on past research, a credibility framework is proposed that utilizes Twitter’s
self-filtering mechanism to identify the most trustworthy posts and events related to disaster situation
awareness [11]. This framework addresses information completeness by integrating text messages
and the associating URL. In addition, this framework also allows for an exploration of two feature
levels, tweet (i.e., text along with its URL, retweet number) and event (i.e., credibility scores) in order
to propose a more effective credibility framework.

3. Methodology
      A credibility framework was designed using a hierarchical strategy with tweet and event levels.
For each tweet, credibility was calculated based on two features: The consistency of the tweet content
and its URL in mentioning an event; and the retweet number. An event was defined as an incident at a
specific time and location. Extracting location and time metrics from tweeted text messages and URLs
is critical. Location extraction is challenging because only a small proportion of the Twitter dataset
is geo-tagged; this necessitates that the information be extracted from text messages and URLs. In
addition, local detailed gazetteers are generally not available, especially within the impacted area of a
hurricane. Therefore, an essential part of the research was to create local gazetteers from Twitter data
using text and URL content.
      The structure of the credibility framework (Figure 1) starts with text information within tweets
and URLs using predefined keywords as filters to reclassify tweets into different theme groups related
to disaster situation awareness. Events were identified within the extracted locations and posting
times, and location with different expressions was merged after coordinates (geocoding) collocation.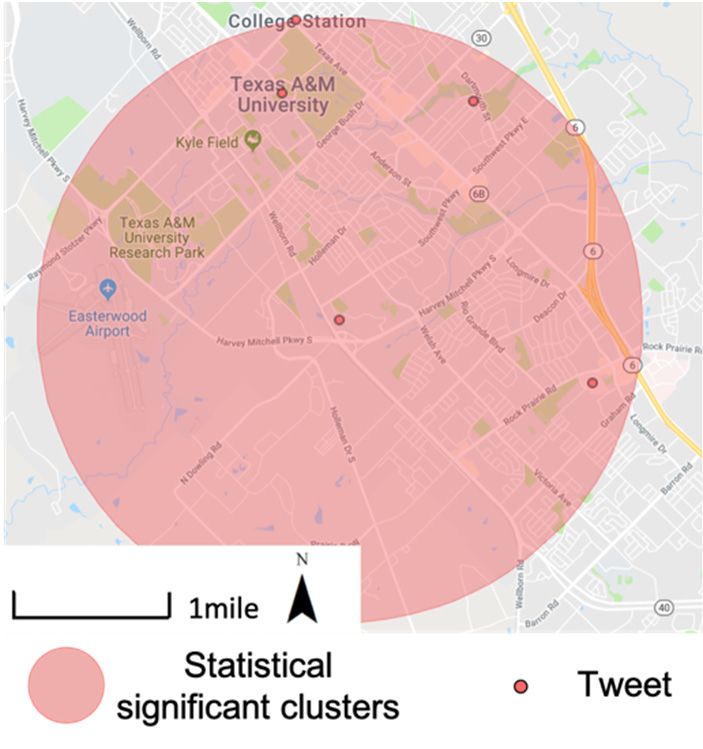
ISPRS Int. J. Geo-Inf. 2019, 8, 111 5 of 21
ISPRS Int. J. Geo-Inf. 2019, 8, x FOR PEER REVIEW 5 of 20
The overall The
collocation. eventoverall
credibility
eventwas based on
credibility thebased
was credibility
on thecalculated forcalculated
credibility each supporting
for eachtweet and its
supporting
retweet. A higher overall credibility score indicates that the event is more trustworthy.
tweet and its retweet. A higher overall credibility score indicates that the event is more trustworthy.
Figure 1.
Figure Theoverall
1. The overallstructure
structure of
of the
the credibility
credibility framework.
framework.
3.1. Twitter
3.1. Twitter Reclassification
Reclassification Using
Using Predefined
Predefined Keywords
Keywords
Twitter datasets
Twitter datasetsgenerally
generally contain a small
contain proportion
a small of disaster
proportion of situation
disaster awareness
situation information.
awareness
information. To extract those related tweets, this research utilized a well-established keyword and
To extract those related tweets, this research utilized a well-established keyword set (Huang set
Xiao [5])and
(Huang which
Xiaofocuses on classifying
[5]) which focuses onTwitter data Twitter
classifying into different topics
data into under topics
different the disaster
undermanagement
the disaster
situation using
management Hurricane
situation Sandy
using as an example.
Hurricane Sandy as A ansubset of the
example. keyword
A subset list keyword
of the (Huang and list Xiao
(Huang[5])
was Xiao
and used [5])
herein
wasbecause the interest
used herein is inthe
because ‘Sheltering’,
interest is‘Casualty’, ‘Damage’,
in ‘Sheltering’, ‘Flood’,‘Damage’,
‘Casualty’, and ‘Power’ cases
‘Flood’,
(Table 1). These events are the critical ones on which people need verification for
and ‘Power’ cases (Table 1). These events are the critical ones on which people need verification for trustworthiness.
Based on the theme-driven
trustworthiness. Based on the keywords,
theme-driventweets were reclassified
keywords, intoreclassified
tweets were different themes, and each
into different tweet
themes,
contained
and one or
each tweet more events
contained one orrelated
moretoevents
their theme.
related to their theme.
Table 1. Theme table with keywords.
Table 1. Theme table with keywords.
Theme Keywords
Theme Keywords
Sheltering hotel, housing, shelter
Sheltering hotel, housing, shelter
Casualty dead, death, death toll, drowned, kill
Casualty dead, death, death toll, drowned, kill
catastrophe, collapse, damage, damaged, damaging, debris, destroy, destroyed, destruct,
Damage catastrophe, collapse,destruction,
destructed, destructing, damage, destroying,
damaged,devastate,
damaging, debris,rip
devastation, destroy,
off, ruin, ruined,
Damage destroyed, destruct,
ruining, wreck, wreckingdestructed, destructing, destruction, destroying,
Flood
devastate, devastation,
flood, flooded, ripover,
flooding, spill off,surge
ruin,overflow,
ruined,under
ruining,
water,wreck, wrecking
underwater, wash away,
washing away, water over the roof, water overflow, water rushing, drown
flood, flooded, flooding, spill over, surge overflow, under water, underwater,
Flood black away,
wash out, blackout,
washingconed, dark, water
away, darker, downed
over theelectrical wires, POWER
roof, water down,
overflow, POWER
water
not expected, POWER off, POWER out, POWER outage, goodbye POWER, knock out
Power/Electricity rushing,
POWER, drown
lose POWER, losing POWER, lost POWER, no POWER, noPOWER, off the grid,
powerless,
black shut off POWER,
out, blackout, coned,taken POWER,
dark, transformer
darker, downed exploding, transformer
electrical explosion,
wires, POWER
w/o POWER, wait POWER return, without POWER, without power
down, POWER not expected, POWER off, POWER out, POWER outage,
goodbye POWER, knock out POWER, lose POWER, losing POWER, lost
Power/Electricity
POWER, no POWER, noPOWER, off the grid, powerless, shut off POWER,
taken POWER, transformer exploding, transformer explosion, w/o POWER,
wait POWER return, without POWER, without power
3.2. Event Identification
     In each tweet, locations are published as geo-tags or indicated in the text message. An event is
identified by extracting locations to construct a local gazetteer and merging tweets with a
spatiotemporal range under the same theme.
ISPRS Int. J. Geo-Inf. 2019, 8, 111                                                                                    6 of 21
3.2.1. Location Extraction and Local Gazetteer Construction
      The location
3.2. Event            extraction focused on road and place names mentioned in the Twitter data, and the
            Identification
local gazetteer was constructed based on the extracted locations. This approach addresses road and
      In each tweet, locations are published as geo-tags or indicated in the text message. An event
place names separately as they have different characteristics. Taking road name extraction as an
is identified by extracting locations to construct a local gazetteer and merging tweets with a
example (Figure 2), the overall procedure searches the tweet content for road names with a list of
spatiotemporal range under the same theme.
commonly used street suffixes (e.g., street, drive) and alternative abbreviations (e.g., st, dr.) according
to theLocation
3.2.1.  United States    Postaland
                  Extraction     Service
                                    Local(USPS).
                                             Gazetteer Once   a suffix is located, the road name is extracted. The
                                                          Construction
same principle is applied for place name extraction, except the list of place name suffixes is based on
      The location
analyzing             extraction
             local area            focused
                         place naming     ruleson(e.g.,
                                                   roaduniversity,
                                                          and place names
                                                                        center).mentioned in the Twitter data, and
the local
      The gazetteer
           convention  wasforconstructed
                              both road and  based   on names
                                                  place  the extracted
                                                                  is that locations.    This consist
                                                                            names usually    approach     addresseswords
                                                                                                     of multiple         road
and  place  names    separately   as they    have   different  characteristics.    Taking  road
beginning with an uppercase letter. Road names are most commonly composed of either one or two  name     extraction     as  an
example    (Figure   2), the  overall  procedure      searches    the  tweet   content   for road
words plus the road name suffix; less commonly, the information includes a number (e.g., Main St., names     with    a list of
commonly
5555 Hermann  usedPark
                    streetDr.).
                           suffixes
                                Less (e.g.,  street, drive)
                                      commonly,              and
                                                      there is     alternative
                                                                simply   a suffixabbreviations
                                                                                    and number(e.g.,
                                                                                                  (e.g.,st,Hwy
                                                                                                            dr.) 6)according
                                                                                                                     or road
to the  United   States  Postal  Service    (USPS).    Once  a  suffix  is  located,  the road name
names alone (e.g., I 66, I66). All of these features are recognized in the procedure using expressions is  extracted.     The
same
codedprinciple    is applied for
        in the algorithms.         place
                                While      name
                                        place      extraction,
                                                 names           exceptabsent
                                                          are usually      the listof
                                                                                    ofnumbers,
                                                                                       place name   suffixes
                                                                                                 words      are isoftentimes
                                                                                                                    based on
analyzing   local  area  place  naming    rules   (e.g., university,   center).
associated with name suffix (e.g., Sam Houston State University, Toyota Center).

      Figure 2.2. Procedure for extracting road names
                                                  names from
                                                          from text.
                                                                text. Possible road name compositions are as as
      follows: 1. Number
                   Number ++ Suffix;
                                Suffix; 2. Number
                                           Number ++ Capital
                                                     Capital Letter
                                                             Letter Words
                                                                     Words ++ Suffix; 3. Capital
                                                                                         Capital Letter
                                                                                                 Letter Words +
      Suffix;
      Suffix; and
              and 4.
                   4. Suffix
                      Suffix ++ Number.
                                Number.

     The  convention
      Location           for both
                extraction    was road
                                   appliedandtoplace  names
                                                 tweets  underis that names
                                                                 different     usually
                                                                            theme       consist
                                                                                    groups      of multiple
                                                                                            separately,    andwords
                                                                                                                since
beginning   with   an uppercase    letter. Road   names   are most   commonly     composed    of  either
tweet texts contain multiple themes, only those associated with the proposed themes were collected.      one  or two
words   plus the  road   name   suffix;  less commonly,    the  information    includes  a number
To optimize the accuracy of the association, location extraction only applied to the paragraph where (e.g., Main  St.,
5555  Hermann
the keyword       Park
               is in theDr.). Less commonly,
                          keyword                  there A
                                     list of the theme.  is local
                                                            simply   a suffixisand
                                                                  gazetteer        number for
                                                                                established (e.g.,  Hwy
                                                                                                 each     6) orgroup
                                                                                                       theme    road
names   alone (e.g.,  I 66,
after location extraction.  I66). All  of these  features are  recognized    in the procedure   using   expressions
coded in the algorithms. While place names are usually absent of numbers, words are oftentimes
associated with name suffix (e.g., Sam Houston State University, Toyota Center).
     Location extraction was applied to tweets under different theme groups separately, and since
tweet texts contain multiple themes, only those associated with the proposed themes were collected.
To optimize the accuracy of the association, location extraction only applied to the paragraph where
the keyword is in the keyword list of the theme. A local gazetteer is established for each theme group
after location extraction.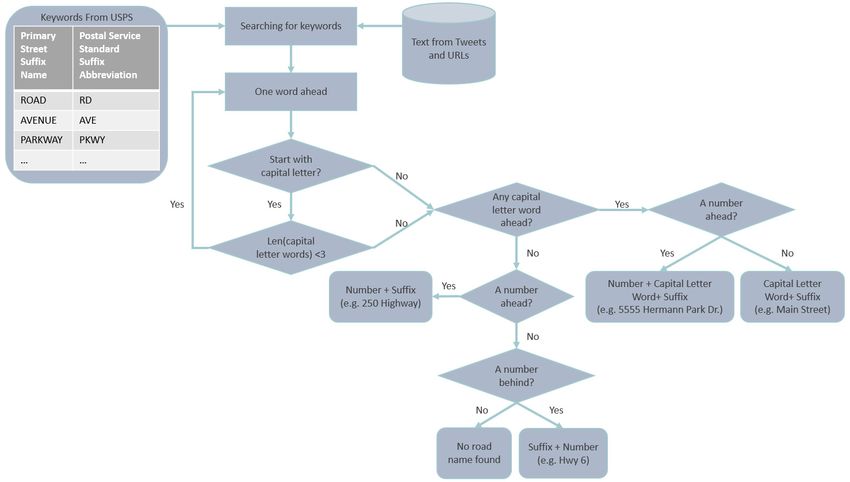
ISPRS Int. J. Geo-Inf. 2019, 8, 111 7 of 21
ISPRS Int. J. Geo-Inf. 2019, 8, x FOR PEER REVIEW 7 of 20
3.2.2. Gazetteer Merging
3.2.2.After the local
Gazetteer gazetteer was constructed from the Twitter data, duplicated information was
Merging
removed or merged so that one address is uniquely referred to its associated place or road name.
After the local gazetteer was constructed from the Twitter data, duplicated information was
Merging extracted locations from the extracted gazetteer is crucial for providing meaningful event
removed or merged so that one address is uniquely referred to its associated place or road name.
list without duplication of repeating the same location for different expressions and also reduces the
Merging extracted locations from the extracted gazetteer is crucial for providing meaningful event
heavy load for geocoding. There are three layers and two steps in the workflow (Figure 3) to merge
list without duplication of repeating the same location for different expressions and also reduces the
extracted locations through a string and coordinate match, where the bottom layer shows locations
heavy load for geocoding. There are three layers and two steps in the workflow (Figure 3) to merge
from the constructed local gazetteer (Section 3.2.1).
extracted locations through a string and coordinate match, where the bottom layer shows locations
Step 1: Before merging direct name/text, a standard location name format is adopted to ensure
from the constructed local gazetteer (Section 3.2.1).
the same format for all names (loc name) from the bottom layer. For instance, “X Road”, “X road”, and
Step 1: Before merging direct name/text, a standard location name format is adopted to ensure
“X Rd” is converted to “x rd” and considered to be the same road. The Loc names are merged with
the same format for all names (loc name) from the bottom layer. For instance, “X Road”, “X road”,
their associated tweet ID (supporting tweet or supporting ID) when they are the same location after
and “X Rd” is converted to “x rd” and considered to be the same road. The Loc names are merged
being formatted.
with their associated tweet ID (supporting tweet or supporting ID) when they are the same location
Step 2: Geocoding enhanced merge in which each location is geocoded using Google Maps
after being formatted.
Geocoding API [31]. When associated with coordinates, place names, addresses, and zip codes,
Step 2: Geocoding enhanced merge in which each location is geocoded using Google Maps
a geographical approach is applied to merge these gazetteers for a second time.
Geocoding API [31]. When associated with coordinates, place names, addresses, and zip codes, a
•geographical
Duplicatedapproach is are
locations applied to merge
identified thesea gazetteers
through coordinatefor a second
check. time. expressions have the
If different
• same coordinates
Duplicated afterare
locations geocoding,
identifiedthese are merged.
through a coordinate check. If different expressions have the
• After
same acoordinates
coordinateafter
check, a road-name
geocoding, thesematch, similar to the first step, is applied based on the
are merged.
• road names acquired after the geocoding process
After a coordinate check, a road-name match, similar as extracted
to theplace
first names
step, isdo not have
applied addresses
based on the
before geocoding.
road names If one
acquired road
after thename has 75%
geocoding or higher
process similarityplace
as extracted scorenames
with another afteraddresses
do not have standard
name
beforeformat and theIfzip
geocoding. onecodes
roadare the same,
name has 75%these orlocations are merged.
higher similarity Thewith
score similarity
anotherscore is
after
calculated based on the Jaro Distance score for a string match (jellyfish python package
standard name format and the zip codes are the same, these locations are merged. The similarity [32]). For
example, because “X
score is calculated Highon
based School” is Distance
the Jaro an 81% match
score to
for“X School”
a string and is
match higher than
(jellyfish python75%, these
package
two are merged if they also share the same zip code.
[32]). For example, because “X High School” is an 81% match to “X School” and is higher than
75%, these two are merged if they also share the same zip code.
Figure3.3.An
Figure Anexample
exampleshowing
showinghow
how extracted
extracted local
local gazetteer
gazetteer is grouped,
is grouped, geocoded,
geocoded, andand merged
merged to
to the
the final detected events.
final detected events.
3.2.3.
3.2.3.Space–Time
Space–TimeEvent
EventIdentification
Identification
Gao
Gaoetetal.
al.[33]
[33] extracted
extracted locations
locations with
with the
the consideration
consideration of of the geometric feature types; however,
however,
all
all polygon features in this research were generalized to points for better detecting the eventlocation
polygon features in this research were generalized to points for better detecting the event location
with
withline
linefeatures
featuresignored
ignored due
dueto to
lessless
contribution
contributionto event reporting.
to event Inspired
reporting. by Abdelhaq
Inspired by Abdelhaq et al. et
[34],
al.
who
[34],calculated
who calculatedspatialspatial
density distribution
density to detect
distribution events,events,
to detect the point
the features collected
point features above above
collected were
aggregated to neighborhoods
were aggregated to neighborhoods usingusing
the distance buffer
the distance within
buffer self-adaption
within thresholds.
self-adaption thresholds.Instead
Insteadof
using a fixed
of using spatial
a fixed andand
spatial temporal threshold
temporal to cluster
threshold events,
to cluster self-adaption
events, utilizes
self-adaption the space–time
utilizes the space–timescan
statistic method
scan statistic to findtothe
method local
find the clusters in space
local clusters and time
in space and based
time basedon their statistical
on their significance.
statistical The
significance.
space–time scan statistical
The space–time methodmethod
scan statistical was originally developed
was originally by Kulldorff
developed et al. [35,36]
by Kulldorff et and integrated
al. [35,36] and
into the SaTScan
integrated into thesoftware
SaTScan[37]. This[37].
software method does not
This method require
does a predefined
not require clustercluster
a predefined size, size,
and the
and
the geographic distribution of events is normally inhomogeneous, which suits our case of identifying
events from Twitter data well.
The initiation of the space–time scan statistics method requires a starting radius (r) and a
minimum time frame (t). A space–time cluster is defined as a cylinder with r as the radius and t as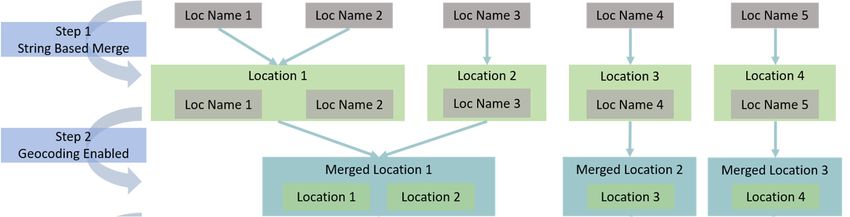
ISPRS Int. J. Geo-Inf. 2019, 8, 111                                                                 8 of 21

geographic distribution of events is normally inhomogeneous, which suits our case of identifying
events from Twitter data well.
     The initiation of the space–time scan statistics method requires a starting radius (r) and a minimum
time frame (t). A space–time cluster is defined as a cylinder with r as the radius and t as the height.
By systematically increasing r and aggregating multiple time frames, experiments are conducted to
evaluate all possible cases and find statistically significant space–time clusters. A detailed explanation
of the scan statistics can be found on the user guide of SaTScan [37].

3.3. Event-Based Credibility (EBC) Schema
     Event credibility is generated from the supporting tweets of the associated event based on three
factors: Mentioning of a specific event in the text content; mentioning of the event in URL; and the
accumulated retweet number. The event credibility score is the weighted sum of the three factors
normalized as follows:
                                EBCNORM = 0.5 × text + 0.5 × URL                                  (1)
                                                                Retweettweet
                                         RetweetNORM =                                                 (2)
                                                                Retweetmax
                                      EBCtweet = EBCNORM + RetweetNORM                                 (3)
                                                         i =n
                                            EBCtotal =   ∑ EBCtweet i                                  (4)
                                                         i =1

where n = total number of tweets associated with the event.
      For each event, the credibility score of each supporting tweet is calculated based on its mentioning
of the event’s location from both text content and URL. The credibility of an event within a supporting
tweet is 1 if the tweet mentions this event’s location in its text content. The normalized credibility of
this event (EBCNORM ) in this tweet is 0.5 × 1 + 0.5 × 1 = 1 if this tweet also mentions this location
in its URL content, as in Equation (1). The 0.5 is not the weight assigned to the event mentioning
but a normalization so that the maximum possible value of EBCNORM is 1. Retweet of a supporting
tweet is also normalized (RetweetNORM ) using Equation (2), where the Retweetmax is the maximum
number of retweets among all supporting tweets under the theme, and the maximum possible value of
RetweetNORM is 1 as well. The event-based credibility score of one tweet (EBCtweet) after normalization
achieves its maximum of 2 of which 1 is provided each by EBCNORM and RetweetNORM (Equation (3)).
      The total credibility score for each event is the accumulation of the EBCtweet (Equation (4)).
Events with high credibility scores have a greater influence on the spatial, temporal, or social scales.
Conversely, low credibility events are excluded from this schema.

4. Data and Credibility Analysis
     This section introduces the Hurricane Harvey Twitter dataset, data preprocessing, and credibility
analysis on calculating the credibility identified for each event with the proposed framework (Section 3).

4.1. Hurricane Harvey Twitter Dataset
      The Twitter dataset for Hurricane Harvey (North Texas Libraries [38]) used a comprehensive
keyword list and covered a total of 7,041,794 tweets and retweets in from August 18, 2017 to September
22, 2017 (Hurricane Harvey started on August 17, 2017, and ended on September 2, 2017) and stored
as a single 43.2 GB JSON file. Of the total original tweets, 7537 are geo-tagged tweets.
      The map of overall daily tweet count and theme-related tweet count demonstrates the major
affected area (Houston) during Hurricane Harvey (Figure 4), displaying the distribution of the tweets
using user-shared locations and the largest hotspot revealed in the Houston area, the first landfall
site for Hurricane Harvey. There were three landfalls in total, starting on August 25, 2017, and all the
related tweet counts reached their peak on this day of the first landfall. The most tweeted theme was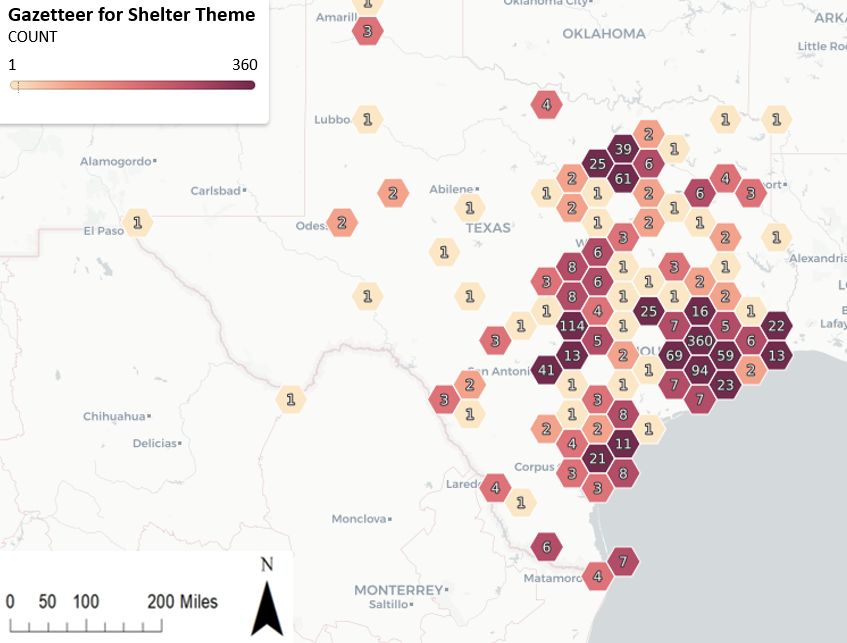
ISPRS Int. J. Geo-Inf. 2019, 8, 111 9 of 21
Flood, a reasonable theme for a hurricane event. Tweet counts for all themes, except that for Power,
dropped
ISPRS Int. dramatically
J. Geo-Inf. 2019, 8,after
x FORthe lastREVIEW
PEER landfall on August 30, 2017. 9 of 20
Figure4.4.Spatiotemporal
Figure Spatiotemporaldistribution
distribution ofof original
original data. The
The map
map (center
(center in
in the
the Houston
Houstonarea)
area)shows
shows
geographicdistribution
geographic distributionwithin
withinallalluser
usershared
shared coordinates,
coordinates, and the bar chart
chart demonstrates
demonstratesaatemporal
temporal
distribution.Three
distribution. Threelandfalls
landfallsare
aremarked
marked inin dark
dark blue
blue color
color on August 25, August 26, and
and August
August 30.
30.
4.2.
4.2.Data
DataPreprocessing
Preprocessing
Location
Locationinformation
information can can be
be extracted
extracted from from Twitter
Twitter data
data through different elements,
through different elements,including
including
tweet text, user-shared coordinate, and URLs (Laylavi et al. [39]). Together
tweet text, user-shared coordinate, and URLs (Laylavi et al. [39]). Together with tweet id, retweet with tweet id, retweet
count, user id, user followers, and tweet post time, these core attributes from each
count, user id, user followers, and tweet post time, these core attributes from each tweet were selected tweet were selected
and
andstored
storedininPostgreSQL
PostgreSQL[40] [40]for
forfaster
faster storage
storage andand retrieval
retrieval of the JSON data. data. Only
Only original
originaltweets
tweets
were used, since retweets are duplicated information. In addition, only tweets
were used, since retweets are duplicated information. addition, only tweets in English were used, in English were used,
with
withaathreshold
thresholdofof60%60%English
Englishwords
words (excluding
(excluding emojis, symbols, URL URL links,
links, and
and redundant
redundantwhite white
spaces).
spaces).
The
TheURLURLcontents
contents were
were retrieved to to complement
complementthe theinformation
informationsharedsharedinin the
the text
text content
content of of
a
atweet.
tweet. AnAnopen
opensource
sourcepython
pythonpackage
package(Goose (Goose[41])
[41])waswas adopted,
adopted, and and algorithms
algorithmsdesigned
designedto to
automatically
automaticallyloop loopthrough
through URLs,
URLs, calling
calling thethe Goose
Goose to extract
extract web contents.
contents. All All extracted
extractedcontents
contents
werestored
were storedininaapredefined
predefineddatabase
database table
table schema
schema with
with associated tweet tweet ID ID toto avoid
avoid duplicative
duplicative
operationwhen
operation whenURL URLtexts
textsareare needed.
needed. EachEach record
record with
with its its associated
associated tweet
tweet ID ID
(tid)(tid)
waswas stored
stored so
so that
that tables
tables are usedare for
used for “join”
“join” searchsearch to provide
to provide fast query
fast query results.
results.
Tweetswere
Tweets werereclassified
reclassifiedusing
usingpredefined
predefined keyword
keyword sets sets (Section 3.1). Keywords
Keywords were wereapplied
applied
asasquery
queryindicators
indicatorsforforeach
each theme,
theme, and and tweets
tweets containing
containing these
these keywords
keywords were were reclassified
reclassifiedto tothe
the
themegroup.
theme group. Tweets
Tweets from
from different
different theme groups were stored stored separately
separately for for later
later constructing
constructing
theme-associatedlocal
theme-associated localgazetteers
gazetteersand andevent
event tables.
tables.
Thefrequency
The frequencyofoftweets
tweetsrelated
relatedto to the
the five
five themes
themes (Figure
(Figure 5) 5) shows
shows aaslightly
slightlydifferent
differenttime
timeseries
series
from the previous graph (Figure 4). Before Harvey’s first landfall, tweets
from the previous graph (Figure 4). Before Harvey’s first landfall, tweets are mostly related to personal are mostly related to
personal feelings, forecast information, caution, and advice. Since these topics
feelings, forecast information, caution, and advice. Since these topics are not included in the analysis, are not included in the
analysis,
this this contributes
contributes to the in
to the difference difference
these two in time
theseseries.
two time series. Inthe
In addition, addition, the first
first landfall landfallat
occurred
occurred at approximately
approximately 10 p.m. (August 10 p.m.25,(August
2017) with 25, 2017) withhours
only two only two lefthours
in theleft
day,in and
the day, and no
no major major
damage
damage was reported. A trough in tweet frequency was observed in both figures with the second
landfall (August 26, 2017). Harvey’s slow movement from August 26–30 resulted in catastrophic
flooding which underpinned other damage observed from the increasing trends.
ISPRS Int. J. Geo-Inf. 2019, 8, 111 10 of 21
was reported. A trough in tweet frequency was observed in both figures with the second landfall
(August 26, 2017). Harvey’s slow movement from August 26–30 resulted in catastrophic flooding
which underpinned
ISPRS Int. J. Geo-Inf. 2019,other damage
8, x FOR observed from the increasing trends.
PEER REVIEW 10 of 20
Figure 5. Temporal
Figure 5. Temporaldistribution
distributionfor
for55theme-related
theme-relateddaily
dailytwitter
twittercount.
count.
4.3. Event-Based Credibility Analysis
4.3. Event-Based Credibility Analysis
With data stored in the database after collecting and preprocessing, credibility analysis
With data stored in the database after collecting and preprocessing, credibility analysis focused
focused on analyzing event-based credibility (Section 3.2), starting from location extraction and
on analyzing event-based credibility (Section 3.2), starting from location extraction and event
event identification.
identification.
4.3.1. Local Gazetteer Construction
4.3.1. Local Gazetteer Construction
Location extraction methodology was applied to text messages and the associated URL web pages.
Location extraction methodology was applied to text messages and the associated URL web
All extracted locations were inserted into the gazetteer table created in PostgreSQL and classified in
pages. All extracted locations were inserted into the gazetteer table created in PostgreSQL and
the following four categories: Roads from tweet texts; places from tweet texts; roads from URL texts;
classified in the following four categories: Roads from tweet texts; places from tweet texts; roads from
and place from URL texts with tweet ID (Table 2).
URL texts; and place from URL texts with tweet ID (Table 2).
Table 2. Gazetteer table with Twitter ID.
Table 2. Gazetteer table with Twitter ID.
tw_road tw_place url_road url_place Tcreate TID
tw_road tw_place url_road url_place Tcreate TID
#P Abundant Life 2017-08-25
*R 601 Delany Rd #P Abundant Life 2017-08-25 901280250784514048
*R 601 Delany Rd Christian Center 10:08:51 p.m. 901280250784514048
Christian Center 10:08:51 p.m.
*R Texas Coastal *R Texas #P Rockport Fulton 2017-08-26
#P Rockport 901486512914804738
*R Texas
BendCoastal *RCoastal
Texas Bend
Coastal High School 2017-08-26
11:48:28 a.m.
Fulton High 901486512914804738
Bend #P Poteet High Bend 11:48:28 a.m.
2017-08-25
*R 3300 Poteet Dr School 901261879120715777
School 08:55:51 p.m.
#P Poteet High 2017-08-25
*R 3300 Poteet Dr *R San Antonio
#P Bailey Hutchison 2017-08-30 901261879120715777
*R 5 Dallas Fort School 08:55:51 p.m. 902985413991727104
Fort Convention Center 03:04:34 p.m.
#P Bailey
*R San Antonio Hutchison 2017-08-30
*R 5 Dallas Fort 902985413991727104
After extraction, location informationFort
was merged Convention
to eliminate 03:04:34 p.m.
duplication (Section 3.2.2). Within
Center
the twitter data, all location names were collected from the gazetteer table for roads and places as two
groups, and these two groups were merged separately based on the string match after formatting the
After extraction, location information was merged to eliminate duplication (Section 3.2.2).
user-generated location names. These two groups were sent to the second step for further analysis
Within the twitter data, all location names were collected from the gazetteer table for roads and places
with geocoding enabled, including coordinates match, road name match, and road name fuzzy match
as two groups, and these two groups were merged separately based on the string match after
with zip code constraint. These two steps collected non-repeating locations for potential events. The
formatting the user-generated location names. These two groups were sent to the second step for
overall
further distribution
analysis with ofgeocoding
these geocoded locations
enabled, for each
including theme illustrates
coordinates match, roadthename
different
match,numbers of
and road
tweets postedmatch
name fuzzy at different locations,
with zip where the These
code constraint. bigger two
the size,
stepsthe more the
collected tweets (Figure
non-repeating 6).
locations for
potential events. The overall distribution of these geocoded locations for each theme illustrates the
different numbers of tweets posted at different locations, where the bigger the size, the more the
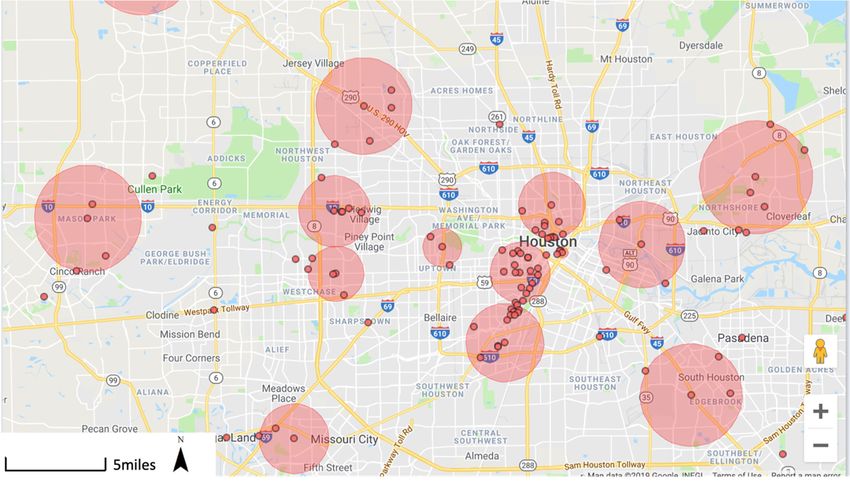
tweets (Figure 6).ISPRS Int. J. Geo-Inf. 2019, 8, 111 11 of 21
ISPRS Int. J. Geo-Inf. 2019, 8, x FOR PEER REVIEW 11 of 20
(a)
(b)
Figure 6. Cont.ISPRS Int. J. Geo-Inf. 2019, 8, 111 12 of 21
ISPRS Int. J. Geo-Inf. 2019, 8, x FOR PEER REVIEW 12 of 20
(c)
Figure
Figure 6. Map
6. Map examples
examples showing
showing local
local gazetteer
gazetteer plotted
plotted for themes:
for two two themes: (a) Shelter
(a) Shelter (from(from 2990
2990 tweets);
tweets); (b) Power (from 752 tweets), and (c) the high water mark location distribution from
(b) Power (from 752 tweets), and (c) the high water mark location distribution from USGS. In contrast USGS. In
contrast to the heat map on Figure 4 (users’ own location), these are the locations users mention
to the heat map on Figure 4 (users’ own location), these are the locations users mention in their tweets in
their tweets or locations from of the URLs they share (note: The bigger the size,
or locations from of the URLs they share (note: The bigger the size, the more the tweets). the more the tweets).
4.3.2.
4.3.2. Event
Event Identification
Identification
Based
Based ononthethe resulting
resulting local
local gazetteer,
gazetteer, the the space–time
space–time scanscan statistics
statistics was was applied
applied to identify
to identify events
events that are statistically significant (Figure 7). Each event is an occurrence that happened
that are statistically significant (Figure 7). Each event is an occurrence that happened during a specific during
a specific
time timewithin
frame and frame and within
a spatial a spatial
range. range. space–time
A specific A specific space–time clusterby
cluster defined defined by this
this time time
frame and
frame and spatial range contains all tweets that belong to this event. For example, events
spatial range contains all tweets that belong to this event. For example, events happening at College happening
at College
Station Station
and Texas A&MandUniversity
Texas A&M areUniversity
considered areasconsidered as the same
the same “POWER” “POWER”
event (Figure event (Figure
7b). The Power
7b). The Power theme event table contains 252 events, and four other tables for Casualty, Damage,
theme event table contains 252 events, and four other tables for Casualty, Damage, Flood, and Shelter,
Flood, and Shelter, containing 716, 1,898, 3,672, and 1229 events, respectively.
containing 716, 1,898, 3,672, and 1229 events, respectively.
4.3.3. Credibility Score Calculation
4.3.3. Credibility Score Calculation
Credibility scores for each tweet and event were calculated (3.3), and an example of how the
Credibility scores for each tweet and event were calculated (3.3), and an example of how the
credibility scores were calculated and added to the event table is provided (Table 3). Compared with
credibility scores were calculated and added to the event table is provided (Table 3). Compared with
Table 2, the column “neighbors” contains all merged locations under the event. Column loc_credits
Table 2, the column “neighbors” contains all merged locations under the event. Column loc_credits
and rt_credits stored the calculated credibility score for each supporting tweet (EBC_tweet), where
and rt_credits stored the calculated credibility score for each supporting tweet (EBC_tweet), where
loc_credits is the mention of a specific event (in the text content and/or in the event in URL), and
loc_credits
rt_creditsisisthe
the mention of a specific
retweet number beforeevent (in the textColumns
normalization. content ‘loc_credit’
and/or in and
the event in URL),
‘rt_credit’ and
are the
rt_credits is the retweet number before normalization. Columns
sum for the column loc_credits and rt_credits, respectively. ‘loc_credit’ and ‘rt_credit’ are the sum
for the column loc_credits and rt_credits, respectively.ISPRS Int. J. Geo-Inf. 2019, 8, 111 13 of 21
ISPRS Int. J. Geo-Inf. 2019, 8, x FOR PEER REVIEW 13 of 20
(a) (b)
(c)
Figure
Figure 7. 7.Detected
Detected space–time
space–time clusters
clustersininCollege
CollegeStation andand
Station Houston
Houstonregions: (a) Study
regions: area; (b)
(a) Study area;
(b)college
college station region;
station (c) clusters
region; in the in
(c) clusters Houston region, with
the Houston different
region, with sizes of redsizes
different bubbles
of indicating
red bubbles
different different
indicating sizes of spacetime aggregation.
sizes of spacetime aggregation.
Table 3. Event table with credibility score.
Table 3. Event table with credibility score.
Cluster Neighbors loc_credit rt_credit loc_credits rt_credits
Cluster Neighbors loc_credit rt_credit loc_credits rt_credits
#P Ben Taub
#P Ben Taub Hospital, #P Houston Ben
Hospital, #P
6594 Taub Hospital, #P Ben Taub hospital, #P 6.5 38 {0.5,0.5,0.5,0.5,0.5 . . . } {0,1,27,0,0,0,8 . . . }
Houston Ben Ben
Nevertheless TaubTaub hospital
6594 #PHospital,
Texas A M #P Ben #P Texas6.5
university, AM 38 {0.5,0.5,0.5,0.5,0.5…} {0,1,27,0,0,0,8…}
34 TaubUniversity,
hospital, #P #P
TEXAS A M 11.5 59 {0.5,0.5,0.5,0.5,1 . . . } {4,2,12,11,0,11,9 . . . }
UNIVERSITY, *R Smith College Station
Nevertheless Ben
*R The Galveston Ferry, #P Galveston
11 Taub
Island hospital
Beach, #P The Galveston Island 14 97 {0.5,0.5,0.5,0.5 . . . } {1,3,0,35,4,1,2,0,2 . . . }
#P Texas#P
Beach, AStewart
M Beach
*R College Station, *R Bryan College
34 university, #P 11.5 59 {0.5,0.5,0.5,0.5,1…} {4,2,12,11,0,11,9…}
Station, *R COLLEGE STATION, #P
162 Texas A M#P Bryan College 1 0 {1} {0}
College Station,
Station, #P COLLEGE STATIONISPRS Int. J. Geo-Inf. 2019, 8, 111 14 of 21
5. Case-Study Results of Credibility Scores for Hurricane Harvey
The credibility scores were validated for the four most trustworthy events are as follows: Toyota
Center shelter event; George R. Brown Convention center shelter event; Texas A&M University power
event; and Ben Taub Hospital power event. The validation used spatial reliability, temporal trend,
and social impacts. The context has been provided at the end of this section with one extra validation
for a low credibility event.
5.1. Spatial Reliability
Spatial information is a critical component in credibility calculation. Corresponding news related
to three of the four events corroborated this conclusion, confirming that the locations extracted from
the tweets are valid [42–44]. In addition, high water mark (HWM) data obtained from USGS flood
event viewer [45] that are presented in Figure 6c indicate the extracted geographic distribution of
tweets can represent the actual geographic distribution of Harvey’s impacts. Calculating the Pearson
correlation for location distribution of Shelter and HWM, an r of 0.879 illustrated a perfect positive
linear relationship between variables. The r for location distribution of Power and HWM is 0.93, which
is even better.
5.2. Temporal Trend
The temporal evolvement of credibility for the two shelter events included the credit count (total
event-mentioning credibility of the day), tweet count (total supporting tweets of the day), event-match
evolving (accumulation of credit count), retweet evolving (normalized total retweets of the day),
and merged evolving (accumulated evolving trend of event-mentioning and retweet). Shelter events
usually extend for a long time period existing from the first announcement until it is closed. This offers
insight on how to adjust the temporal event separation (Figure 3, Section 3.2.2). The number of tweets
that include Toyota Center shelter event peaked on August 29 (Figure 8a), the same day the Houston
Mayor posted opened the Toyota Center as an additional shelter for Harvey Evacuees (The Weather
Channel). The George R. Brown Convention Center shelter event is the most convincing shelter event,
as its calculated credibility score ranked on the top of the Shelter event table and is supported by 3234
original tweets and 28,779 retweets. Trends for the two shelter events are similar, both peaking after
being announced as shelters.ISPRS Int. J. Geo-Inf. 2019, 8, x FOR PEER REVIEW 15 of 20
and is
ISPRS Int.supported by 8,3234
original tweets and 28,779 retweets. Trends for the two shelter events
J. Geo-Inf. 2019, 111 15 ofare
21
similar, both peaking after being announced as shelters.
Figure8.8.Evolving
Figure Evolvingcredibility
credibility of
oftwo
twoevent
eventexamples
examples (Toyota
(ToyotaCenter
Center(Panels
(Panels a, b,and
a,b, andc)c)and
andGeorge
George
Brown
BrownConvention
Convention Center
Center (Panels
(Panels d, e, and
d, e, f)). Panels
andf)). Panels aa and
and dd are
arecredit
creditcounts,
counts, panels
panels bband
andeeare
are
event-match evolving, and panels c and f are merged evolving.
event-match evolving, and panels c and f are merged evolving.
Power
Powerevents
eventsshow
showdifferent
different trends
trends(Figure
(Figure 9)
9) with
with more
more diversity.
diversity.The
The Texas
TexasA&M
A&MUniversity
University
power
power event from August 24–25, 2017 showed two prominent peaks (Figure 9a), whilethe
event from August 24–25, 2017 showed two prominent peaks (Figure 9a), while theposts
postsfor
for
the Ben Taub Hospital power event on August 27, 2017 showed no peak but a continuing
the Ben Taub Hospital power event on August 27, 2017 showed no peak but a continuing increase. increase. The
evacuation eventevent
The evacuation of BenofTaub
Ben Hospital at around
Taub Hospital 8 a.m. 8can
at around becan
a.m. detected by the by
be detected framework due to due
the framework the
dramatic
to the dramatic increase of reporting the flooding and power outages and reflected more than the
increase of reporting the flooding and power outages and reflected more than 4 h later in 4h
news reports at 12:23 p.m.
later in the news reports at 12:23 p.m.
5.3. Social Impacts
5.3. Social Impacts
The sources of a particular event are crucial for the evaluation of credibility, and the networks of
The sources of a particular event are crucial for the evaluation of credibility, and the networks
social relations provide essential contributions. The social network built for the Toyota Center Shelter
of social relations provide essential contributions. The social network built for the Toyota Center
Event (Figure 10), an event with high credibility (Figure 8), is established by the retweet relationships
Shelter Event (Figure 10), an event with high credibility (Figure 8), is established by the retweet
among users as displayed using Gephi [46]), an open-source visualization platform. Twitter account St.
relationships among users as displayed using Gephi [46]), an open-source visualization platform.
John B. Smith is the most significant source for the event and is followed by Jason Westin MD, ABC
Twitter account St. John B. Smith is the most significant source for the event and is followed by Jason
News, Houston Chronicle, The Associated Press, and KPRC 2 Houston. The most contributing account,
Westin MD, ABC News, Houston Chronicle, The Associated Press, and KPRC 2 Houston. The most
St. John B. Smith [47], is a public safety reporter at Houston Chronicle [48], the largest daily newspaper
contributing account, St. John B. Smith [47], is a public safety reporter at Houston Chronicle [48], the
in Houston. The Associated Press [49] is a US-based not-for-profit news agency, and ABC News [50] is
largest daily newspaper in Houston. The Associated Press [49] is a US-based not-for-profit news
the news division of the American Broadcasting Company. These news outlets are generally regarded
agency, and ABC News [50] is the news division of the American Broadcasting Company. These news
as trustworthy information resources, indicating that our framework provides credible results. Social
outlets are generally regarded as trustworthy information resources, indicating that our framework
networks can be applied to all trustworthy events to assist in the flow of information and a better
provides credible results. Social networks can be applied to all trustworthy events to assist in the flow
understanding of how the events unfold.
of information and a better understanding of how the events unfold.You can also read