Investigating mass balance of parvati glacier in Himalaya using satellite imagery based model - Nature
←
→
Page content transcription
If your browser does not render page correctly, please read the page content below
www.nature.com/scientificreports
OPEN Investigating mass balance
of Parvati glacier in Himalaya using
satellite imagery based model
Swati Tak & Ashok K. Keshari*
Accurate assessment of glacier mass loss is essential for understanding the glacier sensitivity to
climate change and the ramifications of glacier retreat or surge. The glacier melt affects the runoff and
water availability, on which the drinking and irrigation water supplies and generation of hydroelectric
energy depend upon. The excessive glacial retreat may cause flood, glacial lake outburst flood,
avalanches and sea level rise which are likely to affect the lives and livelihood of the people and
damage the infrastructure. Here, we present a remote sensing based modeling framework to improve
the understanding of accumulation and ablation processes and to quantify the glacier mass balance
using multispectral satellite imageries, as several glacierized regions of the world are still poorly
monitored because the field measurements for continuous monitoring on a large scale or in a complex
harsh terrain are costly, time consuming and difficult. The developed modeling framework has been
applied to the Parvati glacier in the western Himalaya to investigate glaciological processes and
estimate the surface mass loss using 19 years of satellite images from 1998 to 2016. It spreads over
425.318 km2 and more than 50% of the area is accumulation area. The study shows that the Parvati
glacier is not in equilibrium and its behavioural response changes year to year characterized with high
rate of mass loss. The value of accumulation area ratio varies between 0.33 and 0.70 with an average
value of 0.55, indicating a negative mass loss. The mean specific mass loss is − 0.49 ± 0.11 m w.e. and
the total mass loss is 3.95 Gt., indicating strong influence of climate change and effect on river flows
and water availability.
There has been increasing worldwide interest in glacier studies as glaciers are considered among the most sensi-
tive indicators of climate change because they are one among many natural entities that are directly affected by
the climate change, and several model studies show that the climate change due to global warming will result in
significant melting of earth’s glaciers and thereby a significant rise in global sea level. It is evident from literature
review that there are several regions with highly negative mass balances, but there are also regions with positive
mass balances and some regions in equilibrium condition1–5. For example, the glaciers that are showing negative
mass balances and therefore shrinking with time include alpine glaciers in Europe1 and Himalayan glaciers in
India2–4. The glaciers that are growing with time and showing positive mass balances are Scandinavian glaciers1.
However, the mass balances of glaciers in the C aucasus5 are close to zero indicating that they are in equilibrium,
not showing any signature of growing or shrinking with time. A regional glacial mass balance potential was
obtained for 300 years to study glacial dynamics in the Glacial National Park, Montana and the obtained results
were compared with the historic values of advances and retreats of Jackson and Agassiz glaciers in the northwest
Montana6. This study utilized tree-ring based reconstructions of surface temperature anomalies in North Pacific
and summer drought as representative indicators for the winter glacial accumulation and the summer ablation,
respectively. The earlier study for these two glaciers had indicated a moderate retreat of about 3–14 m/year till
1917, and then after a very high retreat of greater than 100 m/year for about 25 years, indicating a remarkable
shift of the glacial mass balance potential to an extremely negative phase7. The recession in the Swiss Alps glacier
was examined for several thousand years based on the radiocarbon derived ages of materials that were found in
the proglacial fluvial sediments of the subglacial origin8. These materials primarily include subsoil remains of
wood and peat. Based on the analysis, a master chronology of fluctuations of Swiss glacier was constructed for the
period of the Holocene (1,200–9,850 cal. yr BP or BC 7,900–AD 750). The ice and meteorological measurements
Department of Civil Engineering, Indian Institute of Technology, Delhi, New Delhi 110016, India. *email: akeshari@
civil.iitd.ac.in
Scientific Reports | (2020) 10:12211 | https://doi.org/10.1038/s41598-020-69203-8 1
Vol.:(0123456789)
www.nature.com/scientificreports/
made during 1865–2006 were analyzed to compute the annual mass balances of a number of Swiss Alps glaciers,
namely, Silvretta, Rhone, Aletsch and Gries9. It was observed that these glaciers have decreased in size, but the rate
of glacier shrinkage has not accelerated with time. A number of recent studies on glaciers reveal that most of the
glaciers will disappear by a time less than a decade if the present trend of retreat remains10. A comparative analy-
sis of retreat rates of Alaskan glaciers shows that the retreat rates are faster after 1971 and are still continuing11.
In-situ measurements of mass balance of a glacier provide not only strong evidence for the glacier retreat and
climatic sensitivity, but also provide a benchmark data set for the verification and reliability of results of mass
balances estimated from other methods that may be empirical, statistical, mathematical, hydrological, or remote
sensing technique. However, the great challenge remains in deciding the number of in-situ measurements and
at what locations it should be performed. One of the study12 on this aspect dealt with the appropriate number of
stakes required to be installed for the measurement of mass balance of a glacier, and it shows that the gradient
of the mass balance with altitude is more dominant than the transverse variations in deciding the number of
measurements. Later, another s tudy13 thoroughly investigated this aspect by considering a dynamical system of
in-situ mass balance measurements wherein a second order spatial field model was presented for the statistical
optimality of stakes to arrive at the number and locations of stakes distributed over the areal extent of the glacier
for the measurement of mass balance in the field. This study also evaluated the efficiencies of monotonic and
space-filling designs with the real data sets for the Chilean glaciers, namely, Olivares Alfa and Beta that contrib-
ute significantly to the stream flow of the Maipo river, and observed that the variance can increase or decrease
due to the removal of some stakes under a specified covariance structure. It also advocated that the statistical
designs are important where the simple application of raster design leads to increase in variance. The dynamical
systems having generic conditions underline the empirically observed fact that around 11 well-positioned stakes
are sufficient for mass balance measurement in homogenous glaciers.
The literature review shows that the studies on the Himalayan glaciers are very limited. These studies include
geomorphology, mass balance and dynamics of glaciers, and are mainly based on the field measurements of
snow and meteorological parameters, and remote sensing data consisting of aerial photographs and satellite
images. It may be noted while using remote sensing products that the glacier movements can be calculated only
after the removal of topographic information, otherwise the images will be replete with noise due to geometry.
The estimation of glacier mass loss using parameters is possible only when the precise ortho-rectification of
nonmoving objects is done in images that can be identified using fixed points. A number of geomorphological
parameters including glacier shape and size, unique glaciological features, hypsometry, and bed topography can
be investigated using remote sensing based techniques, and these parameters and features are very helpful in
understanding the glacier mass balance. The presence of supra-glacial lakes in the region points to subsidence
and fast degenerating nature of the glacierized area. However, some studies14 use numerical model with climatic
datasets due to limited field data on glacier, rather than making use of remote sensing data, for understanding
the glacier retreat. The numerical ice flow m odel14 was developed for a glacier in the Nepal Himalaya to inves-
tigate the role of local climate on the glacier retreat and the evolution of glacier in future. The topographical
characteristics of Hamtah and Chhota Shigri glaciers located in the Chandra basin lying in the western Indian
Himalaya were explored using remote sensing data to examine the role of topography in controlling the responses
of glaciers towards climatic v ariations15. It was found that the Chhota Shigri can be considered as a representative
glacier in the region for reflecting the effect of climatic variability on the glacier response as several glaciers in
the region show close similarity with the Chhota Shigri glacier in terms of topographic and climatic settings and
morphological characteristics. A review on Himalayan glaciers shows that most Himalayan glaciers are retreating
and the average yearly shrinking was estimated to be approximately 17.5 m a −1 during the period from 1971 to
20042. The study16 on Gangotri glacier shows that its average velocity is 4–6 cm/day corresponding to the yearly
shrinking of 15–20 m a −1. The geomorphological s tudy17 of the Alaknanda glacier in the Ganga basin shows that
the Alaknanda glacier accounts 16.77% glaciated region of the Ganga basin and the glaciers in the Alaknanda
sub-basin are dirty due to higher percentage of ablation area under debris cover.
It is evident from the literature review that there is lack of mass balance data of glaciers. In fact, not only
glaciers in the Himalayan region, but a number of glacierized regions of the world are still unsampled or poorly
sampled and inadequately monitored. If higher number of years of records is taken as basis and especially if
seasonal mass balances in terms of winter and summer mass balances are required to understand the prevail-
ing glaciological processes, the mass balances of a very few glaciers are available18. Currently, there is only one
literature3 pertaining to the glacier retreat study on the Parvati glacier. This study is based on very limited, short
and sparse data set. It has reported mass balance for only one year. There is no gauging site for continuous meas-
urement of meteorological and hydrological parameters. The glacier retreat may have greater ramifications on
water, food and energy security. The glaciological processes and the dynamics of glaciers and snow mass are also
sensitive to climate change as small fluctuations can sometimes lead to rapid retreat or surge in the glacial extent
which may cause devastating flood, glacier lake outburst flood and snow avalanche that may affect life, property
and infrastructure adversely on the d ownstream19,20. Further, the increasing mass loss and declining glacier size
in mountainous areas and other regions of the earth may contribute significantly to the sea level r ise21. Thus,
an accurate assessment of mass loss and the snow cover helps in understanding the sensitivity of the region.
The mass loss and the change in the length of glacier depend upon its geometry and climatic variations22. It is
therefore essential to have better understanding of glaciers geomorphology and precise assessment of glaciers
mass loss. Keeping these points in view, the main objective of this paper is to present a modeling framework
to improve the understanding of accumulation and ablation processes taking place in a glacier system and to
quantify the mass balance of a glacier using multitemporal multispectral satellite imageries. This modeling
framework is advantageous over the currently used approaches as field measurements of snow and meteorological
parameters as well as information derived from the subglacial materials are limited and don’t cover the entire
glaciated region. Further, getting long time series of such measurements is another challenge. The developed
Scientific Reports | (2020) 10:12211 | https://doi.org/10.1038/s41598-020-69203-8 2
Vol:.(1234567890)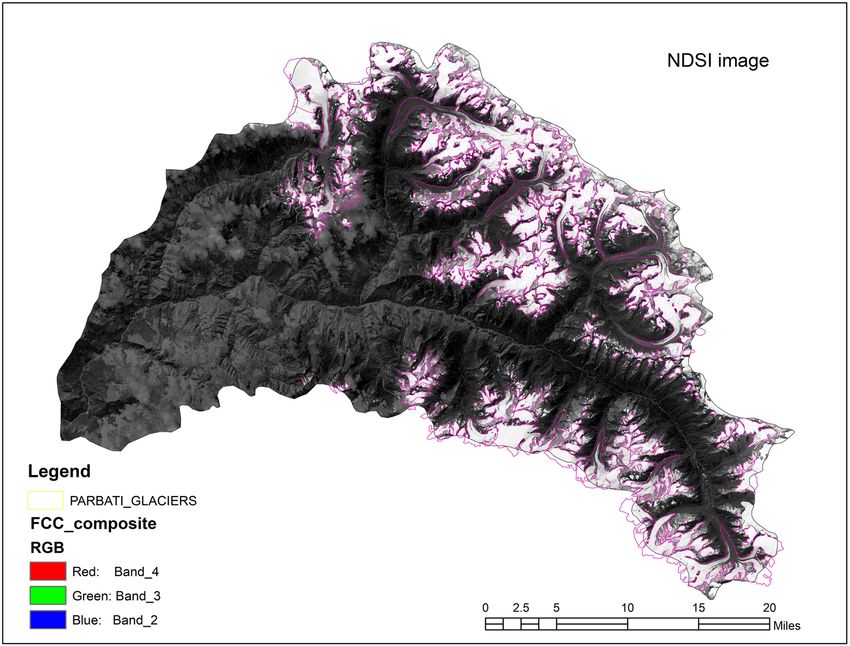
www.nature.com/scientificreports/
modeling framework has been applied to the Parvati glacier in the western Himalaya to examine the prevailing
glaciological processes and to estimate the surface mass loss of the Parvati glacier. This will not only help in
better understanding of glaciers, but also in hydrological and avalanche dynamics studies. The study will be also
useful in determining the responses of glaciers to global warming and climatic changes, and in identifying the
plausible reasons that are responsible for causing aberration in the glacier response as it may be affected by the
presence of debris23 and the human behaviour24.
Modeling framework. The mass balance reflects the hydrodynamics of glaciers at multiple spatial and
temporal scales which elucidates the perspectives on glacier interactions with hydrology, climatology and envi-
ronment in the region. The glacier response to climatic variations is commonly expressed in terms of surface
mass balance of the glacier system. It is expressed as a sum of accumulation and ablation taking place in a glacier
system over a specified period of time. The accumulation embraces all kinds of processes through which ice
and snow are added to a glacier system, whereas the ablation embraces those processes through which ice and
snow are lost from the glacier system. The accumulation processes that are responsible to increase the mass
of the glacier include precipitation of snow and ice directly over the glacier surface, refreezing of liquid water,
condensation of ice from water vapor and the transport of snow or ice to the glacier system by the kinematics of
avalanches or wind. The ablation processes that are responsible to reduce the mass of the glacier include melt-
ing, evaporation, wind erosion, calving, and removal of snow and ice from the glacier system by the actions of
avalanches. The ice and snow removed by the action of wind from the glacier is termed as ablation due to wind
erosion. Mathematically, the mass balance of a glacier can be expressed as an algebraic sum of accumulation and
ablation25,26:
t2
mb = (c + b)dt (1)
t1
where mb is the mass balance expressed as the net mass flux over time interval of t1 and t2, c is the accumulation
defined as the rate of gain in the glacier mass, and b is the ablation defined as the rate of loss in the glacier mass.
The accumulation is taken as positive, whereas the ablation is considered as negative while computing the mass
balance of a glacier.
The annual accumulation ( ac) and the annual ablation (ab) in a year can be expressed as:
t2
ac = cdt (2)
t1
t2
ab = bdt (3)
t1
where t1 and t2 denote the beginning and ending times of a year for which mass balance is being calculated.
The annual mass balance (mba) is the difference between the annual accumulation and the annual ablation:
mba = ac − ab (4)
The mass balance of glacier undergoes an annual cycle of growth and decay because the accumulation and
ablation of glaciers are seasonally governed. Thus, the annual mass balance of glacier at the end of a balanced
year can be also expressed as the sum of the winter mass balance ( mbw) and the summer mass balance (mbs):
mba = mbw + mbs (5)
To calculate the winter mass balance, t 1 and t 2 in Eq. (1) are taken as the beginning and ending of winter
season. If the same time limits are used in Eqs. (2) and (3), it will yield the winter accumulation and the winter
ablation, respectively. Similarly, if t 1 and t2 are the beginning and ending of summer season, then Eq. (1) will
give the summer mass balance and Eqs. (2) and (3) will yield the summer accumulation and the summer abla-
tion, respectively. The winter mass balance is generally positive, whereas the summer mass balance is negative.
The values of integral of ac and ab over the horizontally projected area (S) of the glacier are called total annual
accumulation (Tac) and total annual ablation ( Tab), respectively:
Tac = ac dxdy (6)
Tab = ab dxdy (7)
The difference between the total annual accumulation and the total annual ablation is called the total annual
net balance or net budget total ( An) and the specific net balance or the mean specific budget ( Av) is calculated
by averaging it over the area of the glacier:
An = Tac − Tab (8)
Av = An /S (9)
Scientific Reports | (2020) 10:12211 | https://doi.org/10.1038/s41598-020-69203-8 3
Vol.:(0123456789)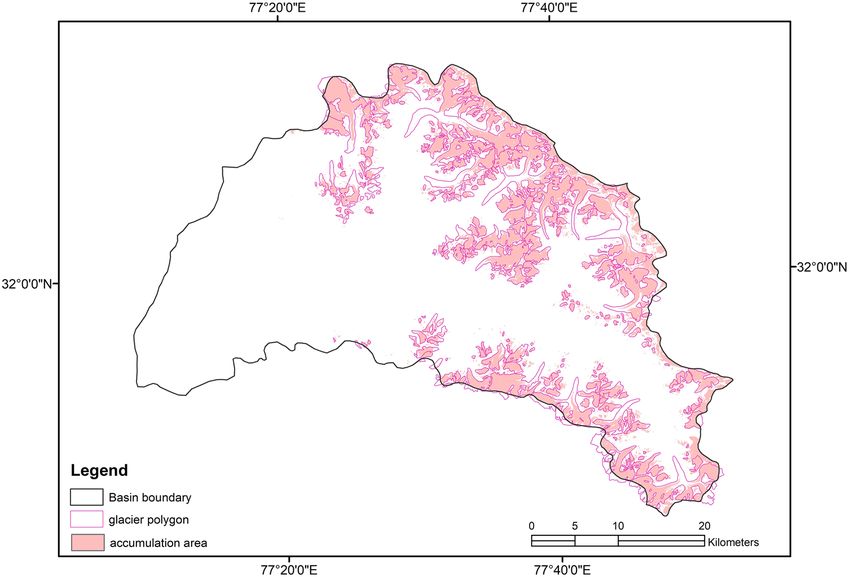
www.nature.com/scientificreports/
The annual mass balance of a glacier is generally calculated for a fixed period of one year time interval. It is
generally taken as a hydrological year for appraising the glaciers feedback to hydrological systems and predict-
ing the glaciers health under changing climate. The yearly mass loss is a hydrological budget which measures
the difference between the accumulated and the ablated glacier masses a nnually27. The difference between the
accumulated and the ablated glacier mass is also termed as the net budget or the net balance, which depends
upon the minimum mass of snow and ice at the end of each summer. This budget or net mass flux is an impor-
tant link between the climatic environment and the glacier system which describes how the glacier adjusts
dynamically to environmental perturbations, and also between the glacier hydrodynamics and the response of
the hydrological system.
A number of studies carried worldwide have shown the potential use of remote sensing techniques in moni-
toring snow, ice and glaciers using optical and microwave s ensors4,15–17,28–32. The snow layers bring variation in
snow properties spatially in all directions, however, the physical and dielectric properties vary significantly along
the vertical drop of the snow layer because of the consolidation of various layers with t ime19,28. The increased
availability of digital data from various remote sensing satellites at appropriate spatial and temporal resolution
provides capability of regular monitoring of changes in the glacier geomorphology and its parameters over the
large areas of interest and the longer time spans required for sustainability analysis. A number of glaciological
parameters and properties, namely, snow and ice extent, snout or terminus position, glacier area, glacier length
and width, surface elevation, glacier volume, surface flow fields, accumulation and ablation zones, snowline, equi-
librium line altitude (ELA), and accumulation area ratio (AAR) could be obtained from the multispectral remote
sensing data. These quantities are very useful in understanding the glaciological processes and the glacier mass
balance studies. There are direct and indirect methods for the assessment of glaciers condition and determining
the glacier mass loss. The mass loss is glacier specific and depends upon the terrain and climatic conditions. The
glacier mass loss and snowmelt simulation play very important role in the hydrological models. In this paper, a
satellite imagery based model is presented to estimate the glacier mass balance and examine its annual variability.
The model combines remote sensing and statistical techniques to compute the glacier mass balance. The mass
balance is calculated using a regression equation developed between AAR and in-situ measurements of mass
balance. This regression model is based on the hypothesis that a strong relationship exists between the net mass
balance and the accumulation area ratio as evident from various literature33–38 and the statistical test carried out
in the present study. The remote sensing provides a powerful tool to identify the ELA and the transient snowline
(TSL) from the multispectral satellite images, and is very advantageous in those areas where field observations
are non-existent or lacking39. The ELA is defined as the spatially averaged elevation of the equilibrium line, which
is an imaginary line joining a set of points on the glacier surface at which the annual net mass balance is zero.
The TSL is the locus of locations of the transition from the snow cover to the bare glacier ice, superimposed ice
or firn at a specific time during the ablation season. The position of the ELA is obtained by monitoring the posi-
tion of transient snowlines throughout the ablation season because the altitude of the snowline at the end of the
ablation season is considered as the ELA. To examine the snowline, we need to know the altitudinal distribution
of snowmelt and accumulation during the mass balance year in order to run the model.
The relation between the mass balance and the accumulation area ratio can be expressed as:
Bn = a * AAR + b (10)
AAR = Accumulation Area / Total glacier Area (11)
Where ‘a’ and ‘b’ are constants, and Bn is the net mass balance of a glacier at a regional scale expressed in water
equivalent.
The accumulation area and the total glacier area required in the proposed modeling framework for glacier
mass balance computation are determined from the satellite imageries. The snowline can be also mapped using
satellite imageries. For mapping the glacier zone and its morphological computation at various times, the image
processing is carried out with multi-dates multispectral satellite images using a spatial model for the NDSI (Nor-
malized Difference Snow Index) computation. The ERDAS Imagine and ArcGIS software were used for image
processing, morphological computation and spatial mapping. The remote sensing data utilized in the present
study includes LANDSAT and MODIS satellite images. For Landsat 5 and 7 ETM + satellite images, the NDSI is
computed using reflectance data for band 2 and band 5. Mathematically, it can be expressed as:
Band2 − Band5
NDSI = (12)
Band2 + Band5
For Landsat 8 (OLS and TIRS) satellite images, the NDSI is computed using reflectance data for band 3 and
band 6:
Band3 − Band6
NDSI = (13)
Band3 + Band6
The spectral and spatial resolutions of satellite images of various bands used in the NDSI computation are
given in Table 1. The spatial model used for the computation of NDSI using satellite images is shown in Fig. 1.
For the MODIS satellite images, the present study utilizes MOD10A2 data products of MODIS and is referred
as the MODIS/Terra Snow Cover 8-Day L3 Global 500 m Grid (MOD10A2) data sets. It contains data fields for
the maximum snow cover extent over an eight-day compositing period and a chronology of snow occurrence
observations in compressed Hierarchical Data Format (HDF). MOD10A2 data products consist of 1,200 km by
1,200 km tiles of 500 m resolution data gridded in a sinusoidal map projection. The snow cover data is based on
Scientific Reports | (2020) 10:12211 | https://doi.org/10.1038/s41598-020-69203-8 4
Vol:.(1234567890)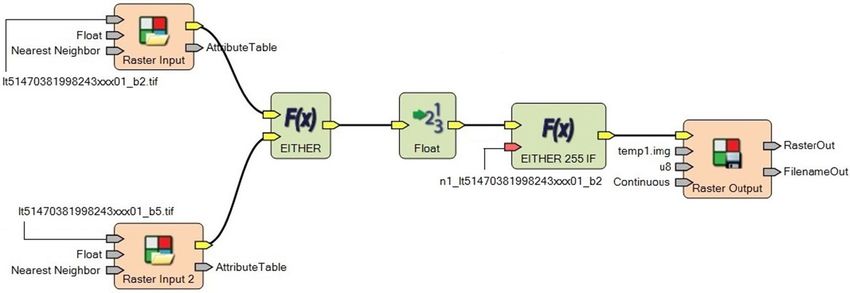
www.nature.com/scientificreports/
Bands Wavelength (micrometers) Resolution (meters)
Landsat 5 ThematicMapper (TM) & Landsat 7 Thematic Mapper Plus (ETM +)
Band 2–Green 0.52–0.60 30
Band 5–Shortwave Infrared (SWIR) 1 1.55–1.75 30
Landsat 8 Operational Land Imager (OLI) & Thermal Infrared Sensor (TIRS)
Band 3–Green 0.533–0.590 30
Band 6–Shortwave Infrared (SWIR) 1 1.566–1.651 30
Table 1. Spectral and spatial resolutions of Landsat images used in NDSI computation.
Figure 1. Spatial model for NDSI computation using multispectral satellite images.
a snow mapping algorithm that employs NDSI to identify the snow covered and no-snow lands. The NDSI is
calculated using bands 4 and 6 reflectance data of MODIS.
The accumulation area varies from year to year depending up on the position of the equilibrium line altitude.
The altitude of the snowline at the end of the ablation period is taken as the equilibrium line altitude. The ablation
period depends upon the climatic season of the study area. In the present study, the month of September (10th
September) has been taken as the end of the ablation period for the study area under consideration. Thus, the
snow lines have been demarcated and the accumulation areas have been delineated on the satellite images for
the years from 1998 to 2016. After delineating the accumulation areas, the spread of the accumulation area has
been mapped and the area computation has been performed using GIS for each of the year during the period
1998–2016. The altitudes of snowlines have been estimated using the hypsography derived from Digital Elevation
Model (DEM) generated from Cartosat-1 satellite data40 and multi-temporal satellite imageries. Cartosat-1 is
an Indian remote sensing satellite and the generated DEM is having 30 m resolution. The modeling framework
presented in this study also facilitates customization of the estimation of mass balance from other methods,
namely, geodetic and statistical based on AAR in an open source image processing tool. The volumetric glacier
mass balance can be computed using the following expression:
Volumetric change (�V) = Mass Balance (MB) ∗ Glacier area (A) (14)
41–43
The formation of calculating mass balance has been regressed and is based on the published data . The
glacier mass balance can be estimated by using in-situ field measurements, hydrological balance, statistical
technique, or a combination of these methods. The glaciological and geodetic methods are based on in-situ
measurements. The glaciological method measures accumulation and ablation in situ by using stakes and pits
at representative points on the glacier surface over the entire glacier during a balance year, whereas the geodetic
method creates digital elevation models of glacier at different times and computes mass balance by determining
changes in the glacier thickness. The hydrological method uses a water balance equation to compute glacier mass
balance using snow and meteorological measurements and discharge data. Since these methods require exten-
sive frequent field monitoring, measurements, survey, and/or extensive network of automatic weather stations
and well established gauging sites, the use of these methods was not preferred for the study of mass balance of
Parvati glacier located in the western Himalaya as the Parvati river basin is poorly monitored and gauged, and
very limited literature is available about this river basin, particularly Parvati glacier. The statistical technique
attempts to establish relationship between in-situ equilibrium line altitude or accumulation area ratio and spe-
cific mass balance34,39,41,44–46. The present study utilizes an integrated approach combining in-situ measurements,
statistical technique and remote sensing technique. Since the mass balance depends upon the accumulation and
ablation over a period of time, the hypothesis of having a constitutive relationship between the mass balance
and the accumulation area ratio on the annual basis has been conceptualized. The regression analysis has been
performed between the data sets of the accumulation area ratio and the in-situ measured mass balance published
by various researchers41–43 for the adjoining river basin, namely Chandra basin, which falls in the same western
Scientific Reports | (2020) 10:12211 | https://doi.org/10.1038/s41598-020-69203-8 5
Vol.:(0123456789)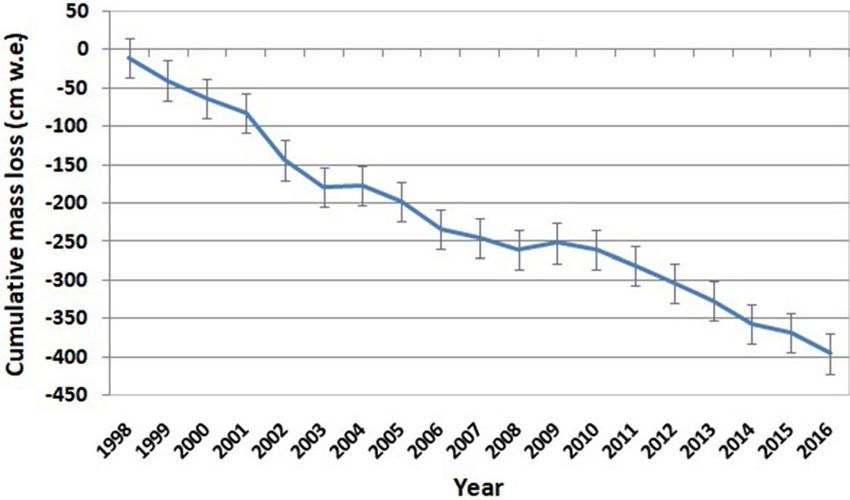
www.nature.com/scientificreports/
Himalayan region and is climatologically and hydrologically similar to the Parvati basin. The Parvati river basin
extends between 31° 45ʹ N to 32° 15ʹ N latitude and 77° 5ʹ E to 77° 50ʹ E longitude, whereas the Chandra basin
extends between 32° 5ʹ N to 32° 50ʹ N latitude and 76° 50ʹ E to 77° 50ʹ E longitude.
Further, null hypothesis testing was performed for the regression analysis to investigate the significance of
formulated relation between the specific mass balance and the accumulation area ratio in order to ensure the
reliability of obtained results for the Parvati glacier. The Microsoft Office Excel was used to perform the linear
regression and to compute constants ‘a’ and ‘b’ used in the regression equation. The null hypothesis testing was
also performed using the same software through t-test. To further ensure the significance of model formulation
and reliability of numerical results, computational runs were also taken using R software as a formal check to
support the statistical outcomes for the formulated relation using linear regression.
Study area. Parvati glacier lies in the western Himalaya and is located in the Kullu district of Himachal
Pradesh, a State of northern India. It is spread over a very large area within the Parvati river basin characterized
by several mountain ranges and gorges. Parvati river is one of the major tributaries of the Beas river which runs
through several districts of Himachal Pradesh and enters to the adjoining State of Punjab. Parvati river joins the
Beas river at Bhuntar which is about 10 km away from the Kullu district center in the south direction. It emerges
from the Mantalai glacier in the northerly direction and flows in the northwest direction up to Manikaran, a pil-
grimage centre for Hindus and Sikhs. The river takes turn from this township and starts flowing in the southwest
direction and gradually changes its course in the south direction to join the Beas river at Bhuntar. The river valley
connects the adjoining district of Lahaul and Spiti through Sara Umga Pass, Pin Parvati Pass and Debsa Pass,
which has a number of other glaciers. A number of geothermal springs and waterfalls are found on the banks of
the Parvati river. It has a large potential of hydroelectric projects of varying sizes.
A number of tributaries join the Parvati river in which Basuki Nal and Dibibokri Nal are the two important
tributaries. The Basuki Nal river joins the Parvati river near Tunda Bhuj at an altitude of 3,285 m, whereas the
Dibibokri Nal river joins the Parvati river at Thakur Kuan having an elevation of 3,560 m from the mean sea
level. The Dibibokri glacier and the Dibibokri Pyramid mountain peak having an altitude of 6,400 m are in the
upwards towards the northeast. The Mantalai lake is located near Pandupul at an elevation of 4,100 m above the
mean sea level and is a source of water for the Parvati river. Pandupul is further up from the Thakur Kuan and
is characterized by the natural rock bridges crossing the river valley. The Mantalai glacier is located beyond it
and has an elevation of 5,200 m from the mean sea level. The river basin is characterized by high mountainous
ranges, steep gorges, rocky outcrops, coniferous forest and alpine flowers.
This river is fed by nearly 299 glaciers covering a total area of 425.318 k m2. The snow starts melting and turns
into snowmelt runoff as we go down from the glaciated region. The average minimum temperature of the region
is − 2 °C, however it goes to − 10 °C due to wind factor. From the Mantalai lake, it is possible to see the head of
the Parvati river. It has huge snowfield, flanked on both sides by various mountain peaks ranging 5,000–6,000 m.
Sampling and analysis. The boundary of the Parvati river basin, in which the Parvati glacier lies, was
delineated from the topographic map of 1:50,000 scale, which was prepared by the Survey of India in 1962. The
geo-referenced catchment boundary was superimposed on the geo-referenced satellite images of 1998–2016
containing Parvati region obtained using Landsat and MODIS satellite images d atasets47,48. The present study
utilized data sets of imageries of these two different remote sensing satellites; satellite images for the period
1998 to 2002 and 2008–2011 from Landsat 5 & 7, and for the period 2013 to 2016 from Landsat 8, and for the
period 2003 to 2007 and 2012 from MODIS images48. The Landsat series satellite images were obtained from the
Earthdata search website of NASA (https://search.earthdata.nasa.gov/) and the MODIS images from the NSIDC
website (https://nsidc.org/data/MOD10A2/versions/6), available free for downloads. The satellite images con-
sidered for the analysis were of September month because the snow cover is found to be the minimum in this
month, and thus the glaciers would be clearly visible as the soil and terrain outcrops in the region would be
fully exposed during this month. The delineation of the glacial boundary in the Parvati river basin was carried
out using the standard band combination of 2, 3 and 4, whereas the debris cover on the glacier was estimated
using band combination of 2, 4 and 5. The wavelength ranges of spectral bands 2, 3, 4 and 5 are 0.52–0.59 μm,
0.62–0.68 μm, 0.77–0.86 μm, and 1.55–1.75 μm, respectively. The reflectance for the debris is much more than
that of ice in band 5, which helps in identifying the pixels of debris cover on the satellite image, because the pixels
of debris cover appear as red tone on the glacier region when color composite map is generated with said com-
bination of spectral bands. The changes in the glacial parameters were analyzed using a Geographic Information
System (GIS), which is a powerful tool for storing, retrieving, analyzing and visualizing spatial and non-spatial
multidimensional data.
The procedure to obtain the glacier boundary and the glacier accumulation area from satellite images involves
a series of steps involving image interpretation, image processing, digitization, and map analysis techniques.
A false color composite (FCC) map is made using reflectance values of spectral bands of 2, 3 and 4 of Landsat
images. The image interpretation keys, namely, tone, texture, pattern, shape, size, site, shadow, and association are
used to distinguish various features from the FCC of satellite image. The image processing was carried out using
ERDAS Imagine software. The pixel wise reflectance data of spectral bands of 2, 3 and 4 of Landsat images were
assigned, respectively, to Blue, Green and Red colors to make the FCC. This is the common method practiced
worldwide for making the standard combination of spectral bands to generate FCC maps from remote sensing
satellite images. The glacier area becomes clearly visible on the satellite image having distinct tonal values from
the non-glacier areas. The glacier areas appear as sky blue or aqua color in FCC. Based on this tonal difference,
the boundaries are delineated and digitized online to obtain the boundary of glacier extent. Sometimes, debris
may be appearing on the glacier surface depending upon the climatic and terrain characteristics. The band 5
Scientific Reports | (2020) 10:12211 | https://doi.org/10.1038/s41598-020-69203-8 6
Vol:.(1234567890)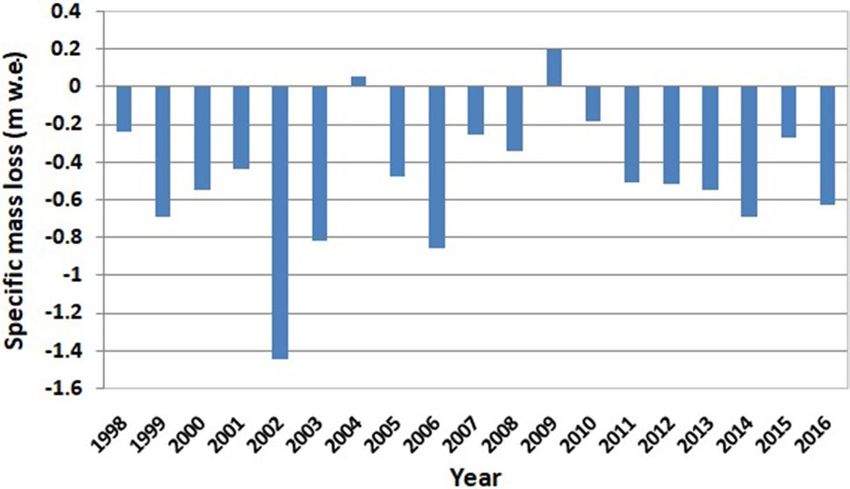
www.nature.com/scientificreports/
reflectance for rock or debris cover is substantially higher than that of ice. The wavelength of band 5 falls in the
Shortwave Infra Red (SWIR) zone of electromagnetic spectrum. Thus, the debris cover appears as red tone when
a color composite map is generated using band combination of 2, 4 and 5, which is very helpful in delineating
the debris cover areas. The accumulation and the ablation depend upon the climatic season of the study area.
The accumulation takes place during the winter season, December to March; whereas the ablation takes place
during the summer period, March to July. However, the melting may continue till the end of the monsoon
period, July–September. Thus, September is considered as the end of the ablation period as the snow cover is the
minimum and the glacier is fully exposed. Similarly, the accumulation area can be interpreted from the satellite
images of February month end or March beginning when the snow cover is the maximum and the accumulation
zones of glacier would be clearly visible. The accumulation area is the area of the glacier above the equilibrium
line. The snow lines are demarcated and the altitudes of snowlines are calculated using the hypsography derived
from 30 m resolution digital elevation model. The accumulation area is obtained by calculating the glacier areas
above the equilibrium line from the altitudinal variation of satellite derived glacier and snow cover areas.
Identifying the glacier boundary by making use of standard combination of bands 2, 3 and 4 is based on the
FCC where a composite map is generated based on the spectral reflectance values. FCC is generally used for
identifying the different features present in a raster image. The NDSI is different from the FCC, as the NDSI is
obtained by image processing following a raster based mathematical calculation from the spectral reflectance
values of bands 2 and 5 for Landsat 5 and 7 imageries, bands 3 and 6 for Landsat 8 imageries, and bands 4 and 6
for MODIS imageries. The NDSI method uses band addition, band subtraction and band ratio techniques for the
computation of NDSI values from the spectral reflectance data of the specified bands. It identifies the snow-ice
pixels in the raster image of the basin and is used for the snow and glacier mapping.
The snow and glacier boundaries are distinguished based on the tonal values that represent the relative differ-
ences in the spectral reflectances. The snow having relatively lesser density and more wetness show relatively less
reflectance as compared to the glacier in the green band of optical region. This relative difference is also observed
in NDSI. The pixels of glacier area show the highest DN values (255) in raster maps. The satellite data utilized in
the present study were selected for those days that were having cloud free data. However, there are algorithms
available in l iterature49–51 to distinguish snow or ice and cloud, and for the cloud removal and rectification of the
satellite data due to cloud effect. These algorithms are based on the differences between reflectance values of cloud
and snow or ice and their emittance characteristics. The clouds are highly variable and show high reflectance
in the visible and Near Infra Red (NIR) region, whereas the snow or ice shows low reflectance in the Shortwave
Infrared (SWIR) region of the electromagnetic spectrum.
As described above, data sets from two different satellites were collected and analyzed. These satellites data
are of different spatial resolution. In the present study, MODIS data was used for the years 2002–2007 because
the snow cover area was missing in the Landsat data for these years. Therefore, this data was merged to improve
the interpretation capability. This technique was found very suitable for the glaciated region. In order to verify
the results of the present study, glaciers delineated in the satellite images are compared with its relative positions
and geomorphological features reported by past studies published in various literature including the collection
of imageries and widespread of the world’s glaciers captured in aerial photography and m aps52–55. Inventory data
of several glaciers worldwide have been compiled and documented by UNESCO and World Glacier Monitoring
Service37,52. The glacier inventory data for Indian Himalayan glaciers is documented by Geological Survey of
India56. A number of literature52–55 are available that deal with the instructions and guidelines for the compila-
tion and assemblage of data for glacier inventory. In the present study, the glaciers delineated in the satellite
imageries are verified by its relative position and geomorphological features that include coordinates, orientation,
maximum length and mean width. Further, since the spatial resolutions of MODIS and Landsat images are dif-
ferent, mapping of snow and glacier cover was carried out with both types of satellite images for the period for
which both satellite images were available, and comparative analysis was carried out to ensure the consistency
of calculation results. It was found that the average error associated with the MODIS images for the calculation
of snow and glacier covered areas due to difference in spatial resolution is 2%, which is within the acceptable
accuracy as reported in l iterature57,58.
Results and discussion
The proposed modeling framework was applied to the Parvati glacier for investigating the mass loss during the
period of 19 years from 1998 to 2016. The sensor and band characteristics of remote sensing data utilized in the
present study are given in Table 2. Figure 2 shows the spatial distribution of the accumulation area as obtained
on 8th September 2019 for a part of the Parvati glacier. The first image on the left top corner shows the delineation
of the glacial extent from the FCC (False Color Composite) image of the area, whereas the second image on the
right top corner shows the glacial extent as delineated from the NDSI image. The satellite image processing was
also carried out using band ratio technique to delineate the glacial extent as shown in the left bottom corner of
this figure. The band ratio of satellite images was carried out pixel by pixel as a raster model using the reflectance
values of NIR and SWIR bands. The accumulation area as shown in the right bottom corner image was finally
obtained based on these delineated glacial extents derived from satellite images using the FCC, NDSI and band
ratio techniques. The first technique involves making a False Color Composite (FCC) from multispectral satellite
imageries and identifying the snow-ice pixels that help in demarcating the extent of the glacier and delineating
its boundary by online digitization. The NDSI technique involves automatic identification of snow-ice pixels
by image processing following a specified mathematical formula for different satellite imageries. The band ratio
technique is another image processing technique that involves ratio of two spectral bands. The calculation is
carried out pixel by pixel by computing the ratio of reflectances of two specified spectral bands (NIR and SWIR
in the present study), and the glacier extent is determined by the spread of pixels of ice and snow through image
Scientific Reports | (2020) 10:12211 | https://doi.org/10.1038/s41598-020-69203-8 7
Vol.:(0123456789)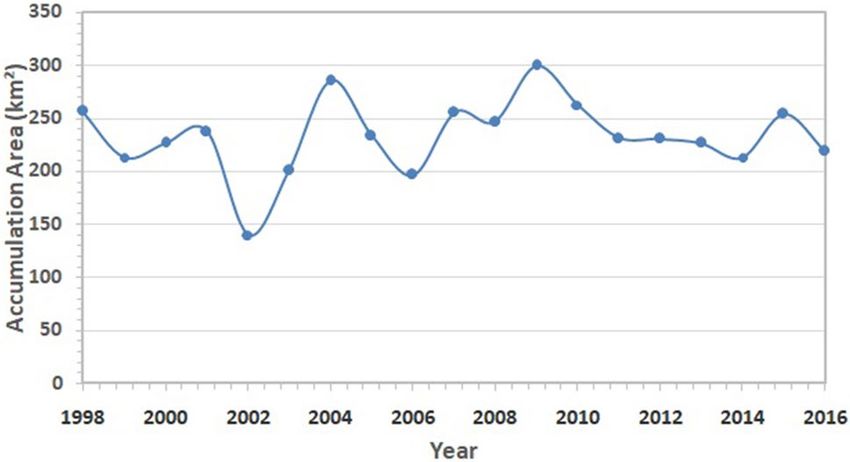
www.nature.com/scientificreports/
Specification Data Set 1 Data Set 2 Data Set 3 Data Set 4
Platform Landsat 5 and 7 Landsat 5 and 7 Landsat 8 MODIS
MODIS/Terra Snow Cover Daily
Pushbroom,
L3 Global
Landsat TM and ETM + (bands 3, Landsat TM and ETM + (bands 2, The Operational Land Imager
Sensors and bands 250 m (bands 1–2)
4 and 5) 3 and 5) (OLI) and Thermal Infrared Sen-
500 m (bands 3–7)
sor (TIRS) (both OLI and TIRS)
1,000 m (bands 8–36)
30 m (visible, NIR, SWIR); 100 m 500 m
Ground resolution 30 m 30 m, 15 m (thermal); and 15 m (panchro- 8 Days
matic) MOD10A2 data set
Precision 15 m (horizontal) 15 m, 7.5 m 15 m, panchromatic 500 m × 500 m
146 and 37
146 and 38
147 and 36
147 and 37
Scenes (path and Row) 147 and 38 147 and 38 147 and 38
147 and 38
148 and 36
148 and 37
148 and 38
1998,2001,2008,2010 2013,2014,2015,
Scenes Year 1999, 2000, 2002, 2009 2003,2004,2005,2006, 2007,2012
2011 2016
ETM_L1TP, ETM(Landsat_7), ETM_L1TP, ETM(Landsat_7),
Data Type Level-1, Sensor Identi- OLI_TIRS_L1TP, OLI_TIRS
TM_L1TP, TM_L1TP, MODIS Sinusoidal ,
fier, UTM Zone, Map Projection (Landsat_8),
TM(Landsat_5) TM(Landsat_5) 43, UTM,WGS43,
Level-1, Datum 43, UTM, WGS43
43, UTM, WGS43 43, UTM, WGS43
Table 2. Specifications of remote sensing data utilized in the mass balance study.
Figure 2. FCC, NDSI, band ratio and accumulation area obtained from satellite images for a part of Parvati
glacier by using ERDAS IMAGINE 14.0 (https://www.hexagongeospatial.com/) and ArcGIS 9.3 software (https
://www.esri.com/).
interpretation as discussed earlier. The FCC technique performs well in delineating the boundary. However, the
NDSI technique performs best in delineating the glacier spread and its areal extent. This analysis was carried
out for all sized glaciers in the Parvati river basin.
Figure 3 shows the spatial distribution of Parvati glacier superimposed on the FCC of the Parvati basin,
which was obtained from the multispectral satellite images using the procedure as described earlier. The NDSI
Scientific Reports | (2020) 10:12211 | https://doi.org/10.1038/s41598-020-69203-8 8
Vol:.(1234567890)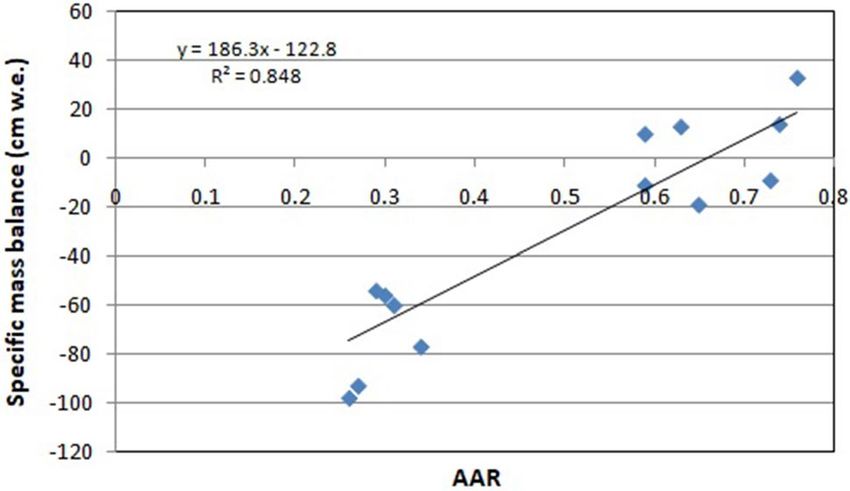
www.nature.com/scientificreports/
Figure 3. Spatial distribution of Parvati glacier superimposed on the FCC image of Parvati river basin obtained
by using ERDAS IMAGINE 14.0 (https://www.hexagongeospatial.com/) and ArcGIS 9.3 software (https://www.
esri.com/).
image for the whole Parvati basin is shown in Fig. 4. It is evident from Figs. 3, 4 that the snow covered areas and
the number of glaciers are more in the northern side of the river as compared to the snow covered areas and the
number of glaciers in the southern side of river. The spatial distribution of accumulation area of the glacier in
the Parvati river basin is shown in Fig. 5. It is evident from this figure that a significant area, almost more than
50% is the accumulation area. Figure 6 shows the annual variation of accumulation area of Parvati glacier as
derived from the multispectral satellite images. It is evident from this figure that the accumulation area varies
in between 140 and 300 k m2, having the minimum value in the year 2002 and the maximum value in the year
2009. It also shows that the average accumulation area as obtained from the 19 years of multispectral satellite
images during the period 1998 to 2016 comes out to be 232.86 k m2. The accumulation area in the Parvati glacier
has been always more than 200 k m2 except the years 2002 and 2006. The annual variation of AAR is shown in
Fig. 7. The value of AAR varies between 0.33 and 0.70. It is evident from this figure that the Parvati glacier is
not in equilibrium, it is very dynamic and its behavioural response changes year to year. The value of AAR has
remained in between 0.5 and 0.6 for most of the years during 1998–2016. This value has become more than 0.6
in years 2004 and 2009, indicating events of positive mass balance, and therefore, increase in the glacier mass in
these years. The value of AAR decreases to less than 0.50 in years 2002, 2003 and 2006, indicating high glacier
mass loss in these years. However, the average value of AAR for the period 1998–2016 comes out to be 0.55 (less
than 0.6), which indicates a negative mass loss for the Parvati glacier. This finding is supported by the results
obtained for the temperate alpine g laciers3,59.
Annual variation of mass loss. The mass balance of the Parvati glacier was carried out using the devel-
oped satellite imagery based model for the period 1998 to 2016. For computing the mass balance of the Parvati
glacier in the present study, the values of constants ‘a’ and ‘b’ in the mathematical model were taken to be equal to
186.3 and − 122.8, respectively. This is based on the regression relationship established between the annual spe-
cific mass balance (cm water equivalent) and the accumulation area ratio for the glaciers in the adjoining basin,
namely, the Chandra basin with a high correlation coefficient ( r2 = 0.85) as the mass balance measurements of
the Parvati glacier are not available. The values of these constants are derived based on the field measurements
for the periods of 1987–89 and 2003–1241–43. Figure 8 shows the formulated relationship between the annual
specific mass balance and the accumulation area ratio as obtained from the linear regression. It is evident from
this figure that the data points are close to the trendline which has a high value of the coefficient of determination
(R2) expressed as the square of the correlation coefficient (r).
The null hypothesis testing as described in the modeling framework was carried out for the regression analysis
to investigate the significance of model formulation involving formulated relation between the specific mass bal-
ance and the accumulation area ratio and to ensure the reliability of obtained results for the Parvati glacier. The
significance level is 5% (0.05). The computed p-value is 0.011, which is less than 0.05. Since the p-value is strictly
less than the significance value, data used is highly significant. Thus, it shows that the data is highly significant and
Scientific Reports | (2020) 10:12211 | https://doi.org/10.1038/s41598-020-69203-8 9
Vol.:(0123456789)www.nature.com/scientificreports/
Figure 4. NDSI image derived from multispectral satellite images for Parvati river basin obtained by using
ERDAS IMAGINE 14.0 (https://www.hexagongeospatial.com/) and ArcGIS 9.3 software (https://www.esri.
com/).
Figure 5. Spatial distribution of accumulation area of glacier in Parvati river basin.
Scientific Reports | (2020) 10:12211 | https://doi.org/10.1038/s41598-020-69203-8 10
Vol:.(1234567890)www.nature.com/scientificreports/
Figure 6. Annual variation of accumulation area of Parvati glacier.
Figure 7. Annual variation of AAR of Parvati glacier.
Figure 8. Formulated relationship between specific mass balance and accumulation area ratio as obtained from
the linear regression using in situ field measurements and having p-value of 0.011 at 5% significance level.
there is strong evidence in favour of the formulated relationship in the developed model. Further, the computed
p-values using the Microsoft Office Excel and the R software are 0.011221 and 0.011220, respectively, for the
same data configuration and statistical hypothesis. It clearly demonstrates that the results obtained from both
the software are in agreement. Thus, the statistical outcomes support the significance of the model formulation
and ensure the reliability of obtained numerical results and findings in the present study.
In the present study, the mass balance of the Parvati glacier has been computed for a period of 19 years
between 1998 and 2016, where systematic remote sensing data is available. The annual variation of cumulative
mass loss is shown in Fig. 9. It is evident from this figure that there is an alarming retreat of Parvati glacier with
time. Figure 10 shows the annual variation of the specific mass loss of the Parvati glacier. The mean specific
mass loss for the Parvati glacier during the period from 1998 to 2016 is found to be equal to − 0.49 ± 0.11 m w.e.
It is evident from this figure that there has been significant mass loss of the Parvati glacier in all the years of the
study period except the years 2004 and 2009. In the year 2009, Parvati glacier has showed a gain in the mass by
Scientific Reports | (2020) 10:12211 | https://doi.org/10.1038/s41598-020-69203-8 11
Vol.:(0123456789)www.nature.com/scientificreports/
Figure 9. Annual variation of cumulative mass loss of Parvati glacier during 1998–2016.
Figure 10. Annual variation of specific mass loss of Parvati glacier during 1998–2016.
8.26 cm w.e. A small gain in the glacier mass by 2.20 cm w.e. is also observed during the year 2004. The annual
glacier mass loss along with error estimates for the period 1998–2016 is shown in Table 3.
It is evident from these figures that the rate of mass loss is high and alarming. The cumulative mass loss is
having almost rapid linear decline rate. The total mass loss from the Parvati glacier during the period 1998–2016
comes out to be equal to 3.95 Gt. The negative mass balance denoting glacier mass loss can be attributed to less
snowfall and increased temperature because of global or regional warming and precipitation deficiency in the
basin as a result of climate change. It is also observed that the most of the glacier extent is located in the low
altitude zone, lower than 5,200 m altitude, and thus it is more exposed to climatic variations. The snowstorm
and snowslide may be some other reasons for the mass loss from the g lacier60. Therefore, it can be inferred that
the mass loss in the Parvati glacier is the clear indication of atmospheric conditions including the advance or
retreat of the glacial region, which might have resulted due to various climate change aspects61,62. This finding
is supported by the earlier studies3,63, although the first study is based on the limited four satellite datasets up to
the year 2001 and the second study has been conducted for a different basin, but is located nearby in the similar
climatic zone and same Himalayan range. The analysis of temperature records during the period of 1998–2016
shows that May to September are the months of high temperature and the temperature varies in between 34 to
21 °C, the higher temperature value being in May month. It shows that the melting of glaciers starts in May and
the highest mass loss is expected by the end of the September. This observation is also reflected and corroborated
in the results obtained for the mass loss of the Parvati glacier as estimated from the satellite imageries. The vary-
ing climatic conditions lead to glacier melt which significantly affect the availability of flow in the river. Because
of this reason, summer flow increases in some of the river systems for several years and the flow reduces as the
glaciers disappear64.
A comparison is also made for the results of the specific mass balance obtained for the Parvati glacier with
that available in literature for the nearby glaciers falling in the same climatic zone of the western Himalaya and
within the same northern State of Himachal Pradesh to verify the consistency and reliability of results obtained
in the present study. Results obtained in the present study have been verified for the mass balance by comparing
the computed mass balance of Parvati glacier with the measured mass balances of Chhota Shigri, Bara Shigri and
Hamtah glaciers located in the Chandra basin which have been published in various l iterature65–67. This compari-
son has been shown in Table 4. The values of the specific mass balances reported in this table are based on the
geodetic method except for the Parvati glacier wherein it has been obtained using the remote sensing method as
discussed in this study. Table 4 shows that the computed mean specific mass balance for the Parvati glacier is in
good agreement and consistent with the published values of mass balances obtained using the geodetic method
Scientific Reports | (2020) 10:12211 | https://doi.org/10.1038/s41598-020-69203-8 12
Vol:.(1234567890)www.nature.com/scientificreports/
Total mass loss at regional Error in total mass loss (cm Mean specific mass loss (m Error in mean specific mass
Year scale (cm w.e.) w.e.) w.e.) loss (m w.e.)
1998 − 10.33308889 1.124669111 − 0.24294972 0.112466911
1999 − 29.60444538 0.931955546 − 0.696054373 0.093195555
2000 − 23.6503689 0.991496311 − 0.556063202 0.099149631
2001 − 18.85574511 1.039442549 − 0.443332874 0.103944255
2002 − 61.51633296 0.61283667 − 1.44636091 0.061283667
2003 − 34.987337 0.87812663 − 0.822615949 0.087812663
2004 2.195745771 1.249957458 0.051625978 0.124995746
2005 − 20.574994 1.02225006 − 0.483755543 0.102225006
2006 − 36.82529072 0.859747093 − 0.865829585 0.085974709
2007 − 11.06415294 1.117358471 − 0.260138366 0.111735847
2008 − 14.83554987 1.079644501 − 0.348810769 0.10796445
2009 8.257138423 1.310571384 0.194140347 0.131057138
2010 − 7.914751786 1.148852482 − 0.186090215 0.114885248
2011 − 21.67049502 1.01129505 − 0.509512765 0.101129505
2012 − 22.01040257 1.007895974 − 0.51750461 0.100789597
2013 − 23.58729327 0.992127067 − 0.554580179 0.099212707
2014 − 29.60619748 0.931938025 − 0.696095568 0.093193803
2015 − 11.59153527 1.112084647 − 0.272538084 0.111208465
2016 − 27.02885723 0.957711428 − 0.63549761 0.095771143
Table 3. Annual mass loss with error estimates derived from satellite images for Parvati glacier for the period
1998–2016.
Annual specific mass
Sr. no Glacier Basin balance (m w.e.) Method Time period Author
1 Chhota Shigri Chandra − 0.39 Glaciological 1987–1989 Dobhal et al. (1995)65
Gardelle et al.(2013)66
2 Chhota Shigri Chandra − 0.39 Geodetic 1999–2011
Vincent et al. (2013)67
3 Bara Shigri Chandra − 0.48 Geodetic 1999–2011 Gardelle et al.(2013)66
4 Hamtah Chandra − 0.45 Geodetic 1999–2011 Vincent et al. (2013)67
5 Region-wide Lahaul & Spiti region − 0.44 Geodetic 1999–2011 Vincent et al. (2013)67
6 Parvati Parvati − 0.49 Remote Sensing 1998–2016 Present study
Table 4. Comparison of specific mass balance of glaciers in Himachal Pradesh.
for the adjoining glaciers on individual basis as well as on the region-wide. The study reveals that there is good
consistency in the mean annual specific mass balances, inter-annual mass changes and inter-annual variability at
the regional scale between the glaciers related to homogeneous meteorological conditions during the period 1998
to 2016. Since the Parvati river basin has large number of glaciers (299) of varying sizes, it can be decomposed
into homogeneous glaciers following the concept and findings described in l iterature12,13 and to obtain a statisti-
cally optimum design of in-situ measurements for mass balance. However, a dedicated field monitoring plan may
be required for the measurements of mass balance and snow and meteorological parameters to arrive at the right
configuration of decomposition. The findings obtained in this study are consistent with the annual glacier mass
changes quantified from observed years at the scale of the Himalayan region and in other regions of the world.
Conclusions
The modeling framework developed in this study provides an efficient tool for improved understanding of glacier
geomorphology, accumulation and ablation processes and to compute glacier mass balance using multispectral
satellite images to understand the hydrodynamics of glaciers and its interaction with hydrology, climatology and
environment in the region. It utilizes an integrated approach combining remote sensing, in-situ measurements
and statistical technique. The image processing techniques utilized in the study include image interpretation,
false color composite, band ratio, and NDSI. The formulated relationship between the mass balance and the
accumulation area ratio has a significance of 5% and the null hypothesis testing was performed through t-test to
investigate the significance and reliability of results. The developed methodology has been applied to the Parvati
glacier in the western Himalaya. The analysis of 19 years of multispectral satellite images of the period from
1998 to 2016 reveals that the snow covered areas and the number of glaciers are more in the northern side of the
Parvati river as compared to that in the southern side of river. A significant area of the Parvati glacier, almost
more than 50%, is the accumulation area. The accumulation area varies in between 140 and 300 k m2 with an
Scientific Reports | (2020) 10:12211 | https://doi.org/10.1038/s41598-020-69203-8 13
Vol.:(0123456789)You can also read