Using tri-axial accelerometers to identify wild polar bear behaviors - San Diego Zoo
←
→
Page content transcription
If your browser does not render page correctly, please read the page content below
Vol. 32: 19–33, 2017                 ENDANGERED SPECIES RESEARCH
                                                                                                  Published January 12
    doi: 10.3354/esr00779                     Endang Species Res

                                                                                                   OPEN
                                                                                                   ACCESS

      Using tri-axial accelerometers to identify wild
                   polar bear behaviors
   A. M. Pagano1, 2,*, K. D. Rode1, A. Cutting3, M. A. Owen4, S. Jensen5, J. V. Ware6,
     C. T. Robbins7, G. M. Durner1, T. C. Atwood1, M. E. Obbard8, K. R. Middel8,
                            G. W. Thiemann9, T. M. Williams2
               1
               US Geological Survey, Alaska Science Center, 4210 University Dr., Anchorage, AK 99508, USA
           2
            Department of Ecology & Evolutionary Biology, University of California, Santa Cruz, CA 95060, USA
                                           3
                                            Oregon Zoo, Portland, OR 97221, USA
                  4
                   Institute for Conservation Research, San Diego Zoo Global, San Diego, CA 92027, USA
                                          5
                                           Alaska Zoo, Anchorage, AK 99507, USA
      6
       Department of Integrative Physiology and Neuroscience, Washington State University, Pullman, WA 99164, USA
   7
    School of the Environment and School of Biological Sciences, Washington State University, Pullman, WA 99164, USA
     8
      Wildlife Research and Monitoring Section, Ontario Ministry of Natural Resources and Forestry, Trent University,
                                             Peterborough, ON K9L 0G2, Canada
                     9
                      Faculty of Environmental Studies, York University, Toronto, ON M3J1P3, Canada

      ABSTRACT: Tri-axial accelerometers have been used to remotely identify the behaviors of a wide
      range of taxa. Assigning behaviors to accelerometer data often involves the use of captive animals
      or surrogate species, as their accelerometer signatures are generally assumed to be similar to
      those of their wild counterparts. However, this has rarely been tested. Validated accelerometer
      data are needed for polar bears Ursus maritimus to understand how habitat conditions may in-
      fluence behavior and energy demands. We used accelerometer and water conductivity data to
      remotely distinguish 10 polar bear behaviors. We calibrated accelerometer and conductivity data
      collected from collars with behaviors observed from video-recorded captive polar bears and
      brown bears U. arctos, and with video from camera collars deployed on free-ranging polar bears
      on sea ice and on land. We used random forest models to predict behaviors and found strong
      ability to discriminate the most common wild polar bear behaviors using a combination of
      accelerometer and conductivity sensor data from captive or wild polar bears. In contrast, models
      using data from captive brown bears failed to reliably distinguish most active behaviors in wild
      polar bears. Our ability to discriminate behavior was greatest when species- and habitat-specific
      data from wild individuals were used to train models. Data from captive individuals may be
      suitable for calibrating accelerometers, but may provide reduced ability to discriminate some
      behaviors. The accelerometer calibrations developed here provide a method to quantify polar
      bear behaviors to evaluate the impacts of declines in Arctic sea ice.

      KEY WORDS: Activity · Behavior · Polar bear · Ursus maritimus · Acceleration · Accelerometer ·
      Brown bear · Ursus arctos

                   INTRODUCTION                               (Sutherland 1998, Caro 1999, Cooke et al. 2014).
                                                              Although visual observation is the most direct
  Knowledge of an animal’s behavior can inform                method to study animal behavior, it is impractical for
species conservation and management by revealing              many species. Innovations in electronic logging and
how individuals respond to environmental conditions           tracking devices have provided new methods to
                                                              © The authors 2017. Open Access under Creative Commons by
*Corresponding author: apagano@usgs.gov                       Attribution Licence. Use, distribution and reproduction are un-
                                                              restricted. Authors and original publication must be credited.
                                                              Publisher: Inter-Research · www.int-res.com
20                                     Endang Species Res 32: 19–33, 2017

study the behavior, movement, physiology, energetic       al. 2008, Hunter et al. 2010, Molnár et al. 2010,
rates, and environmental conditions of wildlife that      Atwood et al. 2016). In order to better predict the
may otherwise be difficult or impossible to monitor       impacts of projected sea ice loss on polar bears, it will
(Ropert-Coudert & Wilson 2005, Cooke 2008, Wilson         be important to understand the behavioral and
et al. 2008, Bograd et al. 2010, Costa et al. 2010,       physiological mechanisms driving current declines
Wilmers et al. 2015).                                     (Vongraven et al. 2012, Atwood et al. 2016). Ac-
  Tri-axial accelerometers, which collect high fre-       celerometers could be used in combination with
quency measures of acceleration in the form of gra-       satellite telemetry to better understand the behav-
vitational and inertial velocity (Brown et al. 2013),     ioral consequences of sea ice loss. This mechanistic
have provided a means to remotely identify animal         information would allow for improved assessment of
behaviors (Yoda et al. 1999, Watanabe et al. 2005).       the relationships between habitat loss, individual
Accelerometers have been particularly useful in           health, and vital rates in polar bear populations.
studying widely dispersed animals or those occurring        In this study, we developed a method to quantify
in remote habitats, such as marine mammals and            wild polar bear behaviors using accelerometers and
birds (Brown et al. 2013). Once calibrated, tri-axial     conductivity sensor data, validated through animal-
accelerometer data from wild animals can be used to       borne video camera data. Additionally, we evaluated
remotely identify behaviors such as resting, walking,     the effectiveness of using accelerometer data from
running, and even feeding events (Yoda et al. 2001,       captive polar and brown bears U. arctos to predict
Shepard et al. 2008, Wilson et al. 2008, Watanabe &       behaviors of wild polar bears. Though it is generally
Takahashi 2013, Williams et al. 2014). Calibration        assumed that accelerometer signatures of captives or
typically involves time-synchronizing behavioral ob-      surrogates are similar to those of their instrumented
servations with their associated accelerometer read-      wild counterparts (Williams et al. 2014, McClune et
ings, which often necessitates the use of captive ani-    al. 2015, Wang et al. 2015, Hammond et al. 2016), this
mals or surrogate species (e.g. Yoda et al. 2001,         has rarely been tested. Captive individuals may
Shepard et al. 2008, Nathan et al. 2012, Campbell et      exhibit different behaviors and/or kinematics than
al. 2013). Alternatively, animal-borne video cameras      wild counterparts (McPhee & Carlstead 2010), which
can be used to directly calibrate accelerometers (e.g.    could potentially influence accelerometer signatures.
Watanabe & Takahashi 2013, Nakamura et al. 2015,          Because polar bears use both sea ice and terrestrial
Volpov et al. 2015), but cameras can be expensive         habitats and because differences in habitat substrate
and can only collect data over limited durations.         or gradient could also affect accelerometer signa-
  Polar bears Ursus maritimus typically occupy re-        tures (Bidder et al. 2012, Shepard et al. 2013,
mote environments, and few quantitative data exist        McClune et al. 2014), we examined data from wild
on their behaviors or activity budgets. Much of what      polar bears in both of these habitats. Lastly, because
is known about polar bear behavior on the sea ice         sampling frequency affects the longevity of accelero-
comes from coastal indigenous resident knowledge          meters during deployment as well as computational
(e.g. Nelson 1966, Kalxdorff 1997, Kochnev et al.         power for analyses, we evaluated the ability of acce-
2003, Voorhees et al. 2014) and direct observational      lerometers to predict wild polar bear behaviors using
research limited to 2 locations over limited time pe-     3 different sampling frequencies (16, 8, and 4 Hz).
riods (Stirling 1974, Stirling & Latour 1978, Hansson
& Thomassen 1983, Stirling et al. 2016). Satellite
telemetry has been used to track polar bears in some                 MATERIALS AND METHODS
subpopulations since the late 1970s (Schweinsburg &
Lee 1982, Taylor 1986) and has helped to identify             Accelerometer recordings on captive bears
important habitats (Ferguson et al. 2000, Mauritzen
et al. 2003, Durner et al. 2009, Wilson et al. 2014).       We deployed collars with archival loggers (TDR10-
However, detailed behavioral data in association          X-340D; Wildlife Computers) on 3 adult female polar
with habitat conditions are lacking. Recent declines      bears Ursus maritimus housed at the Alaska Zoo,
in Arctic sea ice have already caused declines in         Oregon Zoo, and San Diego Zoo, USA, as well as 2
abundance, survival, or body condition of polar bears     adult female brown bears U. arctos housed at the
in some subpopulations (Stirling et al. 1999, Regehr      Bear Research, Education, and Conservation Center
et al. 2007, Rode et al. 2010, 2012, Bromaghin et al.     at Washington State University (WSU; Table 1), USA.
2015, Obbard et al. 2016) and models project increas-     Archival loggers recorded tri-axial acceleration (m
ing negative impacts in the 21st century (Amstrup et      s−2) at 16 Hz (range: ± 20 m s−2), time-of-day, and
Pagano et al.: Accelerometers identify polar bear behaviors                          21

Table 1. Polar bears Ursus maritimus and brown bears U. arctos wearing col-      matched accelerometer recordings to
lars with tri-axial accelerometers that were video recorded (captive bears) or   the behaviors of captive bears while
                 that wore video-equipped collars (wild bears)
                                                                                 they moved freely around enclosures
                                                                                 based on visual examination of time-
 Species        Sex     Age class    Body     Location                           stamped video recordings (Sony cam-
                                    mass (kg)
                                                                                 corder model DCR-TRV280 or OpenEye
 Polar bear   Female      Adult       288     Alaska Zoo                         Digital Video Security Solutions).
 Polar bear   Female      Adult       212     Oregon Zoo
 Polar bear   Female      Adult       237     San Diego Zoo
 Brown bear   Female      Adult       126     Washington State University
 Brown bear   Female      Adult       126     Washington State University
                                                                                     Accelerometer recordings on
 Polar bear   Female      Adult       173     Southern Beaufort Sea                    free-ranging polar bears
 Polar bear   Female      Adult       176     Southern Beaufort Sea
 Polar bear   Female      Adult       199     Southern Beaufort Sea                We deployed GPS-equipped video
 Polar bear   Female      Adult       172     Southern Beaufort Sea
                                                                                 camera collars (Exeye) and archival log-
 Polar bear   Female     Subadult     141     Southern Beaufort Sea
 Polar bear   Male       Subadult     186     Akimiski Island                    gers (TDR10-X-340D; Wildlife Comput-
 Polar bear   Female     Subadult     140     Akimiski Island                    ers) on 4 adult female polar bears and 1
                                                                                 subadult female polar bear captured on
                                                                                 the sea ice of the southern Beaufort Sea
wet/dry conductions (via an on-board conductivity                 in April 2014 and 2015 (hereafter ‘ice bears’) and 2
sensor; Fig. 1). Conductivity data were sampled at                subadult polar bears (1 male and 1 female) captured
1 Hz. Bears at the Oregon and San Diego Zoos were                 on land on Akimiski Island, Nunavut, Canada, in
trained to voluntarily place their heads into crates in           September 2015 (hereafter ‘land bears’; Table 1).
which collars could be applied or removed, and wore               Video collars, including archival loggers and release
collars for 1 to 4 h sessions. Bears at the Alaska Zoo            mechanisms, weighed 1.6 to 2.1 kg (0.8 to 1.5% of
and WSU were anesthetized for collaring, with a                   body mass of bears in this study). We captured polar
combination of tiletamine HCl and zolazepam HCl                   bears by injecting them with immobilizing drugs
(Telazol®; Pfizer Animal Health) and dexmedeto-                   through projectile syringes fired from a helicopter.
midine HCl (Dexdomitor®; Pfizer Animal Health)                    On the sea ice, we anesthetized bears using a combi-
(Teisberg et al. 2014). Following collar placement, the           nation of tiletamine HCl and zolazepam HCl (Tela-
effect of the anesthetic were reversed with atipame-              zol®) with no reversal (Stirling et al. 1989). On land,
zole HCl (Antisedan®; Pfizer Animal Health). We                   we anesthetized bears with a combination of medeto-
used release mechanisms (Lotek Wireless) to remove                midine (Domitor®; Pfizer Animal Health) and tileta-
collars from bears at the Alaska Zoo and WSU. We                  mine HCl and zolazepam HCl (Telazol®) and
                                                                  reversed with atipamezole HCl (Antisedan®) (Cattet
                                                                  et al. 1997). Archival loggers were attached to collars
                                                                  in the same location and orientation as captive
                                                                  deployments (Fig. 1) and similarly recorded tri-axial
                                                                  acceleration at 16 Hz (range: ± 20 m s−2), time-of-day,
                                                                  and wet/dry conductions (via an on-board conductiv-
                                                                  ity sensor). Conductivity data were sampled at 1 Hz.
                                                                  Video cameras were programmed to record at vary-
                                                                  ing frequencies during daylight periods (see
                                                                  Table S1 in the Supplement at www.int-res.com/
                                                                  articles/suppl/n032p019_supp.pdf) and programmed
                                                                  to turn off if the temperature of the collar fell below
                                                                  −17°C to protect video equipment. Collars deployed
                                                                  on ice and land bears were recovered 4 to 23 d fol-
                                                                  lowing deployment, either by recapture of the indi-
                                                                  vidual or by remote activation of the collar release
                                                                  and retrieval of the dropped collar by the field crew.
Fig. 1. Orientation of an archival logger containing a tri-
                                                                  We matched accelerometer data to behavior of ice
axial accelerometer attached to a collar for use on polar         and land bears based on visual examination of the
        Ursus maritimus and brown bears U. arctos                 time-stamped video recordings from the collar.
22 Endang Species Res 32: 19–33, 2017
Behaviors tion (gravitational acceleration) and subtracted the
static acceleration from the raw acceleration data to
Behaviors were annotated based on the video data calculate dynamic acceleration (Wilson et al. 2006,
on a per second basis. For bears that were anesthe- Shepard et al. 2008). We calculated overall dynamic
tized, we excluded behaviors on the day of capture body acceleration (ODBA) as the absolute sum of
and during retrieval of the collar. Resting behaviors dynamic acceleration across the 3 axes (Wilson et al.
included standing, sitting, and lying down. Head 2006). We used a Fast Fourier Transform to calculate
movements while standing, sitting, or lying down the dominant power spectrum (dps) and frequency
were included as resting behaviors, but limb move- (fdps) for each axis (Watanabe et al. 2005, Shamoun-
ments were treated as transitionary behaviors (Knud- Baranes et al. 2012). In total, we derived 25 predictor
sen 1978, Williams 1983). Swimming included variables based on previous accelerometer studies
surface swimming and diving. We excluded from (e.g. Watanabe et al. 2005, Nathan et al. 2012,
analyses any behaviors that were not indicative of Shamoun-Baranes et al. 2012, Wang et al. 2015). Pre-
natural movements in captive bears (e.g. stereotypic dictor variables were extracted from the accelerome-
behaviors), were rare (e.g. fighting, breeding, drink- ter data over 2 s intervals; mean conductivity data
ing), were transitionary, or were non-descript. (wet/dry) was also extracted over 2 s intervals using
program R (R Core Team 2014) (Table 2). Video-
linked behaviors that lasted less than 2 s were
Modeling excluded from analyses. We used a random forest
supervised machine learning algorithm (Breiman
We derived summary statistics from the accelerom- 2001) in R (‘RandomForest’ package) to predict polar
eter data and linked the accelerometer data with cor- bear behaviors. Random forest models use multiple
responding behaviors of interest (SAS version 9.3; classification trees from a random subset of predictor
SAS Institute). We converted accelerometer meas- variables and then replicate this process over multi-
ures from m s−2 to g (1 g = 9.81 m s−2). We calculated ple iterations using a subset of the data for each iter-
magnitude (Q) as a fourth dimension, where ation to determine the best variables for making pre-
dictions (Breiman 2001). An estimate of error is
Q = heave2 +surge2 +sway 2
derived by using the remaining data not used in each
(Nathan et al. 2012). We used a 2 s running mean of iteration to test the predictive ability of the model,
the raw acceleration data to calculate static accelera- which is termed the ‘out-of-bag’ (OOB) error rate
Table 2. Parameters extracted from tri-axial accelerometer and conductivity data and used in random forest models to predict
wild polar bear Ursus maritimus behaviors. Respective acceleration measures from the surge (X), heave (Y), sway (Z), and
magnitude (Q) axes
Parameter Label Definition
Static acceleration (g) staticX, staticY, staticZ, staticQ Mean static acceleration along the surge,
heave, sway, and magnitude axes
Maximum dynamic body mdbaX, mdbaY, mdbaZ, mdbaQ Maximum dynamic body acceleration along the
acceleration (g) surge, heave, sway, and magnitude axes
Standard deviation dynamic stdbaX, stdbaY, stdbaZ, stdbaQ Standard deviation dynamic body acceleration
body acceleration (g) along the surge, heave, sway, and magnitude axes
Overall dynamic body odbaX, odbaY, odbaZ, ODBA Mean dynamic acceleration body acceleration along
acceleration (g) the surge, heave, and sway axes. ODBA = odbaX +
odbaY + odbaZ
Dominant power spectrum dpsX, dpsY, dpsZ, dpsQ Maximum power spectral density of dynamic accelera-
(g 2 Hz−1) tion along the surge, heave, sway, and magnitude axes
Frequency at the dominant fdpsX, fdpsY, fdpsZ, fdpsQ Frequency at the maximum power spectral density of
power spectrum (Hz) dynamic acceleration along the surge, heave, sway,
and magnitude axes
Mean wet/dry wetdry Mean conductivity determination of whether the tag
is wet or dry (range: 0−255)Pagano et al.: Accelerometers identify polar bear behaviors 23
(Breiman 2001, Liaw & Wiener 2002). The random To evaluate our ability to predict behaviors of ice
forest algorithm has previously shown high accuracy bears, we used 3 different datasets to train the ran-
(> 80%) for predicting animal behaviors from dom forest models and evaluated the ability of each
accelerometer data (Nathan et al. 2012, Resheff et al. of these models. First, we used a random subset of
2014, Graf et al. 2015, Lush et al. 2015, Rekvik 2015, the data from ice bears as the training dataset and
Wang et al. 2015, Alvarenga et al. 2016). We fit 500 the remaining data from ice bears to test predictions
classification trees to each training dataset and used (testing dataset). Second, we used the data from cap-
a random subset of 5 predictor variables for each split tive polar bears as the training dataset. Third, we
in the tree. used the data from captive brown bears as the train-
ing dataset.
To evaluate our ability to predict behaviors of land
Analyses bears, we conducted 4 additional analyses. First, we
used a random subset of the data from land bears as
Unbalanced datasets can bias the predictive ability the training dataset and the remaining data from
of classification algorithms toward the most dominant land bears to test predictions (testing dataset). Sec-
classes (Chen et al. 2004). Therefore, we performed 3 ond, we used the training data from ice bears as the
initial analyses to test the effect of uneven distribu- training dataset. Third, we used the training data
tions on predictive ability. The first analysis used an from captive polar bears as the training dataset.
uneven distribution in which for ice and land bears, Fourth, we used the training data from captive brown
we randomly selected 70% of each behavior for the bears as the training dataset.
training dataset and used the remaining 30% to test To examine the effect of sampling frequency on
the predictive ability of the random forest algorithm our ability to discriminate behaviors, we subsampled
(e.g. Nathan et al. 2012, Alvarenga et al. 2016). For our 16 Hz accelerometer data to lower data acquisi-
captive polar and brown bears we used the entire tion rates of 8 and 4 Hz using SAS, and repeated the
datasets to train the random forest algorithm. The predictive analyses above for both ice and land
second analysis used a subsampling approach in bears.
which we attempted to reduce the uneven distribu- Predicted behaviors were categorized as true posi-
tion of more frequent behaviors (e.g. resting) in our tive (TP) if they correctly matched the actual behav-
training dataset. To reduce the uneven distribution of ior, true negative (TN) if they correctly identified as a
behaviors in the dataset from ice bears, we randomly different behavior, false positive (FP) if they incor-
selected 5% of the resting behaviors, 30% of the rectly identified the behavior, and false negative
walking behaviors, and 70% of each of the remain- (FN) if they incorrectly identified as a different be-
ing behaviors for training the random forest algo- havior. We evaluated the predictive abilities of these
rithm. We used the remaining data from ice bears for models based on Matthews’ correlation coefficient
testing predictions. To reduce the uneven distribu- (MCC; e.g. Basu et al. 2013, Martins et al. 2016), the
tion of the dataset from land bears, we randomly percent precision, recall, and F-measure. We used
selected 5% of the resting behaviors and 70% of MCC in place of accuracy due to the unbalanced
each of the remaining behaviors for training and nature of our dataset.
used the remaining data to test predictions. To re- TP × TN – FP × FN
duce the uneven distribution of the datasets from MCC, ,
( TP+FP) × ( TP+FN ) × ( TN+FP ) × ( TN+FN )
captive polar bears and brown bears, we randomly
selected 10% of the resting behaviors, 30% of the provides a measure of the agreement between the
walking behaviors, and 100% of each of the remain- predicted and actual classifications, where +1 repre-
ing behaviors for training the random forest algo- sents a perfect prediction and −1 represents total dis-
rithm. The third analysis used a completely balanced agreement (Matthews 1975). Precision is the propor-
distribution in which we used identical sample sizes tion of positive classifications that were correctly
of 500 observations for each behavior in the training classified (TP/TP + FP), recall is the probability that a
dataset and the remaining observations to test and behavior will be correctly classified (TP/TP + FN),
excluded behaviors with less than 500 observations. and F-measure is the harmonic mean of precision
Based on these 3 analyses, we used the sampling and recall (2 × precision × recall/precision + recall).
distribution (i.e. uneven, subsampled, or balanced We used 2 sample t-tests to evaluate whether MCC,
distribution) with the greatest predictive ability for precision, and recall differed significantly using a
further analyses. 16 Hz sampling frequency compared to either an 8 or24 Endang Species Res 32: 19–33, 2017
4 Hz sampling frequency based on the ice and land Table 3. Number of 2 s long behaviors used in random forest
datasets. training datasets for predicting behaviors of wild polar bears
Ursus maritimus. Ice bears: polar bears on the sea ice of the
southern Beaufort Sea. Land bears: polar bears on Akimiski
Island, Nunavut
RESULTS
Behavior Captive Captive Wild Wild
Behavior on the sea ice polar brown ice land
bears bears bears bears
Video collars on ice bears Ursus maritimus re-
− = 38 h, SD = 17 h, n = 5). Rest 53 656 104 838 163 301 43 132
corded 14 to 55 h of video (x Walk 8962 33 059 36 083 958
For predicting the behavior of ice bears, we collected Swim 423 0 703 0
a total of 140 h of video-linked accelerometer data Eat 2108 973 2100 1529
from ice bears, 37 h from captive polar bears, and Run 0 0 943 0
Pounce 458 0 49 0
72 h from captive brown bears U. arctos. We identi-
Groom 3729 432 1138 289
fied 10 different behaviors from ice bears, with rest- Dig 405 0 1194 0
ing, walking, and eating being the most prevalent Head shake 86 14 435 19
(Table 3). Ice bears ate recently killed adult, sub- Roll 87 0 1473 0
adult, or pup ringed seals Pusa hispida, seal carcas-
ses, bowhead whale Balaena mysticetus carcasses, or
unidentifiable carcasses. Captive polar bears con- bear and captive polar bear models exhibited strong
sumed fish, and captive brown bears ate dry omni- predictive ability for identifying resting and walking
vore chow. Captive brown bears also grazed on behaviors in wild bears (> 90% MCC, precision, re-
grass, which was excluded from analyses predicting call, and F-measure; Table 4 & Table S3 in the Sup-
behaviors of ice bears, but was included as eating for plement). Predictive abilities for other behaviors var-
predicting behaviors of land bears. ied, with swimming and head shaking exhibiting
Our models using an uneven distribution of behav- strong predictive ability using the ice bear model
iors in which we used 70% of each behavior from ice (> 75% MCC, precision, recall, and F-measure), but
bears and all of the available data from captive polar lower predictive ability for eating, running, pounc-
or brown bears exhibited 5% greater predictive abil- ing, grooming, digging, and rolling (Fig. 2, Tables 4
ity overall compared to the subsampled distribution, & 5). The model from ice bears had particularly
and 7% greater predictive ability overall compared greater ability than the captive polar bear model for
to the balanced distribution based on
F-measure (see Table S2 in the Sup- 1 Ice bears
plement at www.int-res.com/articles/ Captive polar bears
0.9 Captive brown bears
suppl/n032p019_supp.pdf). In particu-
0.8
lar, the datasets with an uneven distri-
bution exhibited greater ability to dis- 0.7
criminate less frequent behaviors such
F-measure
0.6
as swimming, eating, and running
(Table S2). Therefore, we used the 0.5
datasets with uneven distributions for 0.4
subsequent analyses (Table 3).
Our model with training data from 0.3
ice bears had an OOB error rate of 0.2
2.0% and exhibited the greatest pre-
0.1
dictive abilities for all 10 behaviors
(Fig. 2) compared to all other models 0
tested. Our models with training data Rest Walk Swim Eat Run Pounce Groom Dig Head Roll
shake
from captive polar bears and brown Behavior
bears had OOB error rates of 3.7 and
Fig. 2. Ability (F-measure) of the random forest model to predict 10 behaviors
0.5% respectively, indicating that both of polar bears Ursus maritimus on the sea ice from 3 different training
models performed well in discriminat- datasets of accelerometer data. Ice bears: polar bears on the sea ice of the
ing captive behaviors. Both the ice southern Beaufort SeaPagano et al.: Accelerometers identify polar bear behaviors 25
Table 4. Performance of a random forest model using ac- (staticY) and surge directions (staticX), wet/dry con-
celerometer data from polar bears Ursus maritimus on the ductivity (wetdry), and frequency at the dominant
sea ice to predict behaviors of bears on the sea ice as veri-
fied by video data. MCC: Matthews’ correlation coefficient
power spectrum in the surge direction (fdpsX; Fig. 3).
Differences in the intensity of behaviors were dis-
cernible in the ODBA measures, with head shaking
Behavior MCC Precision Recall F-measure
having the greatest ODBA and resting having the
Rest 0.973 0.992 0.997 0.994 lowest (Table S5). Eating and swimming showed simi-
Walk 0.971 0.964 0.989 0.976
Swim 0.887 0.957 0.823 0.885
Eat 0.674 0.677 0.677 0.677
Run 0.709 0.835 0.604 0.701
Pounce 0.700 0.833 0.588 0.690
Groom 0.417 0.658 0.266 0.379
Dig 0.532 0.712 0.400 0.513
Head shake 0.818 0.839 0.798 0.818
Roll 0.754 0.821 0.696 0.753
swimming, pouncing, and digging (Fig. 2, Table S3).
The captive brown bear model provided weaker abil-
ity to distinguish behaviors of ice bears for walking,
eating, and grooming (< 65% MCC and F-measure),
but reliably distinguished resting (Fig. 2, Table S4).
Using the model from ice bears, eating had a high
rate of false positive classifications resulting from
digging behavior being incorrectly classified as eat-
ing (Table 5) as well as a high rate of false negative
classifications with eating behavior incorrectly classi-
fied as either resting or walking (Table 5). A post hoc
test using only feeding behavior while eating a
recently killed ringed seal within the training and
testing datasets failed to improve our ability to dis- Fig. 3. Variable importance plot from the random forest
criminate eating (MCC = 0.61, precision = 0.67, recall model of accelerometer data from polar bears on the sea ice.
= 0.56, F-measure = 0.61). Additionally, running was The importance plot provides a relative ranking of parame-
often misclassified as walking, whereas rolling was ters in which higher values indicate parameters that con-
tributed more toward classification accuracy. Mean de-
often misclassified as resting (Table 5). crease in accuracy is normalized by dividing by the standard
The most important predictors using the model from errors of the parameters (i.e. z-score). See Table 2 for de-
ice bears were static acceleration in the heave scription of parameters
Table 5. Cross-validation comparing predicted behaviors (rows) from accelerometer analyses of polar bears Ursus maritimus
on the sea ice to actual behaviors (columns) confirmed by video recordings. Correct classifications are denoted in bold. See
Table 4 for performance statistics in predicting behaviors
Rest Walk Swim Eat Run Pounce Groom Dig Head shake Roll
Rest 69 760 31 33 99 1 0 281 28 0 111
Walk 115 15 295 10 111 153 4 15 102 26 41
Swim 6 2 246 1 0 0 1 0 0 1
Eat 35 51 2 608 1 0 45 145 0 11
Run 0 44 0 1 243 0 0 1 1 1
Pounce 0 0 0 0 0 10 0 2 0 0
Groom 17 2 0 33 0 0 129 13 0 2
Dig 2 16 0 44 0 2 9 203 0 9
Head shake 2 6 0 0 3 0 0 2 146 15
Roll 45 13 8 1 1 1 5 2 10 43726 Endang Species Res 32: 19–33, 2017
lar mean ODBA values, but had differing mean static Sampling frequency
acceleration values (Table S5). Eating and grooming
had low values of static acceleration in the heave di- The OOB error rate using the data from ice bears in-
rection (staticY), which was indicative of a head-down creased from 2.0 to 2.2% using an 8 Hz sampling fre-
posture. Walking and running exhibited periodic un- quency and to 2.6% using a 4 Hz sampling frequency.
dulating patterns in static acceleration in the heave OOB error rate using data from land bears increased
direction (staticY; Fig. 4 & Fig. S1 in the Supplement), from 0.5 to 0.6% at 8 Hz and to 0.8% at 4 Hz. Predic-
which was indicative of the bear’s head moving up tive ability using an 8 Hz sampling frequency was
and down as it stepped. Wet/dry conductivity while nearly identical to 16 Hz among all behaviors using
swimming was lower for wild polar bears (x– = 81.9, SD the dataset from ice bears (t58 = 0.70, p = 0.24) and
= 81.5) than captive polar bears (x– = 205.3, SD = 57.8) land bears (t28 = 0.61, p = 0.27) based on MCC, preci-
and lower than all other behaviors (all x– > 234). A post sion, and recall. Predictive ability using a 4 Hz sam-
hoc test excluding the conductivity variable reduced pling frequency was lower than predictive ability us-
the ability of the algorithm to correctly identify swim- ing 16 Hz for ice bears (t55 = 1.8, p = 0.04), but not for
ming behaviors using the training dataset for ice land bears (t27 = 0.59, p = 0.28). In particular, the
bears (MCC = 0.47, precision = 0.77, recall = 0.29, F- ability to discriminate the high intensity behaviors of
measure = 0.42) with a high rate of swimming behav- pouncing and head shaking declined using a 4 Hz
iors misclassified as resting. sampling rate (Fig. 6).
Behaviors on land DISCUSSION
Video collars on land bears recorded 19 to 36 h of Our results show that tri-axial accelerometers in
video (x– = 27 h, SD = 12 h, n = 2) and in total we col- combination with measures of conductivity can reli-
lected 36 h of video-linked accelerometer data for the ably distinguish the 3 most common behaviors of
behaviors of interest. We identified 5 different beha- wild polar bears Ursus maritimus (resting, walking,
viors from land bears, with resting being the most and swimming; Stirling 1974, Latour 1981, Hansson
prevalent, followed by eating (Table 3). Eating on & Thomassen 1983, Lunn & Stirling 1985). This will
land consisted of berries, primarily crowberries Em- provide a method to remotely document the activity
petrum nigrum. budgets of these far-ranging animals, which can be
Our model with training data from land bears had further linked with location data from satellite collars
an OOB error rate of 0.5% and had the greatest to examine the effects of habitat on behavior and
success in discriminating on-land behaviors (Fig. 5, energy expenditure. Our results indicate that differ-
Table S6). All behaviors, except for grooming and ences among habitats and species can impact the
head shaking, had MCC, precision, recall, and F- ability to discriminate behaviors in wild individuals
measure values > 90% using the model from land using accelerometers. We found no loss in predictive
bears (Fig. 5, Table S6). In particular, the model from ability using an 8 Hz sampling frequency, which
land bears was able to distinguish eating (MCC = would allow for twice the battery longevity of a 16 Hz
0.95, precision = 0.95, recall = 0.96, F-measure = rate and reduce the computational power needed for
0.95), which was not possible with the other datasets. analyses. Although accelerometer studies on smaller
Our model with training data from ice bears had suc- species appear to require greater sampling frequen-
cess in discriminating resting behaviors on land cies (e.g. > 30 Hz; Broell et al. 2013, Brown et al.
(MCC = 0.60, precision = 0.96, recall = 1.0, F-mea- 2013), our results are similar to data obtained by
sure = 0.98) and walking on land (MCC = 0.82, preci- Rekvik (2015) from captive brown bears U. arctos,
sion = 0.89, recall = 0.76, F-measure = 0.82), but eat- and by Wang et al. (2015) from captive mountain
ing was often misclassified as resting or walking (FP). lions Puma concolor, which both found little loss in
The captive polar bear model performed similarly to predictive ability at sampling frequencies ≥8 Hz.
the model from ice bears for discriminating behaviors
on land (Fig. 5). The captive brown bear model per-
formed less well than the other models for discrimi- Habitat effects
nating walking on land, but otherwise performed
similarly to the models from ice bears and captive Our results indicate that accelerometer signatures
polar bears (Fig. 5). on sea ice are similar to signatures on land for mostPagano et al.: Accelerometers identify polar bear behaviors
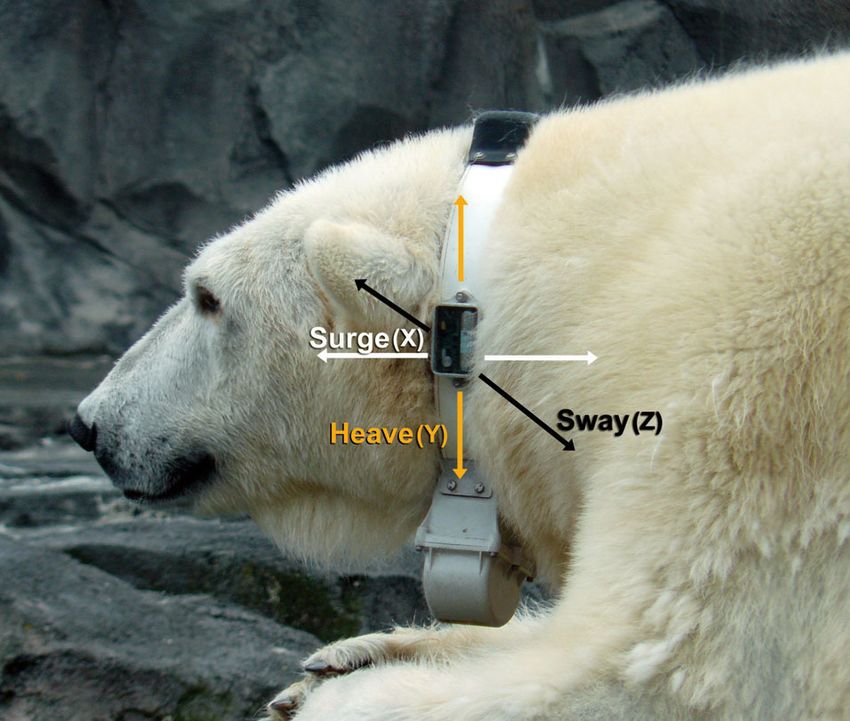
Fig. 4. Accelerometer signatures of static acceleration in the surge (X), heave (Y), and sway (Z) directions and overall dynamic acceleration (ODBA) while walking,
27
swimming, standing, and eating a seal from an adult female polar bear Ursus maritimus on the sea ice of the southern Beaufort Sea28 Endang Species Res 32: 19–33, 2017
1.0 Land bears nant of individual reproductive success
Ice bears
0.9 Captive polar bears and survival (Stirling et al. 1999, Regehr et
Captive brown bears al. 2007, 2010). Although we had success
0.8 discriminating eating events by land bears,
0.7 we had lower precision and recall in dis-
criminating eating events by ice bears. This
F-measure
0.6 was likely related in part to the movement
0.5 pattern of bears eating berries, in which
they typically stood with their head down
0.4
and grazed. Conversely, bears eating on
0.3 the sea ice exhibited a variety of positions
including standing, sitting, and lying
0.2
down, and both tore pieces of food from
0.1 seals or gnawed on carcasses. Since most
kill events involve bears pouncing on their
0.0
Rest Walk Eat Groom Head shake seal prey (Stirling 1988, Derocher 2012),
Behavior we may be able to identify successful kills
based on the combination of a pouncing
Fig. 5. Ability (F-measure) of a random forest model to predict behaviors
of polar bears Ursus maritimus on land from 4 different training datasets. signature followed by eating signatures
Ice bears: polar bears on the the sea ice of the southern Beaufort Sea. (e.g. Williams et al. 2014), but this requires
Land bears: polar bears on Akimiski Island, Nunavut further evaluation. Additionally, feeding on
a seal would typically last for a prolonged
behaviors, but eating berries by land bears had a dis- period; hence, if the model primarily predicted eat-
tinct signature that our ice bear model and captive ing over a prolonged period this could be used as an
bear models misclassified as grooming, resting, or indication of a feeding event, but this also requires
walking. This highlights the value in linking obser- further evaluation.
vational and accelerometer data from wild subjects
over multiple time periods and habitats, and the
importance of accounting for as many behaviors as Use of captive animals and surrogate species
possible in training datasets. Knowledge of eating
frequency and duration would provide insight in de- Our ability to discriminate behaviors was greatly
termining foraging success, an important determi- improved by including data from free-ranging polar
1
16 Hz
8 Hz
0.9
4 Hz
0.8
0.7
0.6
F-measure
0.5
0.4
0.3
0.2
0.1
0
Rest Walk Swim Eat Run Pounce Groom Dig Head Roll
shake
Behavior
Fig. 6. Ability (F-measure) of a random forest model to predict behaviors of polar bears Ursus maritimus on the sea ice using
3 different accelerometer sampling frequenciesPagano et al.: Accelerometers identify polar bear behaviors 29
bears rather than using data from captive bears Eating, grooming, and rolling had high rates of
alone. However, resting and walking could be reli- misclassifications as resting, whereas running and
ably discriminated using data from either captive or digging had high rates of misclassifications as
wild polar bears. This illustrates the value of collect- walking. These results suggest the random forest
ing data from captive individuals when data collec- algorithm could be prone to slightly overestimate
tion is difficult or impossible from wild counterparts. the amount of true resting and walking behaviors
However, data from captive brown bears exhibited in quantifying activity budgets. Our lower precision
poorer performance for predicting active behaviors and recall for discriminating some behaviors was
in wild polar bears. This may be related to differ- likely due in part to the attachment of the accel-
ences in walking kinematics between polar and erometer on a collar. Although a number of studies
brown bears as well as potential differences in limb have successfully discriminated behaviors using
lengths between the species (Renous et al. 1998). accelerometers on collars (Watanabe et al. 2005,
Additionally, polar bears have longer necks relative Martiskainen et al. 2009, Soltis et al. 2012, McClune
to their body size than other ursid species (DeMaster et al. 2014, Lush et al. 2015, Rekvik 2015, Wang et
& Stirling 1981), which could also affect accelero- al. 2015), many of these studies limited their analy-
meter signatures from a neck-worn collar. Although ses to 4 or 5 behaviors or documented high misclas-
Campbell et al. (2013) proposed the use of surrogate sification rates for distinguishing some behaviors.
species to predict the behaviors of other species, our Wang et al. (2015) similarly reported low accuracy
findings suggest that polar bear accelerometer signa- of accelerometers on collars for predicting eating
tures are likely species- and habitat-specific, at least and grooming by captive mountain lions, and Lush
for distinguishing specific behaviors. The brown bear et al. (2015) reported low accuracy for predicting
model did reliably distinguish resting behavior in some behaviors, including grooming, in wild brown
wild polar bears, which suggests that surrogate spe- hares Lepus europaeus. Attachment of the accel-
cies could be used to distinguish coarse activity pat- erometer to a collar, as opposed to attachment
terns such as active versus inactive (e.g. Gervasi et directly on the animal, likely introduces noise in
al. 2006, Ware et al. 2015). the data due to independent collar motion (i.e. the
Our analyses indicate that conductivity measures collar must be fitted to ensure animals do not
are needed to reliably discriminate swimming. remove it, but loose enough to accommodate
Greater conductivity measures in captive polar bears potential changes in body mass) and may reduce
that were swimming in fresh water likely caused the the ability of the accelerometer to detect some low
poorer performance for discriminating swimming in intensity movements (Shepard et al. 2008). The
wild polar bears that were swimming in salt water. effect of independent collar motion is evident in
For pouncing, captive polar bears pounced on large our large values of ODBA when bears shook their
plastic barrels, which resulted in similar measures of heads. This behavior may be useful for identifying
ODBA as wild counterparts, but had different signa- the end of a swim, as bears are known to shake
tures of static acceleration (i.e. body posture). Dig- and roll in the snow following a swim. Additionally,
ging by wild bears, which was often through snow our ability to discriminate head shaking allows for
and ice into subnivean lairs to locate seals, exhibited excluding it from potential energetic analyses using
greater ODBA measures and slightly different static accelerometers. Use of a higher sampling frequency
acceleration than captive bears digging in snow and than was used in this study (i.e. >16 Hz) could
ice. These results suggest that some behaviors of potentially improve the ability to discriminate some
captive bears may not fully reflect behaviors of their fine-scale body movements (Nathan et al. 2012)
wild counterparts, which further illustrates the value such as eating, though Wang et al. (2015) sampled
of collecting simultaneous observational data (e.g. vi- at 64 Hz and had low accuracy in discriminating
deo) from free-ranging individuals to calibrate ac- eating behaviors of captive mountain lions.
celerometer-based behavioral data.
Video calibration
Accelerometer attachment
Having video-linked observational data from cam-
Regardless of which training dataset was used, era-mounted collars on wild polar bears was the most
we found lower precision and recall for predicting practical method to calibrate accelerometers on free-
5 of the behaviors tested for bears on the sea ice. ranging individuals. However, because the animal’s30 Endang Species Res 32: 19–33, 2017
body was not visible in the video, some behaviors Geological Survey, Alaska Science Center. Research in the
may have been incorrectly classified. For example, USA was permitted under US Fish and Wildlife Service per-
mits MA690038 and MA95406A. Research on Akimiski
distinguishing walking versus running was often Island, Nunavut was approved under Nunavut Wildlife
challenging, as was determining when bears were Research Permit WL 2015-073. This work was supported by
actively swimming versus resting in the water. Both US Geological Survey’s Changing Arctic Ecosystems Initia-
of these could have contributed to the misclassifica- tive. Additional support was provided by Polar Bears Inter-
national; World Wildlife Fund (Canada); Ontario Ministry of
tions between running and walking and swimming
Natural Resources and Forestry; Natural Sciences and Engi-
and resting. Additionally, the models had greater neering Research Council of Canada; Born Free Foundation;
success discriminating behaviors as sample sizes Helen McCrea Peacock Foundation; Institute for Conserva-
increased. Although unbalanced datasets are known tion Research, San Diego Zoo Global; and the International
Association for Bear Research and Management. Support for
to affect the predictive ability of random forest algo-
T.M.W. was provided by the National Science Foundation’s
rithms (Chen et al. 2004), we found that the inclusion Instrument Development for Biological Research program.
of larger sample sizes in the training dataset was We thank Mehdi Bakhtiari (Exeye) for developing the video
more important than imbalance. This highlights the collars used in this study. We thank the bear keeper and
value of calibrating accelerometers from multiple trainer teams at the Oregon Zoo, San Diego Zoo, and Alaska
Zoo for enabling data collection at their facilities. We thank
individuals over prolonged periods. Stephen Atkinson, Tyrone Donnelly, Katie Florko, Sarah
Hagey, Tim Moody, Kristin Simac, and Maria Spriggs for
assistance in the field. We thank helicopter pilots Frank Ross
CONCLUSIONS (Soloy Helicopters) and Doug Holtby (OMNRF) for field sup-
port. B. Battaile and 3 anonymous reviewers provided valu-
able input on earlier versions of the manuscript. This re-
Our results underscore the importance of thor- search used resources of the Core Science Analytics and
oughly validating accelerometers for use in remote Synthesis Applied Research Computing program at the US
detection of behavior, ideally on a species- and habi- Geological Survey. Use of trade names is for descriptive pur-
tat-specific level. The use of tri-axial accelerometers, poses only and does not imply endorsement by the US Gov-
ernment. This paper was reviewed and approved by the
as shown here, will enable detailed assessments of USGS under its Fundamental Science Practices policy
polar bear behaviors to better understand polar bear (www.usgs.gov/fsp).
habitat use and the implications for energy demands.
For example, measures of acceleration could be com-
LITERATURE CITED
bined with measures of oxygen consumption from
captive bears while resting, walking, and swimming Alvarenga FAP, Borges I, Palkovi L, Rodina J, Oddy VH,
to both quantify activity budgets and estimate the Dobos RC (2016) Using a three-axis accelerometer to
energetic costs of these behaviors (e.g. Wilson et al. identify and classify sheep behaviour at pasture. Appl
Anim Behav Sci 181:91−99
2006, 2012, Halsey et al. 2009, 2011, Gómez Laich et
Amstrup SC, Marcot BG, Douglas DC (2008) A Bayesian
al. 2011, Williams et al. 2014). Future advances are network modeling approach to forecasting the 21st cen-
needed that would enable remote transmission of tury worldwide status of polar bears. In: DeWeaver ET,
raw accelerometer data to further enhance the appli- Blitz CM, Tremblay LB (eds) Arctic sea ice decline:
cability of these devices to animals occurring in observations, projections, mechanisms, and implications.
Geophysics Monograph Series 180. American Geophysi-
remote environments and obviate the need for sensor cal Union, Washington, DC, p 213−268
recovery. As declines in sea ice are expected to in- Atwood TC, Marcot BG, Douglas DC, Amstrup SC, Rode
crease the activity rates of polar bears across much of KD, Durner GM, Bromaghin JF (2016) Forecasting the
their range (Derocher et al. 2004, Molnár et al. 2010, relative influence of environmental and anthropogenic
stressors on polar bears. Ecosphere 7:e01370
Sahanatien & Derocher 2012), the use of accelero-
Basu I, Graupe D, Tuninetti D, Shukla P, Slavin KV, Metman
meters provides a method to monitor the impacts of LV, Corcos DM (2013) Pathological tremor prediction
habitat change on activity and energy budgets to using surface EMG and acceleration: potential use in
better understand the implications for body condi- ‘ON-OFF’ demand driven deep brain stimulator design.
J Neural Eng 10:036019
tion, reproductive success, and survival of this Arctic
Bidder OR, Qasem LA, Wilson RP (2012) On higher ground:
apex predator. How well can dynamic body acceleration determine
speed in variable terrain? PLOS ONE 7:e50556
Bograd SJ, Block BA, Costa DP, Godley BJ (2010) Biolog-
Acknowledgements. Procedures were approved by the Ani- ging technologies: new tools for conservation. Introduc-
mal Care and Use Committees of the University of Califor- tion. Endang Species Res 10:1−7
nia, Santa Cruz; Washington State University; York Univer- Breiman L (2001) Random forests. Mach Learn 45:5−32
sity; Oregon Zoo; Alaska Zoo; San Diego Zoo; Ontario Broell F, Noda T, Wright S, Domenici P, Steffensen JF,
Ministry of Natural Resources and Forestry; and the US Auclair JP, Taggart CT (2013) Accelerometer tags: de-Pagano et al.: Accelerometers identify polar bear behaviors 31 tecting and identifying activities in fish and the effect of development and application of the accelerometry tech- sampling frequency. J Exp Biol 216:1255−1264 nique for estimating energy expenditure. Comp Biochem Bromaghin JF, McDonald TL, Stirling I, Derocher AE and Physiol A Mol Integr Physiol 158:305−314 others (2015) Polar bear population dynamics in the Hammond TT, Springthorpe D, Walsh RE, Berg-Kirkpatrick southern Beaufort Sea during a period of sea ice decline. T (2016) Using accelerometers to remotely and automat- Ecol Appl 25:634−651 ically characterize behavior in small animals. J Exp Biol Brown DD, Kays R, Wikelski M, Wilson R, Klimley AP (2013) 219:1618−1624 Observing the unwatchable through acceleration log- Hansson R, Thomassen J (1983) Behavior of polar bears with ging of animal behavior. Anim Biotelem 1:20 cubs in the denning area. Int Conf Bear Res Manage 5: Campbell HA, Gao L, Bidder OR, Hunter J, Franklin CE 246−254 (2013) Creating a behavioural classification module for Hunter CM, Caswell H, Runge MC, Regehr EV, Amstrup acceleration data: using captive surrogate for difficult to SC, Stirling I (2010) Climate change threatens polar bear observe species. J Exp Biol 216:4501−4506 populations: a stochastic demographic analysis. Ecology Caro T (1999) The behavior-conservation interface. Trends 91:2883−2897 Ecol Evol 14:366−369 Kalxdorff SB (1997) Collection of local knowledge regard- Cattet MRL, Caulkett NA, Polischuk SC, Ramsay MA (1997) ing polar bear habitat use in Alaska. US Fish and Reversible immobilization of free-ranging polar bears Wildlife Service Tech Rep MMM 87-2. Marine Mam- with medetomidine-zolazepam-tiletamine and atipame- mals Management, US Fish and Wildlife Service, zole. J Wildl Dis 33:611−617 Anchorage, AK Chen C, Liaw A, Breiman L (2004) Using random forest to Knudsen B (1978) Time budgets of polar bears (Ursus mar- learn imbalanced data. University of California, Berke- itimus) on North Twin Island, James Bay, during sum- ley, CA. http://statistics.berkeley.edu/sites/default/files/ mer. Can J Zool 56:1627−1628 tech-reports/666.pdf (accessed Oct 2015) Kochnev AA, Etylin VM, Kavry VI, Siv-Siv EB, Tanko IV Cooke SJ (2008) Biotelemetry and biologging in endan- (2003) Traditional knowledge of Chukotka Native peo- gered species research and animal conservation: rele- ples regarding polar bear habitat use. Final Report. Pre- vance to regional, national, and IUCN Red List threat pared for the US National Park Service, Chukotka Asso- assessments. Endang Species Res 4:165−185 ciation of Traditional Marine Mammal Hunters, Alaska Cooke SJ, Blumstein DT, Buchholz R, Caro T and others Nanuuq Commission, and Pacific Fisheries Research (2014) Physiology, behavior, and conservation. Physiol Center (Chukotka Branch), Anchorage, AK Biochem Zool 87:1−14 Latour PB (1981) Spatial relationships and behavior of polar Costa DP, Huckstadt LA, Crocker DE, McDonald BI, Goebel bears (Ursus maritimus Phipps) concentrated on land ME, Fedak MA (2010) Approaches to studying climate during the ice-free season of Hudson Bay. Can J Zool 59: change and its role on the habitat selection of Antarctic 1763−1774 pinnipeds. Integr Comp Biol 50:1018−1030 Liaw A, Wiener M (2002) Classification and regression by DeMaster DP, Stirling I (1981) Ursus maritimus. Mamm Spe- randomForest. R News 2/3:18−22 cies 145:1−7 Lunn NJ, Stirling I (1985) The significance of supplemental Derocher AE (2012) Polar bears: a complete guide to their food to polar bears during the ice-free period of Hudson biology and behavior. Johns Hopkins University Press, Bay. Can J Zool 63:2291−2297 Baltimore, MD Lush L, Ellwood S, Markham A, Ward AI, Wheeler P (2015) Derocher AE, Lunn NJ, Stirling I (2004) Polar bears in a Use of tri-axial accelerometers to assess terrestrial mam- warming climate. Integr Comp Biol 44:163−176 mal behavior in the wild. J Zool (Lond) 298:257−265 Durner GM, Douglas DC, Nielson RM, Amstrup SC and oth- Martins M, Santos C, Costa L, Frizera A (2016) Feature ers (2009) Predicting 21st-century polar bear habitat dis- reduction and multi-classification of different assistive tribution from global climate models. Ecol Monogr 79: devices according to the gait pattern. Disabil Rehabil 25−58 Assist Technol 11:202−218 Ferguson SH, Taylor MK, Messier F (2000) Influence of sea Martiskainen P, Järvinen M, Skön JP, Tiirikainen J, Koleh- ice dynamics on habitat selection by polar bears. Ecology mainen M, Mononen J (2009) Cow behaviour pattern 81:761−772 recognition using three-dimensional accelerometer and Gervasi V, Brunberg S, Swenson JE (2006) An individual- support vector machines. Appl Anim Behav Sci 119: based method to measure animal activity levels: a test on 32−38 brown bears. Wildl Soc Bull 34:1314−1319 Matthews BW (1975) Comparison of the predicted and Gómez Laich A, Wilson RP, Gleiss AC, Shepard ELC, Quin- observed secondary structure of T4 phage lysozyme. tana F (2011) Use of overall dynamic body acceleration Biochim Biophys Acta 405:442−451 for estimating energy expenditure in cormorants: Does Mauritzen M, Belikov SE, Boltunov AN, Derocher AE and locomotion in different media affect relationships? J Exp others (2003) Functional response in polar bear habitat Mar Biol Ecol 399:151−155 selection. Oikos 100:112−124 Graf PM, Wilson RP, Qasem L, Hackländer K, Rosell F (2015) McClune DW, Marks NJ, Wilson RP, Houghton JDR and The use of acceleration to code for animal behaviours; a others (2014) Tri-axial accelerometers quantify be- case study in free-ranging Eurasian beavers Castor fiber. haviour in the Eurasian badger (Meles meles): towards PLOS ONE 10:e0136751 an automated interpretation of field data. Anim Biotelem Halsey LG, Green JA, Wilson RP, Frappell PB (2009) 2:5 Accelerometry to estimate energy expenditure during McClune DW, Marks NJ, Delahay RJ, Montgomery WI, activity: best practice with data loggers. Physiol Biochem Scantlebury DM (2015) Behavior-time budget and func- Zool 82:396−404 tional habitat use of free-ranging European badger Halsey LG, Shepard ELC, Wilson RP (2011) Assessing the (Meles meles). Anim Biotelem 3:7
32                                           Endang Species Res 32: 19–33, 2017

McPhee ME, Carlstead K (2010) The importance of main-               behaviour: an oystercatcher example. PLOS ONE 7:
   taining natural behaviors in captive mammals. In:                e37997
   Kleiman DG, Thompson KV, Baer CK (eds) Wild mam-             Shepard ELC, Wilson RP, Quintana F, Gómez Laich A and
   mals in captivity: principles and techniques for zoo man-        others (2008) Identification of animal movement patterns
   agement, 2nd edn. University of Chicago Press, Chicago,          using tri-axial accelerometry. Endang Species Res 10:
   IL, p 303−313                                                    47−60
Molnár PK, Derocher AE, Thiemann GW, Lewis MA (2010)            Shepard ELC, Wilson RP, Rees WG, Grundy E, Lambertucci
   Predicting survival, reproduction and abundance of               SA, Vosper SB (2013) Energy landscapes shape animal
   polar bears under climate change. Biol Conserv 143:              movement ecology. Am Nat 182:298−312
   1612−1622                                                    Soltis J, Wilson RP, Douglas-Hamilton I, Vollrath F, King LE,
Nakamura I, Goto Y, Sato K (2015) Ocean sunfish rewarm at           Savage A (2012) Accelerometers in collars identify
   the surface after deep excursions to forage for siphono-         behavioral states in captive African elephants Loxodonta
   phores. J Anim Ecol 84:590−603                                   africana. Endang Species Res 18:255−263
Nathan R, Spiegel O, Fortmann-Roe S, Harel R, Wikelski M,       Stirling I (1974) Midsummer observations on the behavior of
   Getz WM (2012) Using tri-axial acceleration data to iden-        wild polar bears (Ursus maritimus). Can J Zool 52:
   tify behavioral modes of free-ranging animals: general           1191−1198
   concepts and tools illustrated for griffon vultures. J Exp   Stirling I (1988) Polar bears. University of Michigan Press,
   Biol 215:986−996                                                 Ann Arbor, MI
Nelson RK (1966) Alaska Eskimo exploitation of the sea ice      Stirling I, Latour PB (1978) Comparative hunting abilities of
   environment. Arctic Aeromedical Laboratory, Fort Wain-           polar bear cubs of different ages. Can J Zool 56:
   wright, AK                                                       1768−1772
Obbard ME, Cattet MRL, Howe EJ, Middel KR and others            Stirling I, Spencer C, Andriashek D (1989) Immobilization of
   (2016) Trends in body condition in polar bears (Ursus            polar bears (Ursus maritimus) with Telazol® in the Cana-
   maritimus) from the Southern Hudson Bay subpopula-               dian Arctic. J Wildl Dis 25:159−168
   tion in relation to changes in sea ice. Arctic Sci 2:15−32   Stirling I, Lunn NJ, Iacozza J (1999) Long-term trends in the
R Core Team (2014) R: a language and environment for sta-           population ecology of polar bears in western Hudson Bay
   tistical computing. R Foundation for Statistical Comput-         in relation to climatic change. Arctic 52:294−306
   ing, Vienna                                                  Stirling I, Spencer C, Andriashek D (2016) Behavior and
Regehr EV, Lunn NJ, Amstrup SC, Stirling I (2007) Effects of        activity budgets of wild breeding polar bears (Ursus
   earlier sea ice breakup on survival and population size of       maritimus). Mar Mamm Sci 32:13−37
   polar bears in western Hudson Bay. J Wildl Manag 71:         Sutherland WJ (1998) The importance of behavioral studies
   2673−2683                                                        in conservation biology. Anim Behav 56:801−809
Regehr EV, Hunter CM, Caswell H, Amstrup SC, Stirling I         Taylor MK (1986) Movements of Alaskan polar bears instru-
   (2010) Survival and breeding of polar bears in the south-        mented with satellite transmitters. Int Conf Bear Res
   ern Beaufort Sea in relation to sea ice. J Anim Ecol 79:         Manage 6:103−104
   117−127                                                      Teisberg JE, Farley SD, Lynne Nelson O, Hilderbrand GV
Rekvik GES (2015) Identification of five brown bear (Ursus          and others (2014) Immobilization of grizzly bears (Ursus
   arctos) behaviors using tri-axial accelerometers. MSc            arctos) with dexmedetomidine, tiletamine, and zola-
   thesis, Telemark University College                              zepam. J Wildl Dis 50:74−83
Renous S, Gasc JP, Abourachid A (1998) Kinematic analysis       Volpov BL, Hoskins AJ, Battaile BC, Viviant M and others
   of the locomotion of the polar bear (Ursus maritimus,            (2015) Identification of prey captures in Australian fur
   Phipps, 1774) in natural and experimental conditions.            seals (Arctocephalus pusillus doriferus) using head-
   Neth J Zool 48:145−167                                           mounted accelerometers: field validation with animal-
Resheff YS, Rotics S, Harel R, Spiegel O, Nathan R (2014)           borne video cameras. PLOS ONE 10:e0128789
   AcceleRater: a web application for supervised learning       Vongraven D, Aars J, Amstrup S, Atkinson SN and others
   of behavioral modes from acceleration measurements.              (2012) A circumpolar monitoring framework for polar
   Mov Ecol 2:27                                                    bears. Ursus 23:1−66
Rode KD, Amstrup SC, Regehr EV (2010) Reduced body size         Voorhees H, Sparks R, Huntington HP, Rode KD (2014) Tra-
   and cub recruitment in polar bears associated with sea           ditional knowledge about polar bears (Ursus maritimus)
   ice decline. Ecol Appl 20:768−782                                in northwestern Alaska. Arctic 67:523−536
Rode KD, Peacock E, Taylor M, Stirling I, Born EW, Laidre       Wang Y, Nickel B, Rutishauser M, Bryce C, Williams TM,
   KL, Wiig Ø (2012) A tale of two polar bear populations:          Elkaim G, Wilmers CC (2015) Movement, resting, and
   ice habitat, harvest, and body condition. Popul Ecol 54:         attack behaviors of wild pumas are revealed by tri-axial
   3−18                                                             accelerometer measurements. Mov Ecol 3:2
Ropert-Coudert Y, Wilson RP (2005) Trends and perspec-          Ware JV, Rode KD, Pagano AM, Bromaghin J and others
   tives in animal-attached remote sensing. Front Ecol Env-         (2015) Validation of mercury tip-switch and accelerome-
   iron 3:437−444                                                   ter activity sensors for identifying resting and active
Sahanatien V, Derocher AE (2012) Monitoring sea ice habi-           behavior in bears. Ursus 26:86−96
   tat fragmentation for polar bear conservation. Anim Con-     Watanabe YY, Takahashi A (2013) Linking animal-borne
   serv 15:397−406                                                  video to accelerometers reveals prey capture variability.
Schweinsburg RE, Lee LJ (1982) Movement of four satellite-          Proc Natl Acad Sci USA 110:2199−2204
   monitored polar bears in Lancaster Sound, Northwest          Watanabe S, Izawa M, Kato A, Ropert-Coudert Y, Naito Y
   Territories. Arctic 35:504−511                                   (2005) A new technique for monitoring the detailed
Shamoun-Baranes J, Bom R, van Loon EE, Ens BJ, Ooster-              behaviour of terrestrial animals: a case study with the
   beek K, Bouten W (2012) From sensor data to animal               domestic cat. Appl Anim Behav Sci 94:117−131
You can also read