Sensors 4.0 - smart sensors and measurement technology enable Industry 4.0 - JSSS
←
→
Page content transcription
If your browser does not render page correctly, please read the page content below
J. Sens. Sens. Syst., 7, 359–371, 2018
https://doi.org/10.5194/jsss-7-359-2018
© Author(s) 2018. This work is distributed under
the Creative Commons Attribution 4.0 License.

                  Sensors 4.0 – smart sensors and measurement
                         technology enable Industry 4.0
                                 Andreas Schütze1,2 , Nikolai Helwig2 , and Tizian Schneider2
                  1 Lab for Measurement Technology, Department Systems Engineering, Saarland University,
                                              66123 Saarbruecken, Germany
           2 Centre for Mechatronics and Automation Technology (ZeMA gGmbH), 66121 Saarbruecken, Germany

                              Correspondence: Andreas Schütze (schuetze@lmt.uni-saarland.de)

                          Received: 13 November 2017 – Accepted: 25 February 2018 – Published: 9 May 2018

       Abstract. “Industrie 4.0” or the Industrial Internet of Things (IIoT) are two terms for the current (r)evolution
       seen in industrial automation and control. Everything is getting smarter and data generated at all levels of the
       production process are used to improve product quality, flexibility, and productivity. This would not be possible
       without smart sensors, which generate the data and allow further functionality from self-monitoring and self-
       configuration to condition monitoring of complex processes. In analogy to Industry 4.0, the development of
       sensors has undergone distinctive stages culminating in today’s smart sensors or “Sensor 4.0”. This paper briefly
       reviews the development of sensor technology over the last 2 centuries, highlights some of the potential that can
       be achieved with smart sensors and data evaluation, and discusses success requirements for future developments.
       In addition to magnetic sensor technologies which allow self-test and self-calibration and can contribute to many
       applications due to their wide spectrum of measured quantities, the paper discusses condition monitoring as
       a primary paradigm for introducing smart sensors and data analysis in manufacturing processes based on two
       projects performed in our group.

1   Introduction                                                    damental difference between the common approach and the
                                                                    new thinking: services and hence the value to the customer
“Industrie 4.0”, branded the fourth industrial revolution, is in    are more important than products.
fact more of a political vision than a new technical paradigm          This paper addresses the importance of sensors, instru-
(see Plattform Industrie 4.0, 2018; Hightech-Strategie: In-         mentation, and measurement science for Industry 4.0 and
dustrie 4.0, 2018; Dossier: Digitale Transformation in der          discusses potential and trends; it is based on two confer-
Industrie, 2018): it is simply the continuing progression of        ence presentations addressing smart sensors, their relevance
achieving better knowledge and control over the entire pro-         for Industry 4.0, as well as the requirement for an expanded
duction process that has been ongoing since industrialization       uncertainty evaluation (Schütze, 2015; Schütze and Helwig,
made efficient mass production possible. The main benefit           2017); a shorter German version was recently published else-
of this new way of looking at things is the chance to estab-        where (Schütze and Helwig, 2016). In the field of sensors
lish new business models. This is actually expressed better         and instrumentation the trend towards smart sensors has long
by the Anglo-Saxon term Industrial Internet of Things or            been established in aspects like better performance, higher
IIot (Industrial Internet Consortium, 2018) because it hints        integration, and multi-parameter sensing, but also built-in in-
at transferring successful business models of the new econ-         telligence as well as secure and safe networking (Gassmann
omy to industrial application; even more indicative are terms       and Kottmann, 2002; Sensor-Trends, 2014). Intelligent sen-
like digitalization or, short and pithy, Googlification. In fact,   sor systems allow e.g. self-identification or diagnosis up to
other application fields especially in consumer services are        self-configuration, calibration, and repair, often subsumed
far ahead of industrial production processes in making use of       under the term self-X (Akmal Johar and König, 2011). In
the power of digitalization. Note that this is actually one fun-

Published by Copernicus Publications on behalf of the AMA Association for Sensor Technology.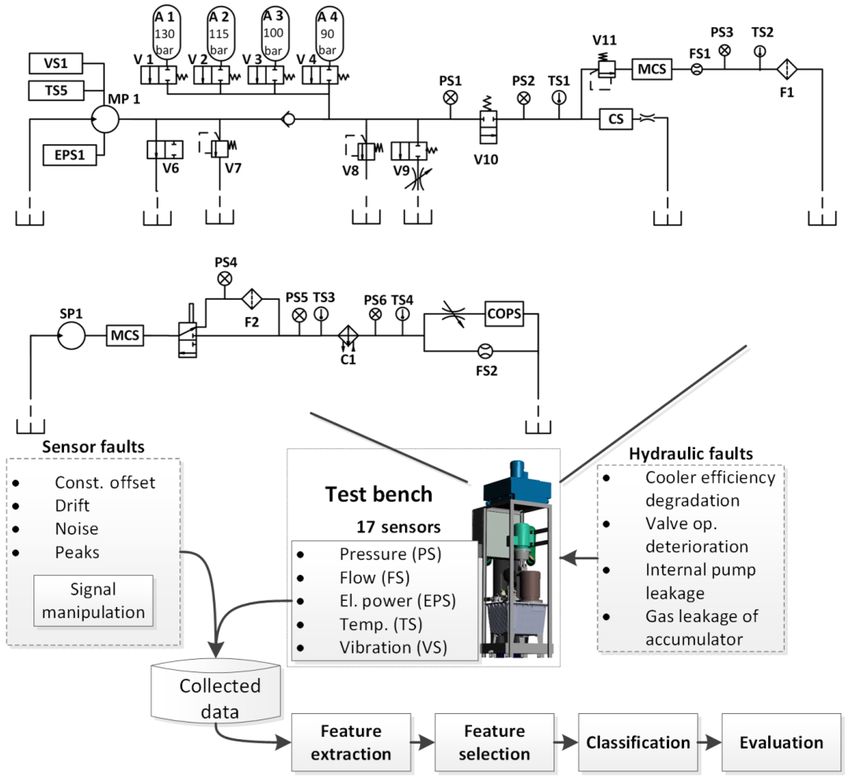
360 A. Schütze et al.: Sensors 4.0 – smart sensors and measurement technology enable Industry 4.0
analogy to Industry 4.0 the term Sensor 4.0, coined by Peter potential for self-diagnosis, which is already extensively be-
Krause, the chairman of AMA e.V. (AMA, 2018), snappily ing used in automotive applications (Ochs, 2013). This does
designates the current development in sensors and measure- not only apply to inertial sensors, where the correct function
ment science. Similar to the four phases of industrial devel- is checked with internal excitation, but also to e.g. the lambda
opment, this classification discriminates between purely me- probe: here the time constant for heating to the desired op-
chanical indicators (e.g. the aneroid barometer, also referred erating temperature is used to detect faults, e.g. cracks of
to as a Vidie can, invented by the French physicist L. Vidie in the ceramic. Self-diagnosis is especially important for appli-
1844), electrical sensors (e.g. classic strain gauges invented cations in safety and security. Fire detection and explosion
simultaneously by E. E. Simmons at Caltech and A. C. Ruge protection could not be addressed with low-cost gas sensors,
at MIT in 1937/38), the state-of-the-art electronic sensors which are prone to poisoning. Here, dynamic operation also
(e.g. electronically compensated pressure sensors available allows detection of sensor faults, e.g. poisoning of the sensor
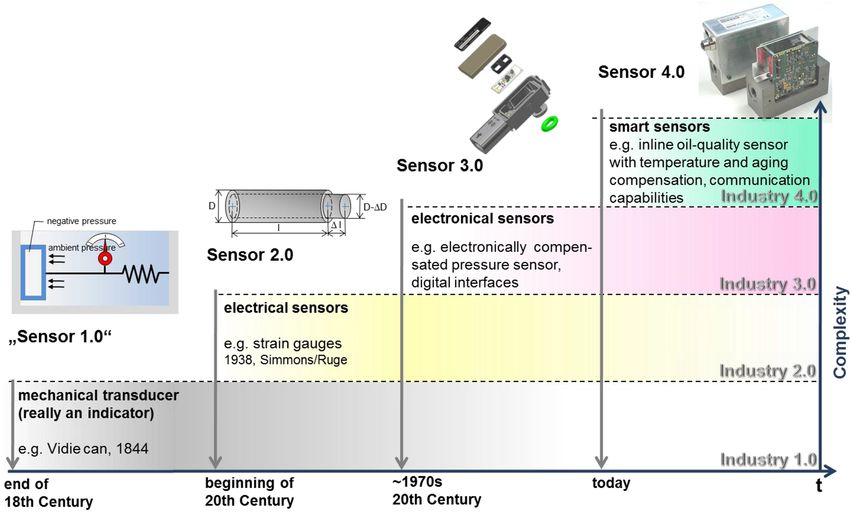
since approx. 1970), and, finally, smart sensors; cf. Fig. 1. material (Bastuck et al., 2015; Schüler et al., 2015).
This overview also shows how strongly the industrial evolu- Magnetic sensors are especially suitable for self-X meth-
tion is connected to sensors and instrumentation. Note that ods as an internal calibration can be realized by coils inte-
the importance of sensors is not limited to industrial pro- grated in the system or directly on the chip. Furthermore,
cesses, but is in fact strongly influencing all current mega- as the sensors are very small and integrated on silicon chips
trends like smart cities or smart mobility. The best exam- with good thermal conductance, heating of the sensors is
ples of highly integrated sensor platforms are in fact smart- also possible, thus allowing direct determination of thermal
phones which typically integrate around 15 different sensors cross-sensitivity. Many principles are today already imple-
and heavily make use of multisensory signal evaluation, e.g. mented in integrated Hall sensors (e.g. 3-D-HallinOne sen-
for navigation which relies on accelerometers, gyroscopes, sors developed by Fraunhofer IIS), due to their being based
magnetometers, and pressure sensors. At the same time these on standard CMOS technology, thus allowing simple integra-
sensors are also used for other services like weather monitor- tion with analogue and digital electronics (Stahl-Offergeld,
ing, screen orientation, step counting, and, last but not least, 2011). MR sensors are not yet as advanced due to the differ-
gaming. In this case, the sensors are in fact “dumb” sensors, ence in technologies for sensor chips and electronics, but the
with the integration and data fusion between different sensors potential for self-X technologies is increasingly being stud-
achieving a smart platform. ied (Akmal Johar and König, 2011; MoSeS-Pro, 2015). Note
The relevance of modern sensors and instrumentation is that future trends might include internal traceability of the
also reflected by the economic data which show a continu- sensor function by making use of quantum standards for SI
ous growth of more than 6 % CAGR in turnover from 2005 units so that sensors might be truly calibrated during opera-
to 2015 and a steady increase in jobs of almost 40 % over tion as proposed by Kitching et al. (2016) (see also NIST-on-
the same period, compared to stagnation in the industry as a-Chip, 2018).
a whole (based on an analysis by AMA). The companies in Integrated Hall sensors can serve as one specific example
this field also invest an average of 10 % of their turnover in highlighting the potential of (magnetic) sensors and their in-
research and development and are therefore attractive em- tegration with advanced modes of operation and data treat-
ployers for young engineers and physicists. ment in the sensor itself. Hall sensors are used in many
applications and are sold in large quantities at surprisingly
low cost considering their performance. While on the out-
2 State-of-the-art and current trends side these sensors still resemble the well-known simple Hall
plate, a purely analogue, current, or voltage driven sensor
A current trend in sensor technologies is the use of active with voltage output to measure the magnetic field, they are
measurement principles that are used in various sensor el- much more complicated inside. The spinning current princi-
ements and systems. Examples are magnetic sensors, e.g. ple, periodically switching driving and output contacts, has
Hall sensors using spinning current (Munter, 1990), internal already been used for a long time (Munter, 1990) to com-
calibration and even correction of offset temperature coef- pensate for various unwanted aspects (unsymmetrical ge-
ficients through integration of internal chip heaters (Stahl- ometry, variations in doping of the Hall layer, mechanical
Offergeld, 2011), MR sensors using the compensation prin- strain, and temperature differences), which would otherwise
ciple to suppress temperature cross-sensitivity (Marien and result in large offsets and therefore reduced resolution (Stahl-
Schütze, 2009), micromechanical accelerometers (also us- Offergeld, 2011). Even after spinning current compensation
ing compensation or internal calibration methods) and gy- which is achieved by typically four measurements with cur-
roscopes (using the Coriolis effect with active vibration exci- rent induced in all four directions of the Hall plate and sub-
tation), and Coriolis-based flow sensors or chemical sensors sequent averaging of the results, a residual, temperature-
using temperature modulation for improved selectivity, sen- dependent offset remains. By integrating a small excitation
sitivity, and stability (Reimann and Schütze, 2014; Baur et coil directly on the chip this offset can be determined dur-
al., 2015). Active modes of operation also offer additional ing normal operation. In addition, a small heater can also be
J. Sens. Sens. Syst., 7, 359–371, 2018 www.j-sens-sens-syst.net/7/359/2018/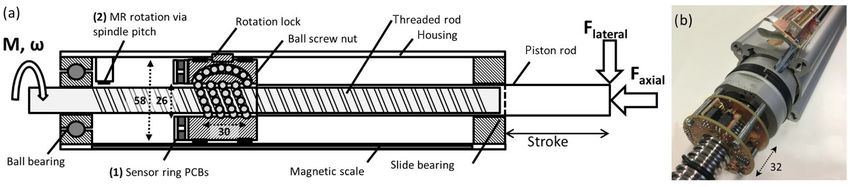
A. Schütze et al.: Sensors 4.0 – smart sensors and measurement technology enable Industry 4.0                                        361

Figure 1. Historic evolution from “Sensor 1.0” (without electrical output this is not a sensor according to the usual definition) to smart
sensors, i.e. “Sensor 4.0” (based on Peter Krause, chairman of AMA e.V.).

integrated on the chip, which can induce small temperature             full physical model were to be considered. In this case, a suit-
changes to determine the temperature coefficient (TC) of the           able statistical approach for determination of the uncertainty
offset, thus allowing a digital correction of the temperature-         would seem more suitable.
dependent offset with a linear model. To achieve offset com-              Thus, smart sensors with additional functionality provide
pensation over a wide operating temperature range, this pro-           a significant added value for higher-level functions, e.g. in
cedure can be repeated at different ambient temperatures.              production systems. The correct sensor function is also re-
The resulting residual offset and thus the effective resolu-           quired for the condition monitoring of complex systems (see
tion of the sensor is greatly improved by this procedure               Sect. 3 below). In this case, the correlation of sensor data
by more than 1 order of magnitude from ±1 mT down to                   within the system can also be used to verify the correct sen-
±50 µT (Stahl-Offergeld et al., 2009; Stahl-Offergeld, 2011).          sor function; however, in this case, the sensor fault diagnosis
However, due to cost restraints the sensor only contains one           has to be performed on a higher level within the system.
AD converter, which means that chip temperature and Hall                  Additional trends that will be initiated or at least pushed
voltage cannot be measured simultaneously. To avoid er-                further by the Industry 4.0 paradigm are the following.
rors in the determination of the offset TC the thermal be-
haviour of the chip is therefore modelled with several time               – Measurement as a service: this could be a trend similar
constants. Furthermore, several measurements during this                    to the service provided by Uber in public transport, i.e.
self-calibration and a statistical evaluation of the resulting              measurement services or even individual results are sold
variations are used to check whether the applied external                   instead of instruments. Note that the measurement un-
field has changed during this procedure, which could lead                   certainty – determined online by self-calibration – will
to false values for offset and offset TC; for further details,              then influence the price.
the reader is referred to Stahl-Offergeld et al. (2009). In ad-
                                                                          – Traceability of individual components down to screws,
dition, other production-related parameters of the sensor chip
                                                                            individual gears and even gaskets: this additional
can be determined with a suitable strategy combining on-chip
                                                                            knowledge will allow tolerance measurement in the as-
measurements and digital evaluation (Stahl-Offergeld et al.,
                                                                            sembly of (sub-)systems and is also required for a com-
2010; Stahl-Offergeld, 2011). This example shows that even
                                                                            prehensive condition monitoring to assess the influence
a seemingly simple Hall sensor today determines the required
                                                                            of individual processing steps and machines on the final
measurement value based on a complex digital process. Note
                                                                            result.
that a strict determination of the resulting measurement un-
certainty based on the GUM principles (GUM, 2008) would                   – Self-learning systems: the correlation between sensor
result in a very complex process if the complete system and a               data as well as other process and ambient parameters

www.j-sens-sens-syst.net/7/359/2018/                                                         J. Sens. Sens. Syst., 7, 359–371, 2018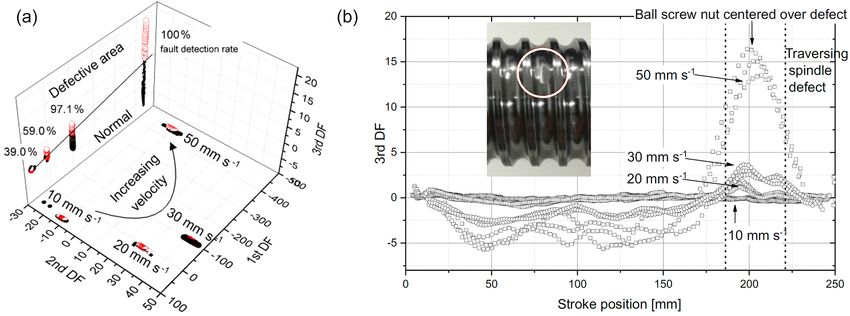
362                       A. Schütze et al.: Sensors 4.0 – smart sensors and measurement technology enable Industry 4.0

      can be evaluated to ensure the correct function of the       artificial neural networks (ANNs). Note that pre-processing
      system in the sense of a system self-diagnosis by mak-       and feature extraction are realized with unsupervised meth-
      ing use of machine learning (Cachay and Abele, 2012).        ods, i.e. without making use of the system status, while fea-
      So far it is unclear whether unsupervised methods are        ture selection – here based primarily on Pearson correlation
      sufficient or whether supervised learning, see Sect. 3       of features and fault status – and LDA projection are super-
      below, is required, i.e. knowledge of the current system     vised methods, i.e. require the knowledge of the system sta-
      status for training the evaluation.                          tus (Helwig and Schütze, 2014). The evaluation is based on
                                                                   a comprehensive training phase in which all combinations
    – Semantic technologies for analysis of complex systems:       of all fault states are measured. The complete training is
      interpretation of measurement values beyond the purely       based on several thousand working cycles and requires ap-
      data-based approaches could offer further opportunities,     prox. 3 days, primarily due to the relatively slow equilibra-
      e.g. for plausibility checks of sensor data and for pro-     tion of the temperature after changing the cooling efficiency.
      viding confidence values for (fault) causes. Note that the   The complete training data set contains almost 120 million
      World Wide Web consortium (W3C) started working on           raw data points. A systematic validation, e.g. based on k-fold
      a semantic sensor network ontology as early as 2005          cross-validation, completes the development of the statistical
      which allows representation of measurement values and        model and ensures that no overfitting occurs in spite of the
      their significance (Semantic Sensor Network Ontology,        high-dimensional input data set and the supervised training
      2017).                                                       methods (Helwig and Schütze, 2014).
                                                                      In this example statistical methods were primarily used for
   The last example shows that the importance of sensors and       feature extraction. The working cycle was divided into 13
measurement technology was recognized also by other par-           sections (complete cycle and 12 sections representing differ-
ties, which leads to some parallel and independent develop-        ent constant or changing pressure levels, respectively) and
ments. Interestingly, however, aspects like measurement un-        the first four statistical moments (mean, standard deviation,
certainty and sensor self-monitoring are not addressed in the      skewness, and kurtosis) were determined for each sensor in
context of semantic technologies even though semantic rep-         each section. This can be implemented on low-cost hardware
resentation would be highly valuable especially for these as-      very efficiently, but is still the computationally most costly
pects.                                                             step of the training procedure. This step requires a few min-
                                                                   utes on a standard PC for the complete data set with sev-
3    New measurement paradigm: condition                           eral 1000 cycles. The resulting almost 900 features (17 sen-
     monitoring using data-based modelling                         sors · 13 sections · 4 statistical moments) result in a feature
                                                                   space that still has too many dimensions for efficient clas-
The potential of data-based sensor signal evaluation is            sification. Therefore, feature selection based on correlation
demonstrated by the iCM Hydraulics project (2013). In this         between features and target classes, i.e. fault level, is used
project a hydraulic model system combining a primary cir-          which is computationally extremely efficient, same as the
cuit with variable load and a secondary circuit for cooling        calculation of the LDA projection to obtain the 2-D plots, cf.
and filtration were used to study the identification of typical    Fig. 3, or ideally only one discriminant function (DF) per sys-
system faults (internal pump leakage, delayed valve switch-        tem fault. These two computation steps only require fractions
ing, pressure leakage in the accumulator, reduced cooling ef-      of a second. Even faster is the classification of a new working
ficiency) only based on an evaluation of the usual process         cycle, i.e. extraction of the selected features, projection in the
sensors (pressure flow rate, temperature, electrical power).       LDA space for each system fault, and classification based on
   Figure 2 provides an overview of the approach: the hy-          a k-nearest neighbour classifier, which can thus be performed
draulic system is equipped with a total of 17 physical and         in real time even on a low-cost microcontroller-based system.
virtual (e.g. efficiency calculated from electrical power in-         The performance of the approach is shown in Fig. 3 for
put and hydraulic power output) sensors, which are read out        the four studied system faults: each fault state can be identi-
with up to 100 Hz. The system was used to simulate a peri-         fied independently and its severity or level can be estimated
odic industrial process with a work cycle of 1 min duration.       with surprisingly high accuracy. The cooler efficiency, for ex-
In each cycle a total of approx. 50 000 raw values is recorded,    ample, can be estimated with better than 10 % (the reduced
which are interpreted as a high-dimensional measurement            cooler efficiency was simulated with pulse width modulation
vector. A multi-step dimensionality reduction covering sig-        of the power supply, and the percentage gives the duty cycle
nal pre-processing, feature extraction, and selection yields       used); the accumulator pressure can be determined with an
a projection obtained by linear discriminant analysis (LDA)        uncertainty of approx. 5 bar. Projected test data which were
(Duda et al., 2000), which allows classification of the sys-       not used to build the model (open symbols) show that the
tem status, i.e. identification and quantification of the fault.   model allows correct classification of unknown states and
Classification can be performed with various methods, e.g.         even that an extrapolation of data outside the training range
k-nearest neighbours, support vector machines (SVMs), or           is possible within limits.

J. Sens. Sens. Syst., 7, 359–371, 2018                                                   www.j-sens-sens-syst.net/7/359/2018/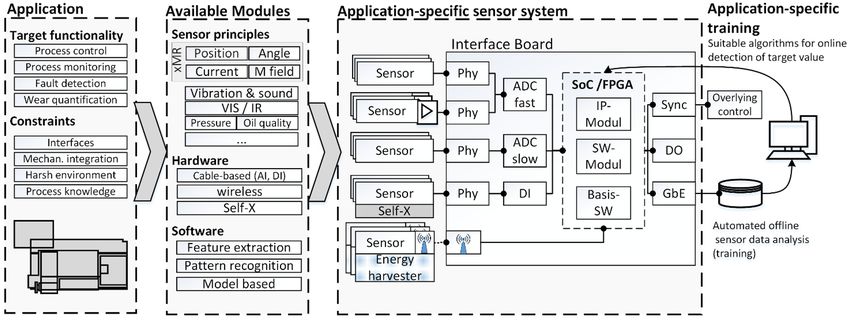
A. Schütze et al.: Sensors 4.0 – smart sensors and measurement technology enable Industry 4.0                                            363

Figure 2. Hydraulic system and concept for the data analysis within the iCM-Hydraulics project (Helwig and Schütze, 2015). A statistical
model was built allowing for independent identification of various hydraulic system faults as well as identification of sensor defects. System
condition monitoring remained possible even with sensor faults by excluding the identified faulty sensors from the analysis.

   In further experiments we have shown that the training can            fective sensor(s) from the evaluation and making use of the
be transferred from one system to a second, identical sys-               remaining sensors. In fact, up to five of the most important
tem after some calibration, i.e. shift of the LDA projections            sensors can be excluded from the evaluation and still a cor-
for the correct system state (Helwig et al., 2015a). Given the           rect classification rate of more than 80 % is achieved (Helwig
high performance which was not expected when designing                   and Schütze, 2015).
the experiments, we also studied how sensor faults would in-                The projection shown in Fig. 4a can also be presented in a
fluence the classification results. For this, sensor offset, drift,      different way, as the second discriminant function (DF2) ob-
noise and signal drop-outs were simulated in the recorded                viously does not provide relevant information for the offset
data for all sensor channels and the resulting data were used            classification. Plotting the data as a histogram results in the
to classify the system state. Not surprisingly, the classifica-          plot shown in Fig. 5 which shows nearly normal distributions
tion rate is drastically reduced, especially for monitoring of           for all six classes with a constant FWHM (full width at half
pump leakage and the hydraulic accumulator. To allow au-                 maximum) or standard deviation. Thus, this projection could
tomatic recognition of sensor faults, these were defined as              be used not only to determine or “measure” the sensor offset;
new targets for the classification algorithm and trained using           it also provides an estimate for the uncertainty with which
the same completely automated approach. Again, the simu-                 this offset can be determined, considering only type A un-
lated sensor faults could be recognized with high reliability            certainties. Note that this also holds for the two classes with
independent of the system state as shown in Fig. 4 for two               2 and 10 bar offset, which were not used for calculating the
exemplary sensor faults. In fact, sensor faults can be diag-             LDA, i.e. building the statistical model.
nosed before they lead to false classification of the system                Similarly, the histogram for the accumulator pressure
state (Helwig and Schütze, 2015). Correct classification of              shown in Fig. 6 also yields a constant standard deviation,
the overall system state is still possible by excluding the de-          which increases with increasing temperature range, thus in-

www.j-sens-sens-syst.net/7/359/2018/                                                           J. Sens. Sens. Syst., 7, 359–371, 2018
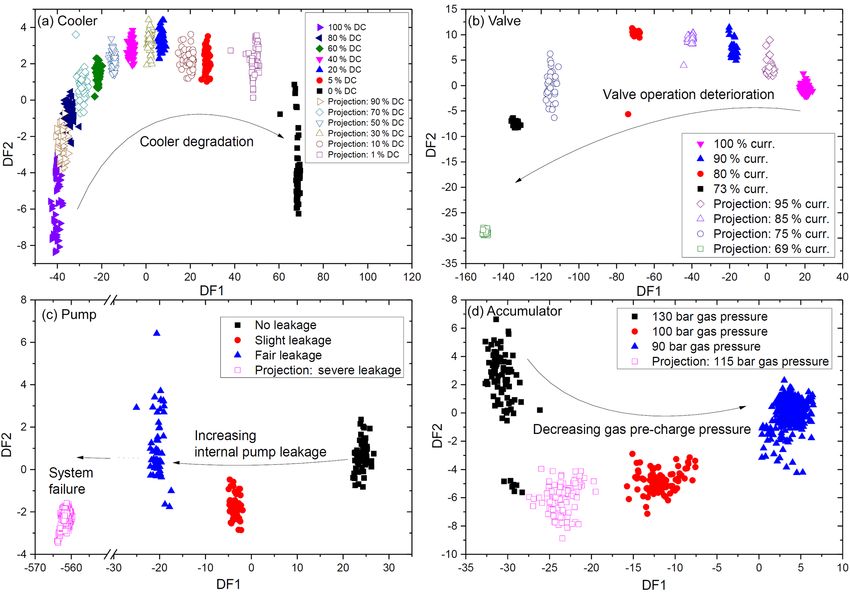
364                        A. Schütze et al.: Sensors 4.0 – smart sensors and measurement technology enable Industry 4.0

Figure 3. Results for determination of the four system faults studied: cooler degradation (a), valve operation (b), internal pump leakage (c),
and accumulator pressure (d). Full symbols show data used for determining the statistical model, and open symbols show additional test data
not used in the training which prove that unknown data are interpreted correctly (Helwig and Schütze, 2015).

dicating a measurement uncertainty depending on ambient                  tures would depend drastically on location and weather con-
conditions, which is quite common for many sensors. This                 ditions. In this case, either an expanded training over the full
also shows that the performance of the condition monitor-                operating temperature range would be required or perhaps
ing approach deteriorates drastically when the temperature               several different projections selected based on the relevant
of the system, or more specifically the temperature of the               temperature level. In any case, training effort would increase
hydraulic oil and with it the viscosity, changes over a wide             to allow universal condition monitoring.
range. While the accumulator pressure can be estimated with                 The examples shown here clearly demonstrate the poten-
an uncertainty of less than ±5 bar for a temperature range               tial of data-based statistical modelling for condition moni-
of 10 ◦ C, an increase in the temperature range to 20 ◦ C leads          toring of complex systems purely based on existing process
to significant overlap between the different classes with an             sensors. Thus, a cost-efficient and powerful monitoring can
uncertainty of at least ±10 bar. Note that narrowing the tem-            be achieved which allows interpretation of the results also
perature range further does not reduce the uncertainty cor-              in terms of the measurement uncertainty of the systems sta-
respondingly, probably due to noise of the sensor data con-              tus, i.e. the uncertainty is nearly constant over the full range
tributing to this result (remember that an discriminant func-            from a system in mint condition to near failure, but the un-
tion is a weighted sum of different features, i.e. sensor val-           certainty increases if additional factors, in this case signif-
ues). To take this effect into account the training of the statis-       icant changes in the oil temperature, have to be taken into
tical model would either need to be extended to include data             account. Note, however, that this does not apply to all system
over a wide (oil) temperature range or the exact interpretation          faults. In this example a varying uncertainty was observed
of the system condition can only be done in a typical oper-              for the valve switching behaviour which increased over the
ating window. The latter approach is surely better suited for            monitored range, which might be due to a non-linear relation
typical industrial applications, especially as a full condition          between features and resulting discriminant function and the
monitoring is not required with high temporal resolution, i.e.           fault status. Even more problematic is the observation that
for classification of wear processes, due to the normally slow           the variation of results for test data does not show a nor-
progression of the system deterioration. On the other hand, if           mal distribution, i.e. a simple interpretation of the standard
this approach were to be used for mobile (hydraulic) machin-             deviation as measurement uncertainty is not possible, and,
ery, i.e. loaders, the ambient and also the operating tempera-

J. Sens. Sens. Syst., 7, 359–371, 2018                                                          www.j-sens-sens-syst.net/7/359/2018/
A. Schütze et al.: Sensors 4.0 – smart sensors and measurement technology enable Industry 4.0 365
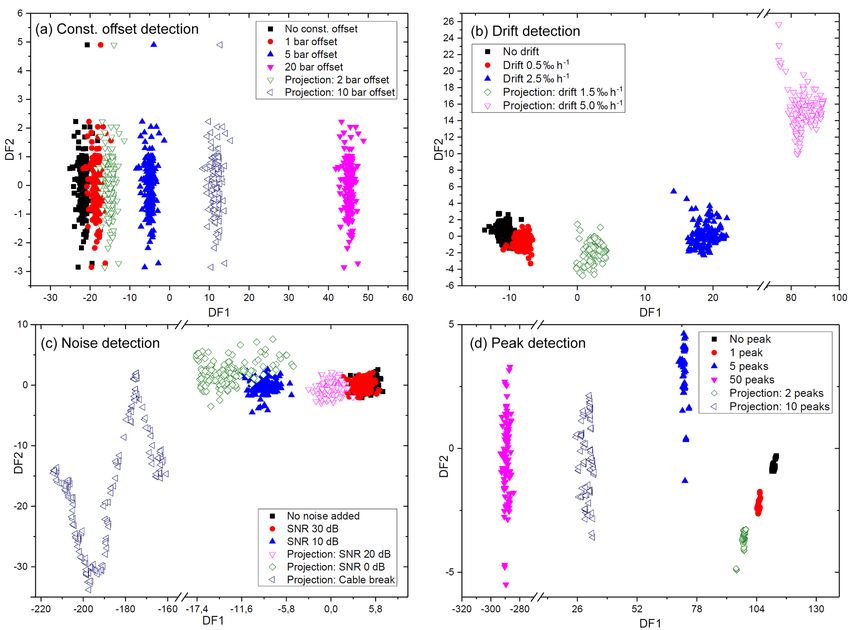
Figure 4. Results for identification of sensor faults offset (a), drift (b), noise (c) and peaks (signal drop-outs, d). Full symbols show data
used in determining the model for the sensor faults diagnosis, and open symbols show additional data not used in the training, which again
proves that unknown data are interpreted correctly (Helwig and Schütze, 2015).
Figure 5. Plotting the data from the LDA analysis as a histogram of the first discriminant function (DF) shows that this projection results
in a linear relationship allowing determination of the sensor offset. An estimate of the uncertainty for the offset is also possible due to the
constant standard deviation of the data; note that this includes data at 2 and 10 bar offset, which were not used for building the statistical
model.
furthermore, the interpretation of the statistical results as a toolbox. In this project (MoSeS-Pro, 2015) magnetoresis-
“measurement” of the system state might not be justified. tive sensors (AMR, GMR, and especially TMR) are primar-
ily used to measure current, position, and angle, but other
(micro)sensors, e.g. MEMS sensors for vibration, pressure,
4 A modular approach for smart sensor networks or thermal radiation, are also used to extend the measure-
and condition monitoring ment spectrum. These sensors are also integrated into com-
ponents and subsystems (Helwig et al., 2017b) to allow im-
The successful preliminary work in iCM Hydraulics resulted proved performance and condition monitoring, both as an
in the establishment of a successor project, in which the de- end-of-line test in their production and during their opera-
veloped methods are transferred to an open sensor system
www.j-sens-sens-syst.net/7/359/2018/ J. Sens. Sens. Syst., 7, 359–371, 2018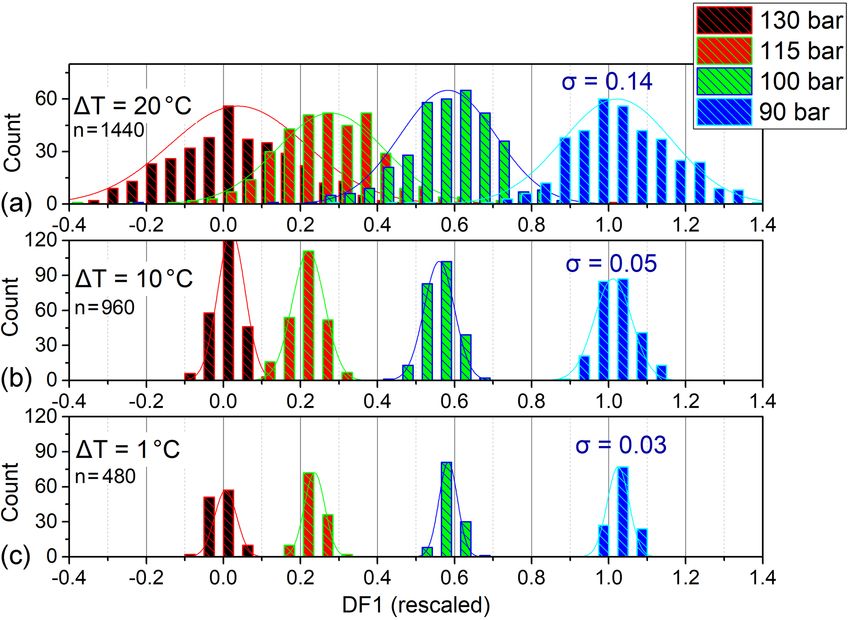
366                        A. Schütze et al.: Sensors 4.0 – smart sensors and measurement technology enable Industry 4.0

                                                                        able features and feature combinations, i.e. simple correla-
                                                                        tion analysis or recursive feature elimination support vector
                                                                        machines (RFESVMs) for linear or RELIEFF for non-linear
                                                                        separability (Schneider et al., 2017). In this way, the signal
                                                                        processing software as part of the sensor kit is realized in
                                                                        a highly modular design since heterogeneous sensors differ
                                                                        significantly regarding signal shape, time and spatial resolu-
                                                                        tion, and target information to be extracted.
                                                                           An example of the application of this toolbox is shown
                                                                        in Figs. 9 and 10. A miniaturized sensor system prototype
                                                                        was designed for integration in an electromechanical cylin-
                                                                        der (EMC). These are increasingly applied as feed drives in
                                                                        machine tools, due to their unique combination of high loads,
                                                                        precision, and flexibility. The sensor system contains a range
                                                                        of (partially redundant) sensors (linear and rotary encoders,
                                                                        3-D accelerometers, microphone, temperature and IR radia-
Figure 6. Histogram of the sensor data/features for classification of   tion sensors). Currently, the sensor prototype consists of two
the accumulator pressure vs. first discriminant function. Here, the
                                                                        separate subsystems: first, two stacked sensor printed circuit
data were rescaled (compare Fig. 3d) to centre values for 130 bar
                                                                        boards (PCBs) (Fig. 9) mounted on the front surface of the
(nominal pressure) at 0 and data for 90 bar at 1. The standard devia-
tion for small temperature range (c) seems to be determined by noise    ball screw inside the EMC housing (Festo ESBF-BS-63-400-
from the sensors/features, while it is strongly influenced by varia-    5P, ∅ 63 mm, 400 mm stroke, 5 mm spindle pitch, axial load
tions of the oil temperature for increasing temperature range (a).      max. 7 kN) containing in total nine MEMS sensors. Further-
                                                                        more, the rotary position of the spindle shaft is measured by
                                                                        an AMR Wheatstone bridge sensor (Doms and Slatter, 2014)
tion in manufacturing systems. In this project, modular elec-           with external bias magnet generating the support field which
tronics and software algorithms are developed, allowing the             interacts with ferromagnetic teeth of the spindle shaft. This
required signal pre-processing and feature extraction directly          sensor is positioned at a fixed position in the cylinder housing
in the smart sensor. Otherwise, signals recorded at high fre-           close to the ball bearing (cf. Fig. 1a) pointing to the thread
quencies of several 100 MHz would result in data rates which            with a working distance of 1 mm. During rotation, the rela-
would overload the higher levels. In addition, novel self-X             tive position of sensor and teeth changes, periodically result-
methods, wireless sensor interfaces, and energy harvesting              ing in sine and cosine sensor signals.
are developed for easy integration and initialization of sys-              To evaluate the sensor system in a condition monitor-
tem operation. Figure 7 gives an overview of the modular                ing scenario, we induced a local abrasion of the spindle at
approach.                                                               stroke position 185 mm and recorded several stroke move-
   As shown above, statistical data analysis is a powerful tool         ments with varying velocity and three repetitions. For sig-
for condition and process assessment without firm and de-               nal processing, short-time Fourier transform (STFT) was ap-
tailed expert knowledge since most of the underlying algo-              plied (length 10 000/overlap 2000 samples) with subsequent
rithms are self-optimizing and can be concentrated in auto-             feature extraction and selection as previously demonstrated
mated signal processing chains. However, this approach, es-             (Helwig et al., 2015b). Feature extraction captures a total of
pecially in the case of supervised learning, requires a suffi-          210 statistical parameters such as median, variance, skew-
cient quality of training data, i.e. typically cyclical process-        ness, and kurtosis in different intervals of the amplitude spec-
synchronized sensor data which are annotated with corre-                tra of three acceleration axes. The features are selected by
sponding classes, i.e. the target vector for which the statis-          F -value ranking of univariate ANOVA and dimensionally re-
tical model is to be trained. The typical steps for offline anal-       duced to three discriminant functions (DFs) using LDA to
ysis (Fig. 8a) are signal pre-processing, feature extraction,           obtain the maximum class separation. The latter algorithms
and selection as well as classification with subsequent eval-           are supervised learning methods, i.e. require class-annotated
uation and can be interpreted as a gradual dimensionality               data which were given as velocity information and a local
reduction. Feature extraction and selection can be fully au-            spindle condition traversed by the spindle nut. Figure 10a
tomatized using a modular approach based on complemen-                  shows the resulting 3-D projection of sensor data with the
tary algorithms to extract information from the time domain,            planes DF1–DF2 and DF1–DF3 separating the different ve-
i.e. with adaptive linear approximation (ALA), from the fre-            locity levels and spindle conditions, respectively. Here, the
quency domain, i.e. with Fourier analysis, from the time–               velocity classes with 10, 20, and 50 mm s−1 , respectively,
frequency domain, i.e. using wavelet analysis, or the overall           were used for training and the class with 30 mm s−1 veloc-
system, i.e. based on principal component analysis (PCA).               ity was used for evaluation. The intermediate velocity class
Similarly, complementary techniques are used to select suit-            fits well into the data-based model and the fault identification

J. Sens. Sens. Syst., 7, 359–371, 2018                                                       www.j-sens-sens-syst.net/7/359/2018/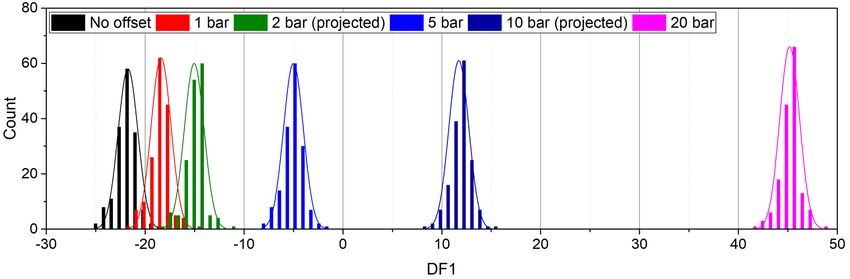
A. Schütze et al.: Sensors 4.0 – smart sensors and measurement technology enable Industry 4.0                                         367

Figure 7. Application-specific design of the modular MoSeS-Pro sensor system kit combining various (micro-)sensors, especially xMR
sensors, but also MEMS vibration, sound, pressure or IR radiation sensors, with electronics for data acquisition and pre-processing as well
as communication interfaces in application-specific sensor systems (Helwig et al., 2017a).

Figure 8. (a) Typical steps for offline data analysis and approximation of an exemplary sensor signal with different complimentary feature
extraction methods: (b) adaptive linear approximation, (c) principal component analysis and (d) best wavelet coefficients using the largest
Daubechies-4 wavelet coefficients (BDW: best Daubechies wavelet); in each case, X shows the original signal and X’ the approximated
signal using 16 (b) and 8 (c, d) features, respectively.

rate improves with increasing velocity. Figure 10b shows the            olution, two local maxima can be seen indicating the entry
plot of DF3 over stroke position clearly indicating the de-             and exit points of the spindle nut passing over the defect.
fect. The maximum is blurred, first, due to the interaction of          This example shows that the stroke position dependent anal-
balls and spindle defect over a distance of 30 mm and, sec-             ysis of signals can be used for fault diagnosis differentiating
ond, also results from the STFT temporal blur. Furthermore,             between local anomalies such as defects of the spindle and
especially at low speeds with accordingly higher local res-

www.j-sens-sens-syst.net/7/359/2018/                                                         J. Sens. Sens. Syst., 7, 359–371, 2018
368                        A. Schütze et al.: Sensors 4.0 – smart sensors and measurement technology enable Industry 4.0

Figure 9. (a) Mechanical integration of the sensor system inside the EMC and (b) realization of the stacked sensor ring PCBs with the
spindle shaft inside a disassembled cylinder (Helwig et al., 2017b).

global disturbances, e.g. of the ambient. For further details,         plications. Today, Google already provides the best traffic
the reader is referred to Helwig et al. (2017b).                       data based on mobile phone data with much better actuality
   To make full use of the MoSeS-Pro approach, data pre-               and precision than classic traffic monitoring based on ded-
processing and feature extraction need to be integrated into           icated sensors. In this application the network plays an im-
the sensor system to reduce the data load in the network and           portant role and of course the amount of data: while indi-
the cloud. However, this modular approach can also be used             vidual movement data provide low quality, data fusion of a
to design cost-efficient sensor systems for smart monitoring           large number of movements provides the required informa-
applications. In this case, a complete “over-instrumented”             tion. Similar effects can in the future also be expected for
sensor set is used and the full sensor data are evaluated with         environmental data, i.e. air quality, when gas sensors are in-
the automated approach described above. Using the fairly               tegrated into smartphones in large numbers. The field of sen-
simple and transparent algorithms allows identification of             sors and measurement science and especially the research
relevant sensors and features and, thus, the necessary acqui-          community have to address this challenge to ensure that fu-
sition bandwidth using an offline analysis. On this basis a            ture standards are still set by GMA (VDI/VDE-Gesellschaft
greatly simplified sensor system can be defined for practical          Mess- und Automatisierungstechnik), DKE (Deutsche Kom-
application. This approach would also allow us to choose an            mission Elektrotechnik Elektronik Informationstechnik), and
application-specific balance between sensor redundancy, i.e.           AMA (in Germany), as well as BIPM, CEN/CENELEC and
to achieve robust operation as shown in Sect. 3, and cost ef-          ISO worldwide, and not in Silicon Valley.
ficiency.                                                                 A possible approach for the sensor and measurement sci-
                                                                       ence community to play a bigger role in this development of
                                                                       Industry 4.0 might be the area of measurement uncertainty,
5   Conclusion and outlook                                             which is simply not addressed by the computer science com-
                                                                       munity today. In addition to making use of quantum stan-
Sensors and instrumentation are central driving forces for             dards integrated in smart sensors, an expanded view of the
innovation, not only for Industry 4.0, but also for other              Guide for Expression of Uncertainty in Measurement (GUM,
megatrends that are described with the adjective smart, e.g.           2008) taking into account sensor data fusion and statistical
smart factory, smart production, smart mobility, smart home,           modelling is highly desirable to make full use of the undis-
or smart city. Intelligent decisions of complex systems are            puted potentials and to continue with the success story of in-
based on the knowledge of the system as well as ambient                dustrial production in high cost countries, which is one of the
conditions and influence factors provided with high accu-              promises of Industry 4.0. Condition monitoring of complex
racy by sensors. The importance of sensors, measurement                production systems – from a single hydraulic press to a com-
science, and smart evaluation for Industry 4.0 has been rec-           plete factory with assembly and test systems – can be one
ognized and acknowledged by various authors (Imkamp et                 paradigm for the development of sensors and measurement
al., 2016; Sommer and Schütze, 2016; Walter, 2017) and                 science for Industry 4.0 as this immediately offers many eco-
has already led to the statement “Industry 4.0: nothing goes           nomic advantages but can also be used for developing and
without sensor systems” (“Industrie 4.0: Ohne Sensorsys-               testing new business models. A highly important aspect here
teme geht nichts”) (Arnold, 2014). It should be acknowl-               is data security and with it the question of who owns which
edged that notwithstanding all the euphoria and expectations           data and who has a right to access certain data. Consider a
for higher sensor production and sales volumes – especially            critical component being monitored in a complex production
when thinking about the Trillion sensor roadmap (Bryzek,               process: while the raw data are produced in the factory, the
2013) – paradigm changes are expected, as is often the case            know-how for their interpretation lies with the component
in the digital revolution. Completely new business models              manufacturer. Forwarding complete process raw data to the
like Uber and AirBnB already also exist in some sensor ap-

J. Sens. Sens. Syst., 7, 359–371, 2018                                                      www.j-sens-sens-syst.net/7/359/2018/
A. Schütze et al.: Sensors 4.0 – smart sensors and measurement technology enable Industry 4.0 369
Figure 10. (a) LDA projection of 30 selected vibration features, n = 2883, with training based on velocity classes 10, 20, and 50 mm s−1 ;
classification rate determined for the Mahalanobis distance classifier with 10-fold cross-validation. (b) Deliberate abrasion as a local defect
on the spindle and corresponding signal of DF3 vs. stroke position (moving average over 10 data points) (Helwig et al., 2017b).
component manufacturer is usually not an option, as this will Special issue statement. This article is part of the special issue
also include confidential data, e.g. the production volume, “Evaluating measurement data and uncertainty”. It is not associated
from the factory. A successful business model will therefore with a conference.
require a certain level of trust between the involved partners
but also a suitable abstraction level of the data from the com-
ponent which would allow the required condition monitoring Acknowledgements. The iCM-Hydraulics project received
but no further insights into the confidential production pro- funding through the EFI programme (support of development, re-
search, and innovation in Saarland), and the research by ZeMA was
cess. This will of course be even more complicated if sev-
financed by HYDAC Filter Systems GmbH (Sulzbach, Germany).
eral component and sensor providers are involved to achieve The MoSeS-Pro project is sponsored by the German Federal
the holistic condition monitoring approach based on data fu- Ministry of Education and Research in the call Sensor-based
sion. Perhaps this will lead to a new approach in data ware- electronic systems for applications for Industrie 4.0 – SElekt I 4.0,
house management with a novel type of neutral smart service funding code 16ES0419K, within the framework of the German
provider to perform data anonymization and/or data analysis Hightech Strategy.
for all involved parties.
Edited by: Klaus-Dieter Sommer
Reviewed by: three anonymous referees
Data availability. The data are available in the UCI machine learn-
ing repository: https://archive.ics.uci.edu/ml/datasets/Condition+
monitoring+of+hydraulic+systems.
References
Author contributions. NH was responsible for the iCM- Akmal Johar, M. and König, A.: Case Study of an Intelligent AMR
Hydraulics project and performed the measurements and Sensor System with Self-x Properties, in: Soft Computing in In-
evaluations presented in Sect. 3. NH (hardware) and TS (software) dustrial Applications, edited by: Gaspar-Cunha, A., Takahashi,
were jointly responsible for the modular condition monitoring R., Schäfer, G., and Costa, L., Springer, Berlin Heidelberg, 337–
(CM) toolbox developed within the MoSeS-Pro project and the 346, https://doi.org/10.1007/978-3-642-20505-7_30, 2011.
results presented in Sect. 4. AS coordinated the research within AMA Association for Sensors and Measurement (AMA Verband
both projects and wrote the manuscript. für Sensorik und Messtechnik e.V., originally Arbeitsgemein-
schaft Messwertaufnehmer), available at: http://ama-sensorik.de/
en, last access: 10 March 2018.
Competing interests. Andreas Schütze is a member of the edito- Arnold, H.: Kommentar Industrie 4.0: Ohne Sensorsysteme geht
rial board of the journal. nichts, available at: http://www.elektroniknet.de/messen-testen/
sonstiges/artikel/110776/ (last access: 10 March 2018), 2014.
Bastuck, M., Schütze, A., and Sauerwald, T.: A new
approach to self-monitoring of amperometric oxy-
gen sensors, Sensors and Actuators B 214, 218–224,
https://doi.org/10.1016/j.snb.2015.02.116, 2015.
www.j-sens-sens-syst.net/7/359/2018/ J. Sens. Sens. Syst., 7, 359–371, 2018370 A. Schütze et al.: Sensors 4.0 – smart sensors and measurement technology enable Industry 4.0 Baur, T., Schütze, A., and Sauerwald, T.: Optimierung des temper- Hightech-Strategie: Industrie 4.0; available at: http://www. aturzyklischen Betriebs von Halbleitergassensoren, Tech. Mess., hightech-strategie.de/de/Industrie-4-0-59.php, last access: 10 82, 187–195, https://doi.org/10.1515/teme-2014-0007, 2015. March 2018. Bryzek, J.: Roadmap for the Trillion Sensor Universe, iN- iCM Hydraulics – Data-based intelligent condition monitoring for EMI Spring Member Meeting and Webinar, Berkeley, CA, 2 hydraulic systems; project funded in the EFI program of Saar- April, available at: http://www-bsac.eecs.berkeley.edu/scripts/ land, subcontract by HYDAC Filter Systems GmbH, performed show_pdf_publication.php?pdfID=1365520205 (last access: 10 at Centre for Mechatronics and Automation gGmbH (ZeMA), March 2018), 2013. 2013–2015. Cachay, J. and Abele, E.: Developing Competencies for Continuous Imkamp, D., Berthold, J., Heizmann, M., Kniel, K., Manske, E., Improvement Processes on the Shop Floor through Learning Fac- Peterek, M., Schmitt, R., Seidler, J., and Sommer, K.-D.: Chal- tories – Conceptual Design and Empirical Validation, Procedia lenges and trends in manufacturing measurement technology – CIRP, 3, 638–643, https://doi.org/10.1016/j.procir.2012.07.109, the “Industrie 4.0” concept, J. Sens. Sens. Syst., 5, 325–335, 2012. https://doi.org/10.5194/jsss-5-325-2016, 2016. Digitale Transformation in der Industrie, available at: http:// Industrial Internet Consortium, available at: http://www. bmwi.de/DE/Themen/Industrie/industrie-4-0.html, last access: iiconsortium.org, last access: 10 March 2018. 10 March 2018. Kitching, J., Donley, E. A., Knappe, S., Hummon, M., Dellis, A. Doms, M. and Slatter, R.: Magnetoresistive sensors for T., Sherman, J., Srinivasan, K., Aksyuk, V. A., Li, Q., Westly, angle, position, and electrical current measurement D., Roxworthy, B., and Lal, A.: NIST on a Chip: Realizing SI in demanding environments, Proc. SPIE 2014, 9113, units with microfabricated alkali vapour cells, Journal of Physics: https://doi.org/10.1117/12.2049886, 2014. Conference Series, 723, 012056, https://doi.org/10.1088/1742- Duda, R. O., Hart, P. E., and Stork, D. G.: Pattern classification, 2 6596/723/1/012056, 2016. Edn. Wiley, New-York, 2000. MoSeS-Pro: Modulare Sensorsysteme für Echtzeit- Gassmann, O. and Kottmann, J.: Technologiemanagement in der Prozesssteuerung und smarte Zustandsbewertung für die Sensorik, Wissensmanagement, 8, 19–24, 2002. Industrie 4.0, BMBF project funded in the funding area “Sen- GUM: Evaluation of measurement data – Guide to the expression sorbasierte Elektroniksysteme für Anwendungen für Industrie of uncertainty in measurement, JCGM 100, available at: http:// 4.0 (SElekt I4.0)”, available at: http://www.moses-pro.de/ (last www.bipm.org/en/publications/guides/gum.html (last access: 10 access: 10 March 2018), 2015–2018. March 2018), 2008. Marien, J. and Schütze, A.: Magnetic Microsensors: Quo vadis?, Helwig, N. and Schütze, A.: Intelligentes Condition Monitor- Proc. SENSOR 2009, II, 17–22, Nuremberg, 26–28 May, avail- ing mit automatisierter Merkmalsgenerierung und -bewertung, able at: https://doi.org/10.5162/sensor09/v2/a6.1, 2009. in: XXVIII. Messtechnisches Symposium des Arbeitskreises Munter, P. J. A.: A low-offset spinning-current hall plate, Sen- der Hochschullehrer für Messtechnik, edited by: Schütze, sors and Actuators B, 22, 743–746, https://doi.org/10.1016/0924- A. and Schmitt, B., Shaker Verlag, Aachen, 121–128, 4247(89)80069-X, 1990. https://doi.org/10.5162/AHMT2014/P1, 2014. NIST-on-a-Chip Portal, available at: http://www.nist.gov/pml/ Helwig, N. and Schütze, A.: Detecting and compensating sensor productsservices/nist-chip-portal, last access: 10 March 2018. faults in a hydraulic condition monitoring system. Proc. SEN- Ochs, T.: Selbstüberwachung und online Verifizierung von Sensor- SOR 2015 – 17th International Conference on Sensors and daten im Kraftfahrzeug, Übersichtsvortrag, 11. Dresdner Sen- Measurement Technology, Nuremberg, 19–21 May, available at: sorsymposium 2013, Dresden, 9–11 December 2013. https://doi.org/10.5162/sensor2015/D8.1, 2015. Plattform Industrie 4.0, available at: http://www.plattform-i40. Helwig, N., Pignanelli, E., and Schütze, A.: Condition Mon- de/I40/Navigation/EN/Home/home.html, last access: 10 March itoring of a Complex Hydraulic System Using Multi- 2018. variate Statistics, Proc. I2MTC-2015 – 2015 IEEE Interna- Reimann, P. and Schütze, A.: Sensor Arrays, Virtual Multisensors, tional Instrumentation and Measurement Technology Confer- Data Fusion, and Gas Sensor Data Evaluation, in: Gas Sensing ence, paper PPS1-39, Pisa, Italy, 11–14 May, available at: Fundamentals, edited by: Kohl, C.-D. and Wagner, T., Springer https://doi.org/10.1109/I2MTC.2015.7151267, 2015a. Series on Chemical Sensors and Biosensors, Volume 15, 2014. Helwig, N., Klein, S., and Schütze, A.: Identification and quantifi- Schneider, T., Helwig, N., and Schütze, A.: Automatic feature ex- cation of hydraulic system faults based on multivariate statistics traction and selection for classification of cyclical time series using spectral vibration features, Proc. Eng., 120, 1225–1228, data, Tech. Mess., 84, 198–206, https://doi.org/10.1515/teme- https://doi.org/10.1016/j.proeng.2015.08.835, 2015b. 2016-0072, 2017 Helwig, N., Schneider, T., and Schütze, A.: MoSeS-Pro: Mod- Schüler, M., Sauerwald, T., and Schütze, A.: A novel approach for ular sensor systems for real time process control and smart detecting HMDSO poisoning of metal oxide gas sensors and im- condition monitoring using XMR-technology, Proc. 14th xMR- proving their stability by temperature cycled operation, J. Sens. Symposium “Magnetoresistive Sensors and Magnetic Systems”, Sens. Syst., 4, 305–311, https://doi.org/10.5194/jsss-4-305-2015, Wetzlar, Germany, 21–22 March, 2017a. 2015. Helwig, N., Merten, P., Schneider, T., and Schütze, A.: In- Schütze, A.: Sensorik und Messtechnik im Industrie 4.0-Zeitalter, tegrated Sensor System for Condition Monitoring of Elec- Plenarvortrag, 7. VDI-Fachtagung Messunsicherheit 2015 – tromechanical Cylinders, MDPI Proceedings 2017, 1, 626, Messunsicherheit praxisgerecht bestimmen, Braunschweig, Ger- https://doi.org/10.3390/proceedings1040626, 2017b. many, 19–20 November, 2015. J. Sens. Sens. Syst., 7, 359–371, 2018 www.j-sens-sens-syst.net/7/359/2018/
A. Schütze et al.: Sensors 4.0 – smart sensors and measurement technology enable Industry 4.0                                   371

Schütze, A. and Helwig, N.: Sensorik und Messtechnik für           Stahl-Offergeld, M.: Robuste dreidimensionale Hall-Sensoren für
  die Industrie 4.0 – (Sensors, instrumentation and measure-          mehrachsige Positionsmesssysteme, “Aktuelle Berichte aus der
  ment science for “Industrie 4.0”), Tech. Mess., 83, 208–218,        Mikrosystemtechnik – Recent Developments in MEMS”, Band
  https://doi.org/10.1515/teme-2016-0047, 2016.                       20, Shaker-Verlag, Aachen, 2011.
Schütze, A. and Helwig, N.: Sensors 4.0 – Smart sensors and        Stahl-Offergeld, M., Cichon, D., Hohe, H., and Schütze, A.:
  measurement technology enable Industry 4.0, Proc. 14th xMR-         Offset Tracing in Hall Sensors by Integrated Temperature
  Symposium “Magnetoresistive Sensors and Magnetic Systems”,          Coefficient Determination, Proc. SENSOR 2009, II, 59–64,
  Wetzlar, Germany, 21–22 March, 2–8, 2017.                           https://doi.org/10.5162/sensor09/v2/a7.4, 2009.
Semantic Sensor Network Ontology, available at: http://www.w3.     Stahl-Offergeld, M., Ernst, R., Hohe, H.-P., and Schütze, A.:
  org/2005/Incubator/ssn/ssnx/ssn, last access: 10 March 2018.        Process-independent Integrated Sensitivity Calibration of 3D
Sensor-Trends 2014 – Trends in zukunftsorientierten Sensortech-       Hall Sensors, EMSA 2010, the 8th European Conference on
  nologien, edited by: AMA Fachverband für Sensorik, available        Magnetic Sensors and Actuators, Bodrum, Turkey, 4–7 July,
  at: http://www.ama-sensorik.de/fileadmin/Pubikationen/AMA_          2010.
  Trendbericht_Langfassung[1].pdf (last access: 10 March 2018),    Walter, K.-D.: Wo bleibt der Sensor für Industrie
  2010.                                                               4.0?,     available   at:   http://www.elektrotechnik.vogel.de/
Sommer, K.-D. and Schütze, A.: Smart sensors & networked dig-         wo-bleibt-der-sensor-fuer-industrie-40-a-529141/, last ac-
  ital measurement systems – Trends and challenges in industrial      cess: 10 March 2018.
  measurement and metrology, Keynote lecture, 46th Ann. Meas.
  Science Conf. 2016, Anaheim, USA, 23–25 March, 2016.

www.j-sens-sens-syst.net/7/359/2018/                                                    J. Sens. Sens. Syst., 7, 359–371, 2018
You can also read