Dietary composition and spatial patterns of polar bear foraging on land in western Hudson Bay - Gormezano and Rockwell
←
→
Page content transcription
If your browser does not render page correctly, please read the page content below
Dietary composition and spatial patterns of polar
bear foraging on land in western Hudson Bay
Gormezano and Rockwell
                                 Gormezano and Rockwell BMC Ecology 2013, 13:51
                                  http://www.biomedcentral.com/1472-6785/13/51
Gormezano and Rockwell BMC Ecology 2013, 13:51
http://www.biomedcentral.com/1472-6785/13/51

 RESEARCH ARTICLE                                                                                                                            Open Access

Dietary composition and spatial patterns of polar
bear foraging on land in western Hudson Bay
Linda J Gormezano* and Robert F Rockwell

  Abstract
  Background: Flexible foraging strategies, such as prey switching, omnivory and food mixing, are key to surviving in
  a labile and changing environment. Polar bears (Ursus maritimus) in western Hudson Bay are versatile predators that
  use all of these strategies as they seasonally exploit resources across trophic levels. Climate warming is reducing
  availability of their ice habitat, especially in spring when polar bears gain most of their annual fat reserves by
  consuming seal pups before coming ashore in summer. How polar bears combine these flexible foraging strategies
  to obtain and utilize terrestrial food will become increasingly important in compensating for energy deficits from
  lost seal hunting opportunities. We evaluated patterns in the composition of foods in scat to characterize the
  foraging behaviors that underpin the diet mixing and omnivory observed in polar bears on land in western Hudson
  Bay. Specifically, we measured diet richness, proportions of plant and animal foods, patterns in co-occurrence of
  foods, spatial composition and an index of temporal composition.
  Results: Scats contained between 1 and 6 foods, with an average of 2.11 (SE = 0.04). Most scats (84.9%) contained
  at least one type of plant, but animals (35.4% of scats) and both plants and animals occurring together (34.4% of
  scats) were also common. Certain foods, such as Lyme grass seed heads (Leymus arenarius), berries and marine
  algae, were consumed in relatively higher proportions, sometimes to the exclusion of others, both where and when
  they occurred most abundantly. The predominance of localized vegetation in scats suggests little movement
  among habitat types between feeding sessions. Unlike the case for plants, no spatial patterns were found for
  animal remains, likely due the animals’ more vagile and ubiquitous distribution.
  Conclusions: Our results suggest that polar bears are foraging opportunistically in a manner consistent with
  maximizing intake while minimizing energy expenditure associated with movement. The frequent mixing of
  plant-based carbohydrate and animal-based protein could suggest use of a strategy that other Ursids employ to
  maximize weight gain. Further, consuming high rates of certain vegetation and land-based animals that may yield
  immediate energetic gains could, instead, provide other benefits such as fulfilling vitamin/mineral requirements,
  diluting toxins and assessing new foods for potential switching.

Background                                                                          providing an alternate source of nutrition when preferred
Flexibility in foraging is key to persisting in a labile and                        animal-based food is in short supply or not easily obtained
changing environment (e.g., [1-4]). Three common strat-                             [6,9,10]. Food mixing involves ingesting material from dif-
egies are used by predators to exploit available food in such                       ferent species either simultaneously or over various inter-
situations: prey switching, omnivory and food mixing [5-7].                         vals of an animal’s lifetime that differ qualitatively to the
Prey switching involves shifting between ecologically diverse                       consumer [11]. For example, brown bears (Ursus arctos)
prey, seasonally or over an animal’s lifetime in response                           and Speck’s hinge back tortoises (Kinixys spekii) consume
to the availability or quality of the prey [2,7,8]. Omnivory                        specific combinations of different foods to obtain optimal
is defined as foraging on both animal and plant material                            proportions of macronutrients [6,12].
and can benefit species that are primarily carnivorous by                             Polar bears (Ursus maritimus), especially those that
                                                                                    spend portions of the year on land, are versatile predators
* Correspondence: ljgorm@amnh.org                                                   and appear to use all of these strategies, as they seasonally
Division of Vertebrate Zoology, American Museum of Natural History, 79th            exploit food across trophic levels (e.g., [13-16]). Although
Street and Central Park West, 10024 New York, NY, USA

                                       © 2013 Gormezano and Rockwell; licensee BioMed Central Ltd. This is an open access article distributed under the terms of
                                       the Creative Commons Attribution License (http://creativecommons.org/licenses/by/2.0), which permits unrestricted use,
                                       distribution, and reproduction in any medium, provided the original work is properly cited.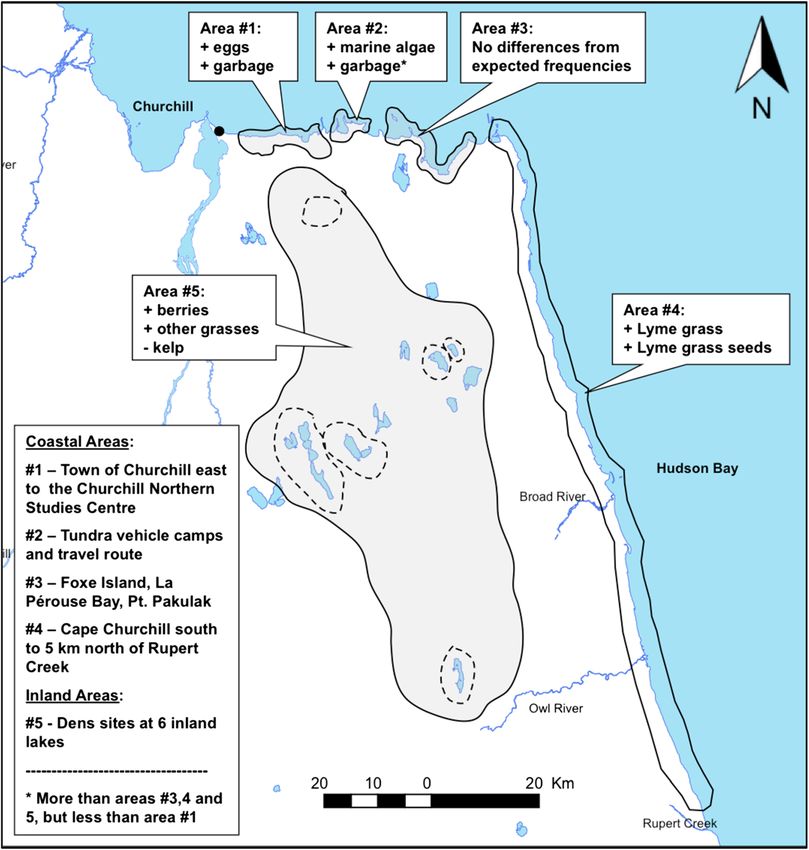
Gormezano and Rockwell BMC Ecology 2013, 13:51                                                                     Page 2 of 13
http://www.biomedcentral.com/1472-6785/13/51

the more southern populations of Hudson Bay are pagophi-         or further inland to consume lower quality vegetation
lic (ice-loving) for much of the year, they move to land for a   (compared to animals) such as graminoids and berries
minimum of 4–5 months as the sea ice melts completely by         [31,32]. Again, however, what is not well known is how
summer [17]. While on the sea ice, they are mostly carniv-       regularly these foods occur together in the diet of polar
orous, feeding primarily on ringed seals (Phoca hispida) but     bears, especially during the ice-free period when the
periodically consuming bearded seals (Erignathus barbatus),      benefits of omnivory and food mixing could offset nu-
harbor seals (Phoca vitulina) and other marine mammals           tritional deficits [24].
(e.g., [18]). As these “southern” polar bears move to land,         In this paper, we use data from a large-scale polar bear
they adopt a more omnivorous and mixed diet including            scat collection on the Cape Churchill Peninsula of west-
fruit and other vegetation as well as different varieties of     ern Hudson Bay to examine patterns in dietary compos-
animals (e.g., [14,16,19]).                                      ition and richness within and between feeding sessions
   Climate change is causing Hudson Bay sea ice to melt          (as defined by the foods present in a scat pile) and how
earlier in the spring and this increasingly limits the time      these vary across the landscape to more fully understand
polar bears have to hunt seal pups, from which they histor-      the extent and potential utility of omnivory and food
ically have gained the majority of their annual fat reserves     mixing behaviors on land. Specifically, we examine (1)
[17]. These reduced hunting opportunities are believed to        diet richness to evaluate how many items polar bears
have resulted in nutritional deficits that have been linked      generally consume within foraging sessions; (2) food-specific
to decreases in survival and reproductive output of some         co-occurrence to see if certain foods are consumed with
demographic groups [20,21]. Ironically, the earlier melt-        fewer accompanying foods compared to other items;
ing of sea ice that has resulted in a mismatch with their        (3) degree of omnivory to determine to what degree polar
traditional spring prey has also produced a new match            bears are consuming different food types (e.g., vegetation,
with land-based prey on the Cape Churchill Peninsula             animals) alone or in combinations; (4) spatial composition
of western Hudson Bay [22]. Earlier onshore arriving             to see if polar bears are depositing scats (and likely consum-
polar bears are now taking advantage of lesser snow geese        ing foods) where they are most available; and (5) spatial
(Chen caerulescens caerulescens) and their eggs as well          food-specific co-occurrence to see if polar bears consume
as caribou (Rangifer tarandus) from the increasing pop-          fewer accompanying foods when consuming certain foods
ulations of both species [16,23].                                that occur relatively more frequently in scats in a particular
   It is possible that, once ashore, switching to these new      area. In addition, we use a rough temporal index to com-
land-based prey could offset some of the nutritional defi-       pare composition and food-specific co-occurrence rates in
cits incurred by earlier arriving polar bears and mitigate       scats collected fresh in mid-summer compared to older
some of the reductions in survival and reproductive              “unknown” age scats to examine foraging patterns limited
success [16,22,23]. It is more likely, however, that those       to that time period.
deficits could be offset if these resources are combined
with other readily available plant and animal land-based         Methods
resources these polar bears consume during the ice-free          Study area
period [23,24]. Such food mixing and omnivory can result         Scat was collected along 160 km of coastline and inland
in synergisms that lead to otherwise unexpected nutritional      areas within the Cape Churchill Peninsula [22] where polar
gains (e.g., [12]). Unfortunately, little is known about the     bears are known to occur during the ice-free period in
basic foraging patterns that might underpin omnivory and         Manitoba, Canada [33]. The sampling area extended from
food mixing in polar bears during the ice-free period [24]       the town of Churchill, Manitoba (58°46′N, 94°12′W), east
and that behavioral perspective is crucial to understanding      to Cape Churchill (58°47′N, 93°15′W) and south to Rupert
the potential utility of these strategies [11]. For example,     Creek (57°50′N, 92°44′W). Samples collected from 6
what foods are consumed over similar time frames and             denning areas southeast of Churchill extended inland of
how is that consumption related to the spatial distribution      the coastline to 93°51′W (Additional file 1: Figure S1).
of those foods?                                                  For site description details, see Gormezano and Rockwell
   The range of terrestrial foods sought by polar bears sug-     [16]. During the sampling period, polar bears were predicted
gests a high level of plasticity in their foraging behavior      to arrive on land shortly after 24 June, 22 June and 28 June
which may have always been present (e.g., [25]), but actu-       in 2006, 2007 and 2008, respectively, based on standard
ally might be increasing over time in response to changing       calculations for 50% sea ice breakup [34,35].
ecological conditions [26]. For example, polar bears have
been observed chasing and capturing lesser snow geese on         Scat collection and analysis
land [27], climbing rocky outcrops to eat thick-billed           We used a trained detection dog to find scats along 1–3
murres (Uria lomvia) and their eggs [28], leaving the ice        kilometer linear coastal transects (parallel to the coastline)
to consume eggs on land [29,30] and traveling to land            and in the vicinity of inland dens from 2006 through 2008.
Gormezano and Rockwell BMC Ecology 2013, 13:51                                                                         Page 3 of 13
http://www.biomedcentral.com/1472-6785/13/51

Coastal transects from the town of Churchill and Rupert           cannibalism from grooming by the larger volume of hair,
Creek were walked between 25 May and 11 August. Upland            presence of flesh, bone and a distinct smell. All food
habitat in the vicinity of inland dens was searched between       items (other than polar bear) were considered present if
30 May and 17 June when they were likely to be vacant.            they were identified in a scat pile, regardless of volume.
For all scats collected, we recorded the date, geographic
coordinates, substrate and relative freshness. Samples were       Statistical analysis
categorized as either “fresh” (from the current season) or        We examined the diet of polar bears using the: (1) raw
“unknown age” (from the current or previous season) based         frequencies (number of times each food item was found)
on smell, color and presence of insect larvae. Intact scats of    and (2) scat occurrences (the number of scats with a food
all ages were collected and foods were identified from entire     item). We use the percentages of these (relative to their
piles. Samples collected prior to the arrival of polar bears in   appropriate sum) for ease of presentation in some cases.
a given year (see above) were all from a previous season          Raw frequencies of individual food items were found to
(old) whereas those collected after that date were a mixture      occur independently in scats, justifying their use in statistical
of fresh and old scats. Because freshness of scats was            analyses [16]. The raw frequencies and the scat occurrences
dependent, in part, on time of collection, we use the             are the same value unless multiple items from the same
composition of “fresh” samples collected after the bears’         category occur in a scat pile (i.e., 2 birds in one scat).
arrival only to identify foods definitely consumed in mid to      Multiple items were only counted for animals when
late summer (and not previously). All collection protocols        evidence was conclusive (e.g., 3 bird feet) and was not
were approved by the Institutional Animal Care and Use            counted for plants and fungi.
Committee of the American Museum of Natural History                  Most analyses of spatial and compositional patterns
(Reference Number: 11-1025-2005).                                 in diet were done using 14 inclusive groups of food
   Scats were often found to be clumped along a transect          items with each group having at least 5 occurrences
line or near a denning site. To minimize potential bias           of all included taxa. These groups were polar bear,
resulting from multiple scats being deposited by a single         seal (e.g., Phoca hispida), caribou (Rangifer tarandus),
individual, we did not use all of the samples collected           rodents (i.e., muskrats (Ondatra zibethicus), meadow
from clumped points along each of our 31 transects for            voles (Microtus pennsylvanicus), collared or bog lemmings
these diet analyses. We randomly selected approximately           (Dicrostonyx richardsoni and Synaptomys cooperi)),
50% of the scats collected from each transect for analysis        birds, eggs, Lyme grass (Leymus arenarius; shafts and/
so that they would be representative of the relative fre-         or seed heads), Lyme grass seed heads (seed heads only),
quencies and geographic extent of the sampled areas.              other grasses (e.g., Festuca brachyphylla), marine algae
Though the actual number of polar bears depositing the            (e.g., Fucus spp., Laminaria spp.), berries (e.g., Vaccinium
sampled scats is unknown, we assume from the size and             uliginosum, Empetrum nigrum), mosses (e.g., Sphagnum
geographic extent of our sampling and other studies sug-          fuscum), mushrooms (Lycoperdon and Bovista spp.) and
gesting that polar bears segregate and move little once           garbage. Although the Lyme grass seed heads and shafts
ashore [33] that our samples are representative of the            come from the same plant, their raw frequencies within
land-based diet of those polar bears that do forage on            scats are independent and they are treated as separate
the Cape Churchill Peninsula.                                     food items [16].
   Animal remains were identified from entire scats using            We tabulated the percent scat occurrences that in-
a combination of microscopy, reference keys [36-39] and           cluded at least one food item that was: vegetation, ani-
expert opinion (N. Duncan, A. Rodriguez, C. Dove). Plant          mal (mammals, birds or eggs) and land-based animal
and fungi were identified using keys [40,41] but most were        (LBA; i.e., birds, eggs, caribou, rodents) across all piles.
subsequently pooled into broad taxonomic categories due           As an index of the complexity of the diet of individual
to the variety encountered and time constraints. Identifica-      bears, we also calculated the number of scats containing
tion techniques are described in detail in Gormezano and          both vegetation and animal, >1 animal and >1 LBA.
Rockwell [16]. Bones, hairs and feathers were identified             As an additional index of diet complexity, we calculated
to the lowest taxonomic level possible but if they could          the minimum, maximum and mean number of food types
not be identified beyond ‘bird’ or ‘mammal’ they were             per pile using scat occurrences as the unit of measure. Be-
only included in statistical analyses where pooled,               cause the “Lyme grass” category includes both the shafts
higher taxonomic groups (i.e., birds, mammals) were               and/or seed heads, including “Lyme grass seed heads” as a
used. Bones classified no finer than ‘animal’ were only           separate category when scat occurrences are the unit of
included in summary statistics of major food categories           measure is redundant. For this reason, “Lyme grass seed
(e.g., vegetation, animals).                                      heads” was excluded from this analysis (13 groups used).
   Polar bear hair was found in most scats and was likely         To examine whether complexity differed depending on
ingested during grooming. We distinguished evidence of            the presence of a particular food type, we quantified the
Gormezano and Rockwell BMC Ecology 2013, 13:51                                                                     Page 4 of 13
http://www.biomedcentral.com/1472-6785/13/51

scat occurrences of co-occurring food items in each scat         highly significant (G = 376.14, DF = 52, P < 0.0001), in-
for each of the 14 food categories and plotted their distri-     dicating differences among the 5 sections of the study
bution and mean (with standard error) across all scats.          area, we performed 2 × 14 log-likelihood chi-square tests
Different animal and plant matter pass through the digest-       for each of the 5 sections to identify which had food items
ive tract of bears at different rates [42], so we assumed that   that varied. Significance of these pair-wise tests was evalu-
the observed combinations reflect foods consumed within a        ated using a sequential Bonferroni approach [48] to reduce
single feeding session, not necessarily at the same time. We     inflation of our overall α–error rate. For the sections in
define a ‘feeding session’ as the period between ingesting       which items differed, we then compared the proportions
and defecating the undigested remains, which can vary            and 95% confidence limits of the frequencies of each food
between 6.2 and 19.0 hours based on minimum digestive            item to identify which ones differed the most.
rates for vegetation (by grizzly bears) [43] and maximum            To test the hypothesis that polar bears would consume
digestion rates for meat (by polar bears) [44], respectively.    certain foods more frequently in a particular area to the
  To examine potential effects of spatial differences in         exclusion of others, whether because of preference or
topography, vegetation and local prey abundance that             availability, we compared the means and 95% confidence
might affect diet composition, raw frequencies of different      intervals of scat occurrences of co-occurring foods in
food items were compared across 5 different sections of the      areas where foods were consumed more frequently
study area. Although polar bears are capable of traversing       with those from all other areas. We hypothesized that
long distances, they are known to move relatively little         if other foods were being excluded the mean number
on land compared to on the ice [33,45]. We therefore             of co-occurring foods in those areas would be less than
hypothesized that scats collected from areas with distinct       (and outside the confidence interval of) all other areas.
landscape characteristics, such as anthropogenic land use        We illustrate our results by plotting the differences be-
(e.g., the town of Churchill, tundra vehicle based tourism),     tween mean number of co-occurring items among scats
concentrations of known nesting bird colonies, and dis-          containing foods consumed relatively more often in a par-
tinct vegetation clines [46], would contain food items           ticular area and the mean number of co-occurring foods
specific to the areas from which they were collected. For        in scats containing these same items in all other areas. Be-
example, we expected to see more garbage where people            cause we use mean differences, a value of zero equals no
reside, more berries inland and more birds in scats in           difference. Pooled estimates of variance are used in deriv-
the vicinity of the historical lesser snow goose (Anser          ation of confidence limits [47].
caerulescens caerulescens, henceforth snow goose) and               Although we could not assign exact age to most scats,
common eider (Somateria mollissima) colonies near La             it was possible to identify those deposited in the current
Pérouse Bay.                                                     season. Because our sampling occurred just as polar
  Using the raw frequencies of items from the 14 inclu-          bears were arriving ashore, we assumed that these scats
sive food groups, we pooled items to major categories            contained foods consumed either on the ice (just before
(animal, vegetation or garbage). To evaluate if there            coming ashore) or shortly after arriving. Using raw fre-
was an overall difference in the proportions of these            quencies as the unit of measure, we performed a 2 × 3
categories among areas, we used a 5 × 3 log-likelihood           log-likelihood chi-square to evaluate whether there were
chi-square test. For this test, the 3 food categories were       differences in the proportions of major food categories
cross-classified against the 5 areas and expectations            (animals, vegetation and garbage) between fresh and
computed under the independence assumption as the                unknown age scats. We then performed a 2 × 14 log-
product of the proportion of scats containing the food           likelihood chi-square test to assess whether the frequencies
category and the proportion of scats in the area times           of individual foods (within these broad categories) differed
the total number of scats. The log-likelihood chi-               in fresh and unknown age scats. Because the overall test
square was used rather than the chi-square because it            was highly significant (G = 36.79, DF = 13, P = 0.0004), indi-
is less affected by low cell frequencies [47]. Expectations      cating differences between foods in fresh and unknown age
for subsequent log-likelihood chi-square analyses were           scats, we compared the proportions and 95% confidence
computed in a similar fashion. Because this overall test         limits of the frequencies of food items to identify which
was significant (G = 100.27, DF = 8, P < 0.0001), indicating     ones were being consumed and deposited in scat more
a difference in proportions, we performed 5 × 2 log-             or less often when polar bears first come ashore.
likelihood chi-square tests for each food category to               To evaluate whether polar bears were consuming certain
identify in which category items varied.                         foods at relatively higher rates to the exclusion of others in
  We performed a similar test evaluating differences in          mid-summer, we also compared the mean number and
the proportions of individual foods (from the 14 inclu-          95% confidence interval of scat occurrences of co-occurring
sive groups) across the study area using a 5 × 14 log-           foods for new and unknown age scats with more frequently
likelihood chi-square test. Because the overall test was         consumed items. Results are illustrated using differences
Gormezano and Rockwell BMC Ecology 2013, 13:51 Page 5 of 13
http://www.biomedcentral.com/1472-6785/13/51
and 95% confidence intervals of mean numbers of co- P < 0.0001). More specifically, area #1 (G = 95.62, DF = 13,
occurring items in fresh scats containing the more P < 0.0001, n = 69 scats), area #2 (G = 55.45, DF = 13,
frequently consumed items and the mean numbers of P < 0.0001, n = 71), area #4 (G = 149.49, DF = 13, P < 0.0001,
co-occurring items in unknown age scats containing n = 369) and area #5 (G = 180.58, DF = 13, P < 0.0001,
these same items. n = 49) each had food items that occurred in different
proportions than expected given total occurrences in
Results all other areas. The proportions for area #3 (G = 25.30,
We evaluated 642 scats (of 1,262 collected); 219, 248 and DF = 13, P = 0.021, n = 84) were not significantly different
175 in 2006, 2007 and 2008, respectively. 593 scats were using our adjusted alpha level (α = 0.01).
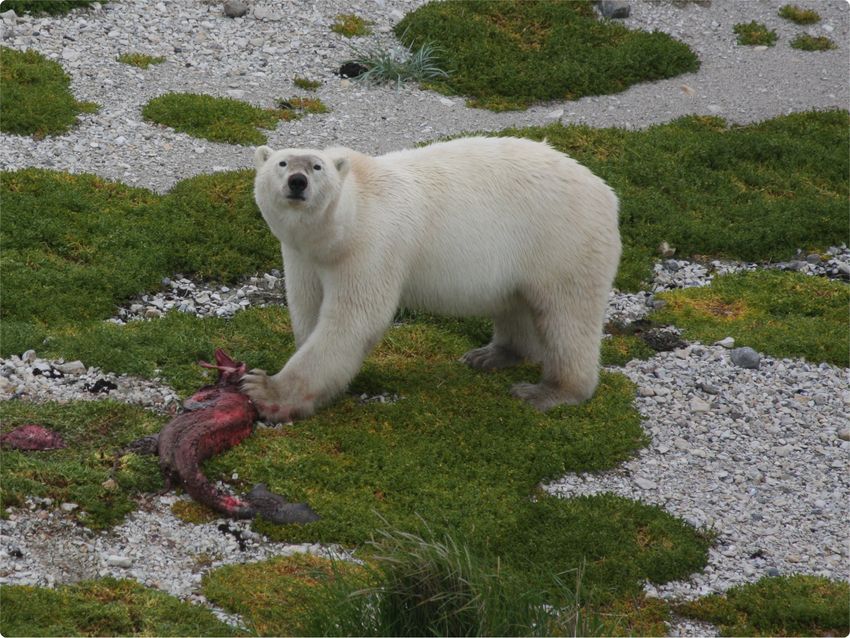
collected from coastal areas and 49 from inland sites. Vege- Within and adjacent to the town of Churchill (area #1,
tation and land-based animals occurred in 84.9% and 35.4% Figure 2), we found scats with more eggs and garbage.
of all scats, respectively. Polar bears that consumed animals Further east, along the tundra vehicle route, which runs
(either land- or marine-based; 45.8% of scats) did not between two temporary camps set up by tundra vehicle
appear to specialize on that particular resource because tour operators in the fall (area #2), we found a higher pro-
we also observed a high co-occurrence of animal and portion of marine algae and garbage (more than areas #3, 4
vegetation (34.3%) and multiple animal taxa (9.3%) in the and 5, but less than area #1). In the stretch of coast south
same scat (Table 1). of Cape Churchill to just north of Rupert Creek (area #4),
There were between 1 and 6 different foods in each we found a higher proportion of scats with Lyme grass
scat, with an average of 2.11 (SE = 0.04) items. The mean shafts and Lyme grass seed heads. Inland areas near dens
number of co-occurring items ranged from 1.21 (SE = 0.19) (area #5) had significantly more berries, other grasses and
for Lyme grass seed heads to 2.61 (SE = 0.26) for eggs less marine algae. No significant differences in propor-
(Figure 1). The percentage of scats that were found with tions were detected along the coast near La Pérouse Bay
0, 1, 2, 3, 4 and >4 accompanying items is also illustrated (area #3). Proportions of food item frequencies in each
for each of the 14 food items in Figure 1. area with confidence limits are summarized in Table 2.
The overall proportions of food categories (animals, Four of the food items that were found to be spatially
vegetation and garbage) differed across the study area in excess of expectation also occurred with fewer accom-
(G = 100.27, DF = 8, P < 0.0001), but this difference was panying food items compared to other areas, suggesting
only due to differences in the proportions of vegetation the bears consumed foods at higher rates in these areas
(G = 39.25, DF = 4, P < 0.0001) and garbage (G = 82.27, and to the exclusion of other foods. This was the case
DF = 4, P < 0.0001). The proportions of animals (G = 11.14, with marine algae (x = 2.02 ± 0.27 vs. x = 2.61 ± 0.14) in
DF = 4, P < 0.025) did not significantly differ at our adjusted area #2, Lyme grass (x = 2.31 ± 0.14 vs. x = 2.75 ± 0.25) and
alpha level (α = 0.0167). Individual food items signifi- Lyme grass seed heads (x = 2.05 ± 0.38 vs. x = 3.6 ± 1.42) in
cantly differed across the study area (G = 376.14, DF = 52, area #4, and berries (x = 2.11 ± 0.34 vs. x = 4.00 ± 1.07) in
area #5 (Figure 3a).
A total of 125 fresh scats with a total of 262 occur-
Table 1 The number and percentage of polar bear scats
rences of food items was collected, all found along the
(n = 642) containing ‘vegetation’, ‘animal’, ‘land-based’
coast. The proportions of foods from major categories
food items
(animals, vegetation and garbage) were significantly dif-
Scats containing food item
ferent (G = 6.30, DF = 2, P = 0.043) between fresh and
# %
unknown age scats due to an increase in the proportion
Food type (≥ 1) of animals in fresh scats (G = 4.52, DF = 1, P = 0.0335).
Vegetation 545 84.9 The frequencies of individual food items significantly
Animal 294 45.8 differed (G = 36.79, DF = 13, P = 0.0004). More specific-
Land-based food 605 94.2 ally, we found a higher proportion of Lyme grass seed
Land-based animal 227 35.4
heads (^p = 7.25, CI = 4.42-11.12 vs. p^ = 2.16, CI = 1.39-3.20)
and lower proportions of marine algae ( p^ = 14.12,
Food combinations
CI = 10.14-18.92 vs. p^ = 23.35, CI = 20.95-25.36) and
Animal + Vegetation 220 34.3 p = 1.91, CI = 0.62-4.40 vs. p^ = 4.60, CI = 3.44-6.02)
berries (^
> 1 Animal 60 9.3 in fresh scats. Of these foods, only marine algae occurred
> 1 Land-based animal 42 6.5 in piles with significantly fewer accompanying foods
‘Vegetation’ includes grasses, marine algae, mosses, mushrooms and berries; in unknown age scats (^ p = 1.69, CI = 1.56-1.83) than in
‘Animal’ includes identified and unidentified birds, mammals and eggs; fresh scats ( p^ = 2.84, CI = 2.45-3.23); and thus were
‘Land-based food’ includes any food item except seal or polar bear
(which could have been consumed on the ice); ‘Land-based animal’ includes
consumed at higher rates to the exclusion of others
caribou, birds, eggs and rodents. later in the season (Figure 3b).Gormezano and Rockwell BMC Ecology 2013, 13:51 Page 6 of 13
http://www.biomedcentral.com/1472-6785/13/51
100% 3.5 >4
Percent frequency of number of co-occurring foods
4
Mean number of co-occurring foods (with S.E.)
3.0
80% 3
2.5 2
60% 1
2.0
0
1.5
40%
1.0
20%
0.5
0% 0
e
s
l
ar
ou
ge
s
s
es
s
s
s
a
s
s
ga
m
nt
se
rd
g
ad
as
se
Se
be
rib
ba
rri
Eg
oo
de
Bi
al
os
he
gr
as
Be
ar
Ca
ar
hr
Ro
e
M
gr
e
d
G
l
in
us
Po
m
e
er
ar
Se
Ly
M
th
M
O
Figure 1 The distribution of co-occurring foods in polar bear scats collected from western Hudson Bay from 2006–2008 as an index of
diet complexity. For each food item on the x-axis, each section of the vertical bars is the percent frequency of the number of co-occurring food
items. For example, seed heads occurred alone in 39.5% of scats, with one other food item in 23.3% of scats, etc. The diamond points connected
by the black line are the mean number of co-occurring foods (right y-axis) with associated standard errors for each food item.
Figure 2 Spatial differences in occurrences of food items from polar bear scats across the study area. Our sampling area was divided into
5 sections based on anthropogenic land use, concentrations of known prey and vegetation clines. Classes of food items that occurred more (+)
or less (−) often than expectations based on other areas are indicated.Gormezano and Rockwell BMC Ecology 2013, 13:51 Page 7 of 13
http://www.biomedcentral.com/1472-6785/13/51
Table 2 The proportions and upper and lower 95% Table 2 The proportions and upper and lower 95%
confidence limits of the frequencies of food items in 5 confidence limits of the frequencies of food items in 5
different areas across the study area different areas across the study area (Continued)
Site # 8.09 3.10 4.96 2.30 47.29
Food item: 1 2 3 4 5 Berries 3.82 0.76 2.15 1.25 36.84*
20.43 19.96 27.46 13.26 24.70
1.42 0.02 0.59 0.60 27.16
Birds 14.01 12.98 20.97 10.89 15.79
9.00 9.07 15.35 8.84 9.09
7.25 3.10 9.66 6.61 5.73
Mushrooms 3.18 0.76 5.38 4.88 1.05
18.23 2.78 6.16 2.46 5.73
1.04 0.02 2.60 3.49 0.03
Eggs 12.98* 0.00 2.69 1.38 1.05
9.52 0.00 0.88 0.69 0.03
8.98 10.71 9.66 13.20 17.27
Moss 4.46 5.34 5.38 6.76 9.47
8.09 8.30 4.96 7.17 14.63
1.81 1.77 2.60 5.12 4.42
Caribou 3.82 3.82 2.15 5.38 7.37
1.42 1.25 0.59 3.93 3.01
22.58 12.64 4.64 1.10 5.73
Garbage 15.92* 6.87 1.61 0.38 1.05
7.25 1.49 4.64 4.45 5.73
10.59 4.82 0.33 0.08 0.03
Polar bears 3.18 0.00 1.61 3.00 1.05 Proportions (in bold) with confidence limits that do not overlap the proportions
1.04 0.00 0.33 1.93 0.03 of another value are considered significantly different (*) from other values.
6.36 3.10 2.96 1.28 3.81
Rodents 2.55 0.76 0.54 0.50 0.00 Discussion
0.70 0.02 0.01 0.14 0.00 Climate-driven environmental changes are forcing polar
bears to spend extended periods on land with smaller seal-
based fat reserves. As such, land-based food consumed dur-
8.09 8.70 8.30 4.29 3.81
ing this ice-free period may become increasingly important
Seals 3.82 3.82 4.30 2.88 0.00
for survival and reproductive success [16,22]. The compos-
1.42 1.25 1.87 1.83 0.00 itional and spatial patterns of these land-based foods can in-
form the extent to which terrestrial foraging may alleviate
20.43 31.84 29.88 34.81 22.24 nutritional deficits associated with lost seal hunting oppor-
Lyme grass 14.01 23.66 23.12 32.04* 13.68 tunities. Currently, the polar bear diet on land is diverse,
consisting of many plants and animals, often consumed to-
9.00 16.71 17.28 31.03 7.51
gether in various combinations. Even though they are con-
suming a mixed diet, polar bears consume higher rates of
4.51 1.49 4.64 6.46 3.81 specific foods, sometimes to the exclusion of others, (e.
Lyme grass seed heads 1.27 0.00 1.61 4.76* 0.00 g., Lyme grass seed heads, berries and marine algae) and
0.15 0.00 0.33 3.38 0.00 often deposit these scats in areas where these foods occur
most abundantly, suggesting little movement among habi-
tat types between feeding sessions. The remains of animal
8.09 7.64 6.88 6.89 18.51
prey were found often in scat but unlike plant material
Other grasses 3.82 3.05 3.23 5.13 10.53*
there was no obvious spatial pattern to their occurrence.
1.42 0.84 1.19 3.71 5.16 In the following, we discuss possible reasons for the ob-
served dietary patterns, how they may differ between sex
26.16 47.10 32.15 23.39 7.39 and age groups and suggest potential benefits to polar
Marine algae 19.11 38.17* 25.27 20.78 2.11 bears consuming a mixed, omnivorous diet on land.
Foraging on vegetation was pervasive across the study
13.31 29.76 19.21 18.08 0.26
area and certain plants were consumed more often,
especially in areas where they predominated and where
polar bears spent substantial time once they were
ashore. Lyme grass, for example, occurs on primaryGormezano and Rockwell BMC Ecology 2013, 13:51 Page 8 of 13
http://www.biomedcentral.com/1472-6785/13/51
a 3.00
(more co-occurring)
2.00
Differences between mean #s of food items per scat
1.00
eggs
(site #1)
other grasses
(site #5)
0.00
garbage
lyme grass
(site #1)
marine algae (site #4)
(site #2)
-1.00
seed heads
(site #4)
berries
(site #5)
-2.00
(fewer co-occurring)
-3.00
b 1
(more co-occurring)
Differences between mean #s of food items per scat
0.5
marine algae
0
berries
seed heads
-0.5
-1
(fewer co-occurring)
-1.5
Figure 3 Foods consumed at relatively higher rates by polar bears to the exclusion of other foods (a) across the study area and
(b) between fresh and unknown age scats. Black dots in (a) represent the differences between mean number of items co-occurring with
foods consumed more often in a particular area and the mean number of co-occurring foods with these same items collected from all other
areas. Black dots in (b) represent differences between mean numbers of items co-occurring with foods found more often in fresh scats and the
mean number of co-occurring foods with these same items collected from unknown age scats. Values above the zero (the dotted line) indicate
that more foods co-occurred with the more frequently consumed items, whereas those below indicate fewer co-occurred (or were excluded).
Foods with 95% confidence limits that do not overlap zero (zero = no difference) indicate that polar bears consumed these foods at a relatively
higher rate with significantly fewer (or more) co-occurring foods.Gormezano and Rockwell BMC Ecology 2013, 13:51 Page 9 of 13 http://www.biomedcentral.com/1472-6785/13/51 and secondary beach ridges along most of the coast of polar bears on land [33,45], we feel it is more likely due south of Cape Churchill to the Owl River (Figure 2, to the widespread occurrence and/or mobile nature of the area #4) and is used extensively for temporary beds by land-based animals that polar bears consume. For example, arriving polar bears ([33,49], unpublished observations). most of the birds consumed are various species of flightless While lying in these beds, polar bears consume the entire waterfowl, the most common of which is Lesser snow Lyme grass plant (above ground parts), but will often geese, occurring in 12.5% of scats [16]. Since the 1960s, preferentially consume just the seed heads [14,49] that the population of snow geese in the Cape Churchill mature in early to late July and remain available until Peninsula has grown nearly 20-fold and expanded its late August [40]. nesting and brood rearing range from the La Pérouse The bears have also been seen walking through these Bay area to the entire Cape Churchill Peninsula as far stands of Lyme grass eating just the mature seed heads south as Rupert Creek [23,61]. (unpublished observations). The relatively high gross energy Earlier arriving polar bears have begun to overlap the in- yield (compared to other grains) [50], relatively high protein cubation period of snow geese (and other waterfowl species) content [51] and convenient access would make these seed [23], but at present more commonly arrive while young and heads an attractive food source to arriving polar bears. It adult geese are flightless and dispersing along the coast to could also explain why many (44.1%) of the “fresh” scats forage on graminoids. Similarly, the bears co-occur with contained seed heads and occurred with fewer accompany- caribou, whose numbers have increased substantially since ing foods where they were most abundant along the coast the 1960s and that have expanded their summer range (area #4, Figure 2). They also comprised entire scats more closer toward the coast [62], where interactions with often than any other food we recorded (39.5%; Figure 1). arriving polar bears are common (unpublished observation). Berries and marine algae were, similarly, found in scats Other prey, such as rodents, are less mobile but are more often where they predominated, but were likely common in upland habitat, occurring within 5 km from consumed later in summer or early fall. Consistent the coast in years when they are abundant [63,64]. with an earlier study [52], berry remains in scats were Seal, being a preferred food, often occurred alone in concentrated further inland, where mainly adult females scats and with fewer accompanying items. Although it with and without cubs as well as some subadults occur is unclear whether seals were captured on the sea ice [53]. Berries were consumed more often and to the exclu- or from land (predation or as carrion), we observed sion of other items, likely in late summer and early fall multiple seal carcass remains on shore while sampling when commonly consumed species, such as “blueberries” (unpublished observations). Further, when consumed (alpine bilberry, Vaccinium uliginosum) and black crow- with other foods, 57.1% of those were either land-based berry (Empetrum nigrum), ripen. During early fall, many vegetation (i.e., grasses, moss, mushrooms; 21 of 42 scats) polar bears congregate along the coast east of Churchill, or land-based animals (i.e., birds, eggs; 9 of 42 scats). where the landscape is dominated by Larch Fen and Bogs Others have similarly reported polar bears consuming (area #2, Figure 2) [54], waiting for the ice to refreeze. seals and land-based food together through inspec- Here, marine algae are more common than other vegeta- tion of stomach contents, scat and direct observation tion and therefore may be more convenient to consume. [14,16,31,32,60,65]. The purpose of this diet mixing is Polar bears may also consume these plants at higher rates unclear but could serve to dilute toxins accumulated later in the season (and not when they first arrive onshore) in the flesh of seals [6,66-69]. Though capture of seals to consume more desirable parts that become available in from the shore (e.g., seals resting on rocks) or in open fall [55]. Also, shoreline piles of decaying marine algae water is considered rare [57], it does occur (Figure 4) often contain high concentrations of tipulid (cranefly) ([70], C.J. Jonkel pers. comm.) and may be responsible for larvae (unpublished observations), which may attract some of the seal remains found in our study. polar bears to the plants later in the season when the The spatial and compositional patterns in foods con- insect larvae reach maximum size [56]. Reports of polar sumed suggest that polar bears are foraging on individual bears consuming marine algae in other regions, even when foods opportunistically. That is, they are consuming vege- seals were available, have also been documented [57-60]. tation where and when it is most abundant and in random Animals, occurring in 45.8% of scats, are commonly combinations with other foods (i.e., their occurrences are consumed by polar bears during the ice-free period, how- statistically independent) [16]. Despite the fact that polar ever, we found no spatial patterns in scats containing them. bears are known to move little while on land [33,45], ani- One reason for this could be that because passage rates are mal consumption appears to have no spatial component, longer for animals than plants [43,44], so they are moving likely because the animals are ubiquitously distributed and between habitat types faster than the time required to mobile. It is unclear whether foraging, in and of itself, is defecate animal remains. Although given the small differ- opportunistic or coincident with other observed behaviors. ence in passage rates (6–12 hours) and limited movements For example, is the intense foraging on Lyme grass
Gormezano and Rockwell BMC Ecology 2013, 13:51                                                                                Page 10 of 13
http://www.biomedcentral.com/1472-6785/13/51

 Figure 4 A polar bear consuming a seal it captured during the ice-free season. A polar bear guards the seal it captured and is consuming
 on the shore of Hudson Bay near the Seal River, north of Churchill, Manitoba, Canada, on August 14, 2010. Photograph by R. F. Rockwell.

coincident with resting on it once ashore or do they                    simultaneously consume animal-based protein and fat
rest on Lyme grass after seeking it for consumption?                    sources in limited amounts to maximize mass gain [9,12].
Do certain demographic groups travel inland to con-                     Robbins et al. [12] postulated that brown bears con-
sume more berries or are they consuming them coinci-                    sumed an optimal combination of protein and carbo-
dent with being inland (where berries are more abundant)                hydrates that minimized the costs associated with
to avoid the threat of intraspecific predation along the                protein digestion (deaminating and excreting excess
coast?                                                                  nitrogen) while maximizing digestible energy intake.
  Though the propensity to forage may differ between                    As a result, bears in the study gained disproportion-
individuals, when it does occur, polar bears likely em-                 ately more mass on the optimal diet, than they would
ploy foraging tactics that minimize travel to conserve                  have gained from the same calories of each macronu-
fat reserves. Polar bear locomotion on land is ineffi-                  trient alone. Polar bears on the Cape Churchill Penin-
cient with costs of travel increasing with decreasing                   sula may be optimizing their macronutrient intake
size [71,72]. As a result, search costs would be expen-                 during the ice-free season in a similar fashion.
sive, making it beneficial for polar bears to partake in                   Diet food mixing also has the potential to yield nutritional
large volumes of readily available food and include a                   benefits beyond immediate mass gain. For example, various
large range of possible choices [5]. The generally high                 types of vegetation may provide vitamins and minerals ab-
species richness and varied composition in scat that we                 sent from their primary diet [6,75]. Iversen [60], for example,
observed, as well as apparent high consumption of locally               describes specific vitamins and minerals in marine algae
abundant vegetation supports this. We also found that                   that are lacking in seal blubber, that might explain why
polar bears often consume more than one type of vegeta-                 polar bears of all sex and age classes (including adult males)
tion in a single feeding session (42.4% of scats). Switching            consume this and terrestrial vegetation in Svalbard even
between different types of plants may help maintain both                when seals are still available to hunt. This may also explain
high search efficiencies and bite rates, perhaps making                 observations of polar bears expending energy to dive, then
longer bouts of foraging (with increased movements)                     selectively eating only specific parts of marine algae plants
energetically profitable [24,73].                                       (C.J. Jonkel pers. comm., [14,57,58]).
  Adopting a mixed diet of both animal-based protein                       Another non-energetic benefit of consuming a mixed
and plant-based carbohydrates, which occurred frequently                diet is to allow sampling of available food to assess qual-
in our study (34.3% of scats), may allow polar bears to                 ity for potential switching or adding of new foods [5].
overcome some of the nutritional constraints associated                 Traveling to new patches and the effort associated with
with large body mass and inclusion of low quality forage                capturing new prey (e.g., trial and error) are costly and may
in their diet. Other bear species are known to seasonally               not yield an immediate energetic gain, however, greater
specialize on certain types of vegetation [73,74] but                   familiarity with various food patches and improvement
Gormezano and Rockwell BMC Ecology 2013, 13:51                                                                                    Page 11 of 13
http://www.biomedcentral.com/1472-6785/13/51

in efficiency of capturing prey may yield a net energy          of known identity and gender. That research should also
profit over an animal’s lifetime or that of its offspring       establish the energetic costs of foraging to obtain mixed
[27,76,77]. A possible example of this would be the pursuit     and omnivorous land-based diets as well as the energetic
and capture of flightless waterfowl on land by polar bears.     gains, including those obtained through food synergism,
Although some report that consuming a goose after a long        from those diets. Such information will allow the develop-
pursuit can not be energetically profitable [49], multiple      ment of more realistic models of the effect of climate
observations of such behavior and the frequent occurrence       change on survival and reproductive success than current
of waterfowl remains in scat (28.0%; 180 of 642 scats)          models that assume no nutritional input during the
indicates successful captures occur often ([27], unpublished    increasing ice-free period (e.g., [78,79]). Finally, future
observations). Given that geese are still a relatively new      research should continue to monitor changes in polar
resource in western Hudson Bay [16] polar bears prob-           bear foraging that may result from the bears responding
ably possess varying levels of expertise in capturing           to their changing environment.
them. It may be that only until they have optimized
their hunting technique will polar bears glean an ener-         Additional file
getic benefit from pursuing them.
  The sex of polar bears consuming different foods can           Additional file 1: Figure S1. Polar bear scat collection areas. Polar bear
                                                                 scat was collected along the coast of western Hudson Bay from the town
not be determined from our data without further genetic          of Churchill, Manitoba, to Rupert Creek. Scat was also collected near
analyses, however, based on the tendency for different           maternity dens at 6 inland sites. Collections were made from 2006
sex/age classes to segregate once ashore and move little         through 2008.
on land [33,45,53], general inferences can be made. For
example, females with cubs and sub-adults tend to move          Authors’ contributions
                                                                Both LJG and RFR participated in the design of the study. LJG collected the
further inland, whereas adult males tend to predominate         data, identified and analyzed items in scat, performed statistical analyses and
along the coast [53], which could lead to some parti-           wrote the manuscript. RFR participated in the collection of data, assisted in
tioning of resources, as peak availability of certain foods     the analysis of scat contents and statistical analysis, and edited drafts of this
                                                                manuscript. Both authors read and approved the final manuscript.
(e.g., berries) might be more accessible to certain demo-
graphic groups. Derocher et al. [52] similarly noted the        Acknowledgements
importance of broad spatial (and temporal) sampling in          We thank N. Duncan and A. Rodriguez for help with bone and hair
assessing the importance of terrestrial plants in the diet      identification and C. Dove for assistance and tutorials in feather
                                                                identification. Collection of scats was made possible by our field team:
due to observations of berries being primarily consumed         Quinoa, the detection dog, K. Burke, M. DiBrizzi, D. Koons and C. Witte. D.
by adult females and sub-adults further inland. Although        Iles, M. Freeman, J. Lovvorn, J. Roth and H. B. Underwood provided
we found no spatial patterns in animal remains in scat, it is   constructive criticism on an earlier draft of this work. Financial support for
                                                                this work was provided primarily by the Hudson Bay Project, but also the
conceivable that travel to inland areas might increase inter-   American Museum of Natural History – Theodore Roosevelt Memorial Grant,
actions with more mobile prey, such as nesting waterfowl.       Arctic Institute of North America - Grants-In-Aid, Churchill Northern Studies
Edwards et al. [4] reported that the degree of carnivory        Centre - Northern Research Fund, City University of New York and Manitoba
                                                                Conservation - Sustainable Development Innovations Fund. Logistical and
among female grizzly bears increased linearly with move-        in-kind support was provided by Calm Air Airlines, Great White Bear Tours,
ment rate in the Mackenzie Delta region.                        Praxair, Inc., Ruffwear, Inc. and Wapusk National Park.

                                                                Received: 29 May 2013 Accepted: 12 December 2013
Conclusions                                                     Published: 21 December 2013
Our results support previous findings and Traditional
Knowledge that polar bears are opportunistic foragers that      References
                                                                1. Granadeiro JP, Nunes M, Silva MC, Furness RW: Flexible foraging strategy
exploit a wide variety of plants and animals (e.g., [14,19]).       of Cory’s shearwater, Calonectris diomedea, during the chick-rearing
There are clear spatial patterns of food use, especially            period. Anim Behav 1998, 56:1169–1176.
among plants, and ample evidence that multiple different        2. Eide NE, Eid PM, Prestrud P, Swenson JE: Dietary responses of arctic foxes
                                                                    Alopex lagopus lagopus to changing prey availability across an Arctic
foods are consumed during single feeding sessions. These            landscape. Wildl Biol 2005, 11:109–121.
foraging patterns define food mixing and omnivory               3. Elmhagen B, Tannerfeldt M, Verucci P, Angerbjörn A: The arctic fox
strategies on relatively small spatial and temporal scales.         (Alopex lagopus): an opportunistic specialist. J Zool (Lond) 2000, 251:139–149.
                                                                4. Edwards MA, Derocher AE, Hobson KA, Branigan M, Nagy JA: Fast
They would permit the bears to maximize calorie intake              carnivores and slow herbivores: differential foraging strategies among
while minimizing energy expenditures associated with                grizzly bears in the Canadian Arctic. Oecologia 2011, 165:877–889.
movement [12]. Non-energetic benefits, such as fulfilling       5. Westoby M: What are the biological bases of varied diets? Am Nat 1978,
                                                                    985:627–631.
vitamin/mineral requirements, diluting toxins, assessing        6. Hailey A, Chidavaenzi RL, Loveridge JP: Diet mixing in the omnivorous
new resources and learning processes, may also motivate             tortoise Kinixys spekii. Funct Ecol 1998, 12:373–385.
seemingly unprofitable foraging behaviors [5,67,76,77].         7. Murdoch WW: Switching in general predators: experiments on predator
                                                                    specificity and stability of prey populations. Ecol Monogr 1969, 39:335–354.
  We suggest that future research include genetic analyses      8. Abrams PA: Functional responses of optimal foragers. Am Nat 1982,
to allow definition of the diet compositions of individuals         120:382–390.
Gormezano and Rockwell BMC Ecology 2013, 13:51 Page 12 of 13
http://www.biomedcentral.com/1472-6785/13/51
9. Fortin JK, Farley SD, Rode KD, Robbins CT: Dietary and spatial overlap 37. Wolniewicz R: Field guide to skulls and bones of mammals of the northeastern
between sympatric ursids relative to salmon use. Ursus 2007, 18:19–29. United States: volume 1 – skulls and mandibles. Magnolia, Massachusetts:
10. Ben-David M, Titus K, Beier LR: Consumption of salmon by Alaskan brown Richard Wolniewicz; 2001.
bears: a trade-off between nutritional requirements and the risk of 38. Wolniewicz R: Field guide to skulls and bones of mammals of the northeastern
infanticide? Oecologia 2004, 138:465–474. United States: volume 2 - the long bones. Magnolia, Massachusetts: Richard
11. Singer MS, Bernays EA: Understanding omnivory needs a behavioral Wolniewicz; 2004.
perspective. Ecology 2003, 84:2532–2537. 39. Brunner H, Coman B: The identification of mammalian hair. Melbourne,
12. Robbins CT, Fortin JK, Rode KD, Farley SD, Shipley LA, Felicetti LA: Australia: Inkata Press; 1974.
Optimizing protein intake as a foraging strategy to maximize mass gain 40. Johnson KL: Wildflowers of Churchill and the Hudson Bay region. Winnipeg,
in an omnivore. Oikos 2007, 116:1675–1682. Manitoba: Manitoba Museum of Man and Nature; 1987.
13. Loughrey AG: The polar bear and its protection. Oryx 1956, 3:233–239. 41. Marles RJ, Clavelle C, Monteleone L, Tays N, Burns D: Aboriginal plant use in
14. Russell RH: The food habits of polar bears of James Bay and southwest Canada’s northwest boreal forest. Vancouver, British Columbia: University of
Hudson Bay in summer and autumn. Arctic 1975, 28:117–129. British Columbia; 2000.
15. Iversen M, Aars J, Haug T, Alsos IG, Lydersen C, Bachmann L, Kovacs KM: 42. Hewitt DG, Robbins CT: Estimating grizzly bear food habits from fecal
The diet of polar bears (Ursus maritimus) from Svalbard, Norway, inferred analysis. Wildl Soc Bull 1996, 24:547–550.
from scat analysis. Polar Biol 2013, 36:561–571. 43. Pritchard GT, Robbins CT: Digestive and metabolic efficiencies of grizzly
16. Gormezano LJ, Rockwell RF: What to eat now? shifts in polar bear and black bears. Can J Zool 1990, 68:1645–1651.
terrestrial diet in western Hudson Bay. Ecol Evol 2013, 3:3509–3523. 44. Best RC: Digestibility of ringed seals by the polar bear. Can J Zool 1985,
17. Stirling I, Derocher AE: Effects of climate warming on polar bears: a 63:1033–1036.
review of the evidence. Global Change Biol 2012, 18:2694–2706. 45. Parks EK, Derocher AE, Lunn NJ: Seasonal and annual movement patterns
18. Thiemann GW, Iverson SJ, Stirling I: Polar bear diets and arctic marine of polar bears on the sea ice of Hudson Bay. Can J Zool 2006, 84:1281–1294.
food webs: insights from fatty acid analysis. Ecol Monogr 2008, 78:591–613. 46. Brook RK, Kenkel NC: A multivariate approach to vegetation mapping of
19. Lemelin HR, Dowsley M, Walmark B, Siebel F, Bird L, Hunter G, Myles T, Manitoba’s Hudson Bay lowlands. Int J Remote Sens 2002, 23:4761–4776.
Mack M, Gull M, Kakekaspan M, The Washaho First Nation at Fort Severn, 47. Zar J: Biostatistical Analysis. Upper Saddle: Prentice Hall; 1999.
The Weenusk First Nation at Peawanuck: Wabusk of the Omushkegouk: 48. Holm S: A simple sequentially rejective multiple test procedure. Scand J
Cree-polar bear (Ursus maritimus) interactions in northern Ontario. Stat 1979, 6:65–70.
Hum Ecol 2010, 38:803–815. 49. Lunn NJ, Stirling I: The significance of supplemental food to polar bears
20. Regehr EV, Lunn NJ, Amstrup SC, Stirling I: Survival and population size of during the ice-free period of Hudson Bay. Can J Zool 1985, 63:2291–2297.
polar bears in western Hudson Bay in relation to earlier sea ice breakup. 50. Guðmundsson G: Gathering and processing of lyme-grass (Elymus arenarius L.)
J Wildl Manage 2007, 71:2673–2683. in Iceland: an ethnohistorical account. Veget Hist Archaeobot 1996, 5:13–23.
21. Stirling I, Lunn NJ, Iacozza J: Long-term trends in the population ecology 51. Facciola S: Cornucopia II: A source book for edible plants. 2nd edition. Vista,
of polar bears in western Hudson Bay in relation to climate change. California: Kampong publications; 1998.
Arctic 1999, 52:294–306. 52. Derocher AE, Andriashek D, Stirling I: Terrestrial foraging by polar bears
22. Rockwell RF, Gormezano LJ, Koons DN: Trophic matches and mismatches: during the ice-free period in western Hudson Bay. Arctic 1993, 46:251–254.
can polar bears reduce the abundance of nesting snow geese in 53. Latour PB: Spatial relationships and behavior of polar bears
western Hudson Bay? Oikos 2011, 120:696–709. (Ursus maritimus Phipps) concentrated on land during the ice-free
23. Rockwell RF, Gormezano LJ: The early bear gets the goose: climate season of Hudson Bay. Can J Zool 1981, 59:1763–1774.
change, polar bears and lesser snow geese in western Hudson Bay. 54. Ritchie JC: The vegetation of northern Manitoba. V. Establishing the
Polar Biol 2009, 32:539–547. major zonation. Arctic 1960, 13:210–229.
24. Dyck MG, Kebreab E: Estimating the energetic contribution of polar bear 55. Lüning K: Growth strategies of three Laminaria species (Phaeophyceae)
(Ursus maritimus) summer diets to the total energy budget. J Mammal inhabiting different depth zones in the sublittoral region of Helgoland
2009, 90:585–593. (North Sea). Mar Ecol Prog Ser 1979, 1:195–1979.
25. Derocher AE, Wiig ∅, Bangjord G: Predation of Svalbard reindeer by polar 56. MacLean SF: Life cycle and growth energetics of the Arctic crane fly
bears. Polar Biol 2000, 23:675–678. Pedicia hannai antenatta. Oikos 1973, 24:436–443.
26. Nussey DH, Postma E, Gienapp P, Visser ME: Selection of heritable 57. Stirling I: Polar bears: The natural history of a threatened species. Markham,
phenotypic plasticity in a wild bird population. Science 2005, Ontario: Fitzhenry and Whiteside Publications; 2011.
310:304–306. 58. Lønø O: The polar bear (Ursus maritimus Phipps) in the Svalbard area.
27. Iles DT, Peterson SL, Gormezano LJ, Koons DN, Rockwell RF: Terrestrial Norsk Polarinst Skri 1970, 149:1–103.
predation by polar bears: not just a wild goose chase. Polar Biol. in press. 59. Born EW, Heilmann A, Holm LK, Laidre KL: Polar bears in northwest
28. Smith AE, Hill MRJ: Polar bear, Ursus maritimus, depredation of Canada Greenland: an interview survey about the catch and climate. In Man and
Goose, Branta canadensis, nests. Can Field Nat 1995, 110:339–340. Societ. Copenhagen, Denmark: Museum Tusculanum Press, University of
29. Drent R, Prop J: Barnacle goose Branta leucopsis survey on Copenhagen; 2011 [Gulløv, HC (Series Editor): Monographs on Greenland, Vol 41.].
Nordenskiöldkysten, west Spitsbergen 1975–2007: breeding in 60. Iversen M: The diet of polar bears (Ursus maritimus) from Svalbard, Norway,
relation to carrying capacity and predator impact. Circumpolar Stud inferred from scat analysis. MS thesis: University of Tromsø, Department of
2008, 4:59–83. Arctic and Marine Biology; 2011.
30. Madsen J, Bregnballe T, Frikke J, Kristensen IB: Correlates of predator 61. Alisauskas RT, Rockwell RF, Dufour KW, Cooch EG, Zimmerman G, Drake KL,
abundance with snow and ice conditions and their role in determining Leafloor JO, Moser TJ, Reed E: Harvest, survival and abundance of
timing of nesting and breeding success in Svalbard Light-bellied Brent midcontinent lesser snow geese relative to population reduction efforts.
Geese Branta bernicla hrota. Nor Polarinst Skr 1998, 200:221–234. Wildl Monogr 2011, 179:1–42.
31. Koettlitz R: Contributions to the natural history of the polar bear 62. Abraham KF, Thompson JE: Defining the Pen Islands caribou herd of southern
(Ursus maritimus, Linn.). Proc R Phys Soc 1898, 14:78–112. Hudson Bay. In The Seventh North American Caribou Conference: 19–21 August
32. Pederson A: Polar Animals. New York: Taplinger Publishing; 1966. 1996. 10th edition. Thunder Bay, Ontario: Rangifer, Special Issue; 1996:33–40.
33. Derocher AE, Stirling I: Distribution of polar bears (Ursus maritimus) during 63. Reiter ME, Andersen DE: Trends in abundance of collared lemmings near
the ice-free period in western Hudson Bay. Can J Zool 1990, 68:1395–1403. Cape Churchill, Manitoba, Canada. J Mammal 2008, 89:138–144.
34. Stirling I, Parkinson CL: Possible effects of climate warming on selected 64. Smith DA, Foster JB: Notes on the small mammals of Churchill, Manitoba.
populations of polar bears (Ursus maritimus) in the Canadian Arctic. J Mammal 1957, 38:98–115.
Arctic 2006, 59:261–275. 65. Doutt JK: Polar bear dens on the Twin Islands, James Bay, Canada.
35. Lunn N: Polar bears and climate change in western Hudson Bay. J Mammal 1967, 48:468–471.
Wapusk News 2008, 1:1–3. 66. Chadwick RW, Copeland MF, Chadwick CJ: Enhanced pesticide
36. Post L: The bird building book: a manual for preparing bird skeletons with a metabolism, a previously unreported effect of dietary fibre in mammals.
bone identification guide. Homer, Alaska: L. Post; 2005. Fd Cosmet Toxicol 1978, 16:217–225.You can also read