Potential of GPM IMERG Precipitation Estimates to Monitor Natural Disaster Triggers in Urban Areas: The Case of Rio de Janeiro, Brazil - MDPI
←
→
Page content transcription
If your browser does not render page correctly, please read the page content below
remote sensing
Article
Potential of GPM IMERG Precipitation Estimates to
Monitor Natural Disaster Triggers in Urban Areas:
The Case of Rio de Janeiro, Brazil
Augusto Getirana 1,2, * , Dalia Kirschbaum 1 , Felipe Mandarino 3 , Marta Ottoni 4 ,
Sana Khan 1,5 and Kristi Arsenault 1,2
 1    Hydrological Sciences Laboratory, NASA Goddard Space Flight Center, Greenbelt, MD 20771, USA;
      dalia.b.kirschbaum@nasa.gov (D.K.); sana.khan@nasa.gov (S.K.); kristi.r.arsenault@nasa.gov (K.A.)
 2    Science Applications International Corporation, Greenbelt, MD 20771, USA
 3    Instituto Pereira Passos, Rio de Janeiro 22221-070, Brazil; felipe.mandarino@rio.rj.gov.br
 4    Geological Survey of Brazil, Rio de Janeiro 22290-240, Brazil; marta.ottoni@cprm.gov.br
 5    Earth System Science Interdisciplinary Center, University of Maryland, College Park, MD 20740, USA
 *    Correspondence: augusto.getirana@nasa.gov

 Received: 17 November 2020; Accepted: 11 December 2020; Published: 15 December 2020

 Abstract: Extreme rainfall can be a catastrophic trigger for natural disaster events at urban scales.
 However, there remains large uncertainties as to how satellite precipitation can identify these triggers
 at a city scale. The objective of this study is to evaluate the potential of satellite-based rainfall estimates
 to monitor natural disaster triggers in urban areas. Rainfall estimates from the Global Precipitation
 Measurement (GPM) mission are evaluated over the city of Rio de Janeiro, Brazil, where urban
 floods and landslides occur periodically as a result of extreme rainfall events. Two rainfall products
 derived from the Integrated Multi-satellite Retrievals for GPM (IMERG), the IMERG Early and IMERG
 Final products, are integrated into the Noah Multi-Parameterization (Noah-MP) land surface model
 in order to simulate the spatial and temporal dynamics of two key hydrometeorological disaster
 triggers across the city over the wet seasons during 2001–2019. Here, total runoff (TR) and rootzone
 soil moisture (RZSM) are considered as flood and landslide triggers, respectively. Ground-based
 observations at 33 pluviometric stations are interpolated, and the resulting rainfall fields are used in an
 in-situ precipitation-based simulation, considered as the reference for evaluating the IMERG-driven
 simulations. The evaluation is performed during the wet seasons (November-April), when average
 rainfall over the city is 4.4 mm/day. Results show that IMERG products show low spatial variability
 at the city scale, generally overestimate rainfall rates by 12–35%, and impacts on TR and RZSM vary
 spatially mostly as a function of land cover and soil types. Results based on statistical and categorical
 metrics show that IMERG skill in detecting extreme events is moderate, with IMERG Final performing
 slightly better for most metrics. By analyzing two recent storms, we observe that IMERG detects
 mostly hourly extreme events, but underestimates rainfall rates, resulting in underestimated TR and
 RZSM. An evaluation of normalized time series using percentiles shows that both satellite products
 have significantly improved skill in detecting extreme events when compared to the evaluation using
 absolute values, indicating that IMERG precipitation could be potentially used as a predictor for
 natural disasters in urban areas.

 Keywords: IMERG; extreme events; precipitation; natural disaster; urban flood; landslide; soil moisture;
 total runoff

Remote Sens. 2020, 12, 4095; doi:10.3390/rs12244095                         www.mdpi.com/journal/remotesensing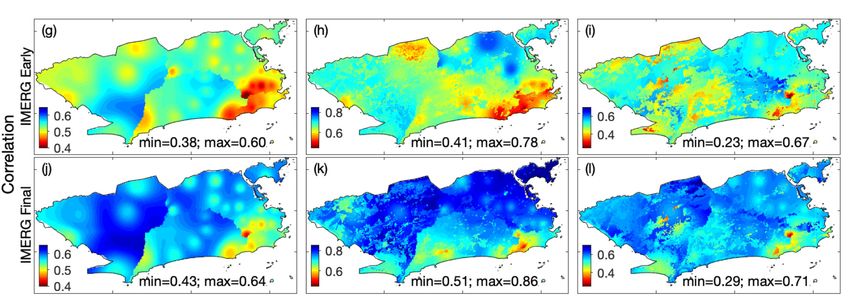
Remote Sens. 2020, 12, 4095                                                                         2 of 20

1. Introduction
      There is a notion that disasters are outcomes of inappropriate adjustments between people and
environment [1]. An example of inappropriate adjustments is the fast-urban growth observed in the
past decades, putting humans in increased natural hazard risks related to environmental degradation
that are intrinsic to urban development. Many large cities in developing countries lack urban planning
and management, resulting in inappropriate land use, often composed of informal and irregular
settlements in high hazard risk areas (e.g., along steep hills and riverbanks) [2]. Impacts of disasters
in such cities are explained by the retroactive relationships between natural hazards, urbanization
and social processes [3]. Floods and landslides are two types of disasters often triggered when these
areas are subjected to heavy and prolonged rainfall. Total runoff, a key hydrological variable in
assessing urban flood risks, is primarily related to the rainfall intensity and land use. Over urban-based
impervious land surfaces, most rainfall is converted into runoff, and without proper flood management
measures, such as river restoration measures [4], floods may occur. Landslides can occur within steep
terrain where unconsolidated sediments or fractured rock leads to surface instability. In areas of rapid
growth, such as in the impoverished areas on the outskirts or within megacities, landslide disasters can
be further exacerbated by improper building of roads, houses, poor drainage, and illegal or improper
digging [5–7]. Intense and/or prolonged rainfall is the predominate triggering factor in landslide-prone
areas where increased soil saturation and runoff can serve to mobilize the downstream transport of
debris, rock, and soil. Disaster risk mitigation in urban areas can be addressed by reducing the hazard
and/or the system vulnerability through both structural and non-structural measures [2,4]. Disaster
monitoring and forecasting are examples of non-structural measures that can be used to provide
stakeholders with information on how to implement or improve structural measures such as river
canalization, dykes and dams, or slope retrofitting as well as other non-structural measures such as
flood and landslide mapping for improved characterization of past hazards, land use regulation and
early warning systems.
      Recent studies have proposed near real time and even real time urban flood monitoring systems
through ground-based observations of water levels [8] and meteorological variables [9], weather radar
combined with ground-based sensors [10], and using crowdsourcing techniques [11]. Specialized
hydrological and hydrodynamic models have also been widely used to monitor urban floods [12–18].
High-resolution remote sensing data has been adopted as another way to monitor urban flood extent
and depth [19,20] and used as inputs in computational models or as reference for model evaluation [21].
The majority of these modeling studies indicate that runoff accuracy is key for precisely modeling
urban floods.
      Near real time or early warning landslide systems primarily rely on in situ rain gauge networks to
rapidly identify the rainfall necessary to potentially trigger a landslide. In the city of Rio de Janeiro,
an early warning system creates alerts when peak rainfall intensities reach a threshold in order
to highlight across the city where landslides are more likely to occur (http://alertario.rio.rj.gov.br/).
Similar systems in Italy have employed a network of automated rain gauges to highlight areas at
higher hazard due to landslides at the municipal and regional scale [22]. In Norway, a combination
of landslide susceptibility and rainfall thresholds is used to dynamically identify potential levels
of landslide hazard across different municipalities [23]. A landslide forecasting approach based on
the identification of rainfall intensity–duration thresholds is proposed for the mountainous region
of Rio de Janeiro State [24]. These systems typically provide information to emergency managers,
civil protection and weather forecasters to alert communities of elevated landslide risk. Nevertheless,
nearly all of the current landslide early warning systems in place rely on in situ gauge or radar
networks to inform landslide hazard [25,26]. Kirschbaum and Stanley [27] provide a global framework
for characterizing rainfall-triggered landslide hazards using satellite rainfall. However, the topic of
how satellite precipitation estimates may be used to resolve extreme rainfall relevant for triggering
hydrometeorological hazards at an urban scale is an area of open research.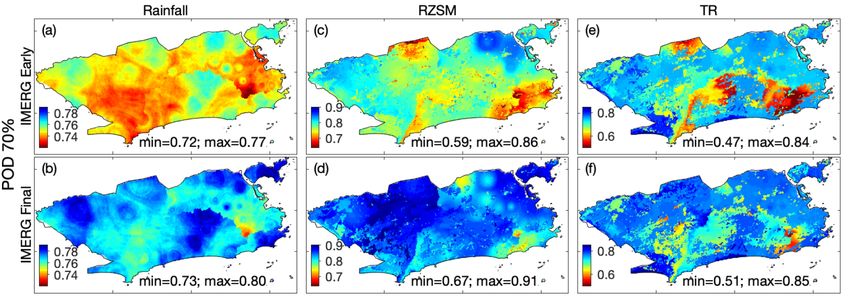
Remote Sens. 2020, 12, 4095                                                                                              3 of 20

      Over twenty years of satellite-based global rainfall estimates though the Tropical Rainfall
Measuring Mission (TRMM) [28] and the Global Precipitation Measurement (GPM) [29,30] mission
have improved our knowledge on the global water cycle and its impacts on society [31]. Several
studies have focused on the evaluation of different satellite products [32–35] and their usefulness as
a model input to simulate the water and energy balance [36–38]. Although satellite-based rainfall
estimates have been widely evaluated at large scales [39–41], few studies have focused at local
scale hydrometeorological extremes. An evaluation of TRMM Multi-satellite Precipitation Analysis
(TMPA) [28] and Integrated Multi-satellite Retrievals for GPM (IMERG) [42] rainfall estimates over
Singapore, using observations at 48 pluviometric stations as reference, concluded that daily satellite
products show moderate correlation with gauge data and underestimate heavy rainfall events [43].
Another evaluation of one storm event over Attica, Greece, showed that IMERG underestimated both
rainfall and its subsequent flood event [18]. These studies suggest that such products are generally not
adapted to monitor local scale rainfall heterogeneities at shorter timescales (i.e., sub-daily and daily),
which are essential for urban disaster monitoring. However, such a suggestion is inconclusive, due to
the restricted number of studies and limited coverage. Furthermore, there remains an open question
in the field as to how satellite precipitation estimates may be leveraged to identify and characterize
high-impact hydrometeorological events at a city scale.
      The focus for this study involves the municipality of Rio de Janeiro (RJ), Brazil, and has been
developed as part of a pioneering partnership between NASA and the city to advance natural disaster
monitoring capabilities at the city scale. As part of this partnership, RJ has been providing critical
in situ data used in combination with NASA datasets and tools to further parameterize and test
modeling frameworks designed to monitor and forecast floods and landslides. Spanning 1204 km2
in area, RJ is located in Southeastern Brazil (Figure 1a) and stands as the second largest city in the
country and ranked fifth in Latin America. The city has witnessed a significant urbanization rate in
the past few decades, where 6.72 million people live. Part of this urban expansion is composed of
informal settlements, mostly in steep hills within the city. More recently, informal settlements have
also been spreading in flat flood-prone areas. RJ has historically suffered from massive rainstorms
and subsequent floods and landslides, all of which have caused casualties and adverse socioeconomic
impacts. For example, heavy storms with rain accumulations of 90 mm within one hour and wind
gusts of around 110 km/h impacted the city between 6–7 February and 7–8 April 2019, causing floods
and landslides, and killing numerous people [44–47].

                                      (b)                                    (c)                    Land cover

  (a)
                                                                              Water
                                                                              Barren soil
                                                                              Natural veg.
                                  n

                                                                              Urban
                               ea

                                                                              Cropland
        B R A Z I L                                                           Wetland
                            Oc

                                                                              Grassland
                                                                              Open shrub.
                                                                              Closed shrub.
                        tic

                                                                              Forest
                       an
                      Atl

                                      (d)               Soil type
                                                                             (e)              Landslide susceptibility

            Rio de Janeiro

                                       Bedrock
                                       Water                                  high
                                       Clay
                                       Silty clay
                                       Sandy clay
                                       Clay loam                              medium
                                       Silty cl. loam
                                       Sandy cl. loam
                                       Sandy loam
                                       Loamy sand                             low
                                       Sand

        Figure 1. Study area/geographic location, and land surface datasets available for Rio de Janeiro city:
        (b) topography, (c) land cover, (d) soil type and (e) landslide susceptibility maps. The spatial distribution
        of pluviometric stations is also provided in panel (a).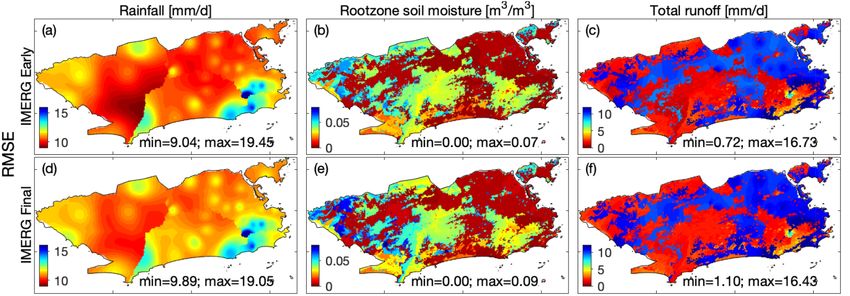
Remote Sens. 2020, 12, 4095                                                                         4 of 20

     This study is motivated by this NASA-RJ partnership’s efforts to develop a near real-time disaster
monitoring system for Rio de Janeiro, and our current limited understanding on satellite capabilities to
monitor local scale rainfall heterogeneities. Here, we aim to test the concept of how IMERG precipitation
estimates can inform hydrometeorological modeling capabilities for natural disasters at a city scale,
and their impact on simulating processes that influence floods and landslides within urban areas.
We define urban rainfall-related disasters as floods and landslides, and their hydrometeorological
related triggers as total runoff (TR) and rootzone soil moisture (RZSM). Here, RZSM is defined as
the soil layer one meter below the land surface. A state-of-the-art land surface model (LSM) is used
to simulate hydrological processes over the city, and rainfall fields, derived from the interpolation
of ground-based observations, are used as the reference for the evaluation. We first investigate how
well IMERG products and gauges match across the city, and whether they are capable of detecting
major events that occurred in the region during the wet seasons from 2001 to 2019. Wet seasons are
defined as the period between November and April, when most storms take place. Then, we evaluate
the potential of IMERG products as a predictor of TR and RZSM variables, derived from modeling
experiments using LSM outputs. This evaluation is performed across the city and over urban and
landslide-prone areas. Finally, we evaluate IMERG precipitation during two recent extreme events,
which occurred in February and April 2019. Details on the datasets and methods adopted in this study,
results, and conclusions are provided in the following sections.

2. Datasets and Methods

2.1. Modeling Framework
      The modeling framework designed for RJ used the NASA Land Information System (LIS) [48]
where multiple LSMs are implemented. LIS allows the integration and assimilation of multiple satellite
datasets into LSMs, including IMERG rainfall estimates. Land model parameters were processed using
the Land surface Data Toolkit (LDT) [49]. The LSM, as well as datasets used in this study, experimental
design and evaluation procedure are described next.
      Noah-MP
      The Noah Multi-Parameterization (Noah-MP) [50,51] land surface model, version 4.0.1, is used to
simulate the vertical water and energy balances over the city. The Noah-MP LSM builds upon the
well-known Noah LSM [52], which has been used in a variety of operational models, applications and
research studies. Noah-MP contains four soil layers and different parameterization and physics options,
which include different static vegetation and dynamic vegetation schemes, canopy resistance effects,
radiation transfer (e.g., two-stream approximation), runoff and groundwater schemes, snow model
options, and even crop and urban canopy schemes. We apply the dynamic vegetation scheme,
which employs the Ball-Berry canopy and stomatal-resistance option [53] and Noah-based soil moisture
factor for stomatal resistance. The TOPMODEL simulated groundwater scheme [54] is selected, and the
Noah-based lower boundary of soil temperature option is applied. For the crop and urban physics
schemes, these were not applied at this time, since their physics require more review prior to application
in LIS. However, to represent more realistic impervious surface responses, land use and soil types
related to urban grid-cells were treated as “bedrock”, based on suggested parameters in [55] and
assigning a slightly higher porosity for these points. According to Schueler [56], the porosity of
urban soils varies between 17% to almost 40%. In this sense, an average porosity of 28% to represent
urban areas is a valid assumption. The soil configuration simply used the dominant soil texture type
map. Other climatology-based vegetation and albedo parameter maps include monthly greenness
fraction [57] and global (snow-free) albedo [57]. Table 1 summarizes the main schemes used in Noah-MP.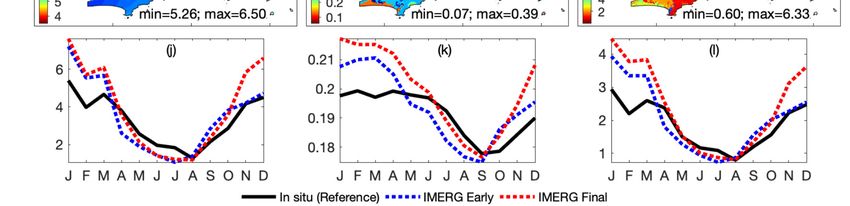
Remote Sens. 2020, 12, 4095                                                                                              5 of 20

                 Table 1. Noah-MP options adopted in this study to represent physical processes.

                 Physical Process                               Noah-MP 4.0.1 Options                      References
                                                      Dynamic simulation of carbon uptake and
                     Vegetation                       calculated by partitioning LAI and shade                  [51]
                                                                 fraction (Option 2)
                Stomatal resistance                               Ball-Berry (Option 1)                         [53]
   Soil moisture factor for stomatal resistance      Noah-type based on soil moisture (Option 1)                [58]
              Runoff & groundwater                    SIMGM: based on TOPMODEL (Option 1)                       [54]
          Surface layer drag coefficient                      Monin-Obukhov (Option 1)                          [59]
            Super-cooled liquid water               Standard freezing point depression (Option 1)               [60]
                Radiation transfer                     Modified two-stream scheme (Option 1)                    [61]
      Note: Cold-season related processes and options (e.g., snow fall, accumulation and depth) are not included here.

2.2. Meteorological Datasets
      Noah-MP was forced with the operational Global Data Assimilation System (GDAS) meteorological
analysis dataset, IMERG and rainfall fields derived from pluviometric stations. These datasets are
described below.
      IMERG
      IMERG is an algorithm that fuses information from multiple sources, including satellite microwave
and infrared precipitation estimates and ground gauge information. The IMERG algorithm uses
several passive microwave sensors to assemble and intercalibrate precipitation estimates. However,
due to the limited sampling of passive microwave sensors on low-earth-orbit platforms, the gaps are
filled by microwave-adjusted infrared estimates [62]. The IMERG algorithm is run three different
times, generating the following multi-satellite products: (i) IMERG Early (IMERG-E), available ~4 h
after the satellite observation time, allowing quick assessment for flood and landslide prediction;
(ii) Late, available ~12 h after the observation time, mainly for agricultural applications; and (iii)
Final (IMERG-F), available ~2 months after observation, once monthly gauge data become available,
for research applications. IMERG Early and Late are calibrated with climatological sets of coefficients
that vary by month and location, and IMERG Final is adjusted with monthly gauge observations.
Global data fields are available for 2001-present and provided by the NASA Precipitation Processing
System at 0.1◦ spatial resolution and at a 30-min time step. About 20 IMERG pixels covering the city
were spatially interpolated to 0.002 degrees (approximately 200 m) using the budget-bilinear approach.
      Pluviometric Stations
      Rainfall has been measured operationally every 15 min since 1997 at 33 pluviometric stations within
the city. Their spatial distribution is heterogeneous, mainly concentrated in the more developed eastern
portion of the city where there is a higher concentration of informal settlements on hills, hence more
prone to landslides. Fewer stations are located in the less developed western side (locations are shown
in Figure 1b), where informal settlements occupy flat and often flood-prone areas. The inverse distance
squared weighting approach [63] was used to spatially distribute point-based rainfall observations
throughout the city at a 0.002-degree spatial resolution and 30-min time step. Morphology was taken
into account following a similar approach suggested by Salvatici et al. [64], where the domain is
divided into sub-regions composed of catchments limited by geomorphological features and the
interpolation is performed using only rainfall observations within sub-regions. Here, the city was
divided into four catchment-based sub-regions, which are representative of the city’s morphology:
West, South, Southeast and Northeast.
Remote Sens. 2020, 12, 4095 6 of 20
2.3. Land Surface Parameterization
Key land surface parameters used in Noah-MP, in particular, topography, land cover and soil type,
were acquired from local measurements and high-resolution airborne and satellite imagery, and they
are described below and shown in Figure 1. A landslide susceptibility map, used in the analysis of
results, is also described.
Topography
Lidar data used for the model was acquired through an aerial survey in the second half of 2019,
with a raw density of eight points per square meter. Point-based cloud data was filtered for ground-only
returns and interpolated as a 15-cm spatial resolution digital terrain model map. For the purpose of
this study, the hyper-resolution data were resampled to 0.002 degrees.
Land Cover
Local land cover data were acquired from the City’s Government Environment Secretariat,
reference year 2016, as a vectorial database at a 1:10,000 cartographic scale. The vectorial database
was reclassified following the International Geosphere–Biosphere Programme (IGBP) [65] land cover
classification and converted to a 0.002-degree raster map. According to the resulting map, urban areas
represent 50% of the city’s land use.
Soil Type
The Rio de Janeiro soil map was derived from 41 soil mapping units at the scale of 1:50,000, updated
by Gomes et al. [66]. According to this study, Ultisol (also called Alfisol) soil class predominates in
the domain, followed by Oxisols [67] in, respectively, 40% and 17% of the region. A representative
soil textural class, according to the American textural classification system [68], was assigned to each
of the mapping units, taking into account granulometric fractions information (sand, silt and clay
content) of representative soil profiles obtained according to Embrapa [69]. The sandy loam class
from indiscriminate mangrove soils was assigned based on the literature on these soils. This study
allowed the estimation of the different hydraulic parameters for RJ soils required by the model, taking
its standard tables that associate textural classes with the referred hydraulic parameters as reference.
Landslide Susceptibility Map
Rio de Janeiro’s landslide susceptibility map is available at a 5-meter spatial resolution as a
result of a multicriteria spatial analysis based on the overlapping of the following layers: lithology,
soil type, slope, land cover, geotechnics and geomorphology. The susceptibility map was developed by
GEORIO, the municipal geological service, and is based on site investigations and expert analysis [70].
Three classes are defined in the map: low, medium and high susceptibilities. Here, we adopted classes
medium and high as landslide-prone areas, corresponding to 42% of the city’s surface area.
2.4. Experimental Design
To determine the potential of IMERG products to monitor TR and RZSM throughout the city,
three experiments were designed: one using ground-based precipitation (called the reference experiment
hereafter), and two using IMERG datasets, called IMERG-E and IMERG-F experiments hereafter.
Since our goal is to explore the potential for IMERG to monitor natural disasters at the near real-time
and possibly to be used to generate initial hydrological conditions for forecasts, IMERG-F is considered
here as a benchmark for IMERG-E, due to its relatively long latency and inclusion of ground-based
observations. In order to isolate the impact of IMERG products on the hydrological modeling,
all experiments were composed of the same land surface parameters and GDAS meteorological
forcings, except for the rainfall data. Experiments were run for 19 years, from 2001 to 2019, where all
meteorological datasets overlap, on a 30-min time step and 0.002-degree spatial resolution. GDAS data
was time-interpolated using linear weights to bring it down to the 30-min time step. Land surface
parameters described above were also rescaled to 0.002 degrees, matching the spatial resolution of the
modeling system. The spatial and temporal resolutions adopted here are sufficiently fine to represent
fine-scale physical processes of interest. Experiments were spun up for 50 years, allowing modeled
water storage states to stabilize.Remote Sens. 2020, 12, 4095 7 of 20
2.5. Evaluation Procedure
The lack of in situ data and insufficiently high-resolution satellite-based soil moisture and runoff
observations prevents us from evaluating model outputs against an observable truth. In the absence of
such observations, we compared IMERG experiments against the reference experiment, as it could
be considered as the most accurate representation of precipitation over the domain. Floods and
landslides are mostly triggered by extreme rainfall events, mostly common during the wet season.
Here, we defined the months from November to April as the wet season and focused all analyses on
that period, neglecting events that may have occurred in other months. The IMERG evaluation was
performed daily at both point-based and city-wide scales, using metrics such as bias, root mean square
error (RMSE), and correlation. The evaluation of extreme event detection skill was performed by using
two categorical metrics: the probability of detection (POD) and false alarm rate (FAR). POD defines the
rate of correct satellite-based rainfall estimates, while FAR is the rate of false ones, as defined below:
a
POD = (1)
a+c
b
FAR = (2)
b+d
where a is the number of simulated events above the threshold correctly observed, b stands for the
number of false alarms (simulated events above the threshold detected but not observed), c is the
number of simulated events above the threshold not observed, and d is the sum of events above the
threshold neither observed nor simulated. POD values range from zero to 1, where zero corresponds
to no skill in correctly detecting events and 1 stands for a skillful system correctly detecting all events.
FAR values also range from zero to one, where zero is the ideal case, meaning that no events were
wrongly detected, and 1 indicates that events were wrongly detected throughout the study period.
For the point-based evaluation, we categorized the extreme events into three classes according
to different rainfall thresholds [71,72]: moderate rain (≥10 mm/day), heavy rain (≥25 mm/day) and
torrential rain (≥50 mm/day). Next, we evaluated the accuracy of spatially-distributed precipitation
estimates and their impact on simulated rootzone soil moisture and total runoff by means of correlation,
root mean square error (RMSE), POD and FAR. For the spatial analysis, thresholds were defined as
percentiles rather than absolute values. Percentile thresholds are commonly used for extreme event
monitoring and forecast [73–76]. Percentiles were computed for each pixel from each experiment,
individually, using the full 2001–2019 period (i.e., dry seasons were also considered). By considering
the full period, which includes a large quantity of low or no rain events during the dry seasons,
it can impact percentiles in a way that extreme events become rarer, thus higher percentile values.
Daily rainfall, RZSM and TR over the full period (i.e., a total of 6939 daily events per grid cell) were
ranked and converted to their corresponding percentiles, from 1% (least severe wet events) to 100%
(most severe wet events). Finally, five percentile thresholds of varying likelihood of occurrence were
defined: abnormally wet (≥70%), moderately wet (≥80%), severely wet (≥90%), extremely wet (≥95%),
and exceptionally wet (≥98%).
3. Results
3.1. Point-Based IMERG Evaluation
Point-based comparisons at 33 pluviometric stations indicate that both IMERG products
overestimate rainfall estimates during wet seasons throughout the city, with median biases of
0.66 mm/day for IMERG-E (Figure 2a) and 1.6 mm/day for IMERG-F (Figure 2d). The higher bias
obtained with IMERG-F could be explained by corrections using ground-based observations. Brazil’s
nationwide rain gauge network [77], normally available for the international scientific community, is not
available in Rio de Janeiro and remains scarce in the surrounding region. This network also excludes the
municipal rain gauge network used in this study. Such a geographic limitation may result in biases overRemote Sens. 2020, 12, 4095 8 of 20
coastal areas where orographic and other meteorological processes dominate precipitation patterns
and where the satellite retrieval algorithms may be less sensitive to land-ocean background states.
Biases with respect to rain gauges could result from the positioning of the gauges lower down on the
slopes where peak intensities may not be resolved, or from gauge under catch resulting from wind or
debris on the gauge. One station stands out with a high negative bias (i.e., satellite estimates are lower
than observations) of −2.66 mm/day and −1.78 mm/day, respectively, in Southeast RJ. That station is
situated at 355-m high on steep hills near the coast where landslides are frequent, and neighbourhoods
downstream often flood during storms. RMSE values are high relative to the average rainfall, varying
from 10.4 to 19.5 mm/day, depending on the station and satellite product (Figure 2b,e). Daily IMERG
products show moderate correlation with gauge data, varying from 0.38 and 0.58 (Figure 2c,f) and
median correlation values of 0.49 (IMERG-E) and 0.54 (IMERG-F). These results are consistent with the
point-based skill evaluation, revealing a moderate POD for events greater than or equal to 10 mm/day,
averaging 0.53 and 0.6, respectively (Figure 3a,d). Overall, IMERG-F indicates more skill in detecting
extreme events than IMERG-E, although it has higher bias and RMSE values. POD values degrade
for higher rainfall thresholds greater than or equal to 25 and 50 mm/day, averaging 0.33 and 0.16 for
IMERG-E and 0.44 and 0.24 for IMERG-F. As shown in Figure 3g–l, false alarm rates of extreme events
are high for both satellite products and all selected thresholds, with FAR averages varying from 0.57
(rainfall ≥ 10 mm/day) to 0.8 (rainfall ≥ 50 mm/day). High FAR values indicate that high rainfall
rates are detected by IMERG, but not observed, which could explain the positive bias and high RMSE
discussed above.
3.2. IMERG Impacts on Total Runoff and Rootzone Soil Moisture Simulations
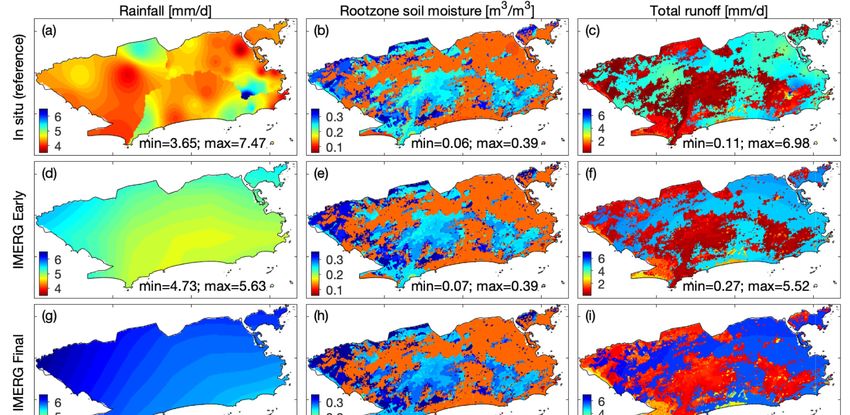
Figure 4 shows the spatially-distributed averages of rainfall, RZSM and TR over the city during
wet seasons derived from the spatial distribution of reference pluviometric data and IMERG products,
and corresponding monthly climatologies. Based on the reference rainfall, the average precipitation
over RJ is 4.43 mm/day, with a heterogeneous spatial distribution, varying from 3.65 to 7.47 mm/day.
The spatial variability of RZSM derived from the reference rainfall reflects the land cover classification
and soil composition, with low average values over urban areas (0.13 m3 /m3 ), explained by the low
infiltration rates as a result of the impervious urban land cover, and high over landslide-prone areas
(0.26 m3 /m3 ). RZSM averages 0.21 m3 /m3 over the city. Generally, high soil moisture variability
means more infiltration during rain events, resulting in more water available for evapotranspiration,
hence less available surface water to run off. This is evident in the model simulation, where average
TR is 4.33 mm/day (or 97% of rainfall) over urban areas, and 0.65 mm/day (15% of rainfall) over
landslide-prone areas.
Bias [mm/day] RMSE [mm/day] Correlation
(a) (b) (c)
IMERG Early
2 20
0.5
0 15 0.4
-2 min=-2.66; max=1.49 10 min=10.48; max=19.53 0.3 min=0.36; max=0.54
(d) (e) (f)
IMERG Final
2 20
0.5
0 15 0.4
-2 min=-1.81; max=2.32 10 min=11.69; max=19.95 0.3 min=0.31; max=0.56
Figure 2. Daily bias, root mean square error (RMSE) and correlation for IMERG Early (a–c) and IMERG
Final (d–f) at 33 pluviometric stations for 2001–2019 wet seasons (November-April). Limits of Rio de
Janeiro city are defined by the black line.Remote Sens. 2020, 12, 4095 9 of 20
Rainfall 10mm/day Rainfall 25mm/day Rainfall 50mm/day
(a) (b) (c)
IMERG Early
0.5 0.5 0.5
min=0.41; max=0.58 min=0.23; max=0.39 min=0.06; max=0.28
POD
0 0 0
(d) (e) (f)
IMERG Final
0.5 0.5 0.5
0 min=0.49; max=0.66 0 min=0.32; max=0.54 0 min=0.13; max=0.38
(g) (h) (i)
IMERG Early
1 1 1
0.5 min=0.49; max=0.79 0.5 min=0.58; max=0.88 0.5 min=0.71; max=0.95
FAR
(j) (k) (l)
IMERG Final
1 1 1
0.5 min=0.49; max=0.81 0.5 min=0.60; max=0.88 0.5 min=0.66; max=0.93
Figure 3. Probability of detection (POD) and false alarm rate (FAR) maps at three rainfall thresholds (≥10 mm/day, ≥25 mm/day and ≥50 mm/day) for IMERG Early
(a–c,g–i) and IMERG Final (d–f, j–l) at 33 pluviometric stations for 2001–2019 wet seasons.Remote Sens. 2020, 12, 4095 10 of 20
Remote Sens. 2020, 12, x FOR PEER REVIEW 10 of 20
Figure
Figure4.4.Spatially
Spatiallydistributed
distributedrainfall,
rainfall,rootzone
rootzonesoil
soil moisture
moisture (RZSM) and total runoff
runoff (TR)
(TR)averaged
averaged
over
over2001–2019
2001–2019wetwetseasons
seasonsderived
derivedfrom
from the
the experiments
experiments using ground-based
ground‐based (a–c),
(a–c), IMERG
IMERG Early
Early
(d–f)and
(d–f) andIMERG
IMERG Final (g–i)
(g–i)rainfall
rainfallestimates.
estimates.Spatially-averaged
Spatially‐averagedmonthly climatology
monthly climatologytimetime
series are
series
shown
are shownin the bottom
in the bottom(j–l).
(j–l).
AlthoughofIMERG
3.3. Evaluation Selected products
Events overestimate average rainfall over the city during wet seasons by
about 12% or 5.01 mm/day (IMERG-E), and 35% or 5.93 mm/day (IMERG-F), they both show low
We variability.
spatial selected two Thismajor
couldstorms to further
be a result evaluate
of IMERG’s the potential
insufficiently fineofspatial
IMERG in detecting
resolution natural
to represent
disaster
local heterogeneities. Monthly climatologies show that IMERG overestimates rainfall during(Event
triggers in urban areas. They occurred on Feb 5‐7, 2019 (Event 1) and Apr 9‐10, 2019 most
2)ofand
theresulted in floods
wet season, exceptand landslides,
April. causing major
Such differences socio‐economic
in rainfall have littledamage
impact in onthe city. Figure
average RZSM,7
shows hourly rainfall
but significantly from
impacts TR,the reference
especially and
over IMERG
urban areas,products and their
with average impact
increases on TRfrom
ranging over14%
urban
to
and
34%. RZSM
As a over
result,landslide‐prone areas fordistributed
RMSE for the spatially both events. In Event
rainfall 1, two
is high, rainfall
varying from peaks are observed
9 to 19.4 mm/day
two days5a,d),
(Figure apart, reaching
similarly to 15mm/h.
those found Although the first oneevaluation.
for the point-based was detected RMSE by isIMERG, both high
particularly satellite
in
products underestimate the total rainfall by about half. The second peak
the city’s coastal south-eastern hilly extents, a rainfall hotspot where observations are much higheris missed by IMERG,
showing
than thesmaller rainfall
city average. eventsproducts
IMERG distributed
alsoover
show 24the
h instead. Over urbanwith
lowest correlation areas,
thethe total observed
reference rainfall
rainfall during Event 1 was 128mm, as opposed to a much lower amount of 71
over that location, varying between 0.38–0.45. Except for the rainfall hotspot, correlation over most of and 62mm detected
bytheIMERG‐E
city rangesand IMERG‐F,
from respectively.
0.5 to 0.64, with IMERG-FSuch performing
low IMERG‐based generally rainfall
betterrates
than resulted
IMERG-E. inDespite
45–51%
TRtheunderestimation.
moderate IMERGOver landslide‐prone
performance areas,spatially
in providing the reference experiment
distributed rainfallshows
estimatestwooverconsecutive
the city,
RZSM
RZSMraises
is not within 2 days,
as degraded, occurring
with during
relatively each rainfall
low RMSE peak and
values, ranging totalling
from zero toa0.09soilm 3 /m3 , andincrease
moisture higher
ofcorrelation,
65%. The varying
soil saturation
from 0.41 caused by the
and 0.86, second on
depending raise
the occurred in Feb and
satellite product 6‐7 location.
concomitant On thewith the
other
surging of numerous landslides over the city [45]. High RZSM levels derived
hand, TR is highly degraded, in particular in the south-eastern extent of the city, with RMSE values as from IMERG‐based
experiments
high as 16.7 at the beginning
mm/day of Eventas
and correlation 1 are
lowexplained
as 0.23. by an early storm detected by IMERG, peaking
~10mm/h, but not observed (not shown). As a result, the low rainfall peak was enough for RZSM to
reach the reference level at the end of the first peak, but not to rise to the maximum reference moisture
at the end of the second peak. Event 2 was characterized by a 2‐day‐long storm, totalling 201mm of
rainfall across the city (193mm over urban areas and 213mm over landslide‐prone areas), with 183mm
during the first 24 h. This storm had three peaks with decreasing magnitudes over time. Both satellite
products successfully detected the two major ones, but IMERG‐F performed better, with a total
rainfall of 122mm, as opposed to 69mm with IMERG‐E. The underestimated rainfall resulted in 36–
64% lower TR over urban areas. Although slightly underestimated, soil moisture signals wereRemote Sens. 2020, 12, x FOR PEER REVIEW 11 of 20
properly represented, in particular by IMERG‐F rainfall. The results obtained for these two cases
suggest that,
Remote Sens. although
2020, 12, 4095 IMERG products overestimate the average rainfall across the city, some
11severe
of 20
storms might still be underestimated.
Figure
Figure5.5. Spatially
Spatially distributed
distributed RMSE and correlation
RMSE and correlationof
ofabsolute
absoluterainfall,
rainfall,rootzone
rootzonesoil
soilmoisture
moisture and
and
total
totalrunoff
runoff estimates
estimates over 2001–2019 wet
over 2001–2019 wet seasons.
seasons. Results
Resultsare
areshown
shownforforexperiments
experimentswith
with IMERG
IMERG
Early (a–c and g–i) and IMERG Final (d–f
Early (a–c,g–i) and IMERG Final (d–f,j–l). and j–l).
Figure 6 Skill
3.4. Detection summarizes the Events
of Extreme results for the fullofdomain,
in Terms landslide-prone and urban areas. A comparison
Percentiles
of performances between satellite products reveals that IMERG-E has lower RMSE values over the
threeBased
regions onbutthelow evidence of anindicating
correlation, overall mismatch between
that it has better skillreference‐based
in estimating rainfalland IMERG‐based
magnitudes
extreme
and not in rainfall timing. RMSE is basically the same for both IMERG-based RZSM estimatesin
events in terms of the total mm/day, we considered event detection evaluation andterms
veryof
percentiles.
similar for TR Using percentiles
estimates, is a wayshows
while IMERG-F to normalize
an overall time
betterseries independently,
performance in terms ofbased on the
correlation.
magnitude of the events, and remove any biases found between two
Over landslide-prone areas, where RZSM is a disaster trigger, RMSE is low relative to the average independent sources. In this
way, it helps us understand IMERG’s skill to detect daily extreme categorical
soil moisture and correlation is higher than those obtained for rainfall estimates. On the other hand, events, even if the
magnitudes
TR over urban differ.
areasAsdoes
an example,
not perform Figure 8 shows
as well. the spatial
Although distribution
the western extent ofof POD
the cityand FAR for
is poorly
normalized RZSM and TR at a percentile threshold 70%,
monitored, it shows an overall better performance in term of RMSE and correlation, possibly due toof
rainfall, i.e., panels show the probability
IMERG‐based
the lower irregular hydrometeorological
geomorphology. variables to detect or provide a false alarm of an event that is
70% or higher than all events in the time series at each pixel (POD and FAR maps for percentile
3.3. Evaluation
thresholds 80%, 90%, 95%
of Selected Eventsand 98% are shown in Figure S1‐S4). Based on similar maps for all
five thresholds,
We selectedastwo defined
majorinstorms
Section to 2.5, we computed
further evaluate the medians
potentialof of
percentile‐based
IMERG in detecting POD natural
and FAR
values
disasterover urbaninand
triggers landslide‐prone
urban areas. They occurredareas foroneach5–7 IMERG‐based
February 2019 experiment.
(Event 1) andAs summarized
9–10 April 2019in
Figure
(Event 2) and resulted in floods and landslides, causing major socio-economic damage inthan
9, we can observe that percentile‐based POD and FAR are significantly higher those
the city.
obtained
Figure 7 using
showsabsolute valuesfrom
hourly rainfall of rainfall, TR andand
the reference RZSM.
IMERG Thisproducts
demonstratesand theirthat, although
impact on TR IMERG‐
over
based experiments moderately detect event magnitudes, it shows higher
urban and RZSM over landslide-prone areas for both events. In Event 1, two rainfall peaks are observed skill in detecting
occurrences.
two days apart, However,
reachingboth15 POD
mm/h. and FAR degrade
Although as one
the first a function of rainfall
was detected intensity.both
by IMERG, Median POD
satellite
values
productsrange from 0.75 to
underestimate 0.84
the forrainfall
total abnormal (70%)
by about half.hydrometeorological
The second peak is missed eventsby (i.e., rainfall,
IMERG, TR and
showing
RZSM)
smalleroccurring over distributed
rainfall events urban and over landslide‐prone
24 h instead.areasOverand
urbandegrade
areas, to the0.28‐0.42 for exceptional
total observed rainfall
events
during(98%).
Event 1This wasmeans
128 mm, thatasthe more exceptional
opposed to a much lowerthe event
amountis, less
of 71likely
and IMERG will detect
62 mm detected byit.
IMERG-E and IMERG-F, respectively. Such low IMERG-based rainfall
IMERG‐F skill to detect extreme events is slightly higher. Median FAR values are generally low, rates resulted in 45–51% TR
underestimation. Over landslide-prone areas, the reference experiment shows two consecutive RZSMRemote Sens. 2020, 12, 4095 12 of 20
raises within 2 days, occurring during each rainfall peak and totalling a soil moisture increase of
65%. The soil saturation caused by the second raise occurred in 6–7 February concomitant with the
surging of numerous landslides over the city [45]. High RZSM levels derived from IMERG-based
experiments at the beginning of Event 1 are explained by an early storm detected by IMERG, peaking
~10 mm/h, but not observed (not shown). As a result, the low rainfall peak was enough for RZSM
to reach the reference level at the end of the first peak, but not to rise to the maximum reference
moisture
Remote at the
Sens. 2020, 12, xend
FORofPEER
the REVIEW
second peak. Event 2 was characterized by a 2-day-long storm, totalling 12 of 20
201 mm of rainfall across the city (193 mm over urban areas and 213 mm over landslide-prone areas),
with 183
ranging mm0.2
from during the first
to 0.29 24 h. This storm
for abnormal had
events, three peakstowith
improving 0.02decreasing magnitudes
for exceptional overSuch
events. time.an
improvement is explained by the fact that the more exceptional the event is, larger the ensemblea of
Both satellite products successfully detected the two major ones, but IMERG-F performed better, with
total rainfallevents
non‐observed of 122 will
mm,be. as opposed to 69mm
All thresholds with
below IMERG-E.
95% TheIMERG
show that underestimated rainfall
experiments resulted
provide fewer
in 36–64% lower TR over urban areas. Although slightly underestimated, soil moisture
false alarms for rainfall than RZSM over landslide‐prone areas, indicating that IMERG generally signals were
properly represented,
overestimates in particular
low rain events duringbytheIMERG-F rainfall.
wet seasons, The results
resulting obtained
in more RZSMfor these two
extreme cases
events than
suggest that, although IMERG products overestimate the average rainfall across the city, some severe
observed. Rainfall and TR show similar FAR for all thresholds, confirming the high correlation
storms might still be underestimated.
between these two variables over urban areas.
Rainfall Rootzone soil moisture Total runoff
6
6 0.27
5
0.21 4
5.5
Average
0.15 3
5 2
0.09
1
4.5 0.03
0
0.05 11.5
11.3
0.04 9.5
11.1 0.03 7.5
RMSE
0.02 5.5
10.9
0.01 3.5
10.7 1.5
0
0.58 0.58
0.77
Correlation
0.56 0.73 0.54
0.54 0.69 0.50
0.65
0.52 0.46
ain lide an ain lid e an
ma
in lide an
om ands urb om n ds urb o ds urb
fu l
l d l fu ll d la fu l
ld la n
IMERG Early IMERG Final Reference
Figure
Figure6. 6.Average,
Average,RMSE
RMSEand
andcorrelation
correlation of
of precipitation, rootzone soil
precipitation, rootzone soilmoisture
moistureandandtotal
totalrunoff
runoff
derived
derivedfrom experimentsusing
from experiments using ground‐based,
ground-based, IMERG
IMERG Early
Early and IMERGand Final
IMERG Final precipitation
precipitation estimates.
Results are
estimates. shownare
Results as medians
shown asformedians
2001–2019for wet seasons over
2001–2019 wetthe full domain,
seasons and full
over the landslide-prone
domain, and
and urban areas. 3 /m3 for
landslide‐prone andAverage and RMSE
urban areas. unitsand
Average areRMSE
mm/day for are
units rainfall and total
mm/day runoff, and m
for rainfall total runoff,
rootzone soil moisture.
and m /m for rootzone soil moisture.
3 3Remote Sens. 2020, 12, 4095 13 of 20
Remote Sens. 2020, 12, x FOR PEER REVIEW 13 of 20
February 2019 (Event 1) April 2019 (Event 2)
Rainfall [mm/h] TR [mm/h] Rainfall [mm/h] TR [mm/h]
15
128 mm 123 mm 20 193 mm 20 184 mm
12
71 mm 68 mm 69 mm 15 66 mm
10
Urban
62 mm 8 60 mm 122 mm 117 mm
10 10
5 4 5
0 0 0 0
Rainfall [mm/h] RZSM [m 3/m 3] Rainfall [mm/h] RZSM [m 3/m 3]
20
147 mm 213 mm
72 mm 0.24 20 77 mm
Landslide
0.28
61 mm 126 mm
10
10
0.2 0.24
0 0
4 5 6 7 4 5 6 7 8 9 10 8 9 10
In situ (Reference) IMERG Early IMERG Final
Figure 7. Selected storm
storm events
eventsin
inRio
RiodedeJaneiro
Janeirocity
cityand
and impacts
impacts onon total
total runoff
runoff (TR)(TR)
andand rootzone
rootzone soil
soil moisture
moisture (RZSM)
(RZSM) over urban
over urban (top)
(top) and and landslide‐prone
landslide-prone (bottom)(bottom) areas.
areas. Left Leftshow
panels panels
the show the
evolution
evolution of occurred
of the storm the stormfrom
occurred from 5–7
5–7 February February
2019 (Event 2019 (Event
1), and right1), and show
panels right panels show
the storm thatthe storm
occurred
that occurred
in 9–10 in 9–10
April 2019 April
(Event 2).2019 (Event
Results 2). Results
are shown at thearehourly
showntime
at the
stephourly time indicate
and x-axes step anddays
x‐axes
of
indicate days of the month.
the month.
3.4. Detection Skill of Extreme Events in Terms of Percentiles
Based on the evidence of an overall mismatch between reference-based and IMERG-based extreme
events in terms of the total mm/day, we considered event detection evaluation in terms of percentiles.
Using percentiles is a way to normalize time series independently, based on the magnitude of the
events, and remove any biases found between two independent sources. In this way, it helps us
understand IMERG’s skill to detect daily extreme categorical events, even if the magnitudes differ.
As an example, Figure 8 shows the spatial distribution of POD and FAR for normalized rainfall,
RZSM and TR at a percentile threshold ≥70%, i.e., panels show the probability of IMERG-based
hydrometeorological variables to detect or provide a false alarm of an event that is 70% or higher than
all events in the time series at each pixel (POD and FAR maps for percentile thresholds ≥80%, ≥90%,
≥95% and ≥98% are shown in Figures S1–S4). Based on similar maps for all five thresholds, as defined
Figure 2.5,
in Section 8. Probability
we computed of detection
medians (POD)ofand false alarm rate (FAR)
percentile-based POD mapsand FARfor rainfall(a–b),
values over rootzone
urban and
soil moistureareas
landslide-prone (RZSM) for(c–d)
eachand total runoff (TR)
IMERG-based (e–f)events
experiment. Asderived from experiments
summarized in Figure 9,with
we IMERG
can observe
Early and IMERG POD
that percentile-based Final at
andtheFARpercentile threshold higher
are significantly 70% chance
thanof occurrence.
those obtained using absolute values
of rainfall, TR and RZSM. This demonstrates that, although IMERG-based experiments moderately
4. Discussion
detect event magnitudes, it shows higher skill in detecting occurrences. However, both POD and
FAR Itdegrade as a function
is important to highlightof rainfall intensity.weMedian
that although POD values rainfall
used ground‐based range from 0.75 to 0.84
observations for
as the
abnormal (≥70%)
reference for thishydrometeorological
analysis, the gauging events (i.e., rainfall,
network TR distribution
spatial and RZSM) occurring
does notover urban and
represent all
landslide-prone areas and degrade to 0.28–0.42 for exceptional events
climatologic and geographic heterogeneities found in the city. The complex topography within RJ (≥98%). This means that the
more exceptional
creates the event
microclimates is, lessrainfall
that cause likely IMERG will detect
accumulations it. IMERG-F vary
to significantly skill to detect
across extreme
the events
city. Rainfall
is slightly
totals higher.based
can differ Median FARprevailing
on the values arewind generally low,ofranging
patterns fromand
the storms 0.2 to 0.29 the
where for abnormal events,
storms originate
improving
and move, to 0.02 for
further exceptional events.
complicating the abilitySuchtoan improvementdefine
systematically is explained by the fact
local maxima in that the more
rainfall. The
exceptional enhancement
orographic the event is, larger
of thesethesystems
ensemble of non-observed
resulting events will
from the complex be. All thresholds
topography below 95%
and microclimates
show that
within theIMERG experiments
city further complicate provide fewer false
the ability to get alarms for rainfall
a complete and than RZSM
accurate over landslide-prone
representation of total
areas, indicating
rainfall across thethat
city.IMERG generally distribution
The geographic overestimates oflow
the rain events during
33 pluviometric the wet
zones seasons, resulting
are primarily located
moreelevations,
in low RZSM extremewhichevents than observed.
could result Rainfall and TR
in an underestimation show
of the similar
actual FAR for all
precipitation overthresholds,
the city.
confirming the high correlation between these two variables over urban areas.
There is also a sparser gauge network in the western portion of the municipality, which may impact
the total accumulations of gauge‐based estimates when comparing averages across the city. However,
there are also known challenges in comparing satellite estimates with individual observations from
rainfall gauges for a number of reasons. First, the IMERG data is composed of integrating passive
microwave estimates from a constellation of approximately 10 satellites that are in non‐synchronous
or polar orbits. These observations are then merged, morphed and filled in with infrared date fromIn situ (Reference) IMERG Early IMERG Final
Figure 7. Selected storm events in Rio de Janeiro city and impacts on total runoff (TR) and rootzone
soil moisture (RZSM) over urban (top) and landslide‐prone (bottom) areas. Left panels show the
evolution of the storm occurred from 5–7 February 2019 (Event 1), and right panels show the storm
Remotethat
Sens.occurred in 9–10 April 2019 (Event 2). Results are shown at the hourly time step and x‐axes
2020, 12, 4095 14 of 20
indicate days of the month.
Remote Sens. 2020, 12, x FOR PEER REVIEW 14 of 20
geostationary satellites. If there is a short convective storm that has high rainfall intensities, but which
develops and dissipates within 30 min, unless there is a passive microwave sensor observing that
Figure
stormFigure 8.8. Probability
directly, Probability of detection
there is a of detection
chance (POD)
that(POD) and false
false
the satellite
and alarm rate
product
alarm rate (FAR)
could (FAR) maps
partly
maps forrainfall
or for rainfall(a–b),
entirely miss the
(a,b), rootzone
event. This
rootzone
soil
likelysoil moisture
is moisture (RZSM)
why we (RZSM) (c–d)
observe(c,d)
IMERG and total runoff
resolving
and total (TR) (e–f)events
a portion
runoff (TR) of the
(e,f) events derived
extreme
derived from experiments
fromrainfall but not
experiments with
with IMERG
resolving
IMERG the
Early
entireEarly and
event,
and IMERG
hence
IMERG Finalatatthe
thepercentile
underestimating
Final percentile threshold
the total storm70%
threshold 70% chance
volumes.
chance of occurrence.
of occurrence.
4. Discussion POD FAR
0.9
Rainfall
It
is important
0.8 to highlight that TR
although we used
0.3
Rainfall
ground‐based TR
rainfall observations as the
0.7
reference for this analysis, the gauging network spatial distribution does not represent all
Urban
0.6
climatologic and geographic heterogeneities found 0.2 in the city. The complex topography within RJ
0.5
creates microclimates that cause rainfall accumulations to significantly vary across the city. Rainfall
0.4can differ based on the prevailing wind patterns
totals 0.1 of the storms and where the storms originate
and 0.3
move, further complicating the ability to systematically define local maxima in rainfall. The
0.2
orographic enhancement of these systems resulting from 0 the complex topography and microclimates
within
0.9 the city further complicate the ability to get a complete and accurate representation of total
rainfall Rainfall RZSM Rainfall RZSM located
0.8 across the city. The geographic distribution of0.3
the 33 pluviometric zones are primarily
in low
0.7 elevations, which could result in an underestimation of the actual precipitation over the city.
Landslide
There0.6is also a sparser gauge network in the western0.2 portion of the municipality, which may impact
the total
0.5 accumulations of gauge‐based estimates when comparing averages across the city. However,
there0.4are also known challenges in comparing satellite 0.1 estimates with individual observations from
rainfall
0.3 gauges for a number of reasons. First, the IMERG data is composed of integrating passive
microwave
0.2 estimates from a constellation of approximately
0 10 satellites that are in non‐synchronous
70% 80% 90% 95% 98% 70% 80% 90% 95% 98% 70% 80% 90% 95% 98% 70% 80% 90% 95% 98%
or polar orbits. These observations are then merged,
IMERG Early
morphed and filled in with infrared date from
IMERG Final
Figure 9. Median
Median POD
POD and
andFAR
FAR for
for rainfall,
rainfall, rootzone
rootzone soil
soil moisture
moisture (RZSM)
(RZSM) and
and total
total runoff
runoff (TR) rates
derived from IMERG-E
IMERG‐E and IMERG-F
IMERG‐F experiments at percentile thresholds
thresholds of 70%, ≥80%,
of ≥70%, 80%, 90%,
≥90%,
95% and 98% over the urban and landslide‐prone areas.
≥95% and ≥98% over the urban and landslide-prone areas.
4. Discussion
The sparse number of gauges in the western part of the city and the interpolation technique used
to generate the reference
It is important rainfall fields
to highlight are otherwe
that although factors
usedimpacting
ground-basedthe accuracy
rainfall of the reference
observations as
rainfall fields. Here,
the reference weanalysis,
for this assumedthe thatgauging
the inverse distance
network squared
spatial weightingdoes
distribution approach constrained
not represent all
by catchment‐based
climatologic sub‐regions
and geographic was sufficient
heterogeneities to take
found in themorphology into account
city. The complex and accurately
topography within RJ
spatialize point‐based rainfall observations. However, we acknowledge that this
creates microclimates that cause rainfall accumulations to significantly vary across the city. Rainfall technique has
restrictions by not
totals can differ considering
based all topographic
on the prevailing and coastal
wind patterns effects.
of the storms andSuch
whererestrictions,
the stormsinoriginate
additionand to
limitations in the land parameterization and numerical representation of physical processes
move, further complicating the ability to systematically define local maxima in rainfall. The orographic in Noah‐
MP, may result
enhancement in inaccurate
of these systems estimates of water
resulting from storages topography
the complex and fluxes. and For microclimates
example, due within to the
unavailability
the city furtherofcomplicate
an urban hydrology
the abilitymodule
to get aincomplete
the Noah‐MP availablerepresentation
and accurate in LIS, we usedofthe “bedrock”
total rainfall
soil class to represent urban imperviousness. Although this could emulate
across the city. The geographic distribution of the 33 pluviometric zones are primarily located in low the impacts of
urbanization on water fluxes and storage, it is not ideal to represent impacts buildings
elevations, which could result in an underestimation of the actual precipitation over the city. There is on the energy
balance [78]. Itgauge
also a sparser also isnetwork
important to note
in the that,portion
western since Noah‐MP does not store
of the municipality, whichTRmay
from a timethe
impact step to
total
another, surface water is not available for further evaporation after rain events.
accumulations of gauge-based estimates when comparing averages across the city. However, there are Hence, the actual TR
could be lower during prolonged floods.
5. Summary and Final Considerations
Previous studies have successfully demonstrated that satellite precipitation can be used at large
and mesoscale hydrometeorological monitoring and modeling with sufficient accuracy [79–81].You can also read