This is an Accepted Manuscript of an article published by Elsevier in Applied Acoustics on 03February2021, available online
←
→
Page content transcription
If your browser does not render page correctly, please read the page content below
1

This is an Accepted Manuscript of an article published by Elsevier in
Applied Acoustics on 03February2021, available online:
https://www.sciencedirect.com/science/article/abs/pii/S0003682X21000037

Bringing music to the park: the effect of Musikiosk on the quality of
public experience

Daniel Steelea, Valérian Fraissea, Edda Bilda, and Catherine Guastavinoa

a
 McGill University, School of Information Studies (SIS) & Centre for Interdisciplinary
Research in Music Media and Technology (CIRMMT), Montreal, Canada

Correspondence: daniel.steele@mail.mcgill.ca, 3661 Peel St, Montreal, QC, H3A 1X1,
Canada

 Abstract: Large parks have been studied for their tranquil and restorative
 properties, including in the sonic dimension. The auditory experience of users in
 small urban green spaces, such as pocket parks is less well understood, especially
 as they can contain sound sources much more reflective of dense, urban activities.
 Musikiosk, a soundscape intervention, was deployed in a small Montreal park that
 allowed users to bring their own devices and play their own content over publicly
 provided speakers. A questionnaire study (N = 197) revealed that users found the
 park more pleasant, eventful, and vibrant with the presence of Musikiosk, without
 an associated change in calmness or appropriateness, and better for their mood
 states than a typical park visit. Musikiosk also reduced the likelihood that park
 users mentioned hearing traffic noise. Those who were more noise sensitive
 experienced most of the benefits of both the park visit and Musikiosk, however it
 did not diminish their mentions of traffic noise. These results have implications for
 theories and policies concerning the sounds of public spaces.

 Keywords: Soundscape, Soundscape intervention, quality of the urban public
 experience, sound source evaluation, pocket park, public space
2

 1. Introduction

Urban parks have been traditionally designed and maintained as spaces to temporarily
“get away” from the city without having to leave it. While there is extensive literature on
large public parks, particularly in relation to providing access to quietness (Filipan et al.
2017), recent research indicates that, pocket parks (Blake 2013) – small parks situated in
central, busy locations – may offer similar benefits (Nordh and Østby 2013) (REFS ). Yet
the sound environments of pocket parks and the role they play in providing these benefits
have remained relatively unstudied. Considering that their physical size (usually smaller
than a city block) and central location make them unlikely to exhibit low sound levels,
pocket parks provide a unique opportunity to revisit the implicit relationship between
parks, quietness and perceived benefits in busy urban centers. This research further draws
on bodies of work in soundscape and restoration, linked to pocket parks through a model
concerned with public experience in urbanized settings (Steele, Bild, et al. 2019).
 We thus research the quality of the urban experience of users of a small urban
park, as well as in the particular context of a soundscape intervention (Musikiosk)
installed in the same park. Finally, building on previous work showing the role of noise
sensitivity in soundscape perception and evaluation, we investigate the influence of noise
sensitivity, an individual factor, on sound source perception and evaluation, in our effort
to understand what type of individual differences might further modulate differences in
urban pocket park experiences.
 We structure our research using the QUPE – the Quality of the Urban Public
Experience – model, developed in a previous paper (Steele, Bild, et al. 2019), to address
the quality of experience from a sound perspective. The QUPE model helps contextualize
and group diverse experiential evaluation methods from the soundscape literature (e.g.
SSQP, restorativeness, sound sources), different types of outcomes (e.g., sound-related,
psychological) as well as the interaction between soundscape evaluation and individual
factors.
 This paper reports an in-depth analysis of the auditory experience in a Montreal
pocket park, with a focus on the changes brought about by the Musikiosk intervention as
measured with a multi-section questionnaire deployed with and without the intervention
in place. This paper expands on a preliminary quantitative analysis (Steele et al. 2016) by
investigating the influence of noise sensitivity on QUPE, as well as with an in-depth

3

qualitative analysis of sound sources reported by park users. It further complements
qualitative analyses of park user interviews reported in Steele et al. (2019).
 We address the following research questions:
 1) What is the quality of the urban public experience for users of an urban
pocket park in downtown Montreal?
 2) How does a musical soundscape intervention influence the quality of the
urban experience in this urban pocket park?
 3) How does individual noise sensitivity influence the quality of the urban
public experience?
 The paper is structured as follows: Section 2 provides a literature review of park
soundscapes, the QUPE framework, noise sensitivity, and soundscape interventions in
public spaces. Section 3 offers an overview of the data collection and analysis methods,
as well as a brief description of the park context and of the soundscape installation, and
Section 4 details the results structured based on the QUPE aspects discussed. In Section
5 we summarize the findings along the research questions and discuss the implications of
the main findings in the context of the literature. We conclude with Section 6, with a
summary of the overall effects of Musikiosk as well as an overview of contributions to
theory and practice

 2. Review

Addressing the identified research questions necessitates bringing together different
bodies of literatures, namely research on park soundscape, empirical studies on
soundscape interventions and research on noise sensitivity, as an individual factor
possibly moderating QUPE.

 2.1 Park Soundscapes

There is converging evidence that large urban parks have beneficial effects for users, for
example, on mood and stress relief (Jansson and Persson 2010; Nilsson, Sangster, and
Konijnendijk 2011). However, many of these studies have been conducted in the context
of large urban or regional parks dominated by greenery, with a focus on restorativeness
and quietness – usually defined in relation to low decibel levels and in opposition to the
“loud” and presumably stress-inducing city. It remains an open question whether these
benefits apply when the park size is scaled down - the smallest urban parks, sometimes
4

called pocket parks (Blake 2013), are often as busy (and noisy) as the surrounding city
and contain more modest greenery.
 Within the regulatory framework, parks (traditionally understood as large urban,
mostly green spaces) tend to be labeled as sensitive areas, falling under “quiet area”
practices, and have been consequently subject to the strictest decibel limits among
traditional urban uses (see “Good Practice Guide on Quiet Areas” 2014). Such policies
seldom cover other forms of public spaces, so do not consider smaller urban pocket parks
like the ones discussed in this paper. Nonetheless, while parks have been traditionally
associated with quietness, soundscape research has begun to contextualize the importance
of quietness in relation to other factors associated with park visits, like expected sounds
and social relationships (Filipan et al. 2017). For example, Guastavino (2006) asked city
users to describe the ideal urban soundscape. Responses referred primarily to wanting to
experience a variety of soundscapes (38% of the descriptions) across neighborhoods,
times of the day and times of the year - only 30% of the descriptions referred to
tranquility, followed by animation (20%). In a similar vein, in Brambilla and Maffei’s
(2006) study, participants rated the “acceptability” of three parks; silence was rated as
“very important” by 57% of these participants, ranking lower than other factors such as
safety, landscape, cleanliness, and clean air. Of their participants, only 26% stated to have
visited the identified study parks to “look for quiet”.
 Traditional notions (and subsequent sound management strategies) about urban
parks suggest that they should be quiet, but research shows that few users explicitly seek
out that quality. In line with the body of research on soundscape (Bild, Coler, et al. 2016),
the focus for studying park sound quality should be on the experience of users rather than
on physical measurements of sound i.e. low sound levels.

 2.2 Quality of the urban public experience (QUPE)

The QUPE model (Figure 1; from Steele et al. 2019) focuses on how people experience
public spaces. The present study details a truncated version of the original model –
reporting only on the sound-related evaluation and on the psychological outcomes - to
highlight the findings arising from a soundscape intervention using a questionnaire data
instrument.
5

 Soundscape
 Sound-related evaluation
 evaluation
 Specific sounds

 Mood
 Quality of the
 urban public Psychological
 Restorativeness
 outcomes
 experience
 (QUPE) Public space
 (…)
 engagement

 (...)

Figure 1: A model for the Quality of the Urban Public Experience (QUPE). Concepts in bold are used in this study;
greyed-out concepts are part of the QUPE framework but are not covered in the present study.

QUPE: Sound-related evaluation

The Swedish Soundscape-Quality Protocol (SSQP) has been developed as a practical tool
for assessing soundscape quality along a set of eight scales: pleasant, unpleasant, eventful,
uneventful, vibrant, monotonous, calm, chaotic (Axelsson, Nilsson, and Berglund 2012).
The SSQP was originally developed in Swedish, but it has been translated, not without
issues, into English, Korean and French (see Tarlao, Steele, Fernandez, et al. (2016) for
more information).
 Soundscape studies have taken a diverse approach in identifying soundscape
appropriateness (see Steele et al. (2019) for a thorough review). Studies have included
laboratory and everyday situations and have attempted to variously measure how
appropriate the soundscape is to a location, or for various performed or imagined
activities. Rather than consider overall appropriateness, some have focused on the
appropriateness of individual sound sources, particularly in relation to sounds that
“belong” (or not) in a particular context. Urban sound sources are numerous and can be
rich in detail and numerous attempts at categorizations and taxonomies have been
proposed - see e.g. Brown et al. (2016) for a review. In this paper, we rely on the
consensus building around such categories as human, nature, and mechanical.
 Thus, for urban parks, Brambilla and Maffei (2006) showed an inverse
relationship between users’ expectations that sounds “belong” in a park and whether they
are found to be annoying in such a context; for example, birds chirping (‘natural’ sound
6

sources) were expected and were not rated as annoying while road traffic (‘mechanical’
sound sources) was not expected and was rated as annoying. Along the lines of the
aforementioned SSQP’s use of eight independent scales, other recent work has shown
that the presence of humans and their voices in public spaces especially contribute to a
vibrancy dimension, independent from pleasantness (Aletta and Kang 2018).
 The aforementioned “ideal soundscapes” study (Guastavino 2006) confirmed that
mechanical sources are generally viewed as negative, while human and natural sources
are viewed as positive. In a laboratory test of traffic pass-by noises based on in-situ
recordings, Morel et al (2012) demonstrated that, compared to more steady-state sounds
like traffic passing at constant speeds, the sounds of acceleration and deceleration were
more associated with negative evaluations. As sounds mix in complex ways in everyday
outdoor environments, the interaction between expected and unexpected, or ‘positive’
and ‘negative’ sounds remains an open area of study, thus raising the question, for
example, whether the presence or absence of certain sources could influence the overall
evaluation of a space.
 Finally, musical sound sources ambiguously straddle the boundary between
mechanical and human sources, and so do their evaluations. Guastavino (2006) showed
that music in urban soundscapes was deemed negative if it emanated from a technical
apparatus like a car radio or loudspeaker, but positive if it reflected human activity (e.g.
“musician”).

2.2.2 QUPE: psychological outcomes

Restorativeness

Under Attention Restoration Theory (ART), restorative environments enable users to
recover from drained cognitive resources (Kaplan 1995; Herzog et al. 1997). Restorative
soundscapes, specifically, enable users to recover from the negative effect of noise
exposure by providing psychological restoration, both in terms of recovery from
attentional fatigue and ability to reflect on daily or life issues (Payne 2009). Payne (2013)
demonstrated that urban soundscapes generally have less restorativeness potential than
large urban park soundscapes in particular, and yet less than rural soundscapes. However,
little research has been conducted on the restorative potential of the soundscapes of
pocket parks in particular.
7

 Research outside of the soundscape literature suggests measurable benefits of
smaller urban parks on restoration. One laboratory study (Nordh and Østby 2013) showed
that, based on visual-only assessments, pocket parks have the potential to afford
restoration; furthermore, specifically for parks with a “perceived social dimension”
described by their “social” and “cultural” dimensions, users’ evaluations tended to focus
on the restorative aspects of socialization rather than the explicit stress relief offered by a
nature (Peschardt, Stigsdotter, and Schipperrijn 2016; Peschardt and Stigsdotter 2013).
Steele at al. (2019) further showed that high-quality soundscapes in a pocket park can
stimulate physical activity, intensify social interactions, and promote feelings of
familiarity and safety, which could, in turn, afford more restorativeness.

Mood

Individuals’ moods have been demonstrated to affect their soundscape evaluations.
Steffens et al. (2017), using a simplified version of mood ratings (i.e. a single, self-
reported scale), showed a significant effect of mood on ratings of pleasantness,
eventfulness, and familiarity, with an even more pronounced relationship when music
was present during an evaluation (Steffens, Steele, and Guastavino 2016).
 Mood also changes in response to the urban environment. Irvine et al. (2009), in
the context of urban parks, found a preference for natural sounds over people and
mechanical sounds, though it’s unclear if this applies to urban pocket parks where people
sounds (and potentially music) are a resource that contribute to its character. While pocket
parks have received attention in the design literature, there is not much information
available specifically about their potential mood benefits to users. One study (Tyrväinen
et al. 2014) that did take into account different types of urban green spaces conducted a
questionnaire with stationary participants in both a large urban park and an urban forest
and found that, while the mood benefits were similarly large, the duration of the mood
benefit was longer for those who had visited the forest. In the urban park condition, mood
either decreased or did not change.

 2.3 Noise Sensitivity

Sensitivity to Noise has been the subject of considerable research for almost over two
decades (e.g. Job 1999; Guski 1999). Noise sensitivity, generally measured with a multi-
question index (Kishikawa et al. 2006), has primarily been used to demonstrate that those
8

who report being the most sensitive are most susceptible to noise annoyance. Noise-
sensitive persons generally report poorer environmental quality in residential areas in the
presence of a dominant sound source like air traffic, but less is known about how
sensitivity effects individual, overall perception (Schreckenberg, Griefahn, and Meis
2010).
 However, only a few studies investigate the impact of noise sensitivity on
soundscape assessment in urban settings. Broadly speaking, noise sensitivity has been
associated with the need for quietness in urban environments (Booi and Van den Berg
2012). Noise sensitivity may even be a stronger indicator than sound level in predicting
health outcomes related to noise exposure (Park et al. 2017). Returning to public space
research, an in-situ study in an urban green area reported significant relation between a
Noise Sensitivity binary variable and a range of soundscape Likert scales including
chaotic, annoying, monotonous, calm, pleasant, and perceived loudness (Aletta, Van
Renterghem, and Botteldooren 2018). Similarly, a comparative meta-study across several
urban and indoor types of spaces reported significant links between a Noise Sensitivity
scale and the soundscape scales of pleasant, monotonous, calm, restorativeness and
perceived loudness (Tarlao, Steele, and Guastavino 2019).

 2.4 Soundscape interventions

Some previous research has examined the effects of outdoor sound installations in urban
public spaces on users’ evaluations and behaviors. These have been done using various
types of added sounds e.g. synthetic (De Coensel et al. 2010) or pre-recorded - prepared
compositions, for example, to complement fountain sounds (Hellstrom 2012), or meant
to support design goals like ambiance in collaboration with space designers (Steele,
Legast, et al. 2019). One study using added forest sounds along with a new physical
landscape structure in a public square showed that, despite higher sound levels, an
artificially modified sound environment improved user experience (Cerwén 2016).
 In a study on auditory comfort in public spaces, Yang and Kang (2005) showed
that sound source type played a role in evaluations of comfort; introducing sounds to
spaces that were considered pleasant (such as music and water), even rather loud ones,
produced a considerable improvement in acoustic comfort. Along the same lines,
evaluations of soundscapes dominated by road traffic sounds can be improved by adding
sounds of natural origin (De Coensel, Vanwetswinkel, and Botteldooren 2011; Van
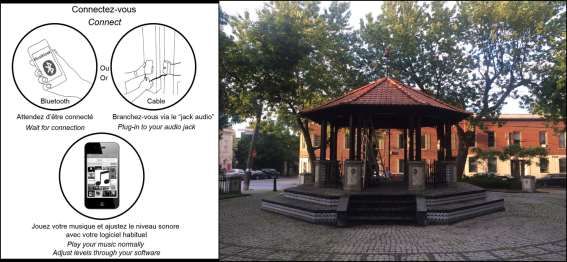
9

Renterghem et al. 2020), e.g. bird songs or water sounds. Others have studied how added
sounds through the introduction of new amenities, like water features, in public spaces to
reduce the impacts of traffic noise for space users (Jeon et al. 2012; Galbrun and Ali 2012;
Trudeau, Steele, and Guastavino 2020, forthcoming).
 Quantitative research by Yamasaki et al. (2015) indicates that when exposed to
music, people give higher ratings of their environment, both in terms of sonic and visual
aspects. Musical sound installations have also been shown to change soundscape ratings
of eventful and exciting (Jambrošić, Horvat, and Domitrović 2013). Specifically, in the
context of Musikiosk, the authors found however that users began using a lightly utilized
area of the park without displacing the existing users (Steele, Bild, et al. 2019).
Furthermore, while technically adding sound to a space, the Musikiosk intervention was
largely evaluated as beneficial (in terms of e.g. increasing perceived safety, and
diversifying park use without displacing existing users), even for park users who were
not (actively) engaged with the intervention.

 3. Methods

 3.1 Musikiosk and Parc du Portugal

Conceived in the summer of 2014 as a collaboration between McGill University and the
École de technologie supérior (ÉTS), Musikiosk (see Figure 2) was designed to be a
temporary urban soundscape intervention. For an extensive timeline of the preparation,
outreach, and methods deployment, see Steele et al. (2019). Musikiosk comprised of a set
of speakers, a control box, a volume knob, and an audio jack, installed in the gazebo of
Parc du Portugal (Montreal) for two months in the late summer of 2015. It provided free,
unsupervised access for any users who wished to engage; it also shut down automatically
at night and limited maximum playback levels. Musikiosk allowed people to play
whatever audio content they wished in the public space within these operational limits.
 The Parc du Portugal is a small pocket park directly on a busy commercial artery,
on one side and residential streets on the other three sides. Because of its location, the
park hosts a diverse combination of peacefully overlapping users: recurrent users - elderly
members of a Portuguese community, employees from businesses nearby - and also
passers-by – people waiting for the bus or for their friends before going out in the venues
of rue St. Laurent, etc. - see Bild et al. (2018) for more details. On the far residential side
10

Figure 2: (Left) Instructions provided for users inside of the gazebo. (Right) The gazebo of Parc du Portugal during
Musikiosk installation.

is a traditional Portuguese gazebo structure, whose closed, intimate form proved ideal to
contain the installation and its visitors quite well from an acoustic perspective, limiting
the propagation of sound that could have disrupted the lives of nearby residents.
Additionally, the structure protects the system and users from the elements.

 3.2 Data collection strategy

The data reported were collected as part of a larger research project that combined
qualitative and quantitative methods, including questionnaires, interviews, audio
recordings, and participant observations. Here, we primarily present the results of the
questionnaires. Results obtained from other research methods are available in other
publications (Steele, Bild, et al. 2019; Bild et al. 2018; Bild, Tarlao, et al. 2016).

3.2.1 Questionnaire

Questionnaires comprised a combination of open and closed-ended questions.
Participants were asked to evaluate their soundscape and to list the sounds they heard
around them. They were also asked for their demographic and psychological information
(gender, age, noise sensitivity). Variations on the same questionnaire were deployed
under 3 conditions: 1) before the installation of Musikiosk (Q1), 2) when Musikiosk was
in use – with Musikiosk users (Q2) and 3) when Musikiosk was in use – with other park
users who were not using Musikiosk (Q3). Thus, Q2 and Q3 participants were also asked
a series of questions on their opinions of Musikiosk. All scales were a 7-point Likert
11

scale.
 All 3 questionnaire conditions included 7 of the 8 SSQP scales (pleasant,
unpleasant, eventful, vibrant, monotonous, calm, chaotic). Uneventful was excluded from
the questionnaire because of a lack of a suitable translation in French, and therefore the
analysis and figures cannot be presented using the ISO recommendations, which requires
an eventful-uneventful axis (ISO/TS 12913-2:2018 2018). Appropriateness (for activity)
was included after the SSQP. All 3 questionnaires also asked for mood before and during
the park visit, as self-reported, asked directly on a pair of single-item scales. For
restoration, three of the four theoretical components the Perceived Restorativeness
Soundscape Scale (PRSS) were considered to be relevant to a pocket park context: that
the soundscape allows for effortless attention (Fascination), provides a shift away from
the present situation (Being-Away, or Break), and fits the needs and expectations of the
user (Compatibility) (Sarah R Payne and Guastavino 2018). Noise sensitivity was
measured using the Weinstein's noise sensitivity scale (WNS-6B; Kishikawa et al. 2006).
See Table A.
 Participants in the Q1 and Q3 conditions were asked to list the sounds they heard
according to their valence. Three columns were provided to write in: Pleasant,
Unpleasant, Neutral. Participants were instructed to manually write sound sources into
the appropriate column. This source-listing activity was deemed inappropriate for
Musikiosk users, as they were playing their own sound content and may have been doing
so at much higher levels than the ambient environment.

3.2.2 Recruitment

Consistent with the university’s ethics policy (REB #55-0615), all participants were
approached in the park by researchers and asked to take a voluntary, unpaid questionnaire
of under 10 minutes available in either French or English (completely in one language or
the other). Participants were approached about the questionnaire after they had already
been in the park for a few minutes in order to ensure that they had been exposed to the
park and its sound environment before making judgments.

3.2.3 Questionnaire deployment and conditions

The similar questionnaires were deployed under 3 conditions, see Table B. The
questionnaire from each of the three conditions was minimally modified to be relevant to
12

the participants’ experiences:

Table A: The complete questionnaire instrument

Topic Question Type Label Conditions
 tested
 I find this soundscape to be:
 Pleasant Scale Pleasant Q1-3
 Unpleasant Scale Unpleasant Q1-3
 Eventful Scale Eventful Q1-3
 SSQP
 Vibrant Scale Vibrant Q1-3
 Soundscape Scales

 Monotonous Scale Monotonous Q1-3
 Calm Scale Calm Q1-3
 Chaotic Scale Chaotic Q1-3
 The soundscape I hear is appropriate Scale Appropriate Q1-3
 Appropriateness for my activity

 I find these sounds fascinating Scale Fascination Q1, Q3
 Spending time in this soundscape Scale Break Q1, Q3
 Restorativeness gives me a break from my day-to-day
 routine
 It’s easy to do what I want while I’m Scale Compatibility Q1, Q3
 in this soundscape
 What was your mood before coming Scale MoodBefore Q1-3
 to the park?
 Mood
 What is your mood now? Scale MoodNow Q1-3
 Can you list below some sounds that you hear here in the park?
 Pleasant Free Pleasant Q1, Q3
 Response Sources
 Sound Sources Unpleasant Free Unpleasant Q1, Q3
 Response Sources
 Neutral Free Neutral Q1, Q3
 Response Sources
 I am sensitive to noise Scale Noise Q1-3
 Sensitive
 I find it hard to relax in a place that’s Scale - Q1-3
 noisy
 I get mad at people who make noise Scale - Q1-3
 Noise Sensitivity that keeps me from falling asleep or
 getting work done
 I get annoyed when my neighbors Scale - Q1-3
 are noisy
 I get used to most noises without Scale - Q1-3
 much difficulty
13

Table B: Summary of questionnaire conditions

 Condition Description Number of Questionnaires
 Label Collected

 Q1 Pre-installation park users 87

 Q2 Musikiosk users 41

 Q3 Park users not using Musikiosk 68

Q1) Before the installation of Musikiosk - for 10 days in advance of the project’s
installation, 88 questionnaires were administered;

Q2) While Musikiosk was in use – 41 users of Musikiosk were given questionnaires about
their experience using the system as well as some questions about the park, common to
the other questionnaire conditions. Participants in this condition were recruited on the
basis of having used the system themselves and interacted with their own device to control
played content.

Q3) While Musikiosk was in use – 67 questionnaires were collected with park visitors
who did not use Musikiosk (referred to as “non-users of Musikiosk”). This group was
varied and included park visitors who were friends of Musikiosk users as well as those
seated on the other side of the park, who were unaware of the installation.
 To the extent that it was possible, questionnaires covered a diverse range of the
park’s users and contexts in terms of demographics, time-of-day (9AM-11PM), day of
the week (all seven), and meteorological conditions.

 3.3 Data processing and analysis

Analysis are first shown collapsed across all three conditions, Q1, Q2, and Q3 to
demonstrate the general effect of the park on users’ experiences. Results are subsequently
provided by condition to show the specific effects of Musikiosk.
 Responses were coded manually into a spreadsheet by a member of the research
team. The resulting dataset was subject to a number of statistical tests. Since the
assumptions for parametric statistics were violated, trends were identified using a
14

MANOVA, but appropriate non-parametric post-hoc tests (independent sample Mann-
Whitney) are reported in the present study.
 The analysis of the sound sources was carried out using a method derived from
previous studies (i.e. Guastavino 2006; Dubois and Cance 2012). First, each verbal unit
corresponded to a semantically distinct source in the sound environment. They were then
classified into semantic classes inferred from the source and accompanying information
(including some local knowledge of the site, including the presence of a bar and a
prevalent Portuguese community). Coded sources maintained membership in parallel
categories by valence (Pleasant, Unpleasant and Neutral). Different semantic classes
emerged within each valence category; for example, sounds related to birds from the
NATURE category were always associated with a pleasant valence. Various sub-classes
surfaced from the analysis: Roadway traffic (motorized), Air traffic; Birds; Other
animals; Wind; Vegetation; Voice; Other human; and Music.
 This paper focuses on the primary classes that emerged from the sub-classes:
TRAFFIC, MUSIC, VOICE, and NATURE (see Table C). Following the categorization,
the responses of each participant were linked back to their data with a binary code by
valence (e.g. Neutral – VOICE – YES). It is rare to have two sources mentioned in the
same semantic class and valence, thus this data will also be used to evaluate the number
of sources mentioned per participant. To evaluate the impact of sound sources according
to the scales collected, several statistical tests were performed, including binary logistic
regression and Pearson’s correlation. As with the scale data, analyses with sound sources
are performed first collapsed across both groups, Q1 and Q3, then are presented
individually to show the specific effect of Musikiosk. Q2 participants did not elaborate
on sound sources.
15

 4. Results

The results section is organized according to the QUPE structure, i.e. 1. sound-related
evaluation: evaluation of soundscape scales (including SSQP and appropriateness) and
sound sources, 2. Psychological outcomes (mood and restorativeness). To this, we add
the findings related to QUPE and noise sensitivity. Within each section, we first describe
the baseline findings either in the Q1 condition or across all conditions, as appropriate,
and then focus specifically on the effects of the installation of Musikiosk as measured by
the questionnaire.
 Participants ranged from 18 to 70 years old (mean(error) = 32.97 (0.86)); they
were balanced across gender for all conditions except Q2 (26 Male – 12 Female).
 As a convention, results with a significance level of p < 0.05 are indicated with a
single star (*), p < 0.01 with two stars (**), and p < 0.001 with three stars (***).

 4.1 QUPE: sound-related evaluation

This section contains two major groups of analysis – those done in relation to the SSQP
and appropriateness scales followed by those in relation to the sound sources identified
by participants.

Table C: Emerging semantic class of sound sources associated with roadway traffic (English answers are reported in
italic).

Semantic Class Verbal Units
 voitures, camion, automobiles, klaxons, motos, circulation, bus, moteur, police,
TRAFFIC pompier, ambulances, autobus, camion à ordures, véhicule, pneu qui roule, cars,
 traffic, sirens, trucks, brakes (of cars), bus

 gens, conversations, discussions, gens qui parlent, voix, rires, portugais, adulte,
 bébé, jasent, jaser, les enfants qui jouent, paroles, personnes, bavardage, homme
 saoul, gens qui discutent, personnes qui discutent, autres individus, brouhaha,
VOICE personnes qui parlent, rires, chatter, chat, laughing, laughter, people, talking,
 children playing, conversations, friends, people talking, soft chatter, daughter,
 drunk homeless, portuguese, tourists, play

 oiseaux, pigeon, insectes, grillons, chiens, cigales, criquets, vent, vent dans les
 feuilles, brise, l’air, feuilles, arbres, bird, doves, chirp, crickets, metallic clinking
NATURE of dog leashes, dogs barking, wind, tree

 musique, guitare, karaoke, musique du bar, sound system, concert, music,
MUSIC singing, groups singing, reggae, dub, stereos, music from café
16

4.1.1 Soundscape evaluation

Figure 3: Mean ratings and standard error for the SSQP and appropriate, collapsed over all participants, by
conditions (N = 196)

The 88 users from before the installation of Musikiosk (Q1) rated the soundscape as
Pleasant (mean = 5.22; error = 0.16) and Appropriate (mean = 5.71; error = 0.17) well
above the mean rating; comparatively, Unpleasant (mean = 2.19; error = .16),
Monotonous (mean = 2.67; error =
 Table D: SSQP and appropriate for condition Q1
0.17) and Chaotic (mean = 2.47; error
= 0.18) were well below the mean
 Soundscape Q1 Standard
rating. See Table D for the full list of Scale Mean Error
means. This provides a baseline Pleasant 5.22 0.16
description of the pocket park without Unpleasant 2.19 0.16
the intervention, and suggests that,
 Eventful 4.17 0.16
despite the clearly urban setting, the
small space is evaluated as pleasant Vibrant 4.15 0.16
and eventful without being chaotic. Monotonous 2.67 0.17

 Calm 4.27 0.19
4.1.2 Effect of Musikiosk on
soundscape evaluations Chaotic 2.47 0.18

 Appropriate 5.71 0.17
Now this baseline will be compared
17

against data from the intervention. As explained in the Methods section, the comparison
data contains two types of respondents, including the users (Q2) and non-users (Q3) of
Musikiosk. We begin by comparing the means of both intervention phase conditions (Q2
and Q3) to the pre-installation baseline (Q1), see Figure 3.
 Musikiosk was determined to have an overall effect on soundscape evaluations
(MANOVA: F(2,370) = 20, p < .00001). There was also a significant difference in
soundscape scales between Q2 and Q3 (MANOVA: F(1,100) = 2.57, p = 0.013). Among
these scales, four were determined to have significant differences between conditions Q1
and Q2 , as revealed by post-hoc tests: Pleasant (Q2mean(se) = 6.20 (0.17); Q1mean(se)
= 5.22 (0.16), p
18

Figure 4: Comparison of mean ratings before and after the Musikiosk installation for the four scales significantly
affected by Musikiosk. Significances (* p < 0.05; ** p < 0.01) on the left are displayed compared to Q1; on the right,
they compare Q2 with Q3.

These are shown in increased detail in Figure 4. No significant effect was observed for
the remaining scales.
 In summary, Musikiosk showed modest effects on SSQP scales for Musikiosk
users (Q2), by raising pleasant, eventful, and vibrant, and lowering unpleasant compared
to the Q1 baseline. Q3 participants (non-users) also rated the soundscape as more pleasant
than the Q1 baseline. It is particularly noteworthy that ratings of calm and appropriate
were not affected by Musikiosk.

4.1.3 Sound sources

All participants except Musikiosk users (Q2) were asked to list the sound sources they
heard and identify whether they found each source pleasant, unpleasant, or neutral. 84 Q1
participants and 62 Q3 participants identified at least one sound source and were thus
considered to have completed the task. In total, across all participants, 514 sources were
identified and subsequently categorized. When counted, participants on average listed 1.6
19

positive sources, 0.9 neutral sources, and 0.9 negative sources. The rest of this section
focuses on sources in the park collapsing over both conditions, while the section that
follows centers specifically on the effects of Musikiosk by comparing Q1 and Q3. A
category of non-traffic mechanical sounds emerged, relating to construction and HVAC
sounds; however, these have been excluded due to a low count. Only traffic will be
discussed in the mechanical sounds category.

TRAFFIC

Over all conditions, a total of 130 Table E: Negative sources are related to both the presence
 of traffic noise but also to driver behaviors producing
respondents mentioned TRAFFIC (7 annoyance.

pleasant, 45 neutral, 90 unpleasant).
 Valence Most common examples
Sixteen participants did not mention Neutral cars,
TRAFFIC at all. TRAFFIC was not traffic

considered a negative sound source in all Unpleasant cars,
cases – it was neutral and even pleasant traffic,
 loud traffic,
in some cases (e.g. rolling tires1, cars). horns or honking,
While most of the mentions of neutral brakes or braking,
 car stereos
traffic were simply cars or traffic, when
TRAFFIC sounds were listed as unpleasant, more detail was usually given with reference
to individual driver behaviors through actions or specific vehicle components that
produced annoyance (e.g. honking, brakes) – see Table E: Negative sources are related to
both the presence of traffic noise but also to driver behaviors producing annoyance..
Except for brakes, no specific mention of acceleration or deceleration emerged. Nine
participants identified both a neutral and unpleasant source at the same time: e.g. traffic
(neutral) and engines (unpleasant)2; cars and buses (neutral) and car horns (unpleasant)3.
 Returning to the soundscape scales and their relationship to sound sources, those
who specifically identified an unpleasant TRAFFIC source rated the soundscape less
pleasant (Mean1(se) = 6.01(0.13), Mean2(se) = 5.02(0.14), W ≈ 3583; p ≈ 1.12e-5***)

1
 Pneus qui roulent
2
 Circulation and moteurs
3
 Voitures et autobus and les klaxons
20

and more chaotic (Mean1(se) = 1.83(0.15), Mean2(se) = 2.55(0.16)) W ≈ 1709, p ≈ 6.35e-
4 ***).

MUSIC

A total of 55 respondents mentioned MUSIC sources (48 pleasant, 5 neutral, and 4
negative). Most of the MUSIC mentions were directly related to Musikiosk (i.e. Q3
participants); exceptions included: traffic (horns, stereo) and one guitar.
 Mentioning a MUSIC source corresponded with a higher rating for pleasant.
Comparing those who listed a MUSIC source to those who did not, when the presence of
MUSIC was reported, ratings of pleasant increased (mean(SE)[MUSIC] ≈ 5.91(0.14),
mean(SE)[No MUSIC] = 5.13(0.16); W ≈ 2541, p ≈ 1.44e-3**) and ratings of the
unpleasant SSQP scale decreased (mean(SE)[MUSIC] ≈ 1.56(0.12),
mean(SE)[NoMUSIC] ≈ 2.36(0.16); W ≈ 3319, p ≈ 4.6e-4***). This finding corresponds
to the scale results for pleasant between conditions Q1 and Q3 from section 4.1.2 above.

VOICE

A total of 108 respondents mentioned VOICE sources (65 pleasant, 47 neutral, and 10
negative). The presence of VOICE had no independent effect on the scales. However, for
those who mentioned MUSIC, the additional presence of VOICE significantly reduced
ratings of monotonous (mean(SE)[MUSIC+VOICE] ≈ 2.14(0.19); mean(SE)[MUSIC-
VOICE] ≈ 3.53(0.55); W ≈ 408; p ≈ 0.016*).
 In summary, the listing of traffic sounds is generally related to reduced ratings of
pleasant and increasing ratings of chaotic; however, there were some exceptions by way
of a sizeable presence of traffic perceived as neutral and even positive. The listing of
music was associated with higher ratings of pleasantness, while the listing of voices,
through musical sources, was associated with lower ratings of monotonous.

4.1.4 Musikiosk effect on sound sources (listing and evaluation)

In addition to the inferred effects of Musikiosk in the MUSIC section above, Musikiosk
played a specific role in the sound sources that were mentioned and the valence they were
assigned, when comparing questionnaire conditions between Q1 and Q3. While the
presence of Musikiosk did not have a significant effect on the overall number of sound
sources mentioned (mean(SE)[Q1] ≈ 3.25(0.14), mean(SE)[Q3] = 2.95(0.15); W ≈ 2985;
21

Table F: Proportion of participants mentioning TRAFFIC mentions within each group according to their valance and
overall. Note, these values are not additions, they are independently the number of mentions within each category
and overall (i.e. some participants have TRAFFIC sources in multiple categories.)

 Participants
 Pleasant Neutral Unpleasant Overall
 identifying
 TRAFFIC
 Q1 7.1% 36% 65% 96%

 Q3 1.6% 24% 56% 79%

p ≈ 0.12), within each valence category, some differences were observed.
 The number of pleasant sources identified per participant rose slightly with
Musikiosk (1.54 to 1.61); however, this increase goes away entirely if the pleasant music
sources specifically referring to Musikiosk are removed. The number of neutral and
unpleasant sources, however, dropped from 0.89 to 0.70 per participant and from 0.81 to
0.62. In a related finding, the overall proportion of participants who reported any positive
source at all was 85% for Q1 and 97% for Q3; conversely the number of participants who
reported any negative source at all decreased from 73% to 60%.
 But most importantly, the presence of Musikiosk affected mentions of specific
sound sources, particularly traffic. Specifically, the number of mentions of traffic was
significantly reduced after the installation (Binary Logistic Regression; Q1: ref.; Q3:
B(SE) ≈ -1.96(0.66); z-score ≈ -2.96, p ≈ 3.09 e-3**), but the bulk of these reductions
appeared to be in the neutral category, see Table E.
 Mentions of sounds classified as NATURE showed little change (.70 to .65 per
participant for positive and .08 to .06 for neutral) and the changes from VOICE were
modest (.57 to .43 for positive) or inexistent (.39 to .39 for neutral).
 In summary, Musikiosk, while being an added sound source, did not necessarily
increase the number of sound sources reported and had a significant role in increasing the
likelihood that more pleasant sources were mentioned, while decreasing unpleasant
mentions and lowering the listing of traffic noise more generally.

 4.2 QUPE: psychological outcomes

The psychological outcomes include restorativeness and mood. Q2 participants were not
asked questions on restorativeness.
22

Table G: Restorativeness scales across conditions Q1 an Q3

 Scale Q1 mean Q1 error Q3 mean Q3 error
 Break 4.88 0.19 5.26 0.21
 Fascination 3.66 0.19 4.14 0.23
 Compatibility 4.98 0.18 5.13 0.19

4.2.1 Restorativeness

Restorativeness was measured using three scales corresponding to Break, Fascination,
and Compatibility. Mentioning TRAFFIC sources significantly decreased Fascination
(mean(SE)[TRAFFIC] ≈ 3.70(0.16), mean(SE)[NoTRAFFIC] ≈ 4.98(0.40); W ≈ 1422,
p ≈ 0.015*).
 In terms of the effects of Musikiosk, a general MANOVA showed no effect of
Musikiosk on the three restorativeness scales (F(1,154) = 1.16, p = 0.32), see Table G for
full means. While the existing means for Break and Compatibility may be sufficiently
high to support a general claim for restoration, the lack of individual effects of Musikiosk
is consistent with the other scale differences, with the only exception being pleasant (see
4.1.2).

4.2.2 Mood

Mood was measured by asking participants to rate their mood before coming to the park
and their mood now, in order to calculate a mood benefit (MoodBenefit = MoodNow –
MoodBefore). In general, visits to the park provided a MoodBenefit of +0.62 (W≈ 13900,
p ≈ 1.22e-06***), increasing the MoodBefore mean of 5.40 (0.09) to a MoodNow of 6.02
(0.09).
 A generalized linear model estimating the Mood Benefit through the SSQP and
appropriate scales shows that Mood Benefit is significantly associated with appropriate.
Furthermore, a second model including all the soundscape scales (with restorative scales)
shows that MoodBenefit is also significantly related to fascinating (see Table H).
 MoodNow is also negatively correlated with Sensitivity (corr ≈ -0.21, t ≈ -2.99, p
≈ 0.00015***), such that those with higher sensitivity leave the park with a lower mood.
However, it is worth noting that the size of their MoodBenefit is not reduced.
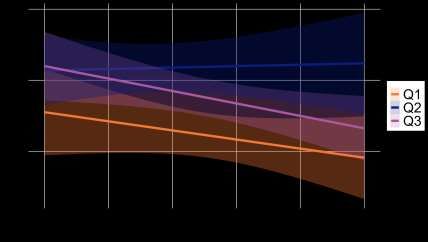
23

Table H: Generalized Linear Model (Family: QuasiPoisson) - Estimation of Mood Benefit through SSQP (Model 1) and
SSQP + Restorative Scales (Model 2)

Scale Model 1 (SSQP) Model 2 (SSQP + Restorative Scales)
 β(SE) t p β(SE) t p
pleasant 2.18e-2 (.03) 0.81 0.41 -1.97e-3 (.01) -0.19 0.84
unpleasant -3.14e-2 (.02) -1.24 0.22 -6.92e-4 (.008) -0.08 0.93
eventful 1.40e-2 (.02) 0.72 0.47 -1.68e-3 (.007) -0.24 0.81
vibrant 1.1e-2 (.02) 0.58 0.56 -6.61e-3 (.007) -0.92 0.35
monotonous 2.91e-2 (.01) 1.95 0.053 7.82e-3 (.005) 1.38 0.17
calm -1.1e-2 (.01) -0.72 0.47 -6.04e-4 (.005) -1.02 0.31
chaotic 4.38e-3 (.02) 0.26 0.79 4.98e-4 (.006) 0.08 0.93
appropriate 3.53e-5 (.02) 2.1 0.037* 1.87e-2 (.007) 2.5 0.014*
fascination 1.67e-2 (.005) 2.95 0.0037**
compatibility 6.68e-3 (.007) 0.92 0.36
break 2.57e-3 (.006) 0.39 0.69

4.2.3 Musikiosk effects of mood

Musikiosk has a clearly positive effect on MoodBenefit. Interestingly, MoodBefore was
shown to have the same mean for all three groups, Q1, Q2, and Q3 (p12 = 0.87; p23 =
1.00; p13 = 0.87). Q1 participants had a modest but significant MoodBenefit from their
park visit (Mean(error) = +0.39(0.11)). Q3 (non-users) showed a sizable MoodBenefit

 Figure 5: Comparison of mood benefits across Musikiosk conditions. Significance
 from no mood benefit is marked above the data point, compared to Q1 on the
 left side of the data point, and between Q2 and Q3 on the right side.
24

(Mean(error) = +0.65(0.14)); however this MoodBenefit was not significantly higher than
for Q1 (p = 0.17). For Musikiosk users (Q2), the MoodBenefit was the highest
(Mean(error) = +1.15(0.18)), significantly higher than Q1 (p < 0.001) and Q3 (p < 0.01)
– see Figure 5.
 In summary, Musikiosk generally had a positive effect on mood. As with some of
the SSQP scales (pleasant, eventful, vibrant), Q2 users saw the largest benefits, with Q3
means always between Q1 and Q2, yet often not significantly so.

 4.3 Individual factor: noise sensitivity and QUPE

This section examines the effects of the individual factor of noise sensitivity on the
soundscape and mood scales and sources reported, as well as the relationship with
Musikiosk.

4.3.1 Noise sensitivity in general

Noise Sensitivity was originally measured using a standard five-item scale (Weinstein’s
Noise Sensitivity Scale). The full index yielded very similar results to the single question
of “I am sensitive to noise”; for example, age and the full sensitivity index were found to
be highly correlated (corr. ≈ 0.38, t ≈ 5.61, p ≈ 3.65e-8***), as well as age and the single-
scale Sensitive (corr. ≈ 0.30, t ≈ 4.35, p ≈ 1.12e-5***). We have thus chosen to report the
findings for the single question response (called now: Noise Sensitivity).
 First, those who report higher Noise Sensitivity mention an overall higher number
of sound sources (corr. ≈ 0.27, t ≈ 3.47, p ≈ 5.21e-4**). Interestingly, the number of sound

 Figure 6: The number of sources identified increases with noise
 sensitivity
25

sources identified per participant is not correlated with age, nor was any soundscape scale.
Examining the ratio of unpleasant to pleasant and neutral sound sources (we call this ratio
negativity4), a simple correlation shows negativity to increase with Noise Sensitivity
(corr. ≈ 0.21, t ≈ 2.59, p ≈ 5.27 e-3 **). Lastly, those who report being more sensitive
mention TRAFFIC more often (B(SE) ≈ 0.44(0.18); z-score ≈ 2.39, p ≈ 1.68e-2*),
especially as an unpleasant source (B(SE) ≈ 0.39(0.11); z-score ≈ 3.42, p ≈ 6.17 e-4***).

4.3.2 Musikiosk effects on noise sensitivity

Before proceeding with describing the effects of Musikiosk, it is appropriate to check
whether noise sensitivity remains constant between the conditions. An analysis reveals
no difference between mean Noise Sensitivity for groups Q1 (mean = 3.57; error = 0.17)
and Q3 (mean = 3.61; error = 0.21); however, for Q2 (mean = 2.80; error = 0.28), it was
lower, (W ≈ 3937; p ≈ 0.0059**), see histogram, Figure 7. Note also that Q2 (Musikiosk
users) had fewer participants that identified as a woman; a test verified that gender and
Sensitivity were confounders (mean(Female) = 3.76, error = 0.18; mean(Male) = 3.14,
error = 0.16, W = 5311.5, p = 0.012*). No other findings related to gender were revealed.
Based on this analysis, we find it appropriate to compare Q1 and Q3 conditions, Q2 will
only be provided for reference.
 As previously indicated, the presence of Musikiosk reduced overall mentions of
traffic; however, these reductions were not evenly spread across those with different

 Figure 7: Histogram of Noise Sensitivity by condition. Legend:
 mean(SE) by condition

4
 =
 +
26

 Figure 8: Those who are more noise sensitive persisted in identifying
 TRAFFIC noise when Musikiosk was installed. Those with low
 sensitivity experienced a sharp decline.

Noise Sensitivity. For those who were the least sensitive, traffic mentions declined the
most sharply, while those with higher sensitivity persisted in identifying TRAFFIC at
almost the same rate (Binary Multiple Logistic Regression: Q1: Ref; Q3: B(SE) ≈ -
2.04(0.44), z ≈ -3.01, p ≈ 2.62e-3**; Sensitivity: B(SE) ≈ 0.44(0.18), z ≈ 2.41, p ≈ 1.57e-
2*) (see Figure 8).
 Those with higher Noise Sensitivity also rated pleasant lower (corr. ≈ -17, t ≈ -
2.45, p ≈ 1.5 e-2*). However, across conditions, we saw 1) that Musikiosk increased
pleasant for all users, regardless of Noise Sensitivity (mean(SE)[Q1] ≈ 5.22(0.16);
mean(SE)[Q2] ≈ 6.19(0.17); mean(SE)[Q3] ≈ 5.71(0.14); F ≈ 8.25, p ≈ 3.65e-4***) see
Figure 9, and 2) for Musikiosk users, Noise Sensitivity played no role in their evaluation

 Figure 9: Relation between Sensitive and Pleasant, according to the condition. Q2 is
 shown for reference.
27

of pleasant. Note, however, those with higher sensitivities weren’t equally represented in
the Q2 sample. See Figure 9.
 In summary, while those with higher Noise Sensitivity did not show a change in
overall soundscape ratings, except pleasant, their identification of sound sources and
valences was markedly different. While those with higher Noise Sensitivity experienced
similar benefits as measured through scales from Musikiosk as other participants,
Musikiosk did not reduce the impact specifically of traffic sounds on their evaluation.

 5. Discussion

The discussion follows the three outlined research questions and addresses them in the
context of the discussed literature, through: 1) evaluations of a pocket park using part of
the QUPE framework; 2) a subsequent evaluation of a musical intervention (Musikiosk),
also using QUPE; and 3) a deeper analysis on the influence of individual factors, namely
noise sensitivity.

 5.1 Research Question 1 – Pocket park soundscape

Based on the ratings provided through the scales, some generalizations can be made about
the quality of urban public space experience in the park. The soundscape was described
as pleasant and appropriate for the activities that participants were conducting while there.
These activities were characterized as being of a largely social nature (e.g. eating and
meeting with friends), as reported previously (Steele, Bild, et al. 2019). Visits to the park
significantly benefitted participants’ moods, especially for those who also rated the
soundscape as more appropriate and more fascinating. While the visit to the pocket park
showed mood benefits, as was the case in other park visit studies (Hull and Michael 1995;
Jansson and Persson 2010; Nilsson, Sangster, and Konijnendijk 2011), ratings of
soundscape restorativeness were modest. This is at least partially contrasting with Nordh
and Ostby (2013) who showed that participants rated visual representations of pocket
parks as generally restorative (these participants were rating the overall restorativeness
rather than soundscape). The results suggest that this particular pocket park, analyzed in
situ, in its urban, multimodal context, only conveys some of the traditional park visit
benefits when it comes to the auditory dimension of the experience (i.e. mood benefits,
but not necessarily restorativeness).
28

 The park can also be understood in terms of the sound sources explicitly listed by
participants. Traffic, a sound source with major presence (i.e. 96% of users in the Q1
condition identified a traffic source of some type), was most often considered unpleasant;
however, contrary to expectations, more than a third of traffic mentions were listed as
neutral, and even pleasant. Previous work on the sounds of traffic found that cars were
perceived as negative sound sources (e.g. Guastavino 2006). However, the same study
suggests participants wanted a variety of soundscapes to support diverse activities. It
could mean that the present study reports on a real-world setting supporting traffic noise
as a source of ‘background noise’ in this pocket park situated right on a busy traffic artery,
reminding them of the immediate urban context, neither wholly welcome nor unwelcome,
but familiar. This idea is echoed in a study that showed that annoyance produced by sound
sources during park visits were based on whether those sounds were expected for the
context (Brambilla and Maffei 2006). Along these lines, actions that produce more
intermittent, disturbing sounds than steady-state traffic (e.g. honking, brakes, and stereos)
may remind users that they are not quite in a park – similarly, Morel et al. (2012) had
found steady-state and changing traffic sounds to be in two distinct source categories with
different valence attributed to them. Supporting the idea that TRAFFIC was detrimental
to the evaluation, those who had identified unpleasant traffic sources rated the soundscape
as less pleasant and more chaotic. Traffic noise may also have a dulling effect on other
sources, as those who mentioned it rated the soundscape as less fascinating.

 5.2 Research Question 2 – Musikiosk effects

Musikiosk improved ratings of pleasant, eventful, and vibrant for Q2 (Musikiosk users),
and pleasant for Q3 participants, compared to the Q1 baseline. Musikiosk additionally
augmented the mood benefits of the park visit, again, particularly for Q2. This is in line
with Steffens et al. (2017), who showed a co-variance of mood benefits with higher
ratings for pleasant and eventful across many types of spaces; these ratings were further
augmented by the presence of music. Interestingly, ratings of calm and appropriate (for
activity) remained unchanged by the presence of Musikiosk. Together, these findings
suggest that the presence of Musikiosk changed the soundscape without disturbing the
park’s existing amenities or ambiance. These results are consistent with findings obtained
from interviews and observations reported in Steele et al. (2019).
29

 The data from the sound sources reported by participants tell a similar story. Even
those who did not use Musikiosk (Q3) were not observably disturbed by its presence. Q3
participants were more likely than Q1 to list a pleasant sound source and less likely to list
an unpleasant one. Literature suggests that sounds evaluated as pleasant contribute to a
sense of comfort (Yang and Kang 2005), which may have explain the higher ratings of
pleasant in the presence of Musikiosk. This is also in line with a recent study by Yamasaki
et al. (2015) that indicates that, when exposed to music, people give higher positive
judgments of their environment, both in terms of sonic and visual aspects. These effects
may be amplified especially for Q2 (Musikiosk users), who were playing music they had
chosen themselves.
 Additionally, the presence of voices listed as a source also reduced ratings of
monotonous when music was also reported as present. This finding resonates with
research showing how music played over technical devices (e.g. “loud-speakers”) was
rated negatively while music reflecting human activity (e.g. “musician’) was rated
positively (Guastavino, 2006). The inclusion of voices reflecting activity supported by
music may have bridged the gap between the technical device and the perception of
live(ly) human activities to bring it into the realm of positive judgments. The presence of
voices may also remind users of the presence of social relationships, which Filipan et al.
(2017) identified as a key element of urban park soundscapes, and which Aletta and Kang
(2018) demonstrated to be a determinant of vibrancy, a rating that Musikiosk increased.

 5.3 Research Question 3 – Noise Sensitivity

Noise sensitivity had a clear effect on participants’ evaluations. As is common across
many studies (e.g. Kishikawa et al. 2006; Steffens, Steele, and Guastavino 2017), we
observed that sensitivity increased with age. However, despite this strong relationship,
age had no influence on any other variable in the study.
 Some of the benefits of the presence of Musikiosk seemed to be reserved for the
least sensitive among Q3, such as the reduction in traffic mentions. Along these lines,
others have shown how introducing “natural” sounds can reduce traffic-related
annoyance in a public space context (e.g. De Coensel, Vanwetswinkel, and Botteldooren
2011; Van Renterghem et al. 2020), but those benefits may not be equal for users of all
sensitivities. Despite the unequal changes in traffic noise mentions, all users did
experience a pleasant and mood benefit boost from Musikiosk that was roughly equal.
You can also read