Frankston City Council Urban Forest Action Plan 2020-2040

Page created by Gary Scott
 
CONTINUE READING
Frankston City Council Urban Forest Action Plan 2020-2040
Frankston City Council
Urban Forest Action Plan
2020–2040
Frankston City Council Urban Forest Action Plan 2020-2040
Contents
   Acknowledgement of Country                                                5
1. Executive Summary                                                         7
   1.1 Scope                                                                 8
   1.2 Funding of the plan                                                   8
   1.3 Delivery, monitoring and evaluation                                   8
2. Introduction                                                              9
   2.1 Benefits of the urban forest                                          11
   2.2 Current state of Frankston City’s urban forest                       12
   2.3 Threats to our urban forest                                          24
   2.4 Priority areas for greening (opportunities)                          28
   2.5 Council policy domains, planned outcomes context and program logic   38
3. Urban Forest Action Plan 2020–2040                                       41
   3.1 Delivery, monitoring and evaluation                                  48
4. References                                                               49
Frankston City Council Urban Forest Action Plan 2020-2040
Acknowledgement of Country
      Frankston City Council acknowledges the Traditional Custodians of the lands and waters in and around
      Frankston City, and value and recognise local Aboriginal and Torres Strait Islander cultures, heritage
      and connection to land as a proud part of a shared identity for Frankston City.
      Council pays respect to elders past and present and recognises their importance in maintaining
      knowledge, traditions and culture in our community.

Urban Forest Action Plan                                                                                       5
Frankston City Council Urban Forest Action Plan 2020-2040
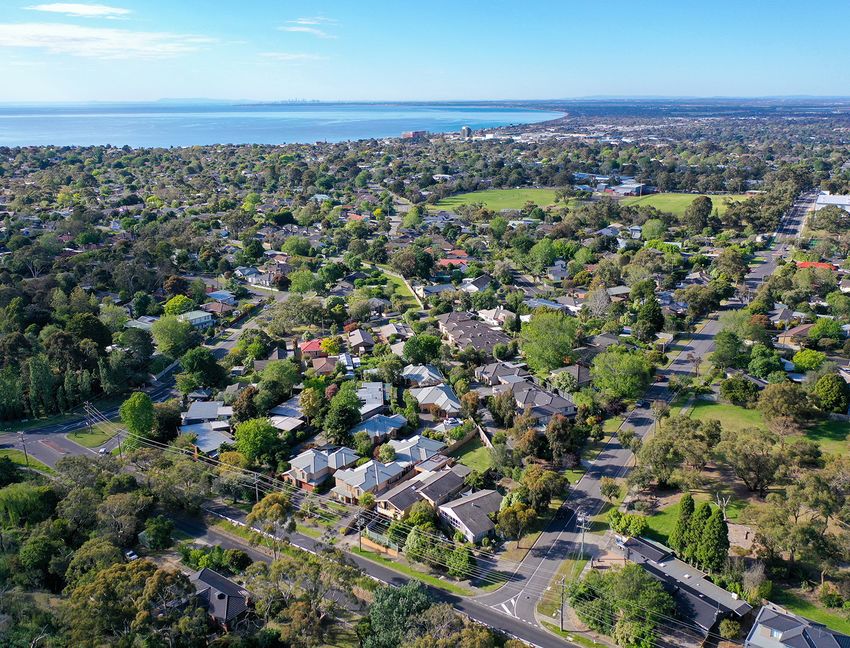
Executive Summary

6   Frankston City Council   Urban Forest Action Plan   7
Frankston City Council Urban Forest Action Plan 2020-2040
Frankston City’s urban forest, the sum of all urban trees across the municipality, is a critically valuable
    community asset for providing shade, intercepting stormwater, providing habitat and food for wildlife,
    storing carbon and enhancing the character of streets and parks.
                                                                                                                                                         Introduction
    Council manages around 62,000 trees in streets with                These issues, however, pave the way for a series of
    many more trees located in parks and on private property.          opportunities for Council to:
    Collectively, these trees create a tree canopy cover over the         • Plant trees where they are needed eg. in areas of
    municipality of 17 per cent. Langwarrin and Frankston South               social vulnerability to heat, where tree canopy is low,
    have higher tree canopy cover than other suburbs such as                  where pedestrian exposure to heat is high such as
    Seaford, Carrum Downs and Skye. There are an estimated                    along footpaths, public transport stops and shared
    16,000 vacant street tree sites, providing significant                    use paths.
    opportunity to increase tree cover across the Municipality.
                                                                          • Incorporate a diversity of vegetation such as green
    Frankston City’s urban forest faces a number of challenges,               walls, green roofs, trees, rain gardens and tree pits
    including:                                                                within the Frankston Metropolitan Activity Centre
                                                                              where growing space is limited.
        • Continual loss of tree canopy, estimated at 1% loss
           every four years. This is the equivalent of losing             • Plant indigenous species along streets that connect
           1.4 square kilometres of tree canopy cover every                   and buffer areas of biodiversity value.
           four years.                                                    • Plant broad canopied trees within areas of localised
        • Climate change creating harsher conditions for                      flooding issues to stem stormwater flows.
           trees to survive and thrive in.
                                                                       This Action Plan has been developed to guide Council
        • Funding and resources that do not yet allow for              towards its vision to become the Lifestyle Capital of Victoria.
           a best practice tree management program.
        • Development and capital works which result in trees
           removed and not replaced on a continual basis.

    1.1 Scope
    The management of trees, forests and natural ecosystems in and around communities to maximise the psychological,
    sociological, economic and aesthetic benefits that trees provide for society (Helm, 1998).

    The ‘Urban Forest Action Plan’ is a 20 year plan. It applies to Frankston’s urban forest: the sum of all trees across the
    municipality (130 sq km) irrespective of the tree species, location, origin or ownership.

    The protection and enhancement of green space in Frankston City will be addressed through the Action Plan detailed
    in Section 3 of this document.

    1.2 Funding of the plan
    The plan is prioritised into short (0–4 years), medium (4–8 years), long term (beyond 8 years) and ongoing priorities.

    Budget estimates will be prepared for each of the priority periods and an annual submission for funding will be submitted
    to Council. This may be operational or capital funds as appropriate to the actions.

    1.3 Delivery, monitoring and evaluation
    A review of the Action plan will occur every four years and include an evaluation on the progress and the indicators outlined
    in the program logic – refer to section 2.5.

8                                                                                                                         Frankston City Council   Urban Forest Action Plan   9
Frankston City Council Urban Forest Action Plan 2020-2040
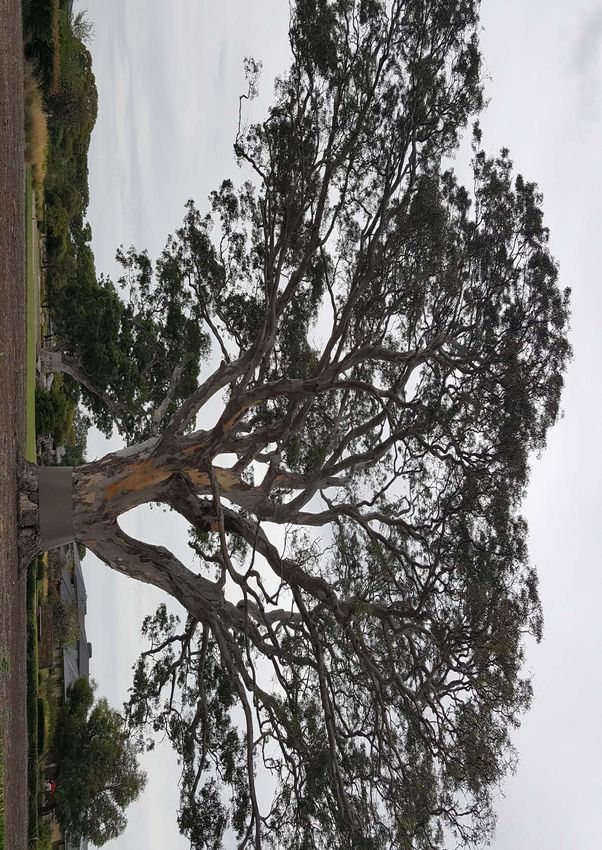
The Urban Forest Action Plan is the strategic plan for how Frankston City Council will work over the                                          2.1 Benefits of the urban forest
     next two decades to transform the urban forest into a highly valued, well-resourced, thriving asset
     that realises its great potential to contribute to the city.
                                                                                                                                                         Urban forests provide environmental, economic, social and health benefits to the community
     Despite the recognition of the importance of trees within      This urban forest supports a wealth of health and wellbeing,                         as summarised below.
     our urban landscapes, they remain an undervalued and           environmental and economic benefits for the region.
     under resourced asset. As a result, Frankston City’s urban     The trees shade and cool our city during hot weather
     forest faces a series of challenges that without considered    and provide green space to benefit the health and
     planning and management puts these benefits at risk.           wellbeing of our community. The urban forest cleans                            2.1.1 Environmental benefits                                   2.1.2 Economic benefits
     This compromises not only the liveability of the City but      our air, intercepts rainfall and slows down stormwater
                                                                                                                                                       • Cools and shades our cities                                • Reducing energy use and costs
     its resilience towards the shocks and stresses of climate      entering the bay. It also stores carbon and is an important
                                                                                                                                                         Strategic placement of trees in urban areas                  Trees properly placed around buildings can reduce
     change, population growth and urban development.               support network for urban biodiversity.
                                                                                                                                                         can cool the ambient air temperature between                 air conditioning needs by 30 per cent and save
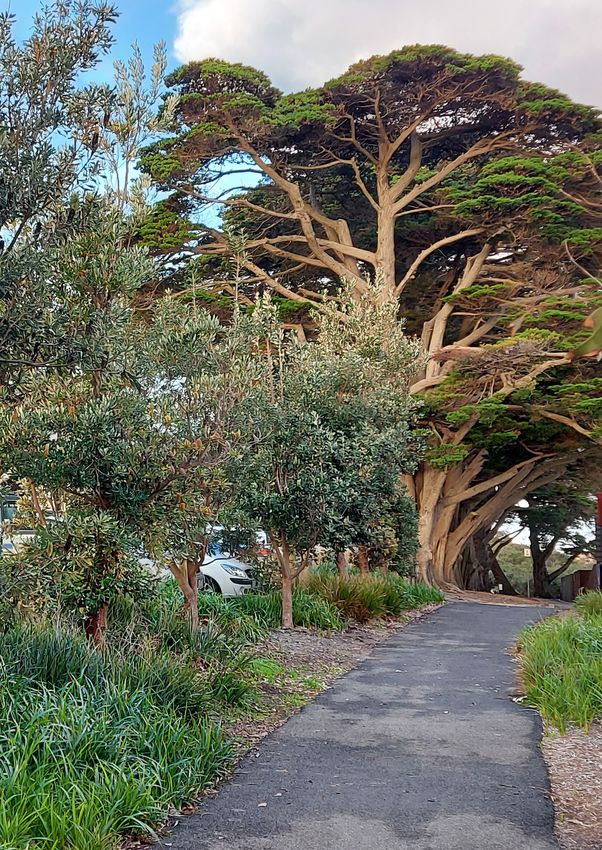
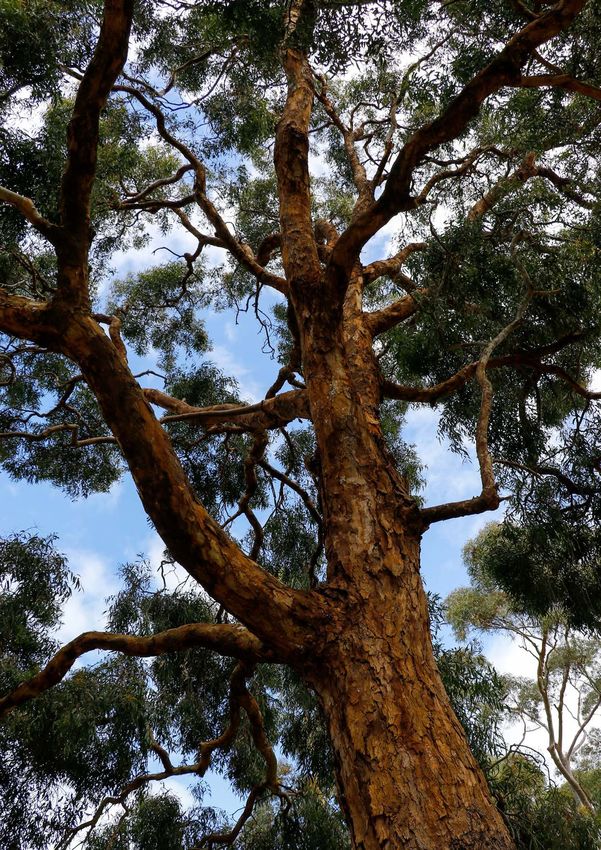
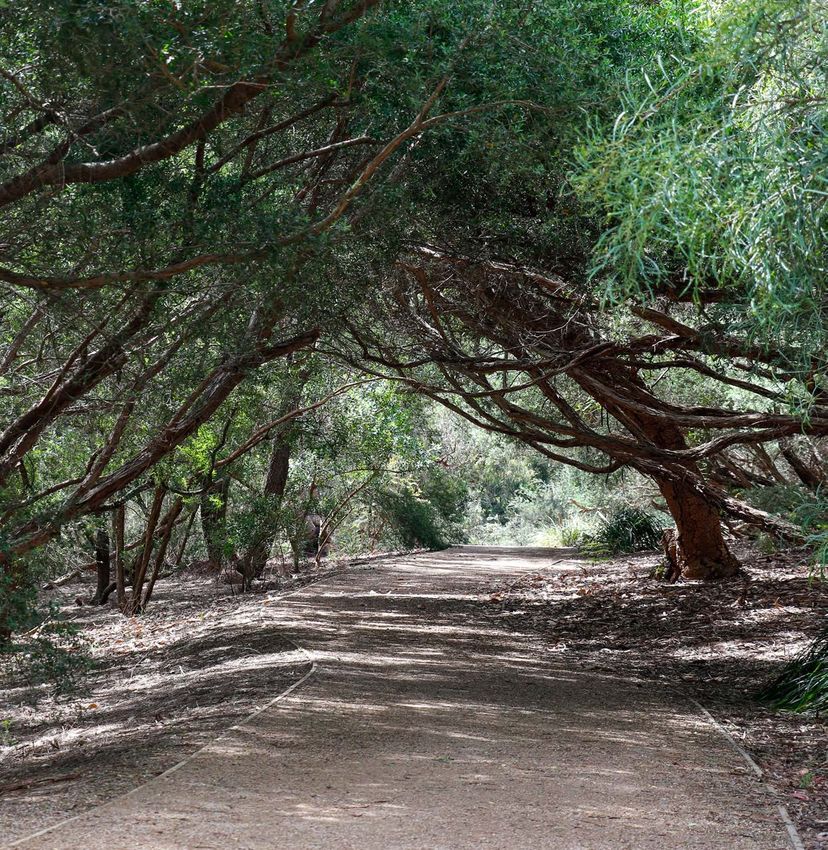
     Frankston City Council is home to a wide variety of urban      Healthy and resilient urban forests are one of the                                   2°C and 8°C.                                                 energy used for heating by 20–50 per cent
     trees that contribute to the urban coastal landscape           most efficient and cost-effective mechanisms for local                             • Reduces stormwater runoff                                    (USDA Forest Service).
     character of the area. From the Tea Tree and Banksia’s along   government authorities to use in adapting their cities                               Mature trees can stem the flow of stormwater               • Increasing property values
     the coast, to the Norfolk Island Pines, Yellow Gums and        to climate change, mitigating urban heat and improving                               and improve water quality.                                   The presence of trees in streets and nearby parks
     Bottlebrushes planted in streets, to the significant remnant   the health and wellbeing of their communities and                                  • Improves air quality                                         can increase residential property values.
     River Red Gums and Manna Gums in natural reserves;             liveability of urban areas.                                                          Large urban trees are excellent filters for air            • Improving city branding and economic
     together these trees form the city’s urban forest.                                                                                                  pollutants and fine particulates.                            productivity
                                                                                                                                                       • Supports urban biodiversity                                  Green spaces play a role in creating a desirable
                                                                                                                                                         Not only does the Urban forest have benefits                 character and city image, encouraging people
                                                                                                                                                         in providing a richness of indigenous flora, it has          to live, work and visit which, in turn, can increase
                                                                                                                                                         been shown to support a wide range of species                a city’s economic productivity.
                                                                                                                                                         by providing food and shelter even to endangered           • Storing and sequestering carbon
                                                                                                                                                         fauna and other species of high conservation value           Trees can sequester and store up to 150kg
                                                                                                                                                         (Kendal et al, 2016). It also supports a diversity           of CO2 per year. This is the equivalent of the
                                                                                                                                                         of plants.                                                   average monthly carbon emission from one
                                                                                                                                                       • Mitigates climate change                                     Australian car (www.greenvehicleguide.gov.au).
                                                                                                                                                         Storing carbon to reduce emissions.                          (FAO, 2016) (Plant, 2016). Storing carbon, reduces
                                                                                                                                                                                                                      emissions that mitigate climate change providing
                                                                                                                                                                                                                      an environmental benefit as well.

                                                                                                                                                   2.1.3 Social benefits                                          2.1.4 Health benefits
                                                                                                                                                       • Define local identity                                      • Physical health benefits
                                                                                                                                                         Trees can help define a city’s character and identity.       Trees can reduce our sun exposure thereby
                                                                                                                                                         Trees provide seasonal interest, food supply                 decreasing our risk of skin cancer. Urban green
                                                                                                                                                         and natural beauty through their interesting                 space also encourages increased levels of exercise
                                                                                                                                                         colours, shapes, textures of bark, foliage,                  and can help decrease blood pressure and stress.
                                                                                                                                                         canopy, flowers and fruit.                                 • Mental health benefits
                                                                                                                                                       • Improving social cohesion                                    Spending time in or near green space has been
                                                                                                                                                         Access to green space improves various measures              proven to improve concentration, memory, mood,
                                                                                                                                                         of social cohesion including community connection            self-esteem and relieve stress. There is also
                                                                                                                                                         by providing places for events, festivals and                evidence to suggest that green space could
                                                                                                                                                         celebrations that can bring diverse groups                   be used for people suffering serious illnesses
                                                                                                                                                         of people together.                                          such as depression, cancer and ADHD in children.
                                                                                                                                                       • Reduced crime rates                                          (Godfrey Faucett, 2016) (Giles Corti, 2005).
                                                                                                                                                         Increased urban vegetation has been linked
                                                                                                                                                         to reduced levels of crime (Kendal et al, 2016)
                                                                                                                                                         (FAO, 2016).

10                                                                                                                  Frankston City Council   Urban Forest Action Plan                                                                                                        11
Frankston City Council Urban Forest Action Plan 2020-2040
2.2 Current state of Frankston City’s urban forest
     2.2.1 Tree canopy cover
     Tree canopy cover is the area of tree canopy that covers a specific area of land eg. over a municipality, suburb, street
     or block. This important measure of the urban forest quantifies many of its benefits eg. amount of shade provision, stormwater
     interception, carbon stored and sequestered. The Local Government Area of Frankston has an overall average of 17 per cent
     tree canopy cover. For an urban area, this is considered relatively low compared to other urban LGA’s across Melbourne.
     The canopy cover is however not uniform across the greater Frankston City area as illustrated in the map below.

     Tree canopy cover
     (trees over 3m)
         0 – 10%
         11 – 20%
         21 – 35%
         36 – 50%
         51 – 60%
         61 – 100%

                                                                                                                                                     Tree canopy cover also varies across suburbs and land use zones as shown in the below table. Carrum Downs and Skye have
                                                                                                                                                     the lowest tree canopy cover of any other suburbs in Frankston City at 6.9 per cent and 8 per cent respectively. Carrum Downs
                                                                                                                                                     houses a large industrial estate, which offers very little tree canopy cover while a large portion of Skye is designated Green
                                                                                                                                                     Wedge Zone, which surprisingly has minimal tree cover. Seaford and Sandhurst, the next lowest suburbs for tree canopy cover
                                                                                                                                                     also have the same land use zones, industrial and green wedge, which contributes to their low tree canopy cover.

                                                                                                                                                     Langwarrin and Langwarrin South make the biggest contributions to canopy cover, with 25.5 per cent and 27.8 per cent tree
                                                                                                                                                     canopy cover respectively.

                                                                                                                                                     Tree canopy cover by suburb
                                                                                                                                                     30%

                                                                                                                                                      25%

                                                                                                                                                     20%

                                                                                                                                                      15%

                                                                                                                                                      10%

                                                                                                                                                       5%

                                                                                                                                                                6.9%         8.0%         10.0%        11.9%         16.7%        18.7%        24.8%        25.5%         27.8%
                                                                                                                                                      0%
                                                                                                                                                                Carrum        Skye       Sandhurst      Seaford     Frankston    Frankston     Frankston   Langwarrin    Langwarrin
                                                                                                                                                                Downs                                                              North         South                     South

     Map 1: Tree canopy cover per mesh block for the LGA of Frankston. Source: Vegetation_Cover_2018, Spatial Datamart,                                     Figure 1: Per cent Tree Canopy Cover (all trees over 3m in height) for each suburb. Source: Vegetation_Cover_2018,
     DELWP, 2019                                                                                                                                            Spatial Datamart, DELWP, 2019

12                                                                                                                    Frankston City Council   Urban Forest Action Plan                                                                                                               13
Frankston City Council Urban Forest Action Plan 2020-2040
2.2.2 Tree canopy cover change
                                                                                                                                                      Vegetation mapping was collected for two consecutive time periods of 2014 and 2018 by the Victorian State Government.
                                                                                                                                                      From this mapping, change in tree canopy cover during this time period can be measured. Overall, Frankston City lost
                                                                                                                                                      1 per cent of tree canopy cover from 2014 to 2018. Whilst 1 per cent may seem small, it equates to 1.4 square kilometres
                                                                                                                                                      or 1.5 times the size of the Frankston Metropolitan Activity Centre (FMAC) area. Much of the change interestingly occurs
                                                                                                                                                      in the suburbs that are greener such as Frankston South and Langwarrin. The red square visible in Carrum Downs is a result
                                                                                                                                                      of a fire within the Pines Flora and Fauna Reserve which threatened residential homes in January 2018. The fire travelled
                                                                                                                                                      about 1.5 kilometres and blackened 36 hectares of bush.

                                                                                                                                                      Change in vegetation cover
                                                                                                                                                      2014–2018
                                                                                                                                                           -23 – -15%
                                                                                                                                                           -15 – -10%
                                                                                                                                                           -10 – -5%
                                                                                                                                                           -5 – -2%
                                                                                                                                                           -2 – +2%
                                                                                                                                                           +2 – +5%
                                                                                                                                                           +5 – +7.3%

     At a land ownership and land use level, there is variation in canopy cover as well. The Commercial Zone and Central Activity
     Areas have extremely low tree canopy cover at just 7.4 per cent and 6.6 per cent respectively.

     Municipal level                                                  Land use planning zone
      Frankston LGA                         16.1 per cent              General Residential Zone              16.7 per cent
      Public Land                           18.6 per cent              Commercial Zone                       7.4 per cent
      Private Land                          15.5 per cent              Central Activity Zone                 6.6 per cent
                                                                       Parks/Open Space                      23.3 per cent
                                                                       Public Road Reserves                  14.1 per cent

     Table 1: Per cent Tree Canopy Cover (all trees over 3m in height) for regional, suburb and land use planning boundaries.
     Source: Vegetation_Cover_2018, Spatial Datamart, DELWP, 2019

     On a regional metropolitan Melbourne scale, tree canopy cover between 20-30 per cent is not considered to be high (Living
     Melbourne, 2019). Many Local Government Authorities (LGA’s) strive to achieve between 30-40 per cent tree canopy in order
     to meet liveability, shade, amenity and environmental aspirations as per recommendations from Living Melbourne, 2019.
     There is therefore opportunity to increase overall canopy cover in Frankston City.

     The majority of Council owned and managed trees line streets/roads, which have 14.1 per cent canopy cover, and within parks
     which provide 23.3 per cent canopy cover. These areas owned and managed by Council are where Council can make the
     biggest improvements in tree canopy cover.
                                                                                                                                                           Map 2: Tree canopy cover change per mesh block for the LGA of Frankston. Source: Vegetation_Cover_2014_18_CHG,
                                                                                                                                                           Spatial Datamart, DELWP, 2019

14                                                                                                                     Frankston City Council   Urban Forest Action Plan                                                                                                           15
Frankston City Council Urban Forest Action Plan 2020-2040
2.2.3 Thermal heat mapping                                                                                                                      2.2.4 Frankston City’s public trees
     Satellite thermal imagery taken on 1st January 2018 shows areas across the municipality that absorb more urban heat                             Council manages approximately 62,000 trees across its urban streets and an unknown number of trees in parks.
     than others (coloured red). The Land Surface Temperatures (LST) in these red areas are up to 12 degrees celsius hotter                          Mapped street trees are located across the municipality as shown below. The data collected on these trees provide
     than non-urban areas which correlates with the tree canopy data. Many of the hotspots occur in residential areas that                           information on the diversity of the tree population, thereby helping us to understand the overall health and resilience
     are characterised by few trees and dark roofs as seen in the aerial image of Carrum Downs.                                                      of the public urban forest.

     Frankston thermal hotspots                                                                                                                      Frankston City’s public trees
     Average LST difference from non-urban baseline
                                                                                                                                                          Existing council trees
         -0.8 – 1.74°C                                                                                                                                    Reserve
         1.74 – 4.33°C
         4.33 – 6.92°C
         6.92 – 9.50°C
         9.50 – 12.09°C

     Map 3: Satellite thermal imagery detailing Average Land Surface Temperatures above or below non-urban baseline
     land surface temperatures. Areas in red are the hottest (up to 12 degrees hotter than non-urban areas).
     Source: DELWP, Heat_Urban_Heat_2018, Spatial Datamart, 2019.                                                                                          Map 4: Map of existing trees across Frankston City Council. Source: Frankston City Council GIS, 2019.

16                                                                                                                    Frankston City Council   Urban Forest Action Plan                                                                                                        17
Frankston City Council Urban Forest Action Plan 2020-2040
2.2.5 Species diversity
     Frankston City’s street tree population contains over 530 different tree species. However, over half of the city’s total street
     tree population is made up of only 13 species. The 10 most common species are shown below:

      Species                          Common Name                      Number                           Per cent of population
      Eucalyptus leucoxylon            Yellow Gum                       5969                             9.6 per cent
      Eucalyptus scoparia              Wallangarra White Gum            3716                             5.9 per cent
      Callistemon salignus             White Bottlebrush                3002                             4.8 per cent
      Callistemon viminalis            Weeping Bottlebrush              2997                             4.8 per cent
      Melaleuca linariifolia           Snow in Summer                   2730                             4.4 per cent
      Corymbia ficifolia               Red Flowering Gum                2675                             4.3 per cent
      Tristaniopsis laurina            Kanooka or Water Gum             1916                             3.1 per cent
      Acacia melanoxylon               Blackwood                        1598                             2.6 per cent
      Lophostemon confertus            Queensland Brushbox              1569                             2.5 per cent                                       2.2.6 Age diversity
      Eucalyptus pryoriana             Coast Manna Gum                  1474                             2.4 per cent
                                                                                                                                                            Like species and genus diversity, age diversity is also an                           planted are Eucalyptus leucoxylon at 14 per cent of total young
                                                                                                                                                            important consideration in the management of the urban                               trees and Eucalyptus scoparia at 11 per cent. This suggests
                                                                                                                                                            forest. This is because tree populations with uniform age                            that recent plantings have not diversified the species mix and
     Table 2: The 10 most common species in Frankston’s inventory (tree numbers labelled top of columns)
                                                                                                                                                            classes are likely to decline and senesce concurrently causing                       instead are contributing to a dominance of these two species.
                                                                                                                                                            considerable management and landscape amenity impacts.
                                                                                                                                                                                                                                                 Proactive management of the semi-mature and mature trees
     Eucalyptus leucoxylon (Yellow Gum) is the most common              Looking forward, it will be imperative for Council to consider                      The actual age in years of a tree that is ‘mature’ is dependent                      is important in order to maximise their multitude of benefits
     species planted across Frankston City’s streets, followed          planting species that are likely to thrive and provide maximum                      on the species typical life cycle. For example, many Acacias                         as they enter old age. These trees will continue to provide
     by Eucalyptus scoparia (Wallangarra White Gum)                     benefits under climate change scenarios. Trialling new species                      naturally only live for a few decades, whilst some other trees                       the greatest ecosystem service benefits such as shade,
     at 5.9 per cent. When combined, the two Callistemons               and working with tree growers will be an important first step.                      such as Eucalypts or Elms can live for a century or more.                            stormwater interception and cooling and are therefore
     total almost 10 per cent of the tree inventory population.                                                                                                                                                                                  worth investment to maximise their lifespans.
                                                                        It is also recognised that of the top 10 most common species                        Frankston City’s trees are predominantly young (45 per cent
     A general management rule of thumb suggests that no one            only one species does not fall within the Myrtaceae family.                         of the population) with only a small proportion of trees in                          Trees in decline could be further assessed for their
     species should dominate the total tree population. Experts         This is a result of the majority of Australian trees being from                     decline. These young trees will become the future urban                              viability for treatment options to extend their lifespan
     suggest a 5-10 per cent limit to any one species within the        the Myrtaceae family and are comprised of indigenous                                forest and gradually shift into the semi mature and mature                           safely. Council should assess these trees for planned
     population. While this can be fairly loose depending on the        species that tend to be best adapted to local conditions.                           age categories. Of these young trees, the most commonly                              removals and replacement.
     ecological value placed on certain urban tree species, it is a     For that reason it is difficult to meet diversity target for
                                                                                                                                                                                     30,000
     useful guide to ensure that tree population is not dominated       plant families. Council will still aim to improve diversity
     by a few species. Species diversity is important in managing       overall, working towards greater diversity across family,
                                                                                                                                                                                     25,000
     risks of pest and disease incursion and helps ensure the           genus and species.

                                                                                                                                                          Number of existing trees
     tree population is resilient to future weather and climate
     conditions. Given that both E. leucoxylon and Callistemon’s        When selecting tree species, Council must ensure the right                                                   20,000

     together represent almost 20 per cent of the tree population,      tree is selected for the location. Different species provide
     a sound tree management program would reduce the                   different benefits for example large deciduous trees provide                                                 15,000

     dominance of these species through the planting of other           summer shade and facilitate effective solar access in winter
     species across the municipality. It is not encouraged to           to penetrate buildings and streets; native trees support                                                     10,000

     remove mature healthy trees to improve diversity outcomes.         local fauna by providing food and habitat; smaller trees
                                                                        can be planted under power lines etc. Trees will be selected                                                  5,000
                                                                                                                                                                                                                                                                                                4%
     It is noted that Eucalyptus scoparia are currently grappling       for increased diversity and resilience with consideration                                                                      45%                          19%                          23%
     with an unknown pest or disease, causing ill health and            given to selecting species based on performance, quality                                                         0
                                                                                                                                                                                                       Young                     Semi-mature                     Mature                       Decline
     sometimes death. Given it is the second most prevalent             of stock and availability, neighbourhood character
     species, Council requires ongoing investigation into the           (including wildlife corridors) and heritage values, suitability                                                                                                         Age class
     best management techniques to reduce the pest/disease              of growth and habit and other site requirements such as
     incursion as well as diversify the tree population away from       sight lines, utility services, space and surrounding uses.
     E. scoparia, through new tree plantings of varying species.        Canopy provision will be a high priority for all new plantings.                                              Figure 2: Age classes of tree population (per cent population labelled in columns)

18                                                                                                                         Frankston City Council   Urban Forest Action Plan                                                                                                                                       19
2.2.7 Tree health
      Healthy trees grow quicker, better defend themselves against       Trees classified as dead that are large, old indigenous
      abiotic stresses and pest/disease incursions and provide           trees require special consideration. They should be assess
      the greatest ecosystem service benefits. As such, health           to determine whether they can be pruned and retained
      information for trees is an important tool to understand           safely without the need for removal. These trees can
      urban forest performance and inform sound proactive                provide numerous recourses in limited supply such as
      management. For example, trees assigned as fair or poor            hollows, cracks and crevices for our indigenous fauna.
      health can be flagged for further inspection to determine          The distribution and abundance of ‘habitat’ trees within
      if any interventions can be made to improve tree health.           Frankston City Council has been reduced and fragmented
                                                                         by extensive clearing of native vegetation. Where the
      Monitoring inventory data to identify when tree health problems    removal of such trees is unavoidable the valuable habitat
      arise allows for early intervention. Early intervention as well    ‘resource’ should not be lost.
      as accurate identification of the cause is an essential step
      in pest and disease management allowing actions to be taken        Selected habitat trees and hollows should be relocated
      to reduce the risk of further contamination and spreading          within the site or to a neighbouring reserve where they
      of harmful insects, bacterial and fungal organisms by              can continue to provide resources for a diverse range
      employing good bio security measures.                              of organisms. The re-use of large hollows has been
                                                                         demonstrated to provide higher potential for uptake
      Almost 80 per cent of the tree inventory are in good or very       success by comparison to artificial nest boxes valuable
      good health. Ideally, this percentage should be upwards of         habitat for local wildlife.
      90 per cent and a proactive management plan can inform
      where interventions can be made to improve tree health.

                                                                                                                                                         2.2.8 Tree heights
                                                                                                                                                         Of interest are the percentage of trees within the population                       young trees in the landscape which are likely to grow taller
                                                                                                                                                         that are considered large. Large trees, especially native                           as they age as well as the dominance of small statured trees
                                                                                                                                                         species that are mature or over mature, provide invaluable                          within the street tree population ie. E. leucoxylon, E. scoparia
                                                                                                                                                         habitat for local wildlife. Coupled with the fact that large trees                  and Callistemons which are still selected for planting under
                                                                                                                                                         can provide up to 60-70 times more benefits than small trees,                       powerlines.
                                                                                                                                                         they are of great importance to the urban landscape.
                                                                                                                                                                                                                                             Of the tall trees, the most common species in this category
                                                                                                                                                         Only 1.6 per cent, or 903 trees within the inventory are                            is Eucalyptus pryoriana at 10 per cent of the total number
                                                                                                                                                         considered large ie. over 15m in height. Just under 10 per                          of tall trees, followed by Lophostemon confertus at 7.6 per
                                                                                                                                                         cent are medium to large trees (10-15m in height) and 25 per                        cent of the tall trees. Given E. pryoriana is a local indigenous
                                                                                                                                                         cent are medium height. Over 50 per cent of all public street                       species, these trees should be prioritised for protection
                                                                                                                                                         trees are only 3-5m tall. This matches the high percentage of                       and management for biodiversity outcomes.

                              100%                                                                                                                                                60%
                              90%
                                                                                                                                                                                  50%
                              80%
     Per cent of population

                                                                                                                                                        Per cent of population
                              70%
                                                                                                                                                                                  40%
                              60%
                              50%                                                                                                                                                 30%
                              40%
                                                                                                                                                                                  20%
                              30%
                              20%
                                                                                                                                                                                   10%
                              10%     3.6%       80.7%                    13.9%                  1.1%                  0.7%                                                                    12.9%                  50.7%                  25.5%                    9.3%                    1.6%
                                 0                                                                                                                                                   0
                                     Very good    Good                      Fair                 Poor                   Dead                                                                 Less than 3m              3 t0 5m                6 to 9m                10 to 15m           Greater than 15m
                                                                        Health class                                                                                                                                                     Tree height class

      Figure 3: Health classes of tree population (per cent population labelled in columns)                                                                                      Figure 4: Tree Height classes of tree population (per cent population labelled in columns)

20                                                                                                                       Frankston City Council   Urban Forest Action Plan                                                                                                                                      21
2.2.9 Vacant street tree sites                                                                                                                 Of these vacant sites, 254 are located within the Frankston Metropolitan Activity Centre. These vacant sites are likely to
                                                                                                                                                    require engineered, urban design solutions such as tree pits, structural cells and water sensitive urban design to create
     Council has measured over 16,300 vacant street tree sites across the urban area. There may also be opportunities to identify                   appropriate growing conditions for new trees. While trees planted in more highly urbanised areas are likely to cost more due
     more vacant sites. This poses enormous opportunity to both increase tree canopy cover but also improve species diversity.                      to these solutions, they are likely to yield greater benefits, particularly around shade provision and heat mitigation.

     Vacant street tree sites
         Vacant street tree sites
         Reserve

                                                                                                                                                             Air void
                                                                                                                                                                                                                                                             Water runoff
                                                                                                                                                    Footpath                                                                                                 from road

                                                                                                                                                                                                                                                             Filtration layer

                                                                                                                                                                                                                                                             Transition layer

                                                                                                                                                                                                                                                             Drainage layer

                                                                                                                                                    Perforated pipe to drain
                                                                                                                                                    filtered stormwater

     Map 5: Distribution of vacant street tree sites across Frankston                                                                                     Figure 5: Cross-section of a tree pit showing key functional elements

22                                                                                                                   Frankston City Council   Urban Forest Action Plan                                                                                                             23
2.3 Threats to our urban forest                                                                                                                                2.3.2 Climate change
                                                                                                                                                                      At its Ordinary Meeting in November 2019, Frankton City      To build resilience within our urban forest and natural
       2.3.1 Tree and canopy cover loss                                                                                                                               Council declared a climate emergency. Predicted changes      landscapes we need to be:
                                                                                                                                                                      to climate over the next few decades pose significant           • Selecting tree species that are likely to thrive under
       Council is losing more trees each year than are being planted.              mitigate the loss trend and to increase tree numbers                               challenges to the city’s urban forest. Increased average            changing climate conditions.
       Research conducted by RMIT and DELWP indicates that                         and canopy cover over time. Council and the community                              temperatures, lower average annual rainfall and the
                                                                                                                                                                                                                                      • Protecting and enhancing remnant patches of
       Frankston City lost 1 per cent of tree canopy cover from 2014               will need to apply resources and funding to a range of                             increased incidences of extreme weather events such
                                                                                                                                                                                                                                          indigenous vegetation through appropriate adjacent
       to 2018 (Spatial Datamart, DELWP, 2019). Another study found                solutions including a strategic, proactive tree planting                           as storms, floods and bushfire will place greater pressure
                                                                                                                                                                                                                                          street and park tree plantings.
       that Frankston lost 1.8% of its overall tree canopy between the             program, greater enforcement of Council’s existing local                           on our natural landscapes and expose the community
                                                                                   and planning laws protecting private vegetation, greater                           to greater health impacts.                                      • Ensuring the public tree population contains
       years of 2013 and 2016 (Amati et al, 2016). This trend is highly
                                                                                   protection of trees on or near development sites and                                                                                                   a rich diversity of species and age classes.
       concerning and if left unabated will result in a significantly
                                                                                   increasing awareness by the community to encourage                                 Frankston City is already seeing the complex impacts            • Creating adequate soil conditions for newly planted
       detrimental impact on the liveability of Frankston City. It is
                                                                                   homeowners to plant trees on their own properties.                                 of climate change on its population of Wallangarra White            trees to encourage deep root growth improving
       likely that this tree loss is occurring on both private and public
                                                                                                                                                                      Gums (Eucalyptus scoparia). Dieback is occurring within             the trees’ stability and resilience.
       land, though the loss on private land cannot currently be                   A greater emphasis on protection and retention of existing                         this species, likely as a result of a series of changes
       quantified. Added to this, the green wedge zone surprisingly                trees especially during development and construction works                                                                                         • Diverting stormwater to passively irrigate urban trees,
                                                                                                                                                                      including increased temperatures and drier soils which
       adds very little contribution to tree canopy.                               will help to reduce the unnecessary removal of established                                                                                             open space and vegetation through water sensitive
                                                                                                                                                                      reduce their overall health, making them more susceptible
                                                                                   and often remnant tree species, whilst aiming to halt any                                                                                              urban design.
       There are many reasons for this ongoing loss in Frankston                                                                                                      to pest and disease incursions. Research by the University
                                                                                   further reduction of canopy in the city. This involved better                      of Melbourne (Kendal et al, 2017) also indicates that           • Implementing a proactive tree inspection
       City. These include trees reaching the end of their useful                  consultation early in the design process of projects. Tree                                                                                             maintenance program, particularly pruning,
       lives, inappropriate tree selection, trees removed for                                                                                                         Yellow Gum (Eucalyptus leucoxylon) is sensitive to rising
                                                                                   protection guidelines outlined in Australian Standard                              urban temperatures. Given this species makes up nearly              to ensure trees are actively managed to minimise
       development purposes, trees removed under bushfire                          AS 4970 Protection of Trees on Development Sites must                                                                                                  defects and risk of failures in storms.
       exemptions for vegetation clearance (it is noted that this                                                                                                     10 per cent of the tree population, future vulnerability
                                                                                   continue to be enforced where regulations exist.                                                                                                   • Planting more trees for shade in areas of need,
       exemption within the Planning Scheme applies to the whole                                                                                                      is highly concerning.
                                                                                   Reinforcing the importance of trees particularly to home owners                                                                                        ie. in low socio-economic areas where communities
       municipality, including all highly urbanised areas), trees
                                                                                   will assist with protecting the existing urban forest where trees                                                                                      are vulnerable to heat impacts and in areas of high
       removed in backyards for individual owner reasons such
                                                                                   are removal for unjustified reasons that could be managed                                                                                              pedestrian activity such as commercial/retail zones
       as perceived risk and mess, renovations, etc.
                                                                                   through remedial or maintenance works. In accordance with                                                                                              and shared use paths.
       If the tree canopy cover continues on this trajectory of loss,              the Urban Forest Policy for each tree removal request,
       at 1 per cent every 4 years, by 2050, Frankston City will                   Council should assess individual tree removal on the specific
       have extremely low tree cover, changing the landscape                       merits of the tree and seek to avoid the removal of healthy
       and character of the municipality.                                          canopy trees by exploring the feasibility of alternative
                                                                                   options, where there is no alternative tree removal impacts
       The broad range of drivers of tree and canopy cover loss                    should be minimised and any removals offset with suitable
       will require an equally broad range of responses to both                    replacements that achieve no loss in tree canopy cover.

       Tree canopy cover – business as usual
                                     20%
                                     18%
     Per cent of tree canopy cover

                                     16%
                                     14%
                                     12%
                                     10%
                                     8%
                                     6%
                                     4%
                                     2%
                                       0
                                           2014   2018   2022   2026        2030            2034       2038        2042         2046         2050

                                                                                     Year

       Figure 6: Trajectory of tree canopy cover loss if Council continue along business as usual with current tree planning
       and management. Source: Amati et al, 2016. DELWP Spatial Datamart, Vegetation Cover 2018.

24                                                                                                                                     Frankston City Council   Urban Forest Action Plan                                                                                                          25
2.3.3 Resources and funding                                                                                                                     2.3.4 Urban development
     Current program funding and resourcing does not enable           Information silos within and outside of Council, coupled                       As discussed, there are varied reasons why tree canopy cover         Trees are also often seen as a liability and posing risk to
     Council to plant more street trees than it removes nor deliver   with stretched tree management resourcing, means trees                         is declining. Urban development, either on private land or           infrastructure, utilities and buildings, again devaluing their
     a strategic and proactive tree management program. Added         are often omitted from planning and capital investment                         government owned land requires trees to be removed to make           contribution to a property or streetscape. Consequently,
     to this, there is anecdotal evidence that the number of tree     decisions resulting in a lost opportunity for the future                       way for buildings/infrastructure but also directly or indirectly     many trees are damaged or removed illegally. In certain
     removals are likely to increase under climate change scenarios   of our urban forest.                                                           damages trees. In addition, trees are not currently valued as        areas of Frankston City, safety is a key issue and so line of
     as existing trees fail to cope, placing further pressure on                                                                                     an asset and are therefore rarely considered in the initial design   sight to CCTV cameras is important. Again, this has resulted
     existing budgets. As discussed, many of the Eucalyptus           Added to this, Council’s documented procedures for best                        process in the planning and building of hard infrastructure.         in the removal or excessive pruning of trees.
     scoparia are failing and will need removal to minimise risk,     practice urban tree management needs updating to include
     placing more demand on the tree management budget.               current standards, technical specifications for integrated                     Urban development and growing the urban forest do not                Given land is an appreciable asset, development looks to
                                                                      design solutions such as water sensitive urban design,                         have to be mutually exclusive. Good planning, provision of           improve capital land values with buildings and infrastructure,
     While Council already holds a tree inventory for street trees,   footpath and tree root sensitive designs. Current resources                    technical specifications for planting trees in highly urbanised      often leaving inadequate space to plant a tree, let alone one
     it is missing key data around useful life expectancy of street   and funding do not currently allow for these to be improved.                   areas, tree protection and enforcement can all go a long way         with a broad canopy. As Frankston City densifies its urban
     trees and detailed information on park trees. Collecting this                                                                                   into improving outcomes for the urban forest. Improving              area, this issue is likely to be further exacerbated. Added
     information is fundamental to achieving the tree canopy          This action plan demonstrates the values of the urban forest                   communication, particularly at project planning stages,              to this, large public infrastructure projects impact on tree
     cover target, to inform a proactive tree management              and the need for its protection and enhancement to be                          can help to retain and protect trees and plant new trees             canopy cover and rarely replace what is removed or provide
     program and allocating resources.                                adequately resourced and considered in future projects.                        post construction. Education and awareness raising for               sufficient funding for landscaping and ongoing maintenance
                                                                                                                                                     developers and residents looking to improve their property           of the landscaped area.
                                                                                                                                                     will also help them to make more informed decisions about
     Examples of good street planting                                                                                                                their project’s legacy.

                       Plowman Place, Franskton                                         Deane Street, Franskton

     Opportunities for improvement with additional resources

                        Fletcher Road overpass                                              Vacant tree sites

26                                                                                                                    Frankston City Council   Urban Forest Action Plan                                                                                                                    27
2.4 Priority areas for greening (opportunities)                                                                                    2.4.1 Health and wellbeing priority
                                                                                                                                        Given that Frankston City averages 17 per cent tree canopy cover, there is clear opportunity to increase it. One of the highest
     An analysis has been undertaken to determine priority locations for tree planting to inform Council’s                              priorities for more tree canopy are the areas where people are the most vulnerable to the impacts of heat and where tree
     tree planting program and budget to fill vacant tree sites of which there are over 16,000.                                         canopy is already low. Numerous areas in Frankston, Frankston North and Carrum Downs house members of the community
                                                                                                                                        who are at risk of high heat impacts, are vulnerable to heat and have low adaptative capacity for dealing with that heat.
                                                                                                                                        These areas are highlighted in red and orange in the map below.
     Priority areas have been assigned based on:              • Increased vegetation cover
         • Health and wellbeing outcomes                        Plus natural shade for the Frankston Metropolitan
             Areas of the municipality where heat impacts       Activity Centre.                                                        DELWP heat vulnerability index
             are high, social vulnerability to heat is high   • Biodiversity outcomes                                                        0 – not measured
             and where tree canopy cover is low.                Streets and open spaces that could be valuable                               1 – low exposure and low sensitivity to heat
                                                                connectors between areas of biodiversity value                               2
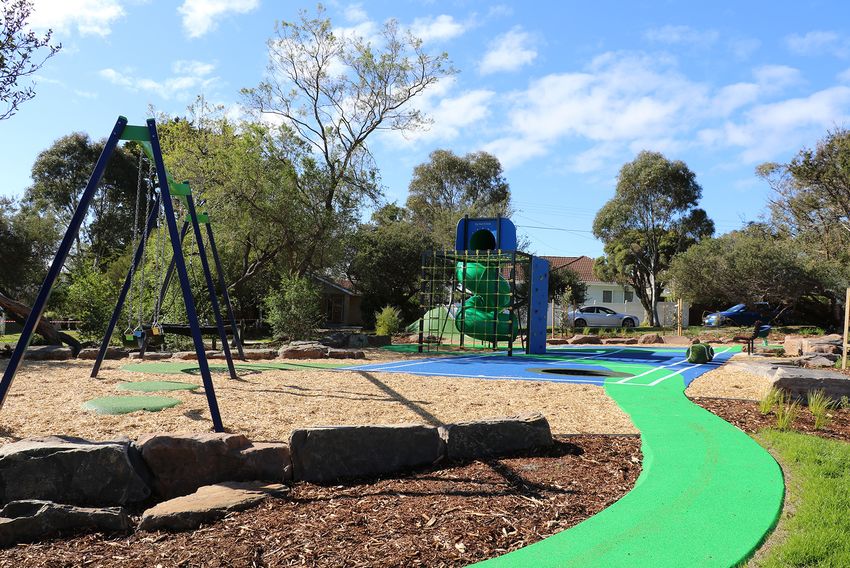
         • Shade for areas of high pedestrian activity                                                                                       3
             Such as around schools, playgrounds,               that should be planted with appropriate species.
                                                                                                                                             4
             commercial/retail zones, public transport        • Stormwater reduction outcomes                                                5 – high exposure and sensitivity to heat
             stops and shared user paths.                       Areas that are prone to localised flooding which could
                                                                be improved with increased tree and vegetation cover.

                                                                                                                                              Map 6: Heat Vulnerability Index for Frankston LGA. Source: Spatial Datamart, DELWP, 2019.

28                                                                                                       Frankston City Council   Urban Forest Action Plan                                                                                                                29
In looking then at areas where canopy cover is already low, again there are numerous areas where tree canopy cover                             Areas that have both heat vulnerability and low tree canopy cover are highlighted in red below. These are the areas that
     is 10 per cent or lower as highlighted in red below.                                                                                           should be targeted for a street and park tree planting program to increase tree canopy cover.

     Tree canopy cover                                                                                                                              Heat vulnerability and low tree canopy cover
     (trees over 3m)                                                                                                                                     Priority urban greening areas
         0 – 10%
         11 – 20%
         21 – 35%
         36 – 50%
         51 – 60%
         61 – 100%

                                                                                                                                                          Map 8: Areas where heat vulnerability, urban heat and low tree canopy cover intersect, highlighting priority areas for
     Map 7: Areas of low tree canopy cover (10 per cent or less) for Frankston LGA. Source: Spatial Datamart, DELWP, 2019.                                tree planting to improve health and wellbeing outcomes for Frankston LGA. Source: Spatial Datamart, DELWP, 2019.

30                                                                                                                   Frankston City Council   Urban Forest Action Plan                                                                                                             31
2.4.2 Shade ways for areas of high pedestrian/cycling activity                                                                                       Trails and shared user paths
                                                                                                                                                          Frankston City offers kilometres of shared use paths to encourage active transport and improve health and wellbeing
     Pedestrian intensity                                                                                                                                 outcomes. Some sections of these paths have very low tree canopy cover and should be prioritised for natural shade from
     The streets and roads that lead to facilities and services that are likely to be frequented by pedestrians should be                                 tree planting. The Peninsula Link trail also runs through areas where tree canopy is low. Tree planting should also be prioritised
     prioritised for tree shade provision. These facilities and services include playgrounds, schools, bus stops, train stations,                         along this path, particularly where it runs through Seaford and Frankston. It is noted that there are some sections of the trail
     retail/commercial areas and parks.                                                                                                                   that are not managed by Council. Partnerships with these landholders should be developed to encourage collaborating
                                                                                                                                                          in shade planting along their sections too.

     Areas of high pedestrian activity
                                                                                                                                                          Shared paths with low tree canopy cover
         Playgrounds
         Railway stations                                                                                                                                      Tree canopy cover 10% or less
         PTV Metro bus stops                                                                                                                                   Peninsula Link Trail
         Schools/education                                                                                                                                     Less than 10% tree canopy cover
         Reserves
         Central activity area
         Commercial zones

     Map 9: Points across the municipality where pedestrian activity is likely to be higher than others, therefore warranting                                   Map 10: Sections of shared use paths which occur in areas with very low tree canopy cover. Source: Spatial Datamart,
     the provision of more tree shade. Source: Spatial Datamart, DELWP, 2019 and Council GIS.                                                                   DELWP, 2019 and Council GIS.

32                                                                                                                         Frankston City Council   Urban Forest Action Plan                                                                                                                   33
2.4.3 Frankston Metropolitan Activity Centre (FMAC)                                                                                               The FMAC Structure Plan and associated Illustrative            Green roofs, walls and facades add green infrastructure
                                                                                                                                                       Guidelines should look to prioritise the inclusion of both     to a city because they can be included on new buildings
     The highly urbanised nature of the FMAC, lends itself to increased urban heat island effects as it is unsurprisingly dominated                    vegetation and water sensitive urban design to help            or retrofitted onto existing buildings, and require little,
     by hard surfaces. The image below shows that the FMAC is one Frankston’s hottest areas. It is also one of Frankston’s                             shade and cool the FMAC where possible. Because of the         if any, space at ground level.
     busiest areas with high pedestrian activity throughout the commercial precinct and towards the train station. This poses                          constrained spaces, it is likely that green infrastructure
     significant risk of heat exposure to Frankston’s community.                                                                                       solutions are required for the FMAC such as tree pits,         Whilst the cost of these solutions is often high, their benefits,
                                                                                                                                                       structural soils and cells, water sensitive urban design,      such as shade, cooling, health and wellbeing, stormwater
                                                                                                                                                       green walls, green roofs and rain gardens. These initiatives   flow reduction, amenity and landscape improvement
     Urban heat in Frankston                                                                                                                           can be used to compensate for the loss of urban greenery,      outweigh the costs and are an added greening opportunity
     Metropolitan Activity Centre                                                                                                                      and to provide localised cooling and aesthetic improvements    where space for trees may be limited. Green walls and
                                                                                                                                                       in dense urban centres where there is usually insufficient     facades require specialised expertise in their design,
         Central activity area                                                                                                                                                                                        installation and ongoing maintenance.
                                                                                                                                                       space for other types of green infrastructure.
         Playgrounds
         Railway stations
         PTV Metro bus stops
         Schools/education
         Reserves

     Urban heat in 2018
         7 – 9°C above baseline
         9.5 – 12°C above baseline

     Map 11: The FMAC characterised by high urban heat, low tree canopy cover and very high pedestrian activity should
     be prioritised for installation of green infrastructure. Source: Spatial Datamart, DELWP, 2019 and Council GIS.

34                                                                                                                      Frankston City Council   Urban Forest Action Plan                                                                                                                 35
2.4.4 Biodiversity priority                                                                                                                       2.4.5 Stormwater quality/localised flooding priority
     Streets and open spaces that connect and buffer areas of significant biodiversity value should be prioritised for planting                        Given trees, through their roots and canopies absorb stormwater, increasing tree canopy in areas where localised flooding
     of indigenous trees and where appropriate include understorey species that support these corridors. These corridors                               and inundation occurs is another priority. Known sites that ‘nuisance’ flood during heavy rainfall that are not mapped should
     are mapped below.                                                                                                                                 also be considered for streetscape treatments.

     Biodiversity linkages                                                                                                                             Localised flooding priorities
         Corridor                                                                                                                                           Priority roads for stormwater reduction
         Stepping stone                                                                                                                                     Land subject to inundation
         Core areas                                                                                                                                         Special building overlay –
         Nodes                                                                                                                                              prone to overland flooding

     Map 12: Important biodiversity corridors, nodes, core areas and stepping stones where appropriate tree species should                                   Map 13: Streets that occur or lead into flooding areas that should be targeted for increased tree canopy cover
     be planted to support biodiversity outcomes.                                                                                                            to reduce stormwater flows.

36                                                                                                                      Frankston City Council   Urban Forest Action Plan                                                                                                              37
• There will be an increase in resources to achieve
     2.5 Urban Forest Action Plan program/data logic                                                                                                The Urban Forest Action Plan priorities and Program Logic
                                                                                                                                                    are influenced by external factors. As such, there are a                 the actions to improve the urban forest, through
                                                                                                                                                    range of assumptions to be taken into account, including:                Council and other government/agencies.
     Council maintains a broad policy environment to guide community welling improvements.                                                              • During the timeframe of the Action Plan bushfire                 • While there will continue to be fluctuations
     Policy domains developed to provide this guidance include: A Healthy Community; A Safe                                                                 exemptions within the Planning Scheme will be                    and trends, there will be no change in climate
     Community; Community Strength; A Skilled Community; Stronger Families; A Sustainable                                                                   realigned with areas of recognised bushfire risk.                predictions over the implementation period.
                                                                                                                                                        • That increasing knowledge and awareness of the                   • There will be no significant decisions to change
     Economy and a Sustainable Environment.
                                                                                                                                                            benefits of trees leads to an increase in positive               land use over the implementation period, without
                                                                                                                                                            thinking of trees within the community and the wish              consideration to the natural environment.
     The Urban Forest Action Plan contributes to 5 strategic         The purpose of the Urban Forest Action Plan is to increase                             to act to protect nature (connection to nature).               • There will be no reduction in the delivery of current
     outcomes associated with four of the policy domains.            tree canopy cover and green infrastructure to enhance                              • Our urban forest is fundamental to the health                      programs such as gardens for wildlife, greening our
     The Action Plan follows the groundwork of the Greening          health and wellbeing and reduce the impact of climate                                  and wellbeing of every community member.                         future and national tree day.
     Our Future Environment Strategy 2014 – 2024, Urban              change on the environment. Frankston City Council will                             • A healthy tree community can help reduce                         • There will be no reduction in how Council collects
     Forest Policy which also informs the Council Plan,              take the lead and involve the community in stewardship                                 the impacts of climate change and absorb                         data on its street tree inventory.
     Community Plan and Open Space Strategy.                         of the improvements to be gained through implementation                                any impacts of climate change.                                 • DEWLP will continue to provide its cooling
                                                                     of the actions within this plan.
                                                                                                                                                        • Our indigenous species are more resilient                          and greening spatial data
                                                                                                                                                            to the impacts of climate change.
                                                                                                                                                                                                                        The open space and biodiversity indicators within
                                                                                                                                                        • Landowners are generally likely to abide by
                                                                                                                                                                                                                        the program and data logic framework will be updated
                                                                                                                                                            vegetation controls.
                                                                                                                                                                                                                        as new data/knowledge becomes available that adjusts
                               VISION: Frankston is the Lifestyle Capital of Victoria                                                                   • The community supports further investment                     these assumptions.
                                                                                                                                                            in our urban forest and its benefits.
                                                                                                                                                        • There will be no natural event or disease at a large
                                                                                                                                                            enough scale to impact on achieving the targets.

                                                                                                                                                    Planned outcomes and indicators
                                  Healthy          Sustainable           Safe            Community                                                     Policy domain         Description       Measure of success                      Indicator                   Indicator data
                                 Community         Environment         Community          Strength                                                     and outcomes
                                                                                                                                                      Sustainable        Frankston City’s      Tree canopy cover        Tree canopy cover increased from          DELWP mapping
                                                                                                                                                      environment        streets and parks                              17 per cent to 20 per cent
                                                         Policy Domains                                                                                                  are tree lined
                                                                                                                                                                                               Urban temperature        Area recorded with 9.5 to 12°C+ urban     DELWP mapping
                                                                                                                                                                         creating cooler
                                                                                                                                                                                                                        heat reduced by 50% (see Map 3)
                                                                                                                                                                         environments
                                                                                                                                                      1. Active          People are involved   Visitation to natural    Increase in visitation/duration of stay   TBD – survey
                                                                                                                                                      community          in passive and        reserves and open                                                  or pedestrian
                                          Open Space                                                  Social                                                             active use of our     space areas                                                        counter setup in
                         Active                                 Clean Air       Safe Design                                                                              natural reserves                                                                         key local parks
                                              and                                                 Inclusion and
                       community                               and Water       (public realm)                                                                            and                                                                                      for each precinct
                                          Biodiversity                                             Engagement
                                                                                                                                                                         open space areas
                                                                                                                                                                                               Residents engaged        Increase in non-physical activities       VicHealth
                                                                                                                                                                                               in outdoor exercise      (68.6%) walking (53.7%), jogging          Indicators Survey
                                                    Long Term Outcomes                                                                                                                         as a physical activity   and running (10%) and cycling (7.6%)      (2015)
                                                                                                                                                                                                                        to state benchmark

                                                                                                                                                      2. Open            Our local             Weed cover and           100% indigenous species planted           RRR mapping
                                                                                                                                                      space and          biodiversity          indigenous species       30% of mapped bushland with less          and street tree
                                                                                                                                                      biodiversity       is thriving           cover in bushland        than 30% weed coverage                    inventory
                                                                                                   Connected
                         Healthy            Diverse        Comprehensive      Exemplary Tree                                                                             and safeguarded       reserves
                                                                                                   Biodiversity
                          Trees           Street Trees       Tree Data          Protection
                                                                                                    Corridors                                                                                  Areas of recognised      Introduction of planning overlays         Progress of
                                                                                                                                                                                               high significance        within the planning scheme                amendment
                                                                                                                                                                                               vegetation protected                                               within planning
                                                   Urban Forest Priorities                                                                                                                                                                                        scheme

38                                                                                                                   Frankston City Council   Urban Forest Action Plan                                                                                                                39
Policy domain
     and outcomes         Description      Measure of success                      Indicator                     Indicator data
                                                                                                                                                    Urban Forest Action Plan
     3. Clean air
     and water
                      Frankston City’s
                      beaches and
                      waterways are
                                           Water quality of
                                           Frankston’s beaches
                                                                    Frankston’s beaches have a ‘Good’
                                                                    rating (meets Victorian water quality
                                                                    standards) or above at the end of each
                                                                                                               EPA Beach
                                                                                                               Report                               2020–2040
                      healthy                                       season’s long term quality objectives
     4. Safe design   Public spaces are    People feeling safe      An increase in the percentage of           VicHealth
     (public realm)   activated and have   walking in their         residents feeling safe walking during      Indicators Survey
                      visual appeal        local area during        the day (87.2%) to be comparable           (2015)
                                           the day                  with state benchmark
                                           People feeling safe      An increase in the in the percentage       VicHealth
                                           walking in their local   of residents feeling safe walking in       Indicators Survey
                                           area after dark          their local area after dark (46.1.2%) to   (2015)
                                                                    be comparable with state benchmark
     5. Social        Improved health      Residents attending      An increase in the number of resident      Participation at
     inclusion and    and wellbeing        Council green events     attending green events                     event records
     engagement       amongst the          such as National
                      community            Tree Day, Indigenous
                      through improved     Nursery Open Day,
                      connections with     Gardens for Wildlife,
                      nature               workshops
                                           Residents                An increase in the number of               Volunteer register
                                           volunteering for         volunteers and number of hours
                                           green gains              volunteering
                                                      Input consideration
     6. Best          Well-planned,        Overall tree health      90 per cent of all street trees have a     Street tree
     practice         resourced                                     good or very good tree health rating       inventory data
                      and managed                                   (see current levels in Figure 3)
                      urban forest
                                           A diverse street tree    No one species represents more than        Street tree
                                           population               5 per cent of the population (excluding    inventory data
                                                                    indigenous species)
                                           A complete and           All street trees and open space trees      Street tree
                                           comprehensive            included in the asset management           inventory data
                                           tree data set            system and data sets are updated
                                                                    every two years

40                                                                                                                   Frankston City Council   Urban Forest Action Plan         41
Short term up to 4 years
     Action                                                                                Relationship                                                  Action                                                                                Relationship
                                                 Action                                                         Responsibility                                                                       Action                                                          Responsibility
      no.                                                                                  to outcomes                                                    no.                                                                                  to outcomes
     S.1      Develop Urban Forest Local Area Plans identifying opportunities              1, 2, 4, 6      Policy, Planning &                            S.14       Continue to advocate to state government and through MAV for               2, 6            Policy, Planning &
              for key planting initiatives and an associated 10-year capital tree                          Environmental Strategies                                 the increased protection of remnant River Red Gums (Eucalyptus                             Environmental Strategies
              planting program. Initiatives are to prioritise streets as identified                                                                                 camaldulensis) through a policy or planning control.                                       / Governance & Information
              in Section 9 of this report, while aiming to fill all vacant street tree
                                                                                                                                                         S.15       Investigate, respond and monitor the decline of Coast Banksia              2               Policy, Planning &
              sites and identify bulk planting throughout the Municipality that
                                                                                                                                                                    (Banksia integrifolia) within Seaford foreshore.                                           Environmental Strategies
              could be implemented within the first 12–15 months.
                                                                                                                                                                                                                                                               / Operations
     S.2      Explore potential new street tree sites to be included in the tree           2               Operations / Business
                                                                                                                                                         S.16       Investigate the protection of significant Coast Banksia                    2, 6            Policy, Planning &
              inventory ‘vacant site’ and mapped in GIS for future planting.                               & Information Technology
                                                                                                                                                                    (Banksia integrifolia) throughout Seaford through introduction                             Environmental Strategies
     S.3      Identify ‘Wildlife Corridor’ and natural reserve buffer streets and design   2               Policy, Planning &                                       of a planning control.
              for indigenous planting along roadsides to bolster habitat linkages.                         Environmental Strategies
                                                                                                                                                         S.17       Include the Urban Forest Action Plan as a reference document               2, 6            Policy, Planning &
     S.4      Develop a Street Tree Opportunities Plan that aims to prioritise             1, 2, 3, 4, 5   Policy, Planning &                                       to the MSS.                                                                                Environmental Strategies
              street tree and other greening initiatives to achieve our Urban Forest                       Environmental Strategies
                                                                                                                                                         S.18       Develop process to include best practice urban greening solutions          2, 3, 4, 6      Policy, Planning &
              aims for the City Centre to be to be delivered through the Greening
                                                                                                                                                                    for each asset renewal project within the Long–Term Infrastructure                         Environmental Strategies
              Improvement Program.
                                                                                                                                                                    Plan. Tree retention as a first priority and urban greening (with                          / Sustainable Assets
     S.5      Review the FMAC Illustrative Guidelines and the FMAC Streetscapes            1, 2, 3, 4, 5   Policy, Planning &                                       reference to canopy targets) to be included in initial planning
              Master Plan and palate to include best practice urban greening                               Environmental Strategies                                 and budgeting phases.
              solutions and maintain its coastal character within the delivery
                                                                                                                                                         S.19       Introduce new planning controls that require adequate deep soil            2, 6            Policy, Planning &
              of the FMAC Structure Plan.
                                                                                                                                                                    planting zones for the planting of canopy trees in all proposed                            Environmental Strategies
     S.6      Develop a priority list of areas for water sensitive urban design delivery   2, 3, 4         Policy, Planning &                                       residential development (front, side or rear setback).
              where increased vegetation could ameliorate nuisance flooding.                               Environmental Strategies
                                                                                                                                                         S.20       Re-establish the Climate Change Task Force and Open Space Working          1, 2, 3, 4, 5   Policy, Planning &
                                                                                                           / Engineering Services
                                                                                                                                                                    Group or similar to achieve integrated outcomes in all council projects:                   Environmental Strategies
     S.7      Develop a formative tree pruning program for trees that have come            2, 6            Operations                                               climate change adaptation, increased tree canopy and greening,
              out of the establishment program eg. trees that have been in the                                                                                      improved health and wellbeing and better biodiversity outcomes.
              ground for 4–5 years.
                                                                                                                                                         S.21       Develop a protocol for the protection of Council trees during              1, 2, 3, 4, 5   Policy, Planning &
     S.8      Review appeal and enforcement process under Tree Protection Local Law.       6               Policy, Planning &                                       development including a review of other Council methodologies                              Environmental Strategies
                                                                                                           Environmental Strategies                                 eg. bonds.
     S.9      Develop an urban forest infographic for use in all relevant                  5, 6            Policy, Planning &                            S.22       Review guidelines for council tree removal for development                 6               Policy, Planning &
              council communications.                                                                      Environmental Strategies                                 and attribute appropriate dollar values.                                                   Environmental Strategies
                                                                                                           / Communications
                                                                                                                                                         S.23       Review and update technical tree management protocols to reflect           2, 4, 6         Policy, Planning &
     S.10     Develop a media and communication plan to promote the                        5, 6            Policy, Planning &                                       current leading practice and updated standards.                                            Environmental Strategies
              tree canopy targets and the benefits of the urban forest                                     Environmental Strategies
                                                                                                                                                         S.24       For council projects where the need for irrigation is demonstrated         1, 2, 4, 5      Capital Works Delivery /
              to the Frankston community.                                                                  / Communications
                                                                                                                                                                    (eg. for maintaining optimal tree planting conditions), review the                         Sustainable Assets
     S.11     Create an online portal or map where community can log trees                 1, 2, 5         Policy, Planning &                                       costs and benefits of options to minimise council’s reliance on
              they have planted (similar to Hornsby City Council) to contribute                            Environmental Strategies                                 potable water and increase the use of alternative, sustainable
              to achieving canopy cover targets and bulk tree planting across                              / Community Relations /                                  water sources (eg. stormwater, recycled water).
              the municipality.                                                                            Business and Information
                                                                                                                                                         S.25       Develop a City Centre Laneways Plan and deliver the greening               2, 3, 4, 6      Policy, Planning &
                                                                                                           Technology
                                                                                                                                                                    elements within the City Centre Greening Improvements Plan.                                Environmental Strategies
     S.12     Review Frankston’s Neighbourhood Character Policy and design                 2, 4, 6         Policy, Planning &
                                                                                                                                                         S.26       Continue to advocate with state government to review extent                2               Policy, Planning &
              guidelines to directly reference the importance of the urban forest.                         Environmental Strategies
                                                                                                                                                                    of bushfire clearance exemptions within Frankston City Council                             Environmental Strategies
     S.13     Update the status of the decline of Eucalyptus scoparia and the              6               Operations                                               Planning Scheme to minimise impact of unnecessary tree removals.
              environmental and financial implications. Prepare an annual plan for                                                                                  Investigate potential collaboration with MAV on this issue.
              including costs for their gradual replacement with an appropriate species.
                                                                                                                                                         S.27       Update Landscape Guidelines to include requirements for canopy             1, 2, 4, 5      Policy, Planning &
                                                                                                                                                                    tree planting including space requirements and soil volumes.                               Environmental Strategies

42                                                                                                                      Frankston City Council   Urban Forest Action Plan                                                                                                                   43
You can also read