Retrieval and validation of forest background reflectivity from daily Moderate Resolution Imaging Spectroradiometer (MODIS) bidirectional ...
←
→
Page content transcription
If your browser does not render page correctly, please read the page content below
Biogeosciences, 18, 621–635, 2021
https://doi.org/10.5194/bg-18-621-2021
© Author(s) 2021. This work is distributed under
the Creative Commons Attribution 4.0 License.

Retrieval and validation of forest background reflectivity from daily
Moderate Resolution Imaging Spectroradiometer (MODIS)
bidirectional reflectance distribution function (BRDF) data across
European forests
Jan Pisek1 , Angela Erb2 , Lauri Korhonen3 , Tobias Biermann4 , Arnaud Carrara5 , Edoardo Cremonese6 ,
Matthias Cuntz7 , Silvano Fares8 , Giacomo Gerosa9 , Thomas Grünwald10 , Niklas Hase11 , Michal Heliasz4 ,
Andreas Ibrom12 , Alexander Knohl13 , Johannes Kobler14 , Bart Kruijt15 , Holger Lange16 , Leena Leppänen17 ,
Jean-Marc Limousin18 , Francisco Ramon Lopez Serrano19 , Denis Loustau20 , Petr Lukeš21 , Lars Lundin22 ,
Riccardo Marzuoli9 , Meelis Mölder4 , Leonardo Montagnani23,31 , Johan Neirynck24 , Matthias Peichl25 ,
Corinna Rebmann11 , Eva Rubio19 , Margarida Santos-Reis26 , Crystal Schaaf2 , Marius Schmidt27 ,
Guillaume Simioni28 , Kamel Soudani29 , and Caroline Vincke30
1 Tartu  Observatory, University of Tartu, Tõravere, Tartumaa, Estonia
2 School  for the Environment, University of Massachusetts Boston, Boston, Massachusetts, USA
3 School of Forest Sciences, University of Eastern Finland, Joensuu, Finland
4 Lund University, Lund, Sweden
5 Fundación CEAM, Paterna, Valencia, Spain
6 ARPA Valle d’Aosta, Saint-Christophe, Italy
7 Université de Lorraine, AgroParisTech, INRAE, UMR Silva, Nancy, France
8 CNR – National Research Council, Rome, Italy
9 Department of Mathematics and Physics, Università Cattolica del Sacro Cuore, Brescia, Italy
10 Institute of Hydrology and Meteorology, Department of Hydro Sciences, Technische Universität Dresden,

Dresden, Germany
11 Helmholtz Centre for Environmental Research – UFZ, Leipzig, Germany
12 Department of Environmental Engineering, Technical University of Denmark, Kongens Lyngby, Denmark
13 Faculty of Forest Sciences and Forest Ecology, University of Göttingen, Göttingen, Germany
14 Umweltbundesamt GmbH, Vienna, Austria
15 Department of Environmental Sciences, Wageningen University & Research, Wageningen, the Netherlands
16 Norwegian Institute of Bioeconomy Research, Ås, Norway
17 Space and Earth Observation Centre, Finnish Meteorological Institute, Sodankylä, Finland
18 CEFE, Université Montpellier, CNRS, EPHE, IRD, Université Paul-Valéry Montpellier, Montpellier, France
19 IER-ETSIAM, Universidad de Castilla-La Mancha, Albacete, Spain
20 INRAE, Bordeaux, France
21 Global Change Research Institute, Academy of Sciences of the Czech Republic, Brno, Czech Republic
22 Department of Soil and Environment, Swedish University of Agricultural Sciences, Uppsala, Sweden
23 Faculty of Science and Technology, Free University of Bolzano, Bolzano, Italy
24 INBO, Geraardsbergen, Belgium
25 Department of Forest Ecology and Management, Swedish University of Agricultural Sciences, Umeå, Sweden
26 cE3c – Centre for Ecology, Evolution and Environmental Changes, Lisbon, Portugal
27 Forschungszentrum Jülich, Jülich, Germany
28 INRAE URFM, Avignon, France
29 Université Paris-Saclay, CNRS, AgroParisTech, Ecologie, Systématique et Evolution, Orsay, France
30 Faculty of Bioscience Engineering, Earth and Life Institute, Université Catholique de Louvain, Louvain-la-Neuve, Belgium

Published by Copernicus Publications on behalf of the European Geosciences Union.
622                                                 J. Pisek et al.: Retrieval and validation of forest background reflectivity

31 Forest   Services, Autonomous Province of Bolzano, Bolzano, Italy

Correspondence: Jan Pisek (janpisek@gmail.com)

Received: 30 September 2020 – Discussion started: 4 November 2020
Revised: 12 January 2021 – Accepted: 12 January 2021 – Published: 27 January 2021

Abstract. Information about forest background reflectance          et al., 2001). The understory vegetation in forest ecosystems
is needed for accurate biophysical parameter retrieval from        should be treated differently from the overstory in carbon cy-
forest canopies (overstory) with remote sensing. Separating        cle modeling because of the different residence times of car-
under- and overstory signals would enable more accurate            bon fixed through NPP in different ecosystem components
modeling of forest carbon and energy fluxes. We retrieved          (Vogel and Gower, 1998; Rentch et al., 2003; Marques and
values of the normalized difference vegetation index (NDVI)        Oliveira, 2004; Kim et al., 2016). Currently, the understory
of the forest understory with the multi-angular Moderate           is often treated as an unknown quantity in carbon models
Resolution Imaging Spectroradiometer (MODIS) bidirec-              due to the difficulties in measuring it properly and consis-
tional reflectance distribution function (BRDF)/albedo data        tently across larger scales (Luyssaert et al., 2007). The pre-
(gridded 500 m daily Collection 6 product), using a method         dictions regarding the spectral variation in forest background
originally developed for boreal forests. The forest floor back-    have posed a persistent challenge (McDonald et al., 1998;
ground reflectance estimates from the MODIS data were              Gemmell, 2000) because of the high variability in incoming
compared with in situ understory reflectance measurements          radiance below the forest canopy, challenges with the spec-
carried out at an extensive set of forest ecosystem experi-        tral characterization, and weak signal in some parts of the
mental sites across Europe. The reflectance estimates from         spectrum for both overstory and understory (Schaepman et
MODIS data were, hence, tested across diverse forest con-          al., 2009), and the general varying nature of the understory
ditions and phenological phases during the growing season          (Miller et al., 1997).
to examine their applicability for ecosystems other than bo-          Multi-angle remote sensing can capture signals of differ-
real forests. Here we report that the method can deliver good      ent forest layers because the observed proportions for dif-
retrievals, especially over different forest types with open       ferent forest layers vary with the viewing angle, making it
canopies (low foliage cover). The performance of the method        possible to separate forest overstory and understory signal.
was found to be limited over forests with closed canopies          Here, we aim to consolidate previous efforts of tracking un-
(high foliage cover), where the signal from understory be-         derstory reflectance and its dynamics with multi-angle Earth
comes too attenuated. The spatial heterogeneity of individ-        observation data (Canisius and Chen, 2007; Pisek and Chen,
ual field sites and the limitations and documented quality of      2009; Pisek et al., 2010, 2012, 2015a, 2015b, 2016; Jiao et
the MODIS BRDF product are shown to be important for the           al., 2014) by testing the validity of this approach, using Mod-
correct assessment and validation of the retrievals obtained       erate Resolution Imaging Spectroradiometer bidirectional re-
with remote sensing.                                               flectance distribution function (MODIS BRDF)/albedo data
                                                                   (gridded 500 m daily Collection; 6 MCD43 product), against
                                                                   in situ understory reflectance measurements over an ex-
                                                                   tended set of Integrated Carbon Observation System (ICOS)
1   Introduction                                                   forest ecosystem sites. The validation procedure was de-
                                                                   fined to comply as much as possible with the best prac-
The reflectance from the forest canopy background/forest
                                                                   tices proposed by the Committee on Earth Observation Satel-
floor can often confound and even dominate the radiomet-
                                                                   lites (CEOS) Working Group on Calibration and Validation
ric signal from the upper forest canopy layer to the atmo-
                                                                   (WGCV) Land Product Validation (LPV) subgroup (Gar-
sphere. Forest understory is defined here as all the compo-
                                                                   rigues et al., 2008; Baret et al., 2006). It corresponds to
nents found under the forest canopy, including understory
                                                                   Stage 1 validation, as defined by the CEOS (Nightingale et
vegetation, leaf litter, moss, lichen, rock, soil, snow, or a
                                                                   al., 2011; Weiss et al., 2014), where product accuracy shall
mixture thereof (Pisek and Chen, 2009). If unaccounted for,
                                                                   be assessed over a small (typically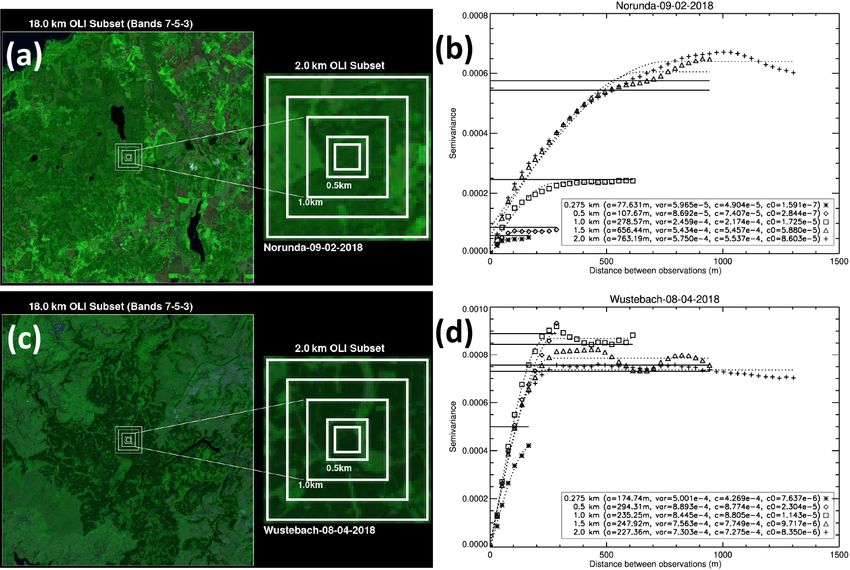
J. Pisek et al.: Retrieval and validation of forest background reflectivity                                                      623

                                                                       2.2   Understory spectra and forest canopy cover/closure
                                                                             in situ measurements

                                                                       Following the terminology by Schaepman-Strub et
                                                                       al. (2006), we refer to the reflectance factors mea-
                                                                       sured by the field spectrometers as the satellite-derived
                                                                       hemispherical–directional reflectance factors (HDRFs).
                                                                       The given spectrometer’s field of view is approximated
                                                                       as being angular (cone) and narrower than a whole hemi-
                                                                       sphere, with some anisotropy captured which corresponds
                                                                       to normal remote sensing viewing geometry. An overview
                                                                       of the undertaken in situ campaigns at each site and their
                                                                       characteristics are given in Table 1.
                                                                          The individual sites were visited between April 2016 and
                                                                       August 2019, mostly during the growing season. Following
                                                                       the protocol by Rautiainen et al. (2011), the understory spec-
                                                                       tra were measured with the Sun completely obscured by the
                                                                       clouds or at around sunset (diffuse light conditions), cover-
                                                                       ing the visible/near infrared (NIR) region, depending on the
                                                                       spectrometer (see Table 1 for more details). A total of three
Figure 1. Distribution of study sites across Europe; for further de-   understory spectra were measured every 2 m along two 50 m
tails, refer to Table 1.                                               long transects laid at each site, resulting in 50 measurement
                                                                       points (150 individual measurements). Transects covered and
                                                                       characterized conditions within the measurement footprint
    2. Can we retrieve reliable normalized difference vegeta-          of the given tower. It should be noted that the tower foot-
       tion index (NDVI; Rouse et al., 1973; Tucker, 1979) dy-         print might be different from the exact MODIS pixel foot-
       namics for understory with MODIS BRDF data across               print (see Sect. 2.5 for the spatial homogeneity assessment
       diverse forest conditions during the growing season?            of MODIS pixels). The measurements concerned conditions
                                                                       on the forest floor and low herbaceous and shrubby species or
    3. Are there important differences between the total (over-        tree seedlings and saplings, as the area sampled by each spec-
       story and understory) and understory-only NDVI sig-             tral measurement was estimated to correspond to a ∼ 50 cm
       nals?                                                           diameter circle on the ground. The downward-pointing spec-
                                                                       troradiometer (no fore optics were used) was held by the op-
                                                                       erator’s outstretched hand. A total of three spectra above a
2     Materials and methods                                            10 in. (0.254 m) Spectralon SRT-99–100 white panel were
                                                                       recorded at the beginning, after every four understory spec-
2.1    Study sites                                                     tra measurement points (every 8 m), and at end of each tran-
                                                                       sect. A hemispherical, conical reflectance factor was ob-
The ICOS is a distributed pan-European research infras-                tained with an uncalibrated Spectralon reflectance spectrum
tructure providing in situ standardized, integrated, long-term         and the linearly interpolated irradiance. Finally, broadband
and high-precision observations of lower atmosphere green-             HDRFs for red (620–670 nm) and NIR (841–876 nm) wave-
house gas (GHG) concentrations and land–atmosphere and                 lengths were computed with relative spectral response func-
ocean–atmosphere GHG interactions (Gielen et al., 2017).               tions for the MODIS sensor onboard Terra. The understory
In this study, we carried out the evaluation over the network          NDVI value for given site was calculated from the red and
of 31 ICOS-affiliated forest ecosystem sites, complemented             NIR-band values and averaged over the two transects.
with additional sites in Spain, Portugal, Austria, and Finland.           Estimates of overstory foliage cover and crown cover were
Together, these selected 40 study sites comprise a large vari-         obtained from digital cover photographs (DCPs). Overstory
ety of forest over- and understory types, spanning a wide lat-         foliage cover was defined as the percentage of ground cov-
itudinal gradient from almost 38◦ N (Yeste, Spain) to 68◦ N            ered by the vertical projection of foliage and branches and
(Kenttärova, Finland). Site locations are shown in Fig. 1, and         crown cover as the percentage of ground covered by the ver-
vegetation characteristics are summarized in Table 1.                  tical projections of the outermost perimeters of the crowns
                                                                       on the horizontal plane (without double-counting the over-
                                                                       lap; Gschwantner et al., 2009). The DCPs were taken from
                                                                       below the canopy every 8 m along transects at each site. The
                                                                       camera (Nikon CoolPix4500; 2272 × 1704 resolution) was

https://doi.org/10.5194/bg-18-621-2021                                                          Biogeosciences, 18, 621–635, 2021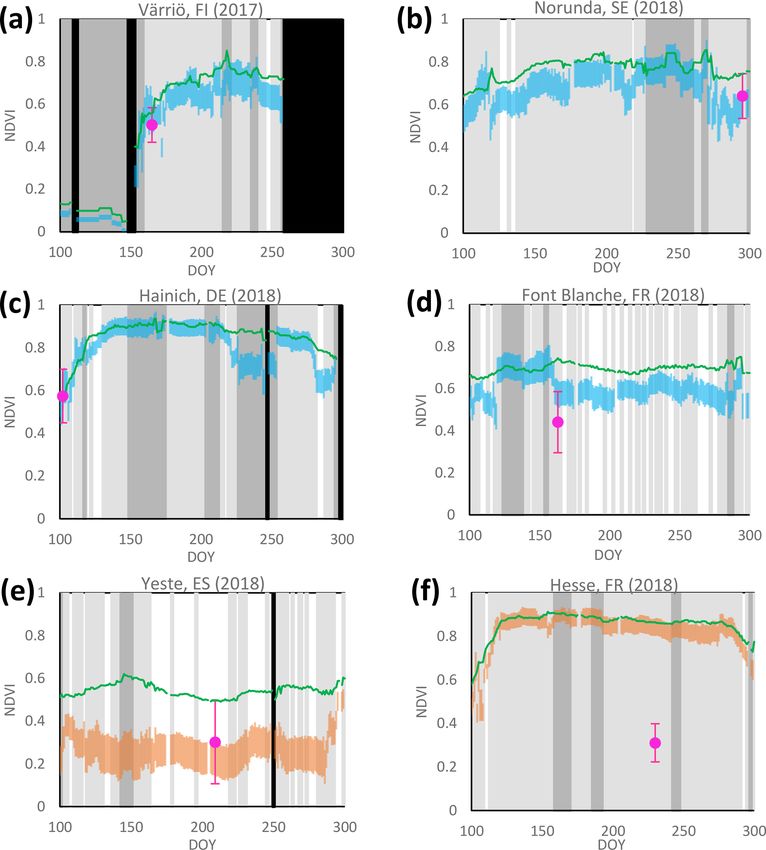
J. Pisek et al.: Retrieval and validation of forest background reflectivity
https://doi.org/10.5194/bg-18-621-2021
Table 1. Study site characteristics and their spatial representativeness status. ICOS – Integrated Carbon Observing System sites; LTER – Long Term Ecological Research Network sites.
Note that the sampling dates are shown in the format yyyy/mm/dd.
Site code Site name Lat (◦ ) Long (◦ ) Sampling date Spectrometer model Understory vegetation Representativeness
AT-Zbn Zöbelboden (LTER) 47.842 14.442 2017/11/18 ASD FieldSpec 4 Calamagrostis varia, Brachypodium Not representative
sylvaticum, Hordelymus europaeus,
and Senecio ovatus
BE-Bra Brasschaat (ICOS) 51.304 4.519 2019/01/12 Ocean Optics; FLAME-S-VIS-NIR-ES Betula spec., Quercus robur, and Representative
Sorbus aucuparia
BE-Vie Vielsalm (ICOS) 50.3 5.983 2018/08/16 Ocean Optics; FLAME-S-VIS-NIR-ES Sparse fern and moss cover Representative at 0.5 km
CH-Dav Davos (ICOS) 46.817 9.85 2018/07/12 Ocean Optics; FLAME-S-VIS-NIR-ES Dwarf shrubs, blueberry, and mosses Representative
CZ-BK1 Bílý Kříž (ICOS) 49.502 18.539 2016/04/17 ASD FieldSpec 4 Vaccinium myrtillus L. Representative at 1.5 km
CZ-Lnz Lanžhot (ICOS) 48.682 16.948 2017/04/27 ASD FieldSpec 4 Allium ursinum and Asarum europeum Representative
DE-Hai Hainich (ICOS) 51.079 10.453 2018/04/12 Ocean Optics; FLAME-S-VIS-NIR-ES Anemone nemorosa and Allium ursinum Representative
DE-HoH Hohes Holz (ICOS) 52.083 11.217 2018/04/11 Ocean Optics; FLAME-S-VIS-NIR-ES Anemone nemorosa Representative
DE-RuW Wüstebach (ICOS) 50.505 6.331 2018/08/16 Ocean Optics; FLAME-S-VIS-NIR-ES Sparse Deschampsia flexuosa, Not representative
Deschampsia cespitosa and Molinia
caerulea
DE-Tha Tharandt (ICOS) 50.967 13.567 2018/04/12 Ocean Optics; FLAME-S-VIS-NIR-ES Fagus sylvatica, Abies alba, and De- Representative
schampsia flexuosa
DK-Sor Soroe (ICOS) 55.486 11.645 2018/09/26 Ocean Optics; FLAME-S-VIS-NIR-ES Beech saplings and seedlings; Pterid- Representative
ium aquilinum
ES-AP1 Almodóvar del Pinar 39.677 −1.848 2017/11/09 ASD FieldSpec HandHeld 2 Quercus ilex ssp. ballota, Rosmari- Representative
nus officinalis, Thymus vulgaris, Lavan-
dula latifolia, Quercus coccifera, and
Genista scorpius
Biogeosciences, 18, 621–635, 2021
ES-CMu Cuenca del Majadas 40.252 −1.965 2017/11/12 ASD FieldSpec HandHeld 2 Juniperus communis, Juniperus Representative at 0.5 km
oxycedrus, and Crataegus monogyna
ES-CPa Cortes de Pallas 39.224 −0.903 2017/11/08 Ocean Optics; FLAME-S-VIS-NIR-ES Rosmarinus officinalis, Ulex Representative >0.5 km
parviflorus, and Brachypodium retusum
ES-Yst Yeste 38.339 −2.351 2018/07/28 Ocean Optics; FLAME-S-VIS-NIR-ES Rosmarinus officinalis L., Thymus vul- Representative at 0.5 km
garis L., and Cistus clusii Dunal
FI-Hal Halssiaapa 67.368 26.654 2017/06/13 ASD FieldSpec Pro Sedge vegetation Representative
FI-Hyy Hyytiälä (ICOS) 61.847 24.295 2018/06/28 Ocean Optics; FLAME-S-VIS-NIR-ES Vaccinium spec. and Norway spruce Representative at 0.5 km
seedlings
624Table 1. Continued.
Site Code Site Name Lat (◦ ) Long (◦ ) Sampling date Spectrometer model Understory vegetation Representativeness
FI-Ken Kenttärova (ICOS) 67.987 24.243 2017/06/13 ASD FieldSpec Pro Vaccinium myrtillus, Empetrum Representative at 2 km
nigrum, and Vaccinium vitis-idaea and
the forest mosses Pleurozium schreberi,
Hylocomium splendens, and Dicranum
polysetum
FI-Kns Kalevansuo 60.647 24.356 2017/06/15 ASD FieldSpec Pro Dwarf shrubs and mosses Representative at 0.275 km
FI-Let Lettosuo (ICOS) 60.642 23.96 2017/06/15 ASD FieldSpec Pro Dwarf shrubs, mosses, and herbs Representative626 J. Pisek et al.: Retrieval and validation of forest background reflectivity
set to automatic exposure, aperture-priority mode, minimum
Table 1. Continued.
SE-Svb
SE-Nor
SE-Knd
SE-Htm
PT-Cor
NO-Hur
NL-Loo
Site Code
aperture, and F2 lens (Macfarlane et al., 2007). The camera
was leveled at the height of 1.4 m above the ground, and the
lens was pointed towards the zenith. This setup provides a
view zenith angle from 0 to 15◦ , which is comparable with
Svartberget (ICOS)
Norunda (ICOS)
Kindla (LTER)
Hyltemossa (ICOS)
Coruche (LTER)
Hurdal (ICOS)
Loobos (ICOS)
Site Name
the first ring of the LAI-2000 instrument (Macfarlane et al.,
2007).
We used the algorithm by Nobis and Hunziker (2005) to
threshold the majority of the DCP images. However, some
of the images were visibly overexposed, i.e., the 8 bit digital
numbers (DNs) of the background sky were 255, and parts of
64.256
60.086
59.754
56.098
39.138
60.372
52.167
Lat (◦ )
any portion of the sky were black (typically at 240–250 DN).
Next, a method based on mathematical image morphology
(Korhonen and Heikkinen, 2009) was applied to estimate the
Long (◦ )
foliage and crown cover fractions. In this method, black and
19.775
14.908
13.419
11.078
-8.333
17.48
5.744
white canopy images are processed with morphological clos-
ing and opening operations that are well known in digital im-
age processing (Gonzalez and Woods, 2002). As a result, a
Sampling date
filter for large gaps was obtained. When a tuning parame-
2019/08/23
2018/10/22
2016/07/16
2018/09/28
2016/10/08
2018/09/27
2018/08/13
ter (called the structuring element in image processing) was
set so that large gaps only occurred between individual tree
crowns (Korhonen and Heikkinen, 2009), the proportions of
gaps inside and between individual crowns could be calcu-
ASD FieldSpec Pro
ASD FieldSpec Pro
ASD FieldSpec Pro
Ocean Optics; FLAME-S-VIS-NIR-ES
Ocean Optics; FLAME-S-VIS-NIR-ES
Ocean Optics; FLAME-S-VIS-NIR-ES
Ocean Optics; FLAME-S-VIS-NIR-ES
Spectrometer model
lated.
2.3 Background signal retrieval method with EO data
The total reflectance of a pixel (R) results from the weighted
linear combination of reflectance values by the forest canopy,
forest background, and their sunlit and shaded components
(Li and Strahler, 1985; Chen et al., 2000; Bacour and Bréon,
2005; Chopping et al., 2008; Roujean et al., 1992) as follows:
R = kT RT + kG RG + kZT RZT + kZG RZG , (1)
which includes the reflectivities of the sunlit crowns (RT ),
Bilberry, lingonberry, and moss
Bilberry, lingonberry, and moss
and lichens
Ericaceous dwarf shrubs, mosses,
Continuous moss cover
lata
Vulpia bromoides, and Vulpia genicu-
Agrostis pourretii, Briza maxima,
Tolpis barbata Plantago coronopus,
Rumex acetosella, Tuberaria guttata,
seedlings
Vaccinium spec. and Norway spruce
Deschampsia flexuosa, and mosses
Prunus serotina, Vaccinium myrtillus,
Understory vegetation
sunlit understory (RG ), shaded crowns (RZT ), and shaded
understory (RZG ). RG marks the bidirectional reflectance
factor (BRF) of the target (understory). The kj are the pro-
portions of these components at the chosen viewing angle or
in the instantaneous field of view of the sensor at the given ir-
radiation geometry. Following Canisius and Chen (2007), we
derive the understory reflectivity (RG ) with the assumption
that the reflectivities of the overstory and understory at the
given illumination geometry differ little between the chosen
viewing angles. While the components may not fully meet
the definition of Lambertian reflectors (i.e., reflecting elec-
tromagnetic radiation equally in all directions), several pre-
Representative
RepresentativeJ. Pisek et al.: Retrieval and validation of forest background reflectivity 627
ration consists of the BRF at nadir (Rn = 0◦ ), with the solar
zenith angle (SZA) corresponding to the Sun’s position at
10:00 local time (LT) for given day and another zenith angle
(Ra = 40◦ ) with relative azimuth angle PHI = 130◦ . It can be
expressed by Eqs. (2) and (3) as follows:
Rn = kT n RT + kGn RG + kZT n RZT + kZGn RZG (2)
Ra = kT a RT + kGa RG + kZT a RZT + kZGa RZG . (3)
The proportions of the components (kj ) were obtained using
the four-scale model (Chen and Leblanc, 1997) with param-
Figure 2. (a) Relationship between available in situ estimates of
eters for generalized deciduous and coniferous tree stands as tree height (in meters) with Simard et al.’s (2011) estimate. (b) Re-
an input (see Table 2; Kuusk et al., 2013). The understory lationship between available in situ estimates of tree density (trees
reflectance at the desired wavelengths can be calculated by per hectare) with Crowther et al.’s (2015) estimates. DBF – decidu-
combining and solving Eqs. (2) and (3) and the insertion of ous broadleaf forest; EBF – evergreen broadleaf forest; DNF – de-
Rn and Ra estimates derived from appropriate EO data. The ciduous needleleaf forest; ENF – evergreen needleleaf forest; MF –
individual components (sunlit/shaded overstory and under- mixed forest.
story) cannot be resolved with the MODIS spatial resolution.
The reflectances of shaded tree crowns (RZT ) and understory
(RZG ) are related to sunlit ones via M as RZT = M ×RT and satellites over a 16 d period (Wang et al., 2018). The Julian
RZG = M × RG , where M = RZ /R for a reference target, date represents the ninth day of the 16 d retrieval period, and
which can be measured in the field or predetermined with the consequently, the observations are further weighted to esti-
four-scale model. Here, the same M is assumed for overstory mate the BRDF/albedo for that particular day of interest. The
trees and the understory. Based on his field work in Canadian MCD43A1 algorithm uses all high-quality observations that
boreal forests, White (1999) suggested that angularly con- adequately sample the viewing hemisphere to fit an appro-
stant, wavelength-dependent M values may be appropriate, priate semiempirical BRDF model (the RossThickLiSparse-
at least during the growing season. The input stand parame- Reciprocal model; Roujean et al., 1992; Lucht et al., 2000)
ters from Table 2 may not be always precisely known while for that location and date of interest. We computed the bidi-
retrieving the understory signal over larger areas. Figure 2 rectional reflectance factor (BRF) at the top of the canopy
shows the relationships between the available in situ data for with the isotropic parameter and two (volumetric and geo-
tree heights or tree densities over our study sites with the metric) kernel functions (Roujean et al., 1992) for MODIS
1 km2 resolution estimates from the global maps of Simard et band 1 (red – 620–670 nm) and band 2 (NIR – 841–876 nm).
al. (2011) and Crowther et al. (2015). The weak relationships We used the Ross and Li kernels to reconstruct the BRF val-
indicate the current unsuitability of the site-specific variable ues for required geometries (see Sect. 2.3) for each date, and
estimates of interest (tree height and tree density) from cur- then we derived the understory signal, using the formulas de-
rently available global maps at a given spatial resolution for scribed in Sect. 2.3. The associated data quality (MCD43A2)
our purpose. At the same time, the calculated mean values product was employed to assess the effect of the retrieval
for the tree heights of needleleaved (17.5 m) and broadleaved quality on the accuracy of the calculated understory signal.
tree stands (22.7 m) from Simard et al. (2011) over the study All MODIS data have been accessed and processed through
sites were reasonably close to our original generalized input the Google Earth Engine (Gorelick et al., 2017).
parameter values in Table 2. Following Gemmell (2000), we
opted to report a range of understory NDVI (NDVIu) val- 2.5 Spatial representativeness assessment of the
ues obtained with the combination of parameter values from validation sites
Table 2 for each site and date. Specifying the correct con-
straints (window) for background alone has been previously A method developed by Román et al. (2009), and refined by
found to greatly reduce the errors in the estimation of over- Wang et al. (2012, 2014, 2017) was adopted to evaluate the
story parameters (Gemmell, 2000). spatial representativeness of in situ measurements to assess
the uncertainties arising from a direct comparison between
2.4 MODIS BRDF data field-measured forest understory spectra and the correspond-
ing estimates with MODIS BRDF data. To characterize the
The MCD43A1 V6 bidirectional reflectance distribution spatial representativeness of a test site to represent a satel-
function and albedo (BRDF/albedo) model parameter data lite retrieval, this method uses three variogram model pa-
set is a 500 m gridded daily product. MCD43A1 is gener- rameters (the range, sill, and nugget), obtained by the anal-
ated by inverting multi-date, multi-angular, cloud-free, atmo- ysis of near-nadir surface reflectances from cloud-free 30 m
spherically corrected, and surface reflectance observations Landsat/Operational Land Imager (OLI) data (Román et al.,
acquired by MODIS instruments onboard the Terra and Aqua 2009) collected as close to the sampling date as possible.
https://doi.org/10.5194/bg-18-621-2021 Biogeosciences, 18, 621–635, 2021628 J. Pisek et al.: Retrieval and validation of forest background reflectivity
Table 2. Stand parameters for the four-scale model.
Stand Deciduous Coniferous
Stand density (trees ha−1 ) 500, 1000, and 2000 500, 1000, and 2000
Tree height (m) 25 16
Length of live crown (m) 9.2 4.2
Radius of crown projection (m) 1.87 1.5
Leaf area index (m2 m−2 ) 1, 2, and 3 1, 2, and 3
Figure 3. Shortwave BRF composites centered at ICOS sites of (a) Norunda in Sweden and (c) Wüstebach in Germany. (b, d) Variogram
estimators (points), spherical model results (dotted curves), and sample variances (solid straight lines) obtained over the sites with Operational
Land Imager (OLI) subsets and spatial elements of 0.275, 0.5, 1.0, 1.5, and 2 km as a function of the distance between observations. Variogram
legend explanations: a – variogram range; var – sample variance; c – variogram sill; c0 – nugget variance.
Where valid imagery was not available within a reasonable 0.5, 1, 1.5, and 2 km) to assess and illustrate the changes in
window of the sampling date, imagery from the correspond- spatial representativeness with different spatial resolutions.
ing season of a different year was used. As such, the analy-
sis was done to illustrate the representativeness of the tower
site with respect to a particular point in time. Campagnolo 3 Results and discussion
et al. (2016) showed that the effective spatial resolution of
500 m gridded MODIS BRDF product at mid-latitudes is 3.1 Spatial representativeness
around 833 × 618 m because of the varied footprints of the
source multi-angular surface reflectance observations. We Table 1 provides the assessment of spatial heterogeneity for
analyzed each site with five different spatial extents (0.275, all sites included in this study, using OLI subsets acquired
around the time of in situ measurements. The example re-
sults for the ICOS sites of Norunda (SE-Nor) in Sweden and
Biogeosciences, 18, 621–635, 2021 https://doi.org/10.5194/bg-18-621-2021J. Pisek et al.: Retrieval and validation of forest background reflectivity 629
Wüstebach (DE-RuW) in Germany, using three OLI subsets,
are shown in Fig. 3. The variogram functions with relevant
model parameters for the two sites are displayed in Fig. 3b
and d. The range corresponds to the value on the x axis where
the model flattens out. There is no further correlation of a
biophysical property associated with that point beyond the
range value. The sill is the ordinate value of the range. A
smaller sill value indicates a more homogenous surface (less
variation in surface reflectance). A surface can be considered
spatially representative with respect to the MODIS footprint
when the sill value is 0.5 km spatial resolution. over the study sites.
During late summer/early autumn of 2013, trees were almost
completely removed in an area of 9 ha west of the tower in or-
der to promote the natural regeneration of a near-natural de-
ciduous forest from a spruce monoculture forest. The clear- The understory dominated the overall signal of open
felling area can be seen in Fig. 3d. This action resulted in shrubland at the Cortes de Pallas (ES-CPa) site and the decid-
an increase in the spatial heterogeneity of this ICOS site. uous broadleaf forest site at Montiers (FR-MsS) during the
In situ measurements collected within the footprint of the leaf-off part of the season (Fig. 5). Both sites were found to
Wüstebach tower, thus, cannot be deemed fully comparable be spatially representative for comparison with MODIS foot-
with the retrievals with MODIS at a 500 m spatial resolution. print data at the time of the available in situ measurements
Overall, most of the sites were found representative at the (Table 1). There are only very few trees scattered across the
spatial resolution of MODIS BRDF gridded data. The non- Cortes de Pallas site, and ground vegetation is fully exposed.
representative cases and the effect on the understory signal Extremely low tree density does not match with any of the
retrieval and agreement with the corresponding in situ mea- original generalized input parameter values in Table 2, and
surements carried within the measurement footprint of the the predicted understory signal does not match well with the
individual towers are further discussed in Sect. 3.2 and 3.3. in situ measurements. In situ measurements at Montiers were
Román et al. (2009) provide further details on the assessment carried out during the leaf-off part of the season, which al-
of spatial representativeness, using a set of four geostatistical lowed a full exposure of the understory. Despite this, the
attributes derived from semivariograms. predicted understory NDVI range from the MODIS data did
not overlap with the in situ measurements at Montiers at
3.2 NDVI ranges all. However, the MODIS BRDF values for these sites were
marked with lower data quality flags (QA >1), which cor-
There is only a weak relationship between the total (over- rectly signals a decrease in accuracy in the calculations of
story and understory) NDVI signal retrieved with MODIS the understory reflectance as well. Overall, our results con-
BRDF data and corresponding in situ understory NDVI mea- firm that, under conditions of very low tree density/leaf-off
surements (R 2 = 0.19; Fig. 4). Total NDVI values alone do conditions, the understory signal can be assumed to be iden-
not allow one to disentangle the correct understory signal. tical to the total scene NDVI.
In contrast, our retrieval method could track the understory The performance of the method turns out to be limited
signal dynamics over a broad NDVI range (Fig. 5). The pre- over sites with a closed canopy, such as Bílý Kříž (CZ-
dicted understory NDVI ranges were beyond the uncertainty BK1), Hesse (FR-Hes), or Vielsalm (BE-Vie; Fig. 5). This
limits of in situ understory measurements (corresponding to is because the shadowing effect makes diffuse scattering the
± 1 standard deviation (SD) here) in less than 15 % of cases. dominant mechanism in such stands, and the understory car-
These sites with poor retrievals were carefully investigated ries only a negligible influence on the top-of-canopy signal.
to identify the issues precluding good results. Below, we fo- Bosco Fontana (IT-BFt) is another broadleaf forest site with
cus on a discussion of results where the predicted and in situ very high foliage cover (FC = 0.91), yet the predicted under-
measured NDVI ranges of the understory layer did not agree. story NDVI range entirely overlaps with the collected in situ
values. It should be noted that, in contrast to other sites with
https://doi.org/10.5194/bg-18-621-2021 Biogeosciences, 18, 621–635, 2021630 J. Pisek et al.: Retrieval and validation of forest background reflectivity
closed canopies, Bosco Fontana has very dense vegetation
throughout the full vertical profile, and no clear distinction
between overstory and understory can be made. Our results
(Fig. 5) indicate that, in general, a reliable, independent re-
trieval of understory signal is not possible if the foliage cover
exceeds 85 %.
MODIS BRDF data were of the best quality in the case of
Font Blanche site (FR-FBn). The canopy here was also rela-
tively open (FC = 0.18), yet the predicted understory NDVI
range was higher than the lower NDVI captured by the in situ
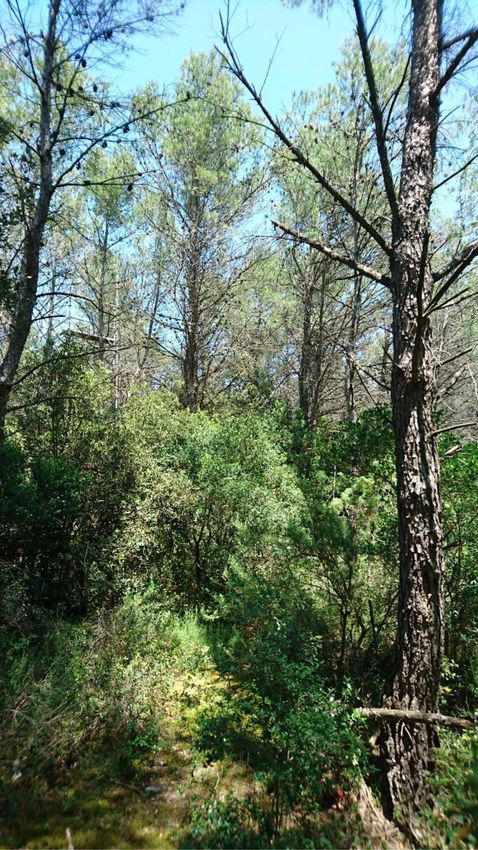
understory measurements. The Font Blanche site has a dense
intermediate layer dominated by juvenile holm oaks (Quer-
cus ilex L.) with a mean height of 6 m (Fig. 7). Although the
site was deemed spatially homogeneous at MODIS footprint
scale (Table 2), the tall, dense layer made it impossible to ob-
tain truly representative in situ measurements of understory
reflectance. A similar situation with a tall shrub layer and,
thus, a mismatch between the available in situ measurements
and the predicted range of understory NDVI values was also
encountered at another pine-dominated, spatially homoge-
neous site at Loobos (NL-Loo). Under such conditions, the
understory NDVI values retrieved with EO data might actu-
ally provide a more complete picture of understory condition.
MODIS BRDF data were also of the best quality over
the Coruche (PT-Cor) site, with a very open canopy (FC =
0.272). Such a scenario should be optimal for the understory
signal retrieval, yet the in situ measured NDVI of the un-
derstory is still higher than the predicted range with MODIS
BRDF data. This disagreement appears to be caused by the
presence of a water reservoir within the footprint of the
MODIS pixel overlapping this site, which has contributed to
lower reflectance in the red and NIR part of the spectrum.
The water surface was not sampled during in situ measure-
ments. A similar effect due to a nearby lake can be also ob-
served in the case of the Hurdal (NO-Hur) site.
As discussed in Sect. 2.5, clear felling was carried near
the Wüstebach (DE-RuW) tower in 2013. Our assessment of
site homogeneity showed that the site cannot be considered
spatially homogeneous at the gridded 500 m spatial resolu-
tion of MODIS pixels (Fig. 3d). The clear-felling action ex-
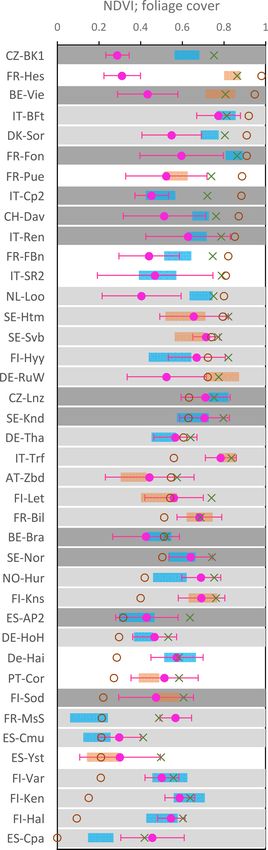
Figure 5. Estimated understory NDVI (NDVIu) ranges for se- posed the understory and encouraged the growth, resulting
lected days (see Sect. 2.3 for how the ranges are obtained; blue in an overlap of the total and retrieved understory signal by
bars – site-representative retrievals; orange bars – possible non-site- MODIS BRDF data. In situ measurements carried within the
representative retrievals), in situ measurements (mean ±1 standard still-forested part of the site around the tower, with greater
deviation (SD) shown in purple), and computed nadir total (un- canopy closure, resulted in lower understory NDVI values.
derstory and overstory) NDVI values from MODIS BRDF/albedo The Wüstebach site illustrates the importance of taking into
data (green crosses). The fraction of foliage cover is shown with account the spatial heterogeneity of a given site while com-
brown open circles. MODIS BRDF parameters with lower quality paring in situ measurements with EO observations at the
flags are indicated with light gray (QA = 1) or dark gray (QA >1)
corresponding scale. The proposed framework by Román et
bars. QA = 0 – best quality with full inversion; QA = 1 good quality
al. (2009) and Wang et al. (2017), using semivariograms, is
with full inversion (including the cases with no clear-sky observa-
tions over the day of interest and those with a solar zenith angle an efficient tool for evaluating site spatial representativeness.
>70◦ ); QA >1 – lower quality magnitude inversion, using archety- In summary, while the understory retrieval algorithm was
pal BRDF shapes (for details please see Schaaf et al., 2002). originally developed for conditions within the boreal region
forests (Canisius and Chen, 2007), Fig. 5 suggests encourag-
ing the performance of the retrieval algorithm over a much
Biogeosciences, 18, 621–635, 2021 https://doi.org/10.5194/bg-18-621-2021J. Pisek et al.: Retrieval and validation of forest background reflectivity 631 wider range of different forest sites. Reliable retrievals of forest understory appear to be feasible, while taking into ac- count the limitations due to site heterogeneity, foliage cover, and input data quality. 3.3 Seasonal courses Figure 6 offers the overview of the seasonal dynamics of un- derstory for six select sites over the full latitudinal range (67– 38◦ N) across Europe. The Station for Measuring Ecosystem–Atmosphere Rela- tions (SMEAR) in Värriö (FI-Var), located in northern Fin- land (67◦ 460 N, 29◦ 350 E), represents a subarctic climate regime near the northern timberline. This site experiences very rapid increases in NDVI values at the beginning of the growing season (Fig. 6a). This is linked with the dis- appearance of snow and the exposure of the underlying un- derstory vegetation, which predominantly consists of moss and lichen. The overstory coverage by Scots pine trees is sparse, and the overall NDVI signal fluctuations during the year are governed by the understory layer. This site is also often covered with clouds, which prevents the acquisition of large number of good quality MODIS observations. How- ever, in situ understory NDVI measurements fall within the Figure 6. Seasonal courses of estimated understory NDVI (NDVIu) predicted NDVI range when the MODIS data were acquired ranges (blue bars – site-representative retrievals; orange bars – pos- early in the growing season (day of year (DOY) 165), even sible non-site-representative retrievals), nadir total (understory and despite the lower quality of the MODIS data (QA = 1). No overstory) NDVI values from MODIS BRDF/albedo data (green MODIS observations can be made of this site after DOY 259, lines), and in situ measurements (mean ±1 SD shown in purple) due to an insufficient amount of light. over selected study sites. Gray bars mark MODIS BRDF parameters The forest floor is mainly covered by moss at Norunda with lower quality flags (light gray – QA = 1; dark gray – QA >1). (SE-Nor) as well. While understory NDVI values reach sim- Black bars indicate where no data are available. ilar values in summer at both sites (Fig. 6a–b), the snow disappears earlier at Norunda, which results in an earlier onset of higher understory NDVI values. In situ measure- erage was a mixture of litter and sprouting green understory. ments fit very well within the predicted range with MODIS Later on, the Hainich test site quickly develops an overstory data on DOY 295. While Värriö has a higher tree density layer with LAI values reaching up to 5 (Pinty et al., 2011). (748 trees ha−1 ) than Norunda (600 trees ha−1 ), Norunda, Such a dense layer would prevent the retrieval of true un- dominated with Norway spruce trees, has much higher fo- derstory signal with our methodology. This is confirmed by liage cover (FC; FC = 0.5 at Norunda compared to FC = the unrealistic, very close agreement between the very high 0.21 at Värriö). The understory signal contribution is smaller, NDVI values (NDVI ∼ 0.9) obtained from the total and un- and the total NDVI is higher at Norunda. The Norunda site derstory signal at the Hainich test site during the peak of provides yet another excellent demonstration of the influ- growing season (Fig. 6c). However, this shortcoming would ence of MODIS data quality on the understory NDVI re- be mitigated by the fact that, in such cases, the understory trievals as well. There was a repeated unrealistic fluctuation may be negligible in terms of LAI and overall contribution of understory NDVI values with the period of DOY 229–260 to the total signal. (Fig. 6b). The MODIS BRDF data during that period were A clear difference can be observed between the total and marked with lower data quality flags (QA >1). understory NDVI values at Font Blanche (FR-FBn) for most Very good agreement is observed among in situ mea- of the growing season (Fig. 6d). The site is composed of surements, understory, and total NDVI signal from MODIS an overstory top stratum (13 m) dominated by Aleppo pines (Fig. 6c) at Hainich (DE-Hai) at the beginning of the grow- (Pinus halepensis Mill), an intermediate stratum (6 m) dom- ing season (DOY = 102). The site is dominated by deciduous inated by holm oaks (Quercus ilex L.), and a shrub stratum beech trees, which were leafless when the in situ measure- (Simioni et al., 2020). Rainfall occurs mainly during autumn ments were taken. This allowed a full exposure of the under- and winter, with about 75 % falling between September and story, which dominated the total reflectance signal from the April. The higher NDVIu values derived from the MODIS stand during that moment in the season. The understory cov- BRDF data during the period DOY 120–160 may be treated https://doi.org/10.5194/bg-18-621-2021 Biogeosciences, 18, 621–635, 2021
632                                                  J. Pisek et al.: Retrieval and validation of forest background reflectivity

                                                                    ure 6f confirms that, in such situations, the retrieval method
                                                                    cannot provide a correct, independent estimation of the un-
                                                                    derstory signal. At the same time, it should be noted that, for
                                                                    closed canopies, the understory signal (or lack of informa-
                                                                    tion about it) is not critical for the retrieval of biophysical
                                                                    properties of prime interest, i.e. LAI and fAPAR of the up-
                                                                    per forest canopy layer with remote sensing (Garrigues et al.,
                                                                    2008; Weiss et al., 2014).

                                                                    4   Conclusions

                                                                    We report on the performance of a physically based ap-
                                                                    proach for estimating understory NDVI from daily MODIS
                                                                    BRDF/albedo data, at a 500 m gridded spatial resolution,
                                                                    over the extended network of the Integrated Carbon Ob-
                                                                    serving System (ICOS) forest ecosystem sites, distributed
                                                                    along wide latitudinal and elevational ranges (68–38◦ N, 12–
                                                                    1864 m above sea level – a.s.l.) across Europe. The analysis
                                                                    corresponds to a Stage 1 validation, as defined by the CEOS
                                                                    (Nightingale et al., 2011; Weiss et al., 2014). The method
                                                                    can deliver reasonable retrievals over different forest types
                                                                    with canopies that have a foliage cover that does not exceed
                                                                    85 %. The performance of the method was found to be lim-
                                                                    ited over forests with closed canopies (high foliage cover),
                                                                    where the signal from understory is much attenuated. Our re-
                                                                    sults illustrate the importance of considering both the spatial
Figure 7. Foliage stratification between overstory and understory   heterogeneity of the field site and the limitations and doc-
bushes at the ICOS site of Font Blanche in southeastern France.     umented quality of the MODIS BRDF product. The results
Please note that the understory in situ measurements reported in
                                                                    from the in situ measurements of the understory layer can
Fig. 6 did not include the tall (h>2 m) bushes located under the
                                                                    be valuable, in and of themselves, as sources of information
Pinus-halepensis-dominated overstory.
                                                                    over the wide array of forest understory conditions contained
                                                                    within the tower footprints of individual ICOS forest ecosys-
                                                                    tem sites and serve as an input for the improved modeling of
with caution due to the more frequent flagging of the MODIS
                                                                    local carbon and energy fluxes.
inputs with lower data quality flags (Fig. 6d). Even lower
understory NDVI values (NDVIu range – 0.15–0.35) occur
at another site with a Mediterranean-type climate, namely           Data availability. The in situ data set is available from https:
Yeste in Spain (Fig. 6e). The seasonal course of NDVI values        //data.mendeley.com/datasets/m97y3kbvt8/1 (Pisek, 2021, last ac-
here, with a low variation, is quite similar to Font Blanche.       cess: 25 January 2021). The MCD43A1 V6 bidirectional re-
The increase in understory NDVI values in the autumn from           flectance distribution function and albedo (BRDF/albedo) data
DOY 288 is linked with the onset of the rainfall period.            product (https://lpdaac.usgs.gov/products/mcd43a1v006/, Schaaf
   As illustrated above, given the high quality of MODIS            and Wang, 2021a, Land Processes Distributed Active Archive Cen-
BRDF data, the understory signal retrieval method performs          ter – LP DAAC; last access: 25 January 2021) and the asso-
well with forests with an open canopy. However, it is not           ciated data quality (MCD43A2) product (https://lpdaac.usgs.gov/
quite possible to separate the understory signal in closed          products/mcd43a2v006/, Schaaf and Wang, 2021b, LP DAAC, last
canopies. There is an obvious disagreement between avail-           access: 25 January 2021) were acquired through the Google Earth
                                                                    Engine platform.
able in situ measurements and the predicted understory
NDVI range at Hesse (FR-Hes; Fig. 6f), which could be only
partly explained by the insufficient spatial homogeneity of
                                                                    Author contributions. JP conceived the project, collected data, ran
the site at the MODIS pixel footprint (Table 2). Hesse has
                                                                    the data analysis and interpretation, and led the writing of paper. AE
a high foliage cover (FC = 0.98), LAI up to 7, and tall trees       and CS carried out the spatial representativeness analysis. LK ana-
(h>23 m). The understory would then have a negligible in-           lyzed the forest canopy cover/closure analysis. NH helped with the
fluence on the top-of-canopy signal. The visibility and contri-     field collection at Hohes Holz. PL helped with the field collection
bution of the understory signal also diminishes even further        at Bílý Kříž. JP wrote the original draft, which was reviewed and
at off-nadir viewing directions (Rautiainen et al., 2008). Fig-     edited by TB, AC, EC, MC, AE, SF, GG, TG, MH, NH, AI, AK,

Biogeosciences, 18, 621–635, 2021                                                         https://doi.org/10.5194/bg-18-621-2021
J. Pisek et al.: Retrieval and validation of forest background reflectivity 633
JK, BK, HL, LL, J-ML, FRLS, DL, PL, LL, RM, MM, LM, JN, Chopping, M., Moisen, G. G., Su, L. H., Laliberte, A., Rango, A.,
MP, CR, ER, MS-R, CS, MS, GS, KS, and CV. (Authors after LK Martonchik, J. V., and Peters, D. P. C.: Large area mapping of
are listed in alphabetic order.) southwestern crown cover, canopy height, and biomass using the
NASA Multiangle Imaging Spectro-Radiometer, Remote Sens.
Environ., 112, 2051–2063, 2008.
Competing interests. The authors declare that they have no conflict Clark, D. A., Brown, S., Kicklighter, D. W., Chambers, J. Q., Thom-
of interest. linson, J. R., and Ni, J.: Measuring net primary production in
forests: concepts and field methods, Ecol. Appl., 11, 356–370,
2001.
Acknowledgements. This study was supported by the Estonian Crowther, T. W., Glick, H. B., Covey, K. R., Bettigole, C., May-
Research Council (grant no. PUT1355) and the Mobilitas Pluss nard, D. S., Thomas, S. M., Smith, J. R., Hintler, G., Duguid,
MOBERC11 program. This research (field campaigns at Brass- M. C., Amatulli, G., Tuanmu, M. N., Jetz, W., Salas, C., Stam,
chaat, Kindla, Zoebelboden, and Machuqueira do Grou/LTsER C., Piotto, D., Tavani, R., Green, S., Bruce, G., Williams, S. J.,
Montado platform) was cofunded by the Transnational Access Wiser, S. K., Huber, M. O., Hengeveld, G. M., Nabuurs, G. J.,
scheme of eLTER (Horizon 2020 project; grant no. 654359). We Tikhonova, E., Borchardt, P., Li, C. F., Powrie, L. W., Fischer,
acknowledge ICOS Sweden, cofunded by the Swedish Research M., Hemp, A., Homeier, J., Cho, P., Vibrans, A. C., Umunay,
Council (SRC; grant no. 2015-06020), for providing measurement P.M., Piao, S. L., Rowe, C. W., Ashton, M. S., Crane, P. R., and
facilities and experimental support. The MODIS BRDF data are Bradford, M. A.: Mapping tree density at a global scale, Nature,
supported by NASA (grant no. 80NSSC18K0642). We thank the 525, 201–205, 2015.
anonymous reviewer and Alexei Lyapustin for the constructive Deering, D. W., Eck, T. F., and Banerjee, B.: Characterization of the
comments that helped to improve the paper. reflectance anisotropy of three boreal forest canopies in spring–
summer, Remote Sens. Environ., 67, 205–229, 1999.
Garrigues, S., Lacaze, R., Baret, F., Morisette, J. T., Weiss, M.,
Nickeson, J. E., Fernandes, R., Plummer, S., Shabanov, N.
Financial support. This research has been supported by the
V., Myneni, R. B., Knyazikhin, Y., and Yang, W.: Validation
Eesti Teadusagentuur (grant nos. PUT1355 and Mobilitas Pluss
and intercomparison of global leaf area index products de-
MOBERC11), Horizon 2020 (grant no. eLTER 654359), the
rived from remote sensing data, J. Geophys. Res., 113, G02028,
Swedish Research Council (grant no. 2015-06020), and NASA
https://doi.org/10.1029/2007JG000635, 2008.
(grant no. 80NSSC18K0642).
Gemmell, F.: Testing the utility of multi-angle spectral data for re-
ducing the effects of background spectral variations in forest re-
flectance model inversion, Remote Sens. Environ., 72, 46–63,
Review statement. This paper was edited by Paul Stoy and re- 2000.
viewed by Alexei Lyapustin and one anonymous referee. Gielen, B., de Beeck, M. O., Loustau, D., Ceulemans, R., Jor-
dan, A., and Papale, D.: Integrated Carbon Observation Sys-
tem (ICOS): An Infrastructure to Monitor the European Green-
house Gas Balance, in: Terrestrial Ecosystem Research Infras-
References tructures: Challenges and Opportunities, CRC press, Boca Raton,
FL, USA, 505–520, 2017.
Bacour, C. and Bréon, F. M.: Variability of biome reflectance direc- Gonzalez, R. C. and Woods, R. E.: Digital Image Processing, 2nd
tional signatures as seen by POLDER, Remote Sens. Environ., Edn., Prentice Hall, Upper Saddle River (NJ), 793 pp., 2002.
98, 80–95, 2005. Gorelick, N., Hancher, M., Dixon, M., Ilyushchenko, S., Thau, D.,
Baret, F., Morisette, J. T., Fernandes, R. A., Champeaux, J. L., and Moore, R.: Google earth engine: planetary-scale geospatial
Myneni, R. B., Chen, J., Plummer, S., Weiss, M., Bacour, C., analysis for everyone, Remote Sens. Environ., 202, 18–27, 2017.
Garrigues, S., and Nickeson, J. E.: Evaluation of the represen- Gschwantner, T., Schadauer, K., Vidal, C., Lanz, A., Tomppo, E.,
tativeness of networks of sites for the global validation and in- di Cosmo, L., Robert, N., Englert Duursma, D., and Lawrence,
tercomparison of land biophysical products: Proposition of the M.: Common tree definitions for national forest inventories in
CEOSBELMANIP, IEEE T. Geosci. Remote Sens., 44, 1794– Europe, Silva Fennica, 43, 303–321, 2009.
1803, 2006. Jiao, T., Liu, R., Liu, Y., Pisek, J., and Chen, J. M.: Mapping global
Campagnolo, M. L., Sun, Q., Liu, Y., Schaaf, C., Wang, Z., and seasonal forest background reflectivity with Multi-angle Imaging
Román, M. O.: Estimating the effective spatial resolution of Spectroradiometer data, J. Geophys. Res.-Biogeo., 119, 1063–
the operational BRDF, albedo, andnadir reflectance products 1077, 2014.
from MODIS and VIIRS, Remote Sens. Environ., 175, 52–64, Kim, D., Oren, R., and Qian, S. S.: Response to CO2 enrichment
https://doi.org/10.1016/j.rse.2015.12.033, 2016. of understory vegetation in the shade of forests, Glob. Change
Canisius, F. and Chen, J. M.: Retrieving forest background re- Biol., 22, 944–956, https://doi.org/10.1111/gcb.13126, 2016.
flectance in a boreal region from Multi-angle Imaging Spectro- Korhonen, L. and Heikkinen, J.: Automated analysis of in situ
Radiometer (MISR) data, Remote Sens. Environ., 107, 312–321, canopy images for the estimation of forest canopy cover, Forest
2007. Sci., 55, 323–334, 2009.
Chen, J. M., Li, X., Nilson, T., and Strahler, A.: Recent advances in Kuusk, A., Lang, M., and Kuusk, J.: Database of optical and struc-
geometrical optical modeling and its applications, Remote Sens. tural data for the validation of forest radiative transfer models, in:
Rev., 18, 227–262, 2000.
https://doi.org/10.5194/bg-18-621-2021 Biogeosciences, 18, 621–635, 2021634 J. Pisek et al.: Retrieval and validation of forest background reflectivity
Radiative transfer and optical properties of atmosphere and un- shrubs, lichen and moss, Remote Sens. Environ., 94, 343–354,
derlying surface, edited by: Kokhanovsky, A. A., Light Scatter- 2005.
ing Reviews, Berlin, Germany, Springer, Vol. 7, 109–148, 2013. Pinty, B., Jung, M., Kaminski, T., Lavergne, T., Mund, M., Plum-
Kuusk, A., Kuusk, J., and Lang, M.: Measured spectral bidirectional mer, S., Thomas, E., and Widlowski, J.-L.: Evaluation of the
reflection properties of three mature hemiboreal forests, Agr. For- JRC-TIP 0.01◦ products over a mid-latitude deciduous forest
est Meteorol., 185, 14–19, 2014. site, Remote Sens. Environ., 115, 3567–3581, 2011.
Law, B. E., Van Tuyl, S., Cescatti, A., and Baldocchi, D. D.: Esti- Pisek, J.: Dataset of understory reflectance measurements
mation of leaf area index in open-canopy ponderosa pine forests across 40 ICOS Research Infrastructure and other for-
at different successional stages and management regimes in Ore- est ecosystem sites in Europe, Mendeley Data, V1,
gon., Agr. Forest Meteorol., 108, 1–14, 2001. https://doi.org/10.17632/m97y3kbvt8.1, 2021.
Li, X. and Strahler, A.: Geometric-optical modelling of a conifer Pisek, J. and Chen, J. M.: Mapping forest background reflectivity
forest canopy, IEEE T.n Geosci. Remote Sens., 23, 207–221, over North America with multi-angle imaging spectroradiometer
1985. (MISR) data, Remote Sens. Environ., 113, 2412–2423, 2009.
Lucht, W., Schaaf, C. B., and Strahler, A. H.: An Algorithm for Pisek, J., Chen, J. M., Miller, J. R., Freemantle, J. R., Peltoniemi, J.
the retrieval of albedo from space using semiempirical BRDF I., and Simic, A.: Mapping forest background reflectance in a bo-
models, IEEE T. Geosci. Remote Sens., 38, 977–998, 2000. real region using multi-angle Compact Airborne Spectrographic
Luyssaert, S. , Inglima, I., Jung, M., Richardson, A. D., Reich- Imager (CASI) data, IEEE T. Geosci. Remote Sens., 48, 499–
stein, M., Papale, D., Piao, S. L., Schulze, E. D., Wingate, L., 510, 2010.
Matteucci, G., Aragao, L., Aubinet, M., Beer, C., Bernhofer, C., Pisek, J., Rautiainen, M., Heiskanen, J., and Mõttus, M.: Retrieval
Black, K. G., Bonal, D., Bonnefond, J.M., Chambers, J., Ciais, of seasonal dynamics of forest understory reflectance in a North-
P., Cook, B., Davis, K. J., Dolman, A.J., Gielen, B., Goulden, ern European boreal forest from MODIS BRDF data, Remote
M., Grace, J., Granier, A., Grelle, A., Griffis, T., Gruenwald, Sens. Environ., 117, 464–468, 2012.
T., Guidolotti, G., Hanson, P. J., Harding, R., Hollinger, D. Y., Pisek, J., Lang, M., and Kuusk, J.: A note on suitable viewing
Hutyra, L. R., Kolari, P., Kruijt, B., Kutsch, W., Lagergren, F., configuration for retrieval of forest understory reflectance from
and Laurila, T.: CO2 balance of boreal, temperate, and tropical multi-angle remote sensing data, Remote Sens. Environ., 156,
forests derived from a global database, Glob. Change Biol., 13, 242–246, 2015a.
2509–2537, 2007. Pisek, J., Rautiainen, M., Nikopensius, M., and Raabe K.: Estima-
Macfarlane, C., Hoffman, M., Eamus, D., Kerp, N., Higginson, S., tion of seasonal dynamics of understory NDVI in northern forests
McMurtrie, R., and Adams, M.: Estimation of leaf area index in using MODIS BRDF data: Semi-empirical versus physically-
eucalypt forest using digital photography, Agr. Forest Meteorol., based approach, Remote Sens. Environ., 163, 42–47, 2015b.
143, 176–188, 2007. Pisek, J., Chen, J. M., Kobayashi, H., Rautiainen, M., Schaepman,
Marques, M. C. M. and Oliveira, P. E. A. M.: Phenology of canopy M. E., Karnieli, A., Sprintsin, M., Ryu, Y., Nikopensius, M., and
and understory species of two Coastal Plain Forests in Southern Raabe, K.: Retrieval of seasonal dynamics of forest understory
Brazil, Braz. J. Bot., 27, 713–723, https://doi.org/10.1590/s0100- reflectance from semiarid to boreal forests using MODIS BRDF
84042004000400011, 2004. data, J. Geophys. Res.-Biogeo., 121, 855–863, 2016.
McDonald, A. J., Gemmell, F. M., and Lewis, P. E.: Investigation of Rautiainen, M., Lang, M., Mõttus, M., Kuusk, A., Nilson, T., Ku-
the utility of spectral vegetation indices for determining informa- usk, J., and Lükk, T.: Multi-angular reflectance properties of a
tion on coniferous forests, Remote Sens. Environ., 66, 250–272, hemiboreal forest: an analysis using CHRIS PROBA data, Re-
1998. mote Sens. Environ., 112, 2627–2642, 2008.
Miller, J., White, P., Chen, J., Peddle, D., McDemid, G., Rautiainen, M., Mõttus, M., Heiskanen, J., Akujärvi, A., Majasalmi,
Fournier, R., Sheperd, P., Rubinstein, I., Freemantle, J., Sof- T., and Stenberg, P.: Seasonal reflectance dynamics of common
fer, R., and LeDrew, E.: Seasonal change in the under- understory types in a northern European boreal forest, Remote
story reflectance of boreal forests and influence on canopy Sens. Environ., 115, 3020–3028, 2011.
vegetation indices, J. Geophys. Res., 102, 29475–29482, Rentch, J. S., Fajvan, M. A., and Hicks, R. R.: Oak establishment
https://doi.org/10.1029/97JD02558, 1997. and canopy accession strategies in five old-growth stands in the
Nightingale, J., Schaepman-Strub, G., Nickeson, J., and Leads, L. central hardwood forest region, Forest Ecol. Manage., 184, 285–
F. A.: Assessing satellite-derived land product quality for earth 297, https://doi.org/10.1016/s0378-1127(03)00155-5, 2003.
system science applications: overview of the CEOS LPV sub- Román, M. O., Schaaf, C. B., Woodcock, C. E., Strahler, A. H.,
group, in: Proceedings of the 34th International Symposium on Yang, X., Braswell, R. H.,Curtis, P. S., Davis, K. J., Drag-
Remote Sensing of Environment, Sydney, NSW, Australia, 10– oni, D., and Goulden, M. L.: The MODIS (CollectionV005)
15 April 2011. BRDF/albedo product: assessment of spatial representativeness
Nobis, M. and Hunziker, U.: Automatic threshold- overforested landscapes, Remote Sens. Environ., 113, 2476–
ing for hemispherical canopy-photographs based on 2498, https://doi.org/10.1016/j.rse.2009.07.009, 2009.
edge detection, Agr. Forest Meteorol., 128, 243–250, Roujean, J.-L., Leroy, M., and Deschamps, P. Y.: A bi-directional
https://doi.org/10.1016/j.agrformet.2004.10.002, 2005. reflectance model of the Earth’s surface for the correction
Peltoniemi, J. I., Kaasalainen, S., Näränen, J., Rautiainen, M., Sten- of remote sensing data, J. Geophys. Res., 97, 20455–20468,
berg, P., Smolander, H., Smolander, S., and Voipio, O.: BRDF https://doi.org/10.1029/92JD01411, 1992.
measurement of understory vegetation in pine forests: Dwarf Rouse, W. J., Haas Jr., H. R., Schell, A. J., and Deering, W. D.:
Monitoring vegetation systems in the Great Plains with ERTS, in
Biogeosciences, 18, 621–635, 2021 https://doi.org/10.5194/bg-18-621-2021You can also read